Article

Carbon Emission Reduction Effects of the Smart City Pilot Policy in China

School of Economics and Management, Anhui Polytechnic University, Wuhu 241000, China
*
Author to whom correspondence should be addressed.
Sustainability 2023, 15(6), 5085; https://doi.org/10.3390/su15065085
Submission received: 18 January 2023 / Revised: 21 February 2023 / Accepted: 27 February 2023 / Published: 13 March 2023

Abstract

:
Carbon emission reduction is an important goal of China’s sustainable economic development. As a new urbanization construction model, the importance of smart city construction for economic growth and innovation is recognized by the academic community. The impact of smart cities on the environment, especially on carbon emission reductions, has yet to be verified. This has implications for the green and low-carbon transformation of China, the realization of the peak carbon and carbon neutrality goals and the effectiveness of smart city pilot policies. For these reasons, this paper utilizes China’s urban panel data, and using the difference-in-difference method, investigates the smart city pilot policy as a quasi-natural experiment of new urbanization construction and its impact on urban carbon emission reductions. The results are summarized as follows: (1) Smart city construction has reduced the carbon emissions of pilot cities by about 4.36% compared with non-pilot cities. (2) The dynamic impact analysis found that the carbon emission reduction effect of smart city construction tends not to be effective until the third year of the implementation of the policy, that the policy effect gradually increases over time, and that its carbon emission reduction dividend has a long-term sustainability. (3) The analysis of the influence mechanisms determined that smart city construction mainly promotes urban carbon emission reduction through three paths, including improving technology innovation capacity, enhancing the attraction of foreign direct investment, and accelerating the upgrading of industrial structure. (4) The heterogeneity analysis indicates that smart city construction has stronger carbon emission reduction effects in the “two control zones”, non-old industrial bases and non-resource-based cities.

1. Introduction

The global warming caused by the tremendous increase in carbon emissions has become a major environmental problem for all countries in the world, which not only destroys the balance of ecosystems but also endangers human life and health. As the largest developing country and carbon dioxide emitter in the world, China has always assumed responsibility in global environmental governance and actively transformed into a low-carbon economy. In September 2020, China promised to achieve peak carbon and carbon neutrality by 2030 and 2060, respectively. In this context, carbon emissions have become a particularly urgent problem to be tackled.
The key to energy conservation and emission reduction lies in the cities, where human economic activities are concentrated and account for nearly 85% of the total carbon emissions [1,2,3]. The rapid urbanization process is regarded as a significant burden on the urban environment [4]. Currently, the development model of Chinese cities is in urgent need of shifting from being gross regional product (GDP)-oriented to low-carbon-oriented. In this regard, China has been actively carrying out various policy pilots and practices for sustainable development.
In order to control urban carbon emissions, the Chinese government has issued many environmental and regional policies to alleviate the contradiction between economic growth and carbon emissions. These policies include a low carbon city pilot policy, a carbon emission trading pilot policy, a low carbon industrial-park pilot policy, a regional collaborative governance policy, an environmental supervision policy, an innovative pilot city policy, etc. At the same time, scholars have conducted more in-depth discussions on the carbon emission control effects of these environmental policies (Khanna et al., 2014 [5]; Clarkson et al., 2015 [6]; Scott, Carter, 2019 [7]; Thi et al., 2022 [8]; Liu et al., 2022 [9]; and Liu et al., 2022 [10]). Unfortunately, the existing research has not paid sufficient attention to the possible positive impacts of smart city construction, which is a regional policy, on urban carbon emission reduction, which provides a valuable opportunity for this study.
The smart city is a new urban development model that combines the Internet and modern information technology with urbanization to promote urban development that is factor-driven, investment-driven, and innovation-driven. It focuses on the quality of development; adheres to the concept of ecological urban design and construction; relies on the internet of things, big data, blockchain, cloud computing, and other information technologies; and emphasizes the comprehensive and sustainable development of the economy, society, and environment through a people-oriented approach. The smart city concept was first defined as the application of information and communications technologies [11] and was described as a sustainable city [12]. In the last several years, smart cities have been considered as an essential path to sustainable development [13].
In order to better promote smart city construction, the Ministry of Housing and Urban Rural Development of China announced the official launch of the national smart city pilot project in December 2012. This policy aims to comprehensively apply the internet of things, cloud computing, and other information technologies; realize the application of the interconnection of everything and intelligent integration; improve cities’ sustainable innovation capability; and accelerate the construction of smart cities.
The smart city pilot policy is a new model to accelerate sustainable socioeconomic development [14]. To date, China has launched three batches of smart city pilot projects. However, questions whether the smart city pilot policy can alleviate high carbon emissions in China and how it can drive carbon emission reductions remain. With the peak carbon and carbon neutrality goals listed as China’s priorities, the impact of the smart city pilot policy on carbon emissions is worth studying.
In this context, this paper takes China’s smart city pilot policy as a quasi-natural experiment to measure the construction of smart cities, to examine the effects of smart city construction on carbon emission reductions through the difference-in-difference (DID) method, and to explore the influence mechanisms with the further investigation of heterogeneous influences. The scientific answers to these questions will help comprehensively evaluate the implementation of China’s smart city pilot policy, improve the environmental governance capacity of smart cities, and facilitate high-quality urban development.
The novel aspects of this paper consist of the following three areas: First, smart city construction, which is a new urban development model, is taken as the starting point of this study, and the impact of smart city construction on carbon emissions is discussed in depth, thereby advancing the theory of new urbanization. Second, in terms of carbon emissions control, the evaluation of the policy of smart city construction enriches the research on the relationship between the digital economy and the environment, highlights the factors influencing carbon emissions control, defines the paths to realizing the peak carbon and carbon neutrality goals, and stimulates theoretical and practical research on the digital economy. Third, in terms of research methods, the implementation of China’s smart city pilot policy is regarded as a quasi-natural experiment in smart city construction and the new urbanization construction, which could avoid the measurement errors and possible endogenous problems caused by urbanization only measured by indicators. Therefore, it is possible to identify the causal effects of smart city construction, expand the application space of the difference-in-difference method, and promote the detailed application of policy evaluation methods more accurately. Fourth, this paper explores in depth the impact mechanisms of smart city construction on carbon emission reductions, clarifies the critical reasons for the positive impacts, better links smart city construction principles to environmental governance advantages, and enriches the theoretical relationship between smart city construction and carbon emission reduction.
This paper is organized as follows. Section 2 presents an overview of smart cities and carbon emissions. Section 3 describes the policy background and theoretical analysis. Section 4 elaborates the research design. Section 5 presents the empirical research results. Section 6 introduces the heterogeneity analysis. Finally, Section 7 addresses the conclusions and policy recommendations.

2. Literature Review

Present research on carbon emissions mostly concentrates on the economic, social, and industrial levels. At the economic and social level, foreign direct investment [15,16], carbon emissions trading markets [17], and urbanization [18,19] exert influence on carbon emissions. The industrial structure [20] and industrial agglomeration [21] are important factors at the industrial level. In the present literature, most research pays attention to the traditional urbanization influence on carbon footprint (environmental pollution), which can be roughly segmented into the following three classes. First, some believe that urbanization has aggravated carbon emissions (environmental pollution). Liu and Bea [22] found that for every 1% increase in urbanization, carbon emissions will increase by 1% through use of an autoregressive distributed lag (ARDL) and vector error correction model (VECM). Urbanization has brought “urban diseases”, such as environmental deterioration [23]. Furthermore, Sarwar and Alsagaf [24] proposed that urbanization increased carbon dioxide emissions but that per capita income increase can effectively control carbon emissions caused by urbanization. Second, some believe that urbanization can restrain carbon dioxide emissions. Muñoz et al. [25] divided more than 8000 families in Austria into three different levels of urbanization, namely urban areas, semi-urban areas, and rural areas, and found that urban residents have the lowest carbon footprint. Based on the analysis of provincial panel data in China from 2008 to 2017, Zhang et al. [26] found that the urbanization rate is negatively related to carbon emissions, and that the improvement of technology level is conducive to reducing carbon emissions. Third, others insist that there is a nonlinear relationship between urbanization and carbon emissions. Feng et al. [27] further found that in the early stage of urbanization, there was no significant relationship between carbon emissions and urbanization found by using the threshold regression model, while during the middle stage, urbanization inhibited CO2 emissions, and during the later stage, urbanization promoted carbon emissions. Using the STIPART model, Chikaraishi et al. [28] proposed that when a country’s economy mainly depends on tertiary industries, urban carbon emissions will decrease with the improvement of urbanization. On the other hand, when the secondary industries become the leading industries, the process of urbanization will aggravate carbon emissions. In general, the above research mainly explored the influences of traditional urbanization development models on carbon emissions.
The research on the relationship between new urbanization and carbon emissions have gradually increased recently, such as decarbonization concepts [29], nearly or net-zero energy [30], and carbon neutrality [31]. In the last decade, the research on smart city construction has begun to emerge and gradually attracted attention. Sarah Giest [32] undertook a case study of the cities of Copenhagen, London, Malmö, Oxford, and Vienna. Al Dabbagh [33] mainly addressed the advanced measures and technologies adopted by Dubai to build a smart city. Contreras et al. [34] took the London Environment Strategy (LES) as a case scenario and pointed out that only smart mobility and smart regulation programs could improve emission trends. Bracco et al. [35] introduced the demonstration activities of the University of Genoa at Savona Campus, aiming to reduce the carbon footprint, as a case study.
There are a certain number of studies focused on particular fields of a smart city. Some studies focus on specific aspects of smart city construction, such as transportation energy consumption, garbage classification, residential construction, civic responsibility, consumer behavior, etc. Ruggieri et al. [36] analyzed energy efficiency and power transportation in smart cities, proposing that the habits and behaviors of citizens are also critical factors in environmental problems. Hoang et al. [37] introduced the main components and functions of renewable energy in smart cities and conceived of how to integrate them into the energy systems of smart cities. Zawieska et al. [38] investigated the impact of the implementation of the smart city concept on reducing carbon emissions generated by transportation and analyzed the additional impact of the smart city as a liquidity determinant on carbon dioxide emissions. Vaidya et al. [39] designed and implemented an intelligent electric vehicle charging management system using a charging strategy, exploring the construction and development of smart cities from the perspective of buildings, and improving the charging management of smart electric vehicles. Ruggieri et al. [40] analyzed electric mobility through the overview of six European smart cities, including Olso, London, Hamburg, Milan, Florence, and Bologna, and pointed out that electric mobility is an important path to decarbonization. Oralhan et al. [41] analyzed the optimization of garbage collection in smart cities based on the internet of things technology to reduce environmental pollution. Kylili et al. [42] qualitatively described the potential contribution of zero energy buildings to European smart city construction. Caponio et al. [43] proposed a simulation model based on system dynamics and validated the effectiveness of the model in simulating and improving local energy planning policies in the residential building sector in smart cities. Preston et al. [44] took two projects from Nottingham in the UK and found that citizens should take primary responsibility in smart city construction for carbon emission reductions.
Undeniably, the smart city has garnered significant attention all over the world and previous research has probed the influence of smart city construction on urban innovation capacity [45,46], high-quality economic development [47], and other aspects. In addition to the above research, some studies paid close attention to the relationship between the smart city and the environment. Li et al. [48] found that smart city construction has significantly optimized the air quality in pilot areas, and the policy has a spatial spillover effect. Feng [49] proposed that the smart city infrastructures had an effect on city haze pollution and that there were spatial heterogeneities at national, regional, and city administrative rank levels. Chu et al. [50] pointed out that the smart city pilot policy significantly reduced urban pollutants through the classic land allocation decision-making theoretical model. Wang et al. [51] proposed that smart city construction improved green total factor productivity through technological innovation, industrial structure upgrading, and resource optimization. Jiang et al. [52] analyzed the effect of the first batch of pilot smart cities in China on GTFP and green technology progress.
Some studies have focused on the quantitative relationship between smart cities and carbon emissions. Yu and Zhang [53] suggested that the pilot policy of low-carbon cities improved carbon emission efficiency by 1.7% and that every 1% increase in carbon emission efficiency will reduce carbon dioxide emissions by 8.37 million tons, using the difference-in-difference (DID) and the spatial difference-in-difference (SDID) models. Cavada et al. [54] explored the relationship between smart cities and low carbon emissions through a smart city case study of Copenhagen and Singapore. Yigitcanlar et al. [55] took UK smart cities as data samples, used the panel data analysis method to analyze the carbon emissions of 15 cities in the UK from 2005 to 2013, and pointed out the nonlinear relationship between city smartness and carbon emissions.
To sum up, relevant research on urbanization is relatively rich at present, but there are still the following research gaps: First, while studies on traditional urbanization are relatively abundant, research on new urbanization is insufficient, especially concerning smart cities. Second, the limited research on new urbanization mainly examined the economic and social impact of new urbanization construction and paid less attention to the environmental impact, especially the relationship between smart city construction and carbon emission reductions, which is an important embodiment of new urbanization construction. Third, previous studies used various indicators to measure urbanization, which is likely to cause measurement errors and endogenous problems.
In view of this, this paper uses China’s urban panel data, takes the pilot policy of smart city construction as a quasi-natural experiment to measure the construction of new urbanization, uses the difference-in-difference method to deeply investigate the impact of smart city construction on urban carbon emissions, and further examines the dynamic impact effect, impact mechanism, and heterogeneity of the policy.

3. Policy Backgrounds and Theoretical Analysis

3.1. Policy Background

In 2008, IBM (International Business Machines Corporation, Armonk, NY, USA) first proposed the “smart city” and took it as the solution of the “smart earth” strategy. Smart cities aim to embed various intelligent sensors into the internet of things systems of public resources, such as power grid, hospitals, oil and gas pipelines, highways, subways, buildings, etc., so as to sense the key information in the operation of core urban systems in real time. On this basis, new generation information technologies, such as cloud computing and big data, would be used to further analyze and integrate the data generated in urban operations, so as to achieve accurate management and the efficient allocation of urban resources, alleviate the “urban disease”, ultimately enhance the quality of life of urban residents, and boost green and sustainable development.
The United States, Britain, Japan, South Korea, and other developed countries have taken the lead in building smart cities. In Europe, in order to solve the “urban disease” caused by urban sprawl, many countries have implemented intelligent practices in water conservation, government services, energy, and other areas. The EU carried out the “i2010” strategy in 2005 and applied the European Smart City Network Construction Plan in the year of 2006 [56]. In 2006, Germany launched the “T-CITY” project, aiming to mobilize people and social forces to join in smart city construction and change individuals’ insufficient motivation and too-heavy reliance on government investment in smart city construction. In 2009, the UK launched the “Digital Britain” program, hoping to improve the scope and depth of digital network use. In Asia, South Korea launched the “U-Korea” development strategy in 2009, expecting to build a green city with seamless connections and convenience. In 2005, Singapore put forward the “Smart Country 2015” plan, intending to solve the “urban disease” problem and to build Singapore into a seamlessly integrated smart country. In 2009, Japan launched the “smart Japan” strategy, proposing to fully integrate digital technology into social production and residents’ lives. In 2009, IBM and Dubuque jointly announced a plan to develop Dubuque into the first real smart city in the United States.
Compared with developed countries, China’s smart city construction started relatively late. In 2009, the Chinese government proposed the construction of smart cities. In December 2012, the Ministry of Housing and Urban Rural Development of China officially released the “Notice on Carrying out Smart City Pilot Work” and issued two documents, namely the Interim Administrative Measures for the National Smart City Pilot and the National Smart City (District, Town) Pilot Indicator System (Trial). In December 2012, the first batch of smart cities in the pilot project involved 90 regions, including 37 prefecture level cities, 50 districts (counties), and 3 towns. In May 2013, the second batch involved 103 regions, including 31 prefecture level cities, 40 districts (counties), and 5 towns. In April 2015, the third batch involved 84 regions, including 22 prefecture level cities, 59 districts (counties), and 3 towns. In the same year, the central government included smart city construction in a governmental work report for the first time. In 2017, the report of the 19th National Congress of the Communist Party of China clearly proposed the building of a “smart society”. In March 2021, in the 14th Five Year Plan, smart cities were mentioned many times and attracted wide attention. Governments at all levels made commitments to scientific deployment in digital society, digital economy, digital government, and other aspects, hoping to achieve green urbanization and improve people’s quality of life through smart city construction.

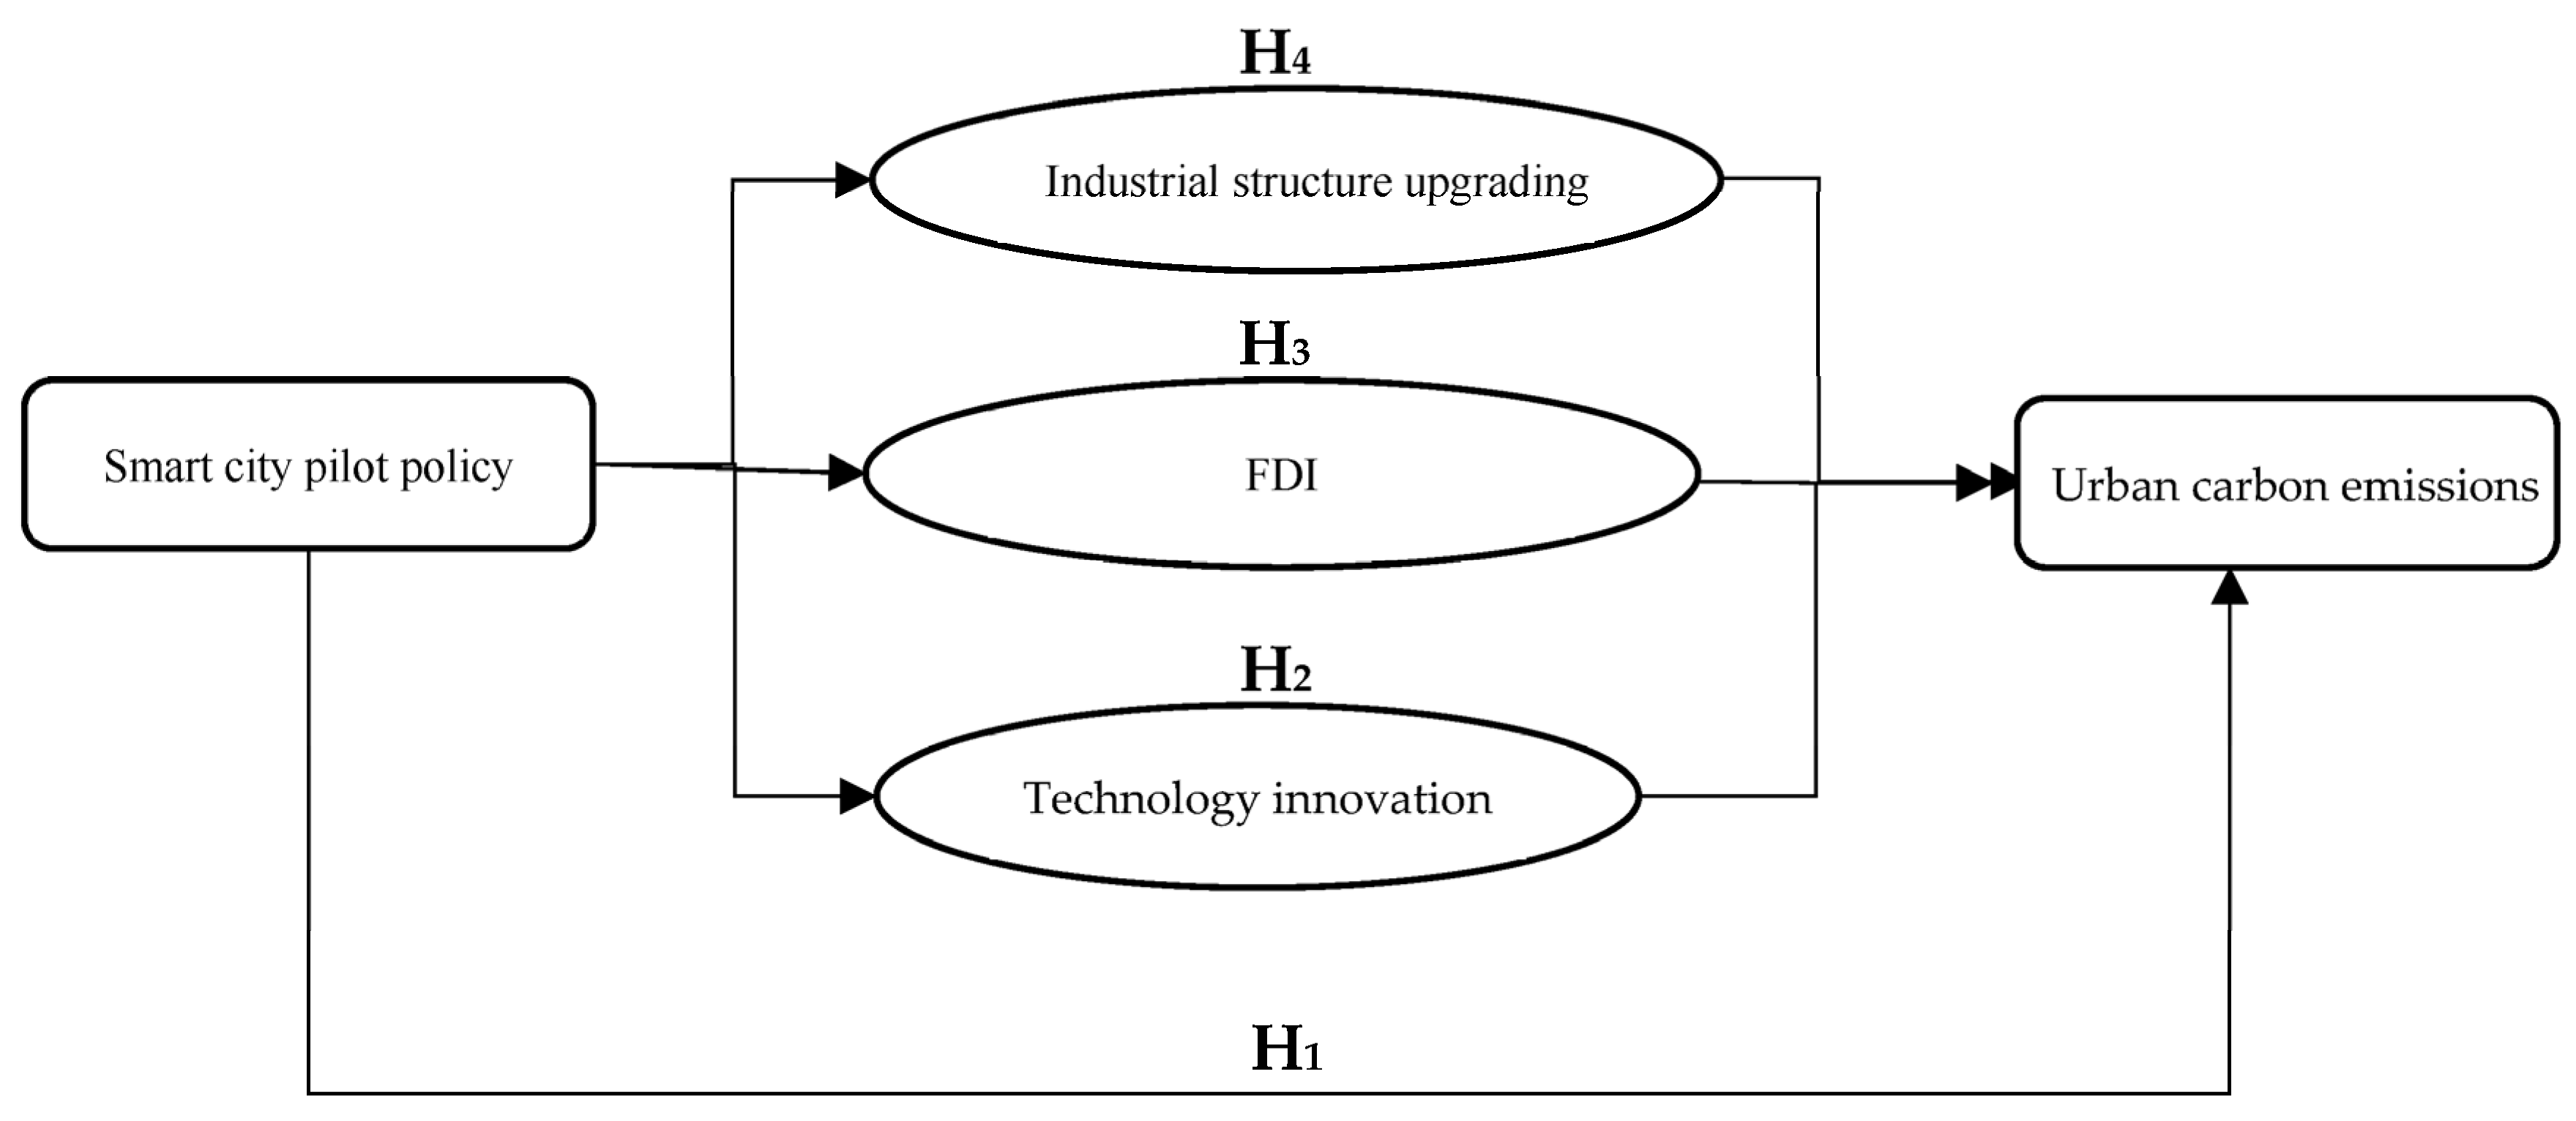
3.2. Theoretical Analysis

Smart city construction uses digital and new generation information technology to drive green transformation in all walks of life, lead green lifestyle change, improve urban comprehensive governance capacity, open up a new path for low-carbon sustainable development, and inject strong impetus into ecological civilization construction. On the one hand, smart city construction uses new generation technologies, including internet of things technology, cloud computing, and radio frequency sensing technology, to accurately collect carbon emission data, and on this basis, utilizes data visualization to guide low-carbon policy formulation and create low-carbon scenarios. With the help of the digital technology of smart city construction, it is able to facilitate the optimization of enterprise production mode, fully tap consumer preferences and market demand information, implement customized production, promote the precise connection between supply and demand, reduce resource waste, and enhance urban resource allocation and energy use efficiency, thus reducing CO2 emissions. On the other hand, with the promotion of smart city construction, the new generation of information technology can be used to promote intelligent transportation and build an intelligent transportation system, so as to reduce traffic congestion and resource waste and achieve low-carbon travel. In addition, the emergence of smart travel modes, such as shared electric vehicles and shared bicycles, have not only effectively alleviated traffic congestion but also reduced carbon emissions generated by traditional transportation to a certain extent, effectively reducing greenhouse gas emissions. Based on the above analysis, this paper proposes the following first hypothesis.
Hypothesis 1:
Smart city construction can effectively reduce carbon emissions.
In theory, smart city construction can facilitate carbon emission reduction through technology innovation. Smart city construction emphasizes promoting the development and application of big data, artificial intelligence, 5G, and other technologies, which is conducive to fostering technology-intensive industries and developing high-tech industries. These high-tech sectors’ development will accelerate an agglomeration of innovation elements, attract high-end talent, accelerate the transformation of scientific and technological achievements, encourage economic entities to attach importance to research and development, and improve the technological innovation ability of enterprises. Smart city construction is able to expedite cross-industry resource sharing, accelerate information exchange and dissemination, boost R&D cooperation among innovation subjects, abate information asymmetry, reduce innovation costs, save valuable innovation resources, optimize green technology, and accelerate the application of energy-saving technology and environmental protection technology in manufacturing industry [57]. Relying on big data technology and digital governance means, it is able to comprehensively optimize the production and operation mode of enterprises, improve environmental monitoring capabilities, and effectively control energy consumption and carbon emissions in enterprise production and residents’ lives in real time. Technology innovation, especially green technology innovation, is the power source for improving urban ecological environment and achieving the goal of carbon neutrality. Therefore, the construction of smart cities can reduce carbon emissions from the front-end prevention through technology innovation, thus promoting the low-carbon transformation and the development of cities. Based on the above analysis, this paper proposes a second hypothesis.
Hypothesis 2:
Smart city construction can reduce carbon emissions through technology innovation.
Smart city construction can boost carbon emission reduction through foreign direct investment (FDI). In order to better carry out smart city construction, the central government and local governments have introduced a large number of supportive measures, including financial subsidies, tax relief, land use preferences, credit approval, etc., which have had positive effects in terms of attracting foreign direct investment. In addition, smart city construction can implement the development of a city’s “new infrastructure”, propel the innovation of social governance models, simplify the government service process, significantly ameliorate the investment environment, and optimize the business environment. Smart city construction will build a more convenient and comfortable environment suitable for living and working, thus enhancing the confidence and determination of foreign direct investment.
The inflow of foreign direct investment can strengthen demonstration effects and spillover effects in technology and management and have a positive impact on the host country. The host country can learn to imitate the operation modes and production technologies of foreign enterprises, carry out independent innovation, promote industrial upgrading and production efficiency improvement, realize the transformation of sustainable development-oriented economic development modes, and save basic resources [58]. Moreover, with the improvement of per capita income in developing countries, people have higher requirements of their environment. Foreign direct investment can accelerate the free flow and efficient allocation of low-carbon and environmentally friendly green capital worldwide, providing sufficient capital support for green transformation in developing countries. Based on the above analysis, this paper proposes a third hypothesis.
Hypothesis 3:
Smart city construction can reduce carbon emissions through the effect of foreign direct investment.
Theoretically, smart city construction can reduce carbon emissions through an industrial structure effect. Smart city construction could accelerate the integration of new generation information technology industries such as the internet of things, mobile internet, and big data with traditional sectors, facilitate the emerging sectors and smart industries. The development of these emerging industries will counteract non-green and excess production capacity to accelerate their elimination, squeeze the development space of high pollution and energy consumption industries, guide resources and factors from sectors with low marginal efficiency to sectors with high marginal efficiency, and optimize the resource allocation structure among industries [59]. With the rising proportion of emerging industries, regional industrial structure upgrading will take place, which is one of the main paths for energy conservation and emission reduction. New energy, new materials, and other emerging industries are often characterized by high added value, high technology content, low energy consumption, and low pollution. Therefore, the industrial structure upgrading can reduce carbon emissions. Based on the above analysis, this paper proposes its fourth hypothesis.
Hypothesis 4:
Smart city construction can reduce carbon emissions through the effect of industrial structure upgrading.
Combined with research hypotheses H1, H2, H3, and H4, the influencing mechanisms of smart city construction on urban carbon dioxide emission reduction can be seen in Figure 1.

4. Research Design

4.1. Model Specification

4.1.1. Benchmark Model

The DID method has been widely used in policy effect evaluations in recent years. The implementation of the smart city pilot policy can be seen as having had an exogenous policy impact. Since the policy was launched in three batches, a multi-period DID model has been used to evaluate the policy effect. The benchmark model (1) is designed as follows:
lncarbon it = 0 + 1 smart it + γ control it + μ i + λ t + ε it
where i and t , respectively, represent the city and time; lncarbon represents urban carbon emissions; ln stands for the logarithm; smart represents smart city construction, measured by the smart city pilot policy; and 1 represents the net impact of smart city construction on urban carbon emissions, which is the key coefficient of this study. If smart city construction can significantly reduce urban carbon emissions, 1 should be significantly negative. If 1 is not significant or significantly greater than 0, this indicates that smart city construction cannot stimulate urban carbon emissions reduction. C o n t r o l represents a set of control variables, regulating the impact of other factors on urban carbon emissions. μ expresses the city fixed effect; λ expresses the time fixed effect; and ε expresses the random error term.

4.1.2. Dynamic Effect Model

The benchmark model (1) can only solve the problem of whether a smart city construction can stimulate the carbon emissions reduction but does not answer the question of when this effect occurs. Therefore, a dynamic model is introduced to solve this problem and further explore whether such an effect is sustainable or not. We used the event study method of Beck et al. [60] to investigate the time impact of smart city construction on carbon emissions reduction. Thus, the benchmark model (1) is expanded into the following dynamic model:
lncarbon it = β 0 + s = 1 8 β pre _ s D pre _ s + β current D current + k = 1 8 β post _ k D post _ k + γ control it + μ i + λ t + ε it
In model (2), variable D p r e _ s (s = 1, …, 8) is the cross-term of the dummy variables in the smart city pilot area and the dummy variables in the s year before the implementation of the smart city pilot policy. D c u r r e n t represents the year when the smart city pilot policy was implemented. Variable D p o s t _ k (k = 1, …, 8) is the cross-term of the dummy variable in the smart city pilot area and the dummy variable in the k year after the implementation of the smart city pilot policy. Estimated parameters β p o s t _ k (k = 1, …, 8) reflect the dynamic time impact of the policy. The parameter β c u r r e n t reflects the impact of the smart city pilot policy in the year of implementation. The other variables’ meanings are the same as those of the benchmark model (1).
In addition, the parallel trend can be judged by observing the significance of the parameters β p r e _ s (s = 1, …, 8), which is the premise of the DID method. In other words, before the implementation of the smart city pilot policy, the carbon emission trends of pilot cities and non-pilot cities should be consistent. At this point, the parameter β p r e _ s (s = 1, …, 8) fails to pass the significance test.

4.1.3. Mediating Effect Model

If smart city construction significantly reduces urban carbon emissions, how this effect is realized is a problem worth exploring. Therefore, it is necessary to examine the specific paths of carbon emissions reduction from three aspects: technology innovation, foreign direct investment, and industrial structure upgrading. Referring to the research of Baron and Kenny (1986) [61], the intermediary effect model is built on the basis of the benchmark model (1).
M it = α 0 + α 1 smart it + γ control it + μ i + λ t + ε it
lncarbon it = π 0 + π 1 smart it + π 2 M it + γ control it + μ i + λ t + ε it
Model (3) and model (4) constitute the intermediary effect model. In model (3), M represents the intermediary variables, namely technology innovation ( i n n o v a ), foreign direct investment ( f d i ), and industrial structure upgrading ( s t r u c t u r e ), respectively. The detailed definitions of the intermediary variables are given in Section 4.2.4. The other variables have the same meanings as described in the benchmark model (1). First, regress the model (3). If the estimation coefficient of s m a r t is significantly positive, smart city construction has a significant positive impact on the intermediary variables. Second, regress the model (4). If the estimation coefficient of intermediary variable M is significant and the estimation coefficient of s m a r t is non-significant or significant but the coefficient value is lower than that of the benchmark model (1), smart city building reduces urban CO2 emissions through the intermediary variables. If at least one of the regression coefficients of s m a r t in model (3) and M in model (4) is not significant, it is necessary to use the bootstrap method to judge the significance. If the upper and lower limits of the bootstrap confidence interval do not contain 0, the intermediary effect is significant.

4.2. Variables Definition

4.2.1. Explained Variable

Carbon emissions ( lncarbon ) is the explained variable, measured by the logarithm of the ratio of urban carbon emissions to gross regional product (GDP). Based on the data availability of the China Urban Statistical Yearbook, referring to the accounting method of Feng and Rui [62], the specific measurement formula is as follows:
carbon = C u + C p + C t = μ E u + υ E p + Γ η × E t
where carbon represents the carbon emissions; C u , C p , and C t , respectively, represent the carbon emissions from urban natural gas, liquefied petroleum gas, and electricity consumption of society as a whole; E u , E p , and E t , respectively, represent the natural gas, liquefied petroleum gas and electricity consumption data of society as a whole that has been consumed by the cities over the years. As it provides nearly 60% of China’s power generation, coal plays a major role in China’s energy structure, and coal-fired power generation is the main cause of carbon emissions. Therefore, carbon emissions are measured by coal-fired power generation. η expresses the proportion of coal-fired power generation in the total power generation. Due to the small differences in the proportion of coal-fired power generation among China’s cities, coal power proportion data released by the China Electricity Yearbook over the years are used to uniformly measure the proportion of coal power at the city level. μ , υ , and Γ , respectively, represent the greenhouse gas emission coefficients of natural gas, liquefied petroleum gas, and coal-fired power generation, the values of which are 2.1622 kg/m3, 3.1013 kg/m3, and 1.3023 kg/(kw × h), respectively.

4.2.2. Core Explanatory Variable

Smart city construction ( smart ) is the core explanatory variable, the cross-multiplying term of the dummy variable ( du i ) of the smart city pilot area, and the dummy variable ( dt it ) of the smart city pilot time. The value rule of du i is when city i is approved as a pilot smart city (treatment group); the value of du i thus takes 1. If city i is not approved as a pilot smart city (control group), the value of du i takes 0.
It should be noted that there is a county or district at a prefecture-level city in the pilot list of smart cities in China. If the prefecture-level city is taken as an experimental unit, the evaluation effect will be affected. Therefore, such pilot cities are excluded. During the sample period, there were 89 pilot smart cities and 130 non-smart cities. That is, there are 89 treatment groups and 130 control groups in this study.

4.2.3. Control Variables

In order to make the treatment group and the control group more comparable, this paper also controls other carbon emissions factors.
1.
Urban economic development ( lnpgdp )
This paper chooses the logarithm of per capita GDP to measure the regional economic development. Regional economic development is inseparable from energy consumption, while CO2 emission intensity is closely related to economic growth. The environmental Kuznets curve (EKC) hypothesis considers that there is an inverse “U” relationship between per capita income and environmental pollution [63]. However, many studies show that China has not yet crossed the inflection point of the EKC curve. In this sense, it is predicted that the economic development will promote the carbon emissions.
2.
Consumption level ( consump )
The level of social consumption is measured by the proportion of the retail sales of social consumer goods in the gross regional product. With the economic growth entering a new normal, stimulating consumption has become an important driving force for economic growth. Increased investment in life and production activities has driven the consumption of carbon-intensive products, increasing carbon emissions caused by domestic energy consumption [64].
3.
Population density ( density )
This variable is measured by dividing the population of the prefecture level city by the administrative area to characterize the differential impact of the scale of urban human activities [65]. This indicator can control the difference in carbon emissions caused by the factor of population. In general, the increase in population density brings about the large-scale agglomeration of life and production activities, thus promoting energy consumption and carbon emissions.
4.
Traditional urbanization ( urban )
The proportion of the population in the municipal area of the city in the total population of the city at the end of the year is used as the proxy variable of urbanization. Traditional urbanization enhances carbon intensity by gathering a large number of economic activities, building large-scale infrastructures, and driving the growth of energy consumption [66]. Therefore, it is predictable that the traditional urbanization will provoke carbon emissions.
5.
Financial dependence ( fiscal )
The proportion of the local general public budget revenue to GDP is used to capture the impact of financial dependence on the carbon emissions. The impact of smart city construction on urban carbon emissions reduction is closely related to the government’s discourse power, and financial dependence reflects the government’s market intervention. If financial dependence is high, it is easy for the government to excessively intervene in the economy, causing adverse effects in carbon emission reduction [67].

4.2.4. Intermediary Variables

(1) Technology innovation ( innova ) is measured by the number of patents granted per capita in an urban population of 10,000 people. The larger the index is, the stronger the technology innovation capacity of the city is. (2) Foreign direct investment ( fdi ) is measured by the actual amount of foreign capital used in the current year and is converted to home currency according to the exchange rate of the current year. The larger the index is, the more attractive the city is for foreign direct investment. (3) Industrial structure upgrading ( structure ) is the ratio of the tertiary industry to the secondary industry and is used as the proxy variable of the urban industrial structure upgrading. Generally speaking, the higher the index is, the more optimized and reasonable the urban industrial structure is.

4.3. Data Source

This study uses the panel data of 219 cities in China from 2006 to 2020 to evaluate the effects of smart city construction on carbon emission reduction. The information on the pilot smart cities comes from the list of pilot smart cities published by the Ministry of Housing and Urban Rural Development of China. The patent data were collated from the China Patent Database, published by the Intellectual Property Office. Other data come from the Statistical Yearbook of Chinese Cities, the Statistical Yearbook of China’s Environment, the Statistical Yearbook of China’s Energy, and the Statistical Database of China’s Labor Employment and Economic and Social Development. Some missing data were filled using the moving weighted average method and the interpolation method. In order to increase the comparability of the data, as for the nominal value variables lnpgdp and fdi , this study adopts the GDP price deflator for the provinces to eliminate the impact of inflation.

5. Results

5.1. Descriptive Statistics Results

The descriptive statistics results of the main variables are shown in Table 1.
In addition, in order to intuitively comprehend the impact of China’s smart city construction on carbon emissions, the change trends of carbon emissions in the treatment groups and the control groups before and after the implementation of China’s smart city pilot policy are charted in Figure 2.
From 2006 to 2011, the carbon emission trends of the treatment groups and the control groups were basically consistent, without significant difference. After 2012, the carbon emissions trends of the treatment groups and control groups declined at different rates. The declining rate of the former was higher than that of the latter, while the gap between the two groups became increasingly enlarged year by year. Coincidentally, China’s smart city policy was officially implemented from the year of 2012. Therefore, it can be preliminarily inferred that smart city construction may lead to carbon emissions reduction, basically indicating that smart city construction has a carbon emissions reduction effect. However, the establishment of this causal relationship requires more rigorous empirical testing.

5.2. Benchmark Regression Results

Table 2 explains the regression results of the benchmark model (1), controlling the time fixed effect and city fixed effect. Control variables are not added in column (1) of Table 2 and are added in columns (2) to (6) in turn. It can be seen from Table 2 that the coefficient of smart is negative and passes the significance test at 1% level, no matter whether the control variables are added or not. Taking column (6) with all the control variables as the final analysis basis, the estimation coefficient of smart city construction ( smart ) passes the significance test at the 1% level, and its coefficient value is −0.0436. In an economic sense, compared with non-pilot cities, smart city construction has reduced the carbon emission intensity of pilot cities by 4.36% on average. This shows that the implementation of the smart city pilot policy is conducive to abating urban carbon emissions, achieving environmental dividends, and promoting local ecological environment improvements. Therefore, the hypothesis 1 is verified.
In addition, smart city construction requires significant costs, and the control variables introduced in this paper also require huge capital. Hence, this paper attempts to examine whether smart city construction is cost-effective from the perspective of economic growth. In column (7) of Table 3, urban economic growth (measured by the natural logarithm of urban GDP) is taken as the explained variable and the benchmark model (1) is used for regression. It is easy to see that the estimated coefficient of s m a r t , the core explanatory variable, is significantly positive (0.0278), which indicates that smart city construction is able not only to promote urban carbon emissions reduction but also stimulate urban economic growth, while releasing environmental dividends and economic dividends and promoting sound economic development. It can be seen that even if significant costs are needed to engage in smart city construction and the control of relevant variables, smart city construction can still effectively protect the environment without sacrificing economic growth and achieve the goal of transforming economic growth and carbon emission reduction from opposition to harmony, which will ensure that the benefits generated by smart city construction are greater than the costs required.
The economic growth level ( lnpgdp ) has a negative effect on carbon emissions, passing the significance test of 1% level. On the one hand, China has made great achievements in economic development in recent years and has now become the second largest economy in the world. These remarkable economic achievements have provided a solid material basis for controlling carbon emissions, making China more economically capable of controlling carbon emissions than other countries. On the other hand, China may have crossed the inflection point of the environmental Kuznets curve and be entering the descending stage of the inverted U-shaped environmental Kuznets curve. Controlling carbon emissions does not mean abandoning economic growth but solving problems in development by means of development. China’s sustainable economic development is the key to solving the problem of carbon emissions. The regression coefficient of consump is significantly positive, indicating that the improvement of consumption level has aggravated the carbon emissions. This may be related to China’s current consumption mode. The public’s unreasonable consumption concepts and habits are still present and the green consumption concept has not yet been deeply rooted. There are still problems, such as waste and unreasonable consumption in many areas, which restrict the release of green functions of consumption. The impact of density on carbon emissions is not obvious, which may be due to the impact of population agglomeration on carbon emission reduction being dynamic and long-term and not obvious in the short term. The regression coefficient of traditional urbanization ( urban ) is notably positive, which indicates that traditional urbanization with extensive development modes as the main feature has augmented carbon emissions, which is consistent with the theoretical expectations. The regression coefficient of financial dependence ( fiscal ) is significantly positive, which may be due to excessive government intervention in the market, the low efficiency of resource allocation, and the artificial distortion of the normal operation of the market mechanism, resulting in the waste of resources, badly hindering carbon emission reduction.

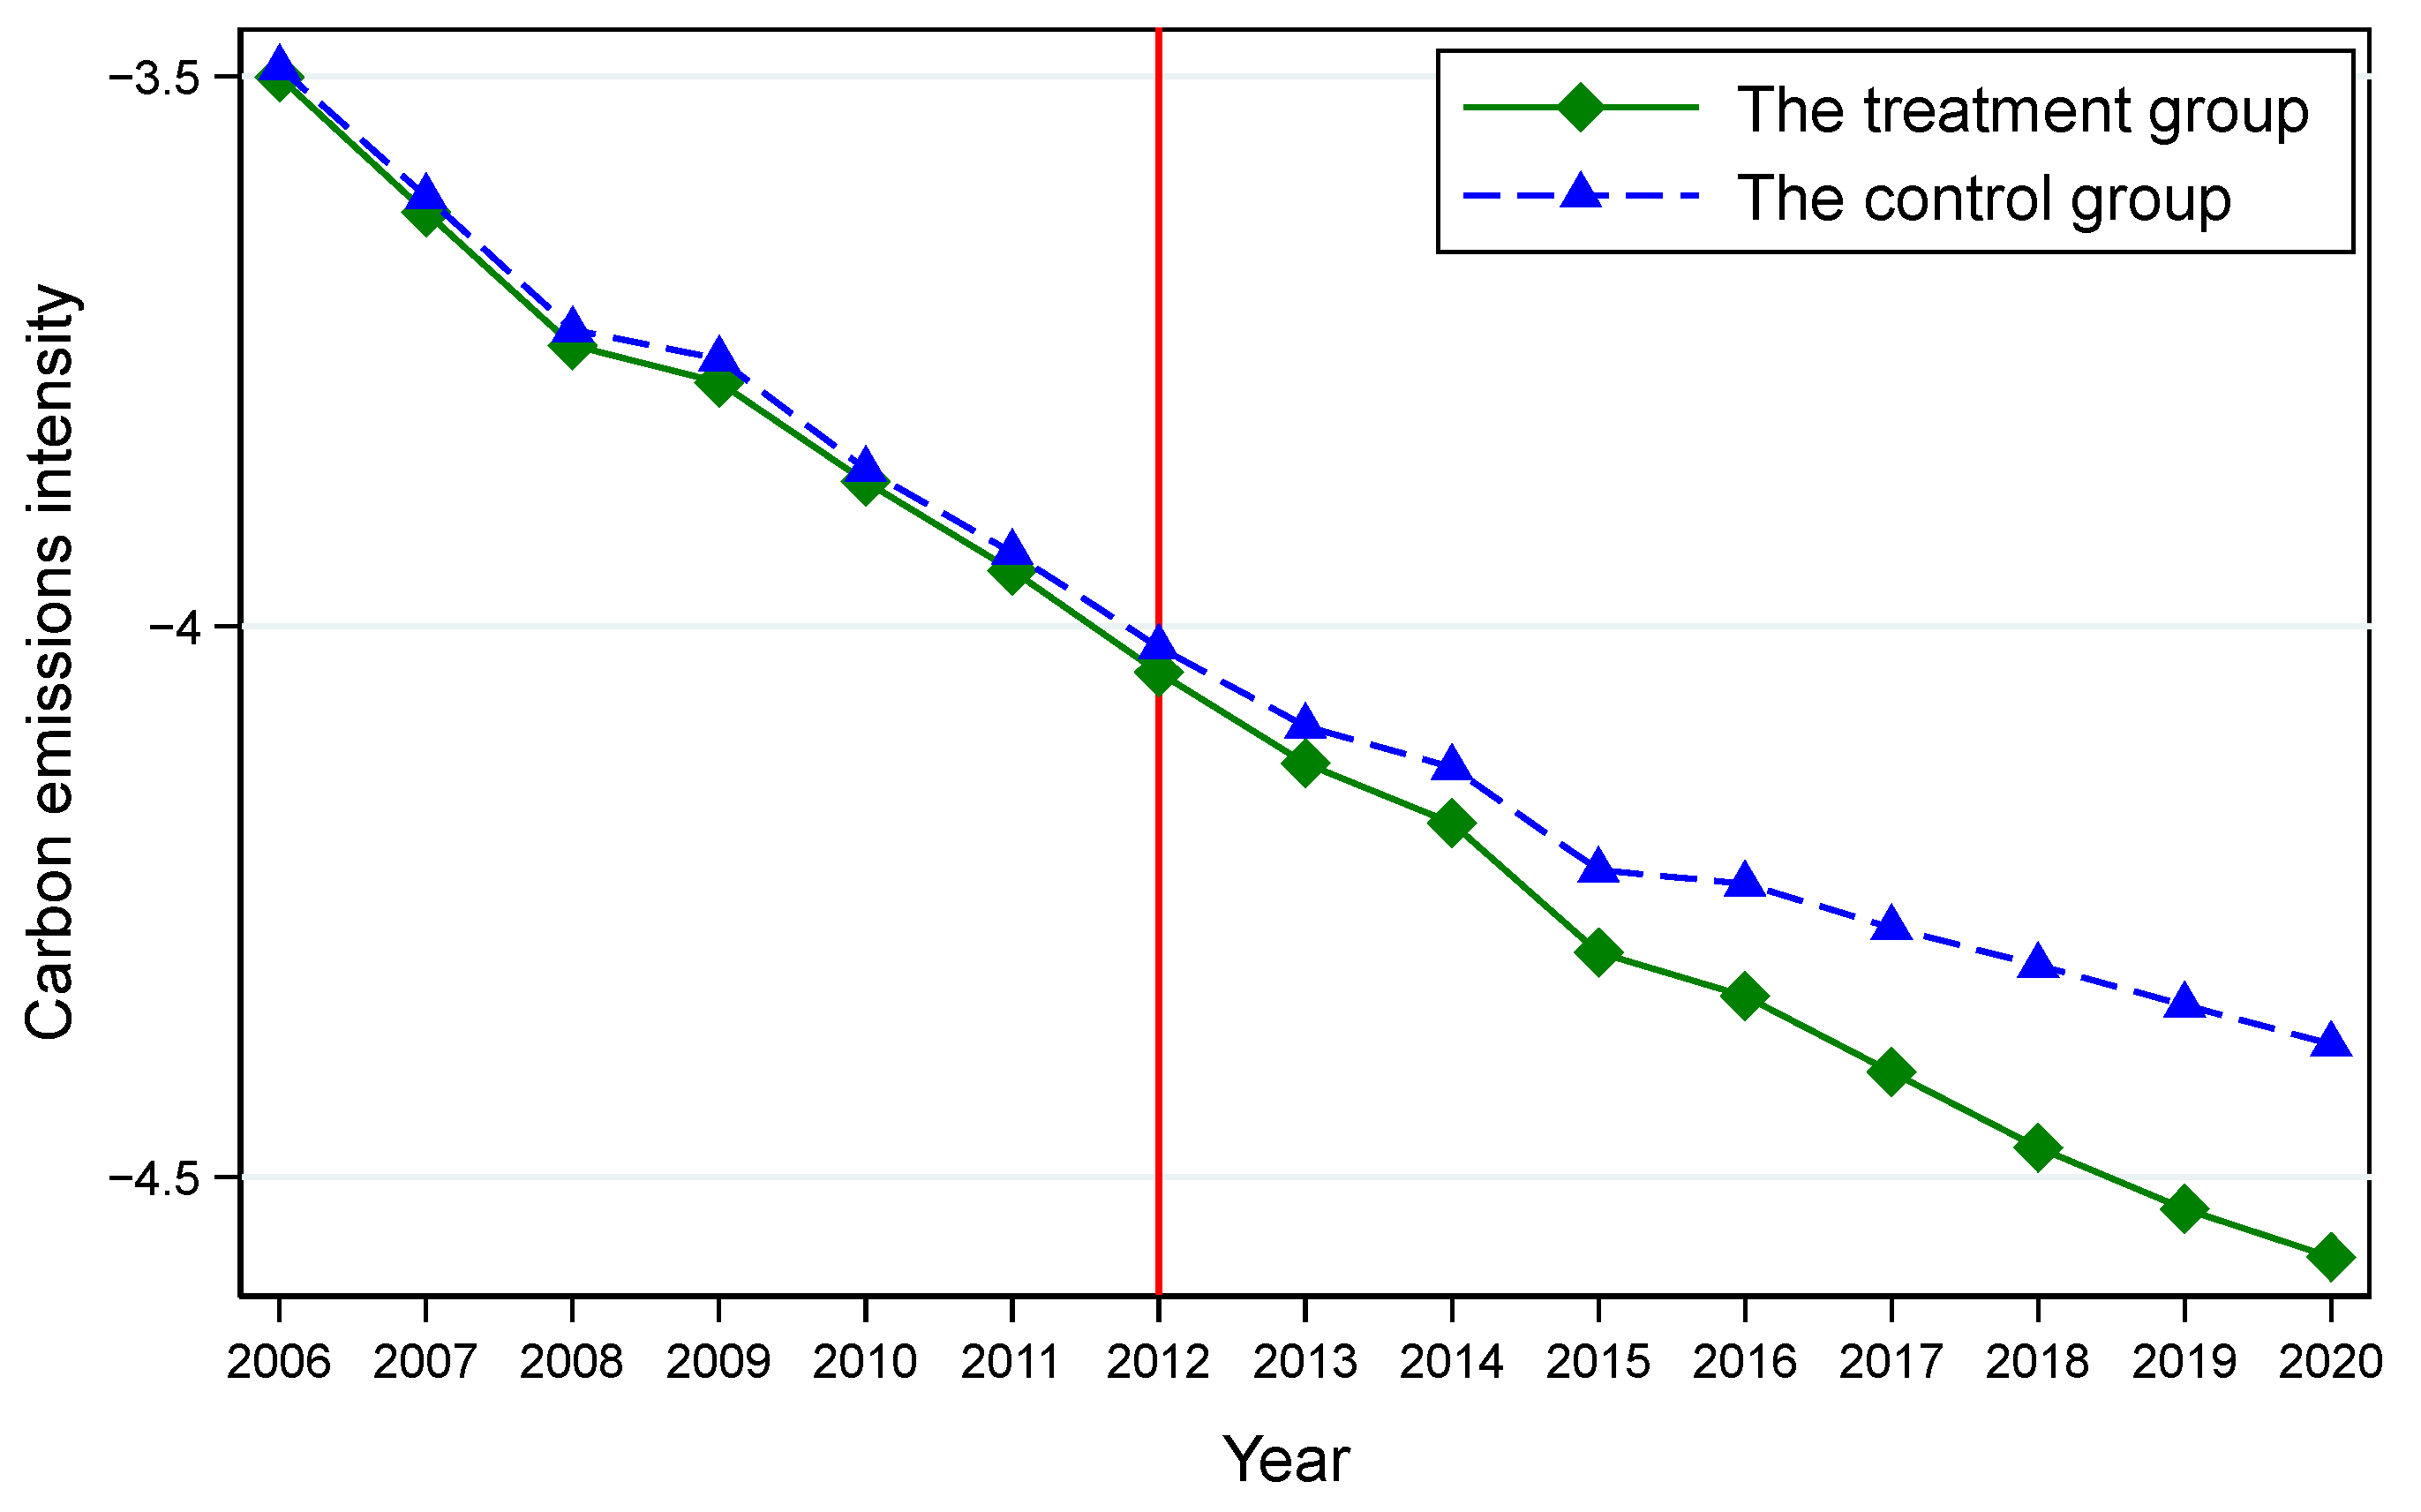
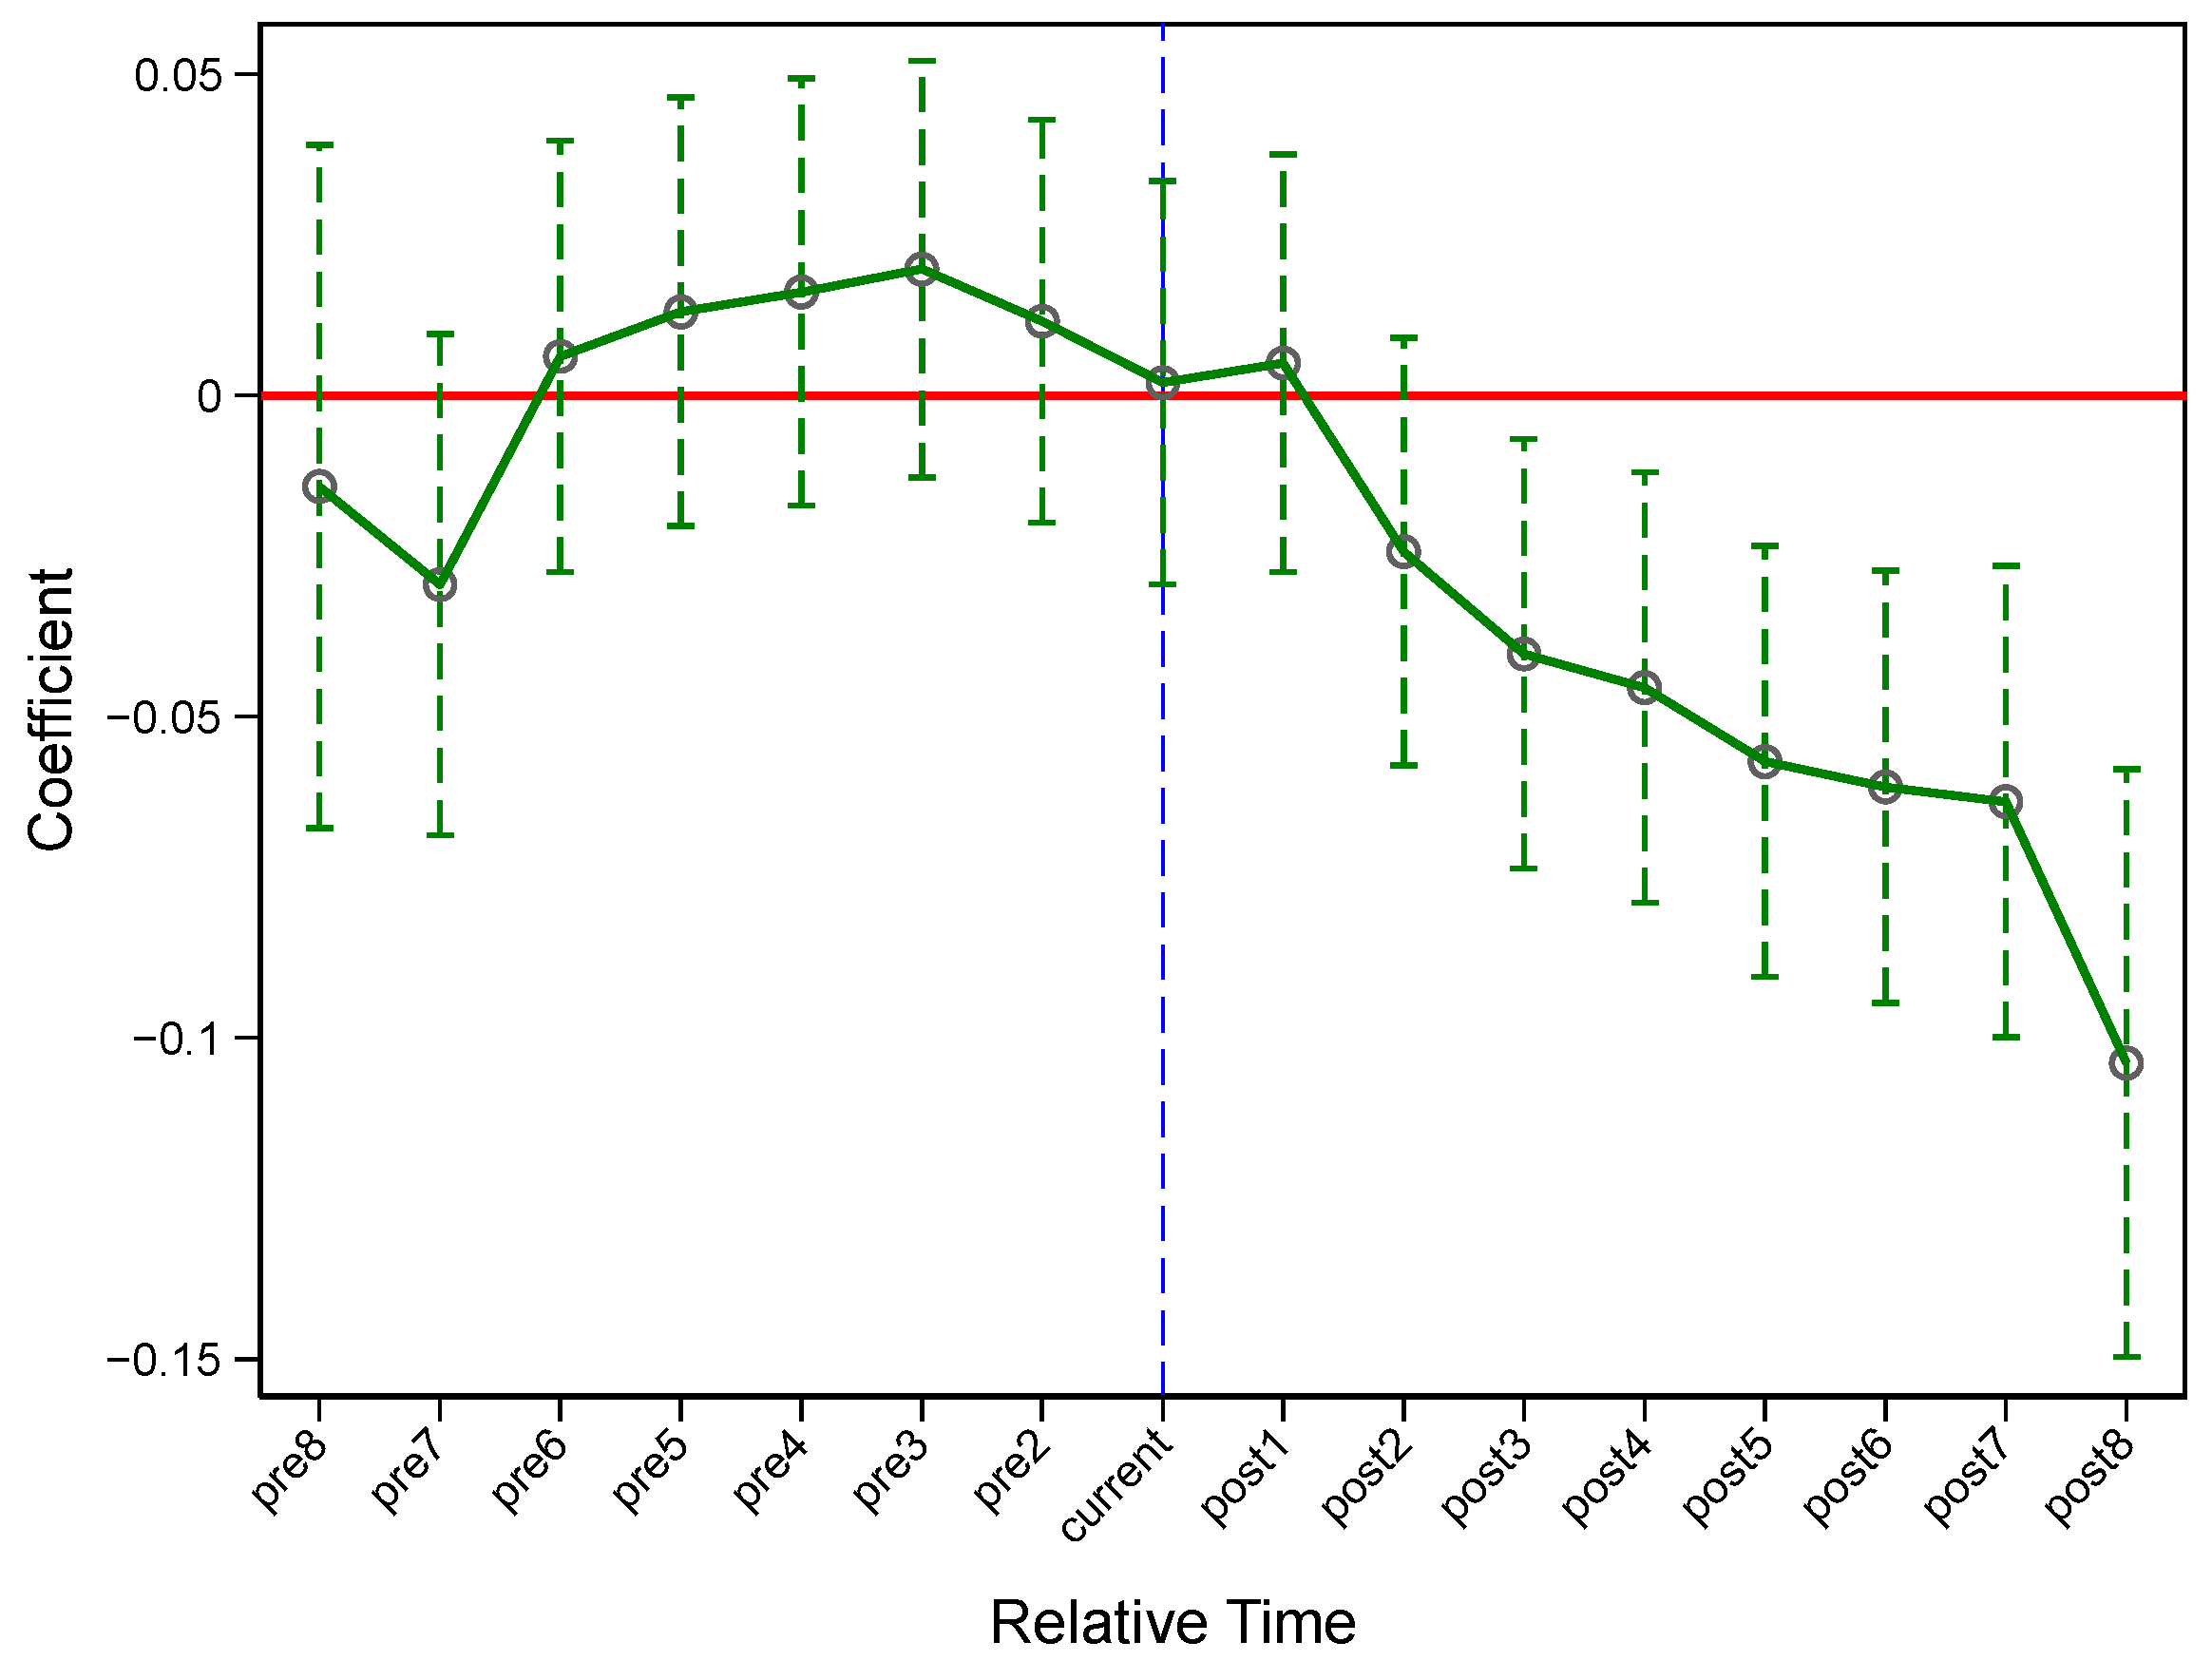
5.3. Parallel Trend and Dynamic Effect Test

Figure 3 is a graphical representation of the regression results of model (2). In consideration of multicollinearity, the variable p r e 1 is deleted. It can be seen that before the policy was implemented ( p r e 2 p r e 8 ), the corresponding regression coefficients did not pass the significance test. The carbon emission intensity of the treatment groups and the control groups did not show significant differences, and most of the estimation coefficients fell near the value of 0, the upper and lower limits of the confidence interval included 0, and the common trend assumption was accepted. Therefore, it is appropriate to use the DID method to evaluate the effect of smart city construction on carbon emission reduction.
At the same time, it can be seen from Figure 3 that the smart city pilot policy did not pass the significance test in the two years after its implementation. After the third year, the confidence interval of its estimation coefficient did not include 0, and the differences in carbon dioxide emissions between the treatment and control areas become prominent. That is to say, the effect of the smart city pilot policy begins to be visible in the third year, after which the effect becomes greater and greater. The reason for this may be that smart city construction takes time and instant results cannot be obtained. At the initial construction stage, the standards, specifications, and the regional information infrastructure are not perfect, making it difficult to fully exert the effects of the smart city. As time goes by, people from all walks of life gain a deeper understanding of the smart city. Smart cities are deeply integrated with urban construction and smart application scenarios continue to expand, leading to the continuous enhancement of the carbon emission governance effectiveness of smart city construction. Therefore, we need to adhere to long-term and comprehensive plans to release the environmental governance effect of smart city construction.

5.4. Test of Conduction Mechanisms

Through theoretical analysis, this paper demonstrates that smart city construction mainly hastens carbon emission reduction via three paths: technology innovation, foreign direct investment, and industrial structure upgrading. In order to verify these three transmission mechanisms, this study applies the intermediary effect model, which is composed of model (3) and model (4).

5.4.1. Test of Technology Innovation Effect

Column (1) of Table 3 shows the regression results of the explained variable ( innova ) in relation to the explanatory variable ( smart ) and the control variable. The regression coefficient of smart is significantly positive at the level of 10% and the coefficient value is 1.3097, indicating that smart city construction has significantly improved the city’s technology innovation capacity. Column (2) of Table 3 shows the regression results of the explained variable ( lncarbon ) to the explanatory variables ( smart ), intermediary variables ( innova ), and control variables. It is not difficult to see that the regression coefficients of smart and innova are significantly negative at the 1% level, and the absolute value of the estimation coefficient of smart (0.0379) is smaller than that in the benchmark regression results (0.0436). According to the intermediary effect model, the improvement of technology innovation capability effectively reduces carbon emissions, and this is an effective method for smart city construction to bring about urban carbon emissions reduction. In fact, smart city construction attaches the great importance to R&D and the application of cloud computing, the internet of things, 5G, big data, and other technologies, which strongly push forward the improvement of a city’s technology innovation, providing strong green technological support for carbon emissions reduction. In view of this, smart city construction can reduce urban carbon emissions by improving technology innovation capacity, and thus hypothesis 2 is confirmed.

5.4.2. Test of Foreign Direct Investment Effect

Column (3) of Table 3 reports the estimated results of the impact of smart city construction on foreign direct investment. The estimated coefficient value of smart is 24.6060, and it passed the 1% level’s significance test, which indicates that smart city construction has attracted significant foreign direct investment. Column (4) of Table 3 shows the estimated results of the impact of foreign direct investment and smart city construction on urban carbon emissions. The results show that the estimation coefficient of foreign direct investment ( fdi ) appears significantly negative. The estimation coefficient of smart is also significantly negative, and the absolute value of the smart estimation coefficient (0.0336) is smaller than that in the benchmark regression results (0.0436). According to the intermediary effect model, foreign direct investment ( fdi ) is the impact mechanism of smart city construction to reduce urban carbon emissions. In fact, the core task of smart city construction is to build the connectivity among all the things, comprehensively enhance the social governance level, and optimize the social service environment, which will virtually optimize the business environment and attract high-quality foreign capital. The entry of high-quality foreign capital will ameliorate the ecological environment of the host country through technology spillovers, green capital support and other means. Therefore, smart city building could facilitate the urban CO2 emission reduction by attracting high-quality foreign capital and hypothesis 3 is validated.

5.4.3. Test of Industrial Structure Effect

Theoretically, the smart city development will influence the carbon emissions through the industrial structure upgrading. Column (5) of Table 3 shows the regression results of the explained variable industrial structure upgrading ( structure ) in relation to the explanatory variable smart city construction ( smart ) and the control variables. Smart city construction did not significantly boost the upgrading of industrial structure. Column (6) of Table 3 shows the estimated outcomes of smart city construction impacts ( smart ), industrial structure upgrading ( structure ) and the control variables on urban carbon emissions. Although the estimated coefficient of industrial structure upgrading ( structure ) is negative, it is not significant. Additionally, the bootstrap test outcomes demonstrate that a 95% confidence interval of the indirect influence is [−0.0145, −0.0037], excluding 0, indicating that smart city construction stimulates carbon emission reduction through industrial structure upgrading, and thus hypothesis 4 is verified.

5.4.4. Test of the Combined Effect

In addition, smart city construction may also affect urban carbon emission reduction through the combined effect of technological innovation, foreign direct investment, and industrial structure upgrading. Therefore, this paper uses the interaction item ( i f s ) of technology innovation ( i n n o v a ), foreign direct investment ( f d i ), and industrial structure upgrading ( s t r u c t u r e ) as the explained variable and uses the intermediary models (3) and (4) for regression. The results are shown in Table 4, where i f s is equal to the cross-term of the variables i n n o v a , f d i , and s t r u c t u r e .
In column (1) of Table 4, the estimated coefficient of s m a r t is 0.0004, which passes the significance test, indicating that smart city construction has facilitated the combined effects of technology innovation ( i n n o v a ), foreign direct investment ( f d i ), and industrial structure upgrading ( s t r u c t u r e ). In column (2) of Table 4, the estimated coefficient of s m a r t is significantly negative, with the value of −0.0675, proving that the combined effects of technology innovation ( i n n o v a ), foreign direct investment ( f d i ), and industrial structure upgrading ( s t r u c t u r e ) partially serve as the intermediary path for smart city construction to contribute to urban carbon emissions reduction. The three paths have certain synergistic carbon reduction functions.

5.5. Robustness Test
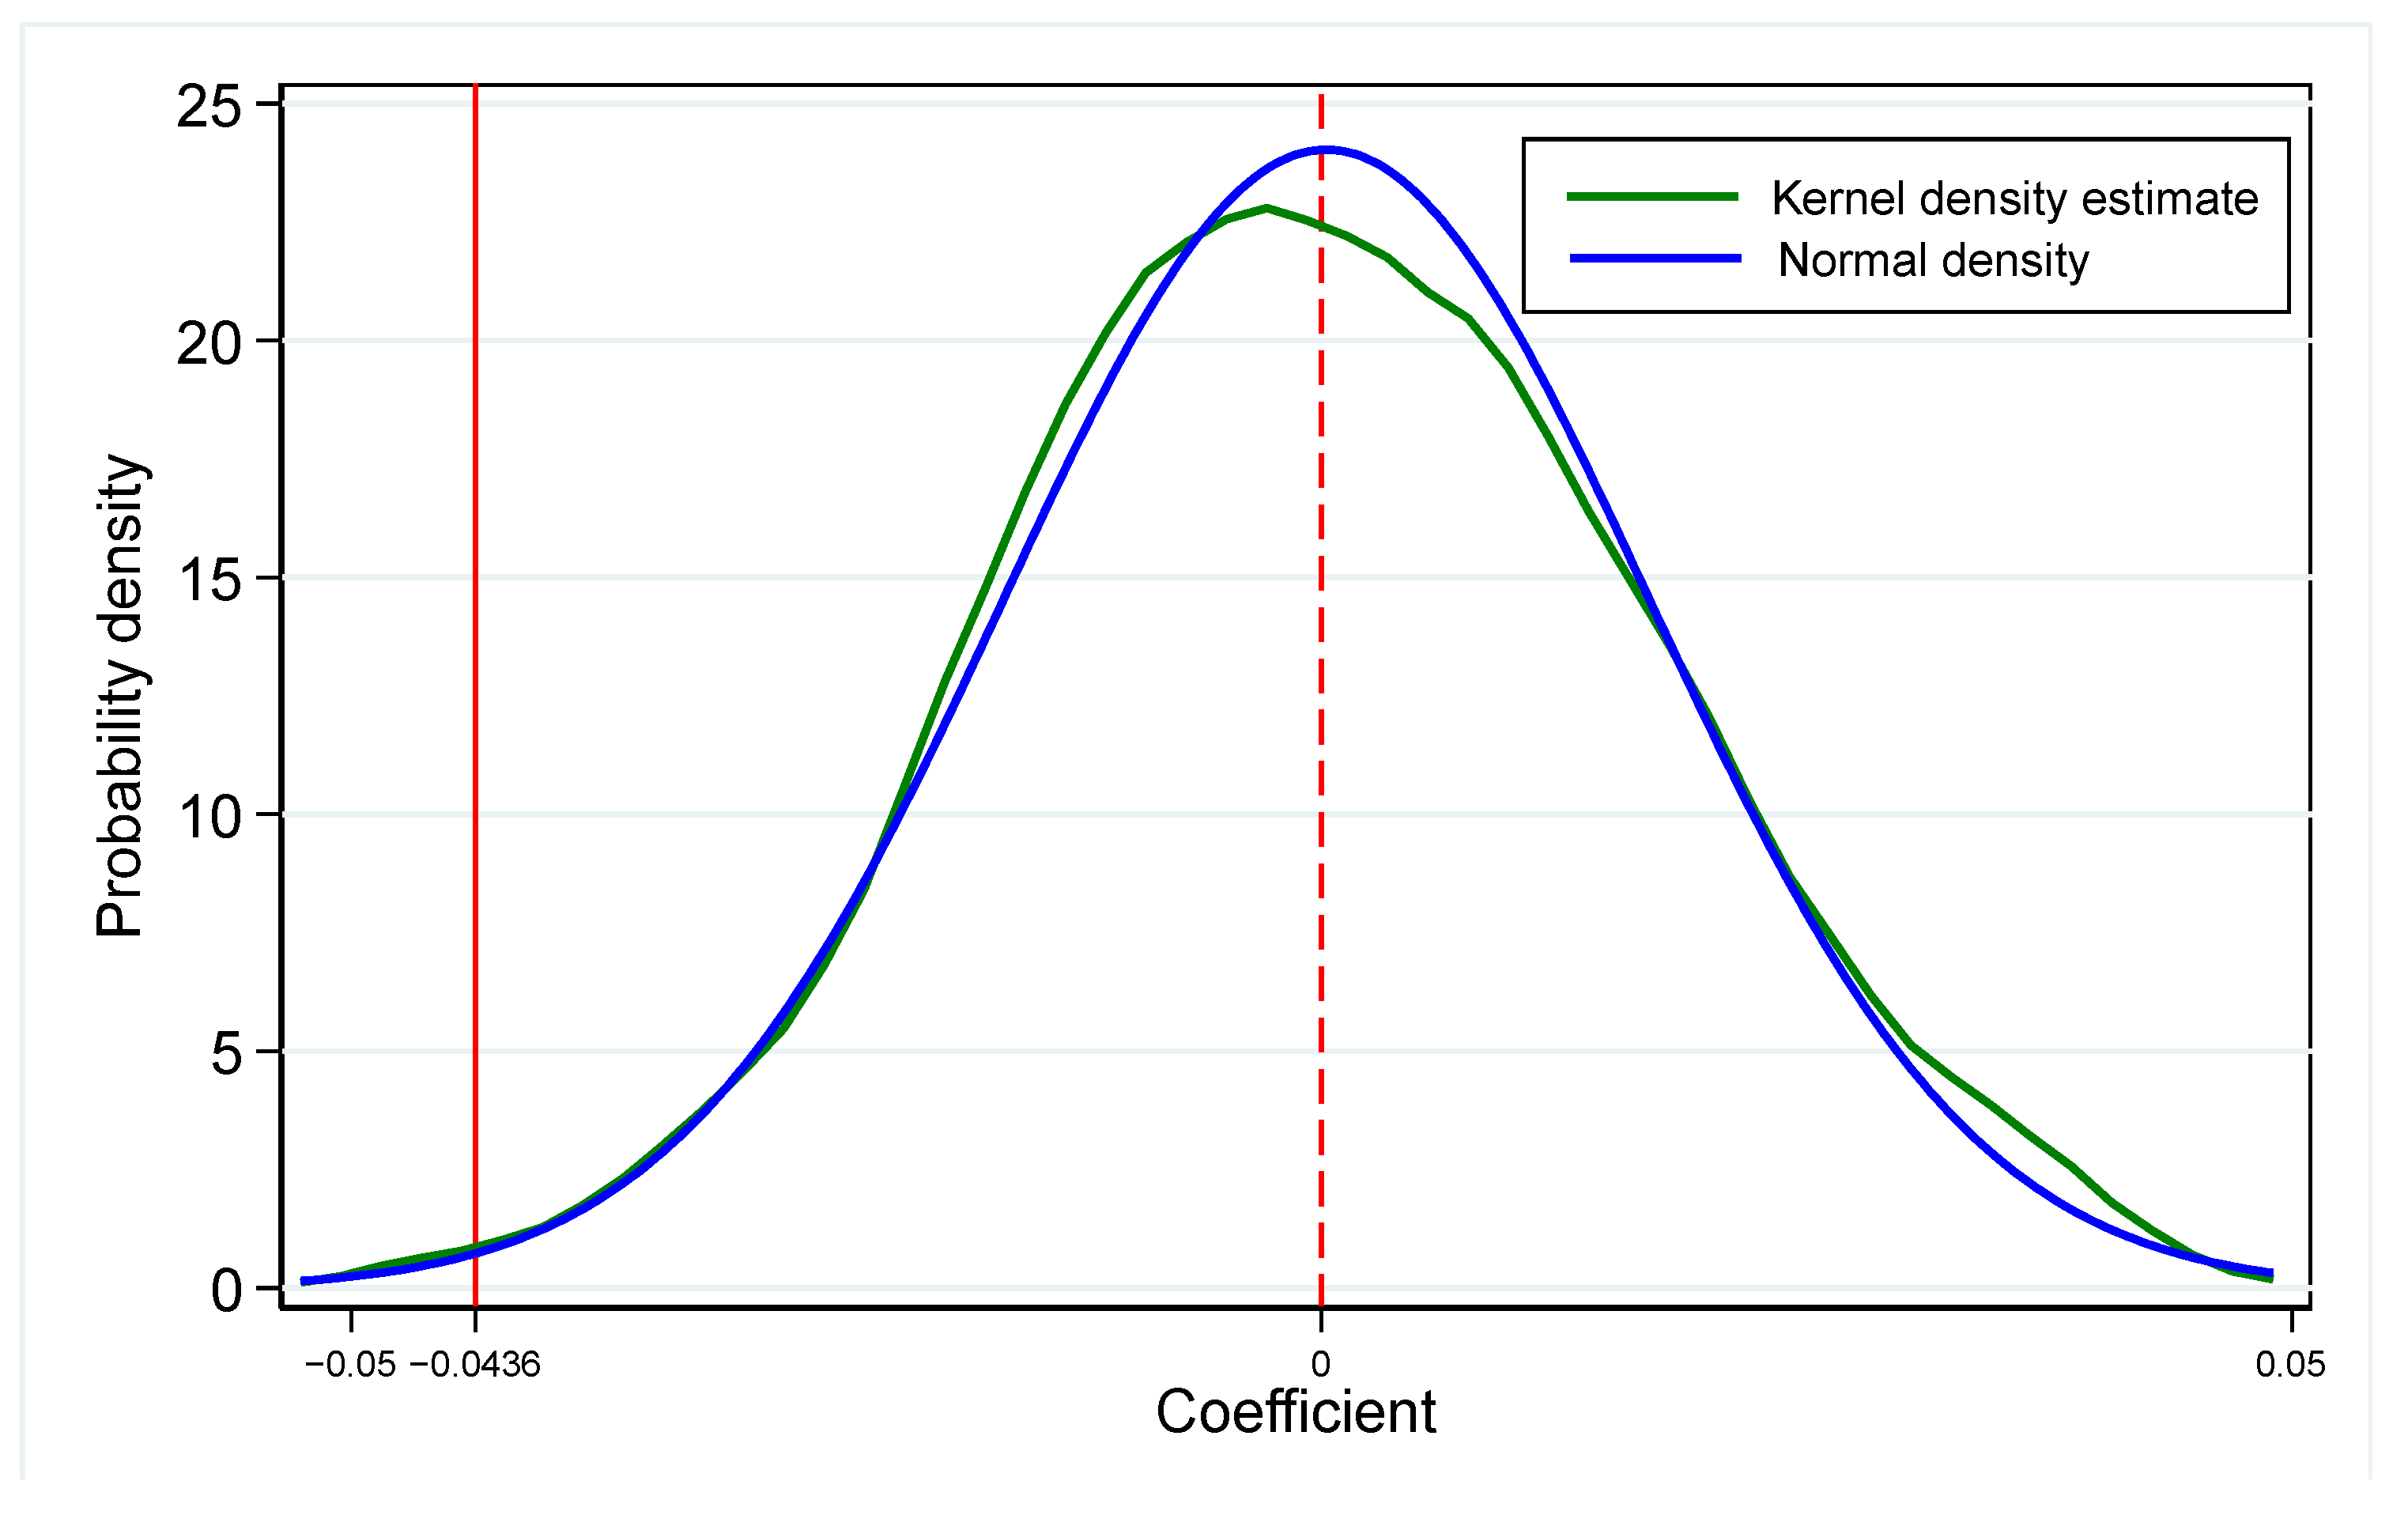
5.5.1. Placebo Test

In order to exclude the factors irrelevant to smart city construction, the randomized treatment group and the control group were used to verify the robustness of the benchmark regression conclusion [68]. The specific operations were as follows: All the sample cities and policy times were randomly and non-repeatedly sampled. Since the processing group in the original sample included 89 prefecture level cities, while the control group included 130 prefecture level cities, 89 cities and their corresponding policy time points were selected each time. The DID method requires at least one period of variables; therefore, only the 2007–2019 period was considered here. The 89 regions sampled each time were taken as the “pseudo”-treatment groups and the remaining cities as the “pseudo”-control groups. After 1000 times of repeated sampling, 1000 virtual regression results were obtained, thus 1000 estimation coefficients of the “pseudo”- s m a r t variable were obtained. Its nuclear density graph is shown as Figure 4. The mean value of the estimation coefficient of “pseudo”- s m a r t is near the value of 0 and follows the normal distribution. Moreover, the estimation coefficient of real s m a r t in the benchmark model (1) is −0.0436, which is significantly different from that of “pseudo”- s m a r t . The possibility that “smart city construction expedites carbon emission reduction due to random factors” can be ruled out, which also proves that “smart city pilot policy is conducive to mitigating carbon emissions” from the counterfactual perspective. The placebo test results show that the randomized treatment group and the control group method still find that smart city construction has a green carbon reduction effect, confirming the reliability of the benchmark conclusions.

5.5.2. Estimation Result Based on PSM-DID Method

The sample selection deviations may affect the effectiveness of policy evaluation. Thus, this paper further uses the propensity score matching (PSM) method to inspect the robustness of the benchmark regression results. The specific operations are as follows: the control variables in the benchmark model (1) were used as covariates to match the yearly trend scores, and then the samples located in the common value range were retained. Finally, based on these samples located in the common region, the benchmark model (1) was used for the multi-period DID test. Three matching methods were adopted: radius matching, kernel matching, and nearest neighbor matching. The regression outcomes are given in Table 5. Regardless of the matching method, the estimation coefficient of s m a r t is significantly negative at the 1% level, which once again confirms that smart city construction is conducive to decreasing urban carbon emissions. Therefore, after using the propensity score matching method, the benchmark regression conclusion is still robust.

5.5.3. Excluding the Impact of Other Relevant Policies in the Same Period

During the implementation of the smart city pilot policy, there may be other relevant policies that affect the carbon emissions of the pilot area, making the effect of the smart city pilot policy on carbon emission reduction biased. Here, the pilot policies for low carbon regions since 2010, the policies for energy conservation and emission reduction demonstration cities since 2011, and the pilot policies for carbon trading since 2013 are focused on. In order to eliminate the interference of these policies, column (1) of Table 6 shows the result of multi-period DID using the benchmark model (1) for samples covering only low-carbon pilot cities, column (2) shows samples covering only energy-saving and emission reduction demonstration cities, and column (3) shows samples covering only carbon trading pilot cities.
The results demonstrate that after considering the relevant policies in the same period, smart city development still reduces urban carbon emissions intensity to a remarkable extent, which demonstrates that the benchmark regression results are relatively robust.

6. Heterogeneity Analysis

6.1. Heterogeneity of Environmental Constraints

Different environmental constraints may lead to the different carbon emission reduction effects of smart city construction. In this paper, whether a city belongs to the “two control zones” (TCZ) is taken as the criterion to judge the strength of environmental constraints. The cities located in the “two control zones (TCZ)” are regarded as being in strong environmental constraint areas, and those located in non-“two control zones (TCZ)” are regarded as being in weak environmental constraint areas. The “two control zones” (TCZ), namely the acid rain control zone and the sulfur dioxide control zone, are the first air pollution control zones in China with the primary objective of reducing carbon dioxide emissions. The two classed control areas are mainly dependent on the official guidelines of the State Council on issues related to acid rain control areas and sulfur dioxide control areas. At present, the “two control areas” include all or parts of 14 provinces, autonomous regions, and municipalities directly under the central government, including Beijing. This paper takes whether the region is in the “two control zone” as the standard to measure environmental constraints. Since the main sources of carbon dioxide and sulfur dioxide are the burning of fossil fuels, such as coal and oil, cities in TCZ are more constrained than those in non-TCZ. Columns (1) and (2) of Table 7 report the regression results of samples located in areas with strong environmental constraints and those in areas with weak environmental constraints. The carbon emission intensity in areas with strong environmental constraints decreased by about 3.24% on average after the implementation of the smart city pilot policy, and the estimated coefficient was significantly negative at the level of 1%. However, the carbon emission reduction effect in areas with weak environmental constraints is not significant after the implementation of the smart city pilot policy. This shows that the carbon emission reduction effect of smart city construction is greater in areas with strong environmental constraints, which is consistent with the research conclusions of [69]. A possible reason may be that when the environmental constraints are stricter, the local governments face greater environmental pressure and work harder to protect the environment, fully embracing the carbon dioxide emission reduction effects of smart city development.

6.2. Heterogeneity of Industrial Base

Whether the sample cities belong to the old industrial bases may affect the CO2 emission reduction impact. On the basis of the National Plan for the Adjustment and Reconstruction of Old Industrial Bases (2013–2022), all sample cities are divided into two subsamples: old industrial bases and non-industrial bases. Additionally, the regression is conducted based on the benchmark model (1). The old industrial bases were built by the central government many years ago and are industrial bases where heavy industrial enterprises are grouped. As old industrial bases are usually responsible for supplies of major technical equipment on a national scale, they are generally characterized by high pollution and high energy consumption. Whether the smart city pilot policy can significantly decrease carbon emission intensity is related to the high-quality development of old industrial bases.
Columns (1) and (2) of Table 8 report the carbon dioxide emission impacts of old industrial bases and non-old industrial bases, respectively. The estimation coefficient of smart is very significant for non-old industrial bases but not significant for old industrial bases, which is consistent with the research conclusion of Shao et al. [70]. This may be because cities’ economic development is often focused on old industrial bases, which rely excessively on heavy industry, resulting in a single industrial structure, low technical efficiency, slow industrial transformation and upgrading, and local informatization and industrialization that are not deeply integrated, which restricts the effectiveness of the smart city pilot policy.

6.3. Heterogeneity of Resource Endowment

The region’s resource endowment may affect carbon dioxide emission reduction. The samples were divided into two groups, namely resource-based cities and non-resource-based cities, and benchmark regression was conducted, respectively. The results are placed in the columns (1) and (2) of Table 9. The resource-based cities are classified according to the National Sustainable Development Plan for Resource based Cities (2013–2020) issued by the State Council. These are cities with mineral resources, forests, and other resources that are developed and processed as the main industries. It can be seen that in non-resource-based cities, smart city construction has had a significant inhibitory effect on the carbon emission intensity at the 1% significance level, but the carbon emission governance effect of the pilot policy for resource-based cities is not significant. This conclusion is consistent with the research results of Yu et al. [71]. The reason for this is that resource-based cities rely too much on the natural resources. Most of their economic pillars involve high energy consumption and are high pollution resource-based industries. This economic model has caused a significant consumption of resources, and urban development has fallen into the so-called “resource curse”. Resource-based cities lack sufficient environmental governance funds and fail to truly implement the concept of ecological governance, so the smart city pilot policy does not have the expected carbon emissions reduction effect in resource-based cities.

7. Conclusions and Policy Recommendations

7.1. Conclusions

Smart city construction is an important measure to expedite the green and low-carbon transformation of the urban economy and accelerate the construction of ecological society. In this paper, the implementation of the smart city pilot policy is regarded as a quasi-natural experiment of smart city construction. On the basis of China’s cities panel data from 2006 to 2020, the multi-period DID method is adopted to explore the carbon emission reduction effect of smart city construction, verify the carbon emission reduction mechanism, and analyze the carbon emission reduction heterogeneity characteristics.
The main conclusions of this study are as follows:
(1)
Smart city construction effectively attenuates carbon emission intensity. Compared with non-pilot cities, smart city construction reduces the carbon emission intensity of pilot cities by 4.36% on average, which shows that China’s smart city pilot policy has achieved remarkable success. This provides experience and reference for relevant decision-making departments to further increase smart city construction and also opens up a new path for China’s green growth.
(2)
The carbon dioxide emission reduction impact is lagging and sustainable. The reduction influence is not obvious during the initial stages of policy implementation but gradually increases during the third year after policy implementation. This shows that the construction of the smart city needs continuous promotion and accumulation over time, instead of expecting instant success. It is necessary to fully realize that smart city construction is a long-term process, and the top-level design and implementation path of smart cities needs to be more long-term and sustainable.
(3)
Smart city construction mainly aims to reduce urban carbon emissions by accelerating technology innovation, introducing foreign capital, and accelerating industrial structure upgrading. The internal black box of smart city construction to facilitate regional low-carbon transformation and development has been explored, which is conducive to fully releasing the green functions of smart city construction.
(4)
Due to the different resource endowments, environmental carrying capacity, and economic development stages in different regions, the impact of smart city construction on urban carbon emissions is characterized by heterogeneity. In areas with strong environmental constraints, non-old industrial base cities, and non-resource-based cities, smart city construction has a more obvious inhibitory effect on urban carbon emissions, which indicates that in the execution process of the pilot policy, it is necessary to adjust measures to local conditions and fully think over the heterogeneity of economic and social development in various regions.

7.2. Policy Recommendations

Based on the research conclusions, this paper proposes the following policy recommendations.
(1)
Scale up the pilot scope of smart cities in an orderly manner. Smart city construction has significant carbon emission reduction effects, effectively decreasing the carbon dioxide emission intensity of pilot areas and affirming correctness as a new urban development strategy. Therefore, it is necessary to summarize and popularize experience and policies in more regions. It is better to follow the gradual promotion mode of “pilot first and then promotion”, summarize the successful experiences and practices of the pilot cities in a timely manner, constantly refine the technical standards system of smart city construction, replicate and promote them to other regions, and gradually explore a smart low-carbon transformation path with Chinese characteristics.
(2)
Deepen transmission channels, improve the technology innovation, enhance the attraction to foreign capital, and accelerate the upgrading of industrial structure. The mechanism analysis shows that the carbon emission reduction effect of smart city construction mainly comes from the promotion of technology innovation, the introduction of foreign direct investment, and the optimization and upgrading of the industrial structure. Therefore, the government should continue to implement the innovation-driven development strategy, expand high-level opening up, enhance foreign investment attraction, increase industrial restructuring, focus on supporting the development of low energy consumption and environmental protection industries, gradually establish a low-carbon industrial system, formulate and improve the development plan of smart cities, and organically integrate “wisdom” and “green”, so as to give full play to the carbon emission reduction effect of smart cities.
(3)
The implementation of the smart city pilot policy needs to be carried out according to local conditions and differences. The research results show that in the areas with strong environmental constraints, non-old industrial base cities, and non-resource-based cities, the CO2 emission reduction effect is much stronger. Therefore, in the process of promoting smart city construction, it is necessary to combine local resource investment, industrial foundations, the environmental carrying capacity, and other factors to remain in line with the national investment. Each region can focus on smart transportation, smart government, smart governance, smart environmental protection, and other aspects to boost smart city construction. The formulation and implementation of smart city pilot policies should not be rigidly uniform.
(4)
Smart city construction needs long-term adherence. The dynamic effect model results show that smart city construction will only play a role in carbon emission reduction after a period of implementation. Therefore, smart city construction requires long-term preparation, continuous efforts, and the continuity and the stability of the policies.

Author Contributions

All authors contributed to the study conception and design. Conceptualization: L.Q.; methodology: L.Q. and X.X.; material preparation, data collection and analysis: L.Q., Y.S. and Y.Z.; supervision: L.Q. and Y.S.; writing—review and editing: L.Q., Y.S. and D.M. All authors have read and agreed to the published version of the manuscript.

Funding

This work was supported by the Key Project of Excellent Youth Support Program of University in Anhui Province (Grant No. gxyqZD2021028), the Anhui Polytechnic University Research Projects (Grant No. Xjky2020104; Xjky2022134; Xjky2022125; Xjky2022137), and the Social Science Innovation and Development research project of Anhui Province (Grant No. 2018CX111).

Institutional Review Board Statement

Not applicable.

Informed Consent Statement

Not applicable.

Data Availability Statement

The datasets used and/or analyzed during the current study are available from the corresponding author upon reasonable request.

Conflicts of Interest

The authors declare no conflict of interest.

References

  1. Dhakal, S. GHG Emissions from Urbanization and Opportunities for Urban Carbon Mitigation. Curr. Opin Environ. Sustain. 2010, 2, 277–283. [Google Scholar] [CrossRef]
  2. Kammen, D.M.; Sunter, D.A. City-integrated Renewable Energy for Urban Sustainability. Science 2016, 352, 922–928. [Google Scholar] [CrossRef] [Green Version]
  3. Shan, Y.; Guan, D.; Hubacek, K.; Zheng, B.; Davis, S.J.; Jia, L.; Liu, J.; Liu, Z.; Fromer, N.; Mi, Z.; et al. City-level Climate Change Mitigation in China. Sci. Adv. 2018, 4, eaaq0390. [Google Scholar] [CrossRef] [PubMed] [Green Version]
  4. Fiorini, L.; Zullo, F.; Marucci, A.; Romano, B. Land Take and Landscape Loss: Effect of Uncontrolled Urbanization in Southern Italy. J. Urban Manag. 2019, 8, 42–56. [Google Scholar] [CrossRef]
  5. Khanna, N.; Fridley, D.; Hong, L. China’s Pilot Low-carbon City Initiative: A Comparative Assessment of National Goals and Local Plans. Sustain. Cities Soc. 2014, 12, 110–121. [Google Scholar] [CrossRef]
  6. Clarkson, P.M.; Li, Y.; Pinnuck, M.; Richardson, G. The Valuation Relevance of Greenhouse Gas Emissions Under the European Union Carbon Emissions Trading Scheme. Eur. Account. Rev. 2015, 24, 551–580. [Google Scholar] [CrossRef]
  7. Scott, T.A.; Carter, D.P. Collaborative Governance or Private Policy Making? When Consultants Matter more than Participation in Collaborative Environmental Planning. J. Environ. Policy Plan. 2019, 21, 153–173. [Google Scholar] [CrossRef]
  8. Thi, V.T.M.; Vuong, T.H.; Hung, N.T.Q.; Ba, H.T.; Hue, N.K.; Ky, N.M. Fostering Low-carbon Industrial Parks in Vietnam: Establishment and Application of an Index System for Trang Bang Industrial Park. IOP Conf. Ser. Earth Environ. Sci. 2022, 1087, 12041. [Google Scholar] [CrossRef]
  9. Liu, L.; Zhao, Z.; Zhu, R. Can National Environmental Protection Supervision and Control Have a Lasting Impact on Corporate Production Efficiency?—An Empirical Study Based on the Multi-phase Difference-in-difference Model. Environ. Sci. Pollut. Res. 2022, 29, 56136–56153. [Google Scholar] [CrossRef]
  10. Liu, L.; Zhang, Y.; Liu, B.; Xiu, P.; Sun, L. How to Achieve Carbon Neutrality: From the Perspective of Innovative City Pilot Policy in China. Int. J. Environ. Res. Public Health 2022, 19, 16539. [Google Scholar] [CrossRef]
  11. Albino, V.; Berardi, U.; Dangelico, R.M. Smart Cities: Definitions, Dimensions, Performance, and Initiatives. J. Urban Technol. 2015, 22, 3–21. [Google Scholar] [CrossRef]
  12. Dinca, G.; Milan, A.A.; Andronic, M.L.; Pasztori, A.M.; Dinca, D. Does Circular Economy Contribute to Smart Cities’ Sustainable Development? Int. J. Environ. Res. Public Health 2022, 19, 37627. [Google Scholar] [CrossRef]
  13. Quijano-Sanchez, L.; Cantador, I.; Cortes-Cediel, M.E.; Gil, O. Recommender Systems for Smart Cities. Inform. Syst. 2020, 92, 101545. [Google Scholar] [CrossRef]
  14. Lim, Y.; Edelenbos, J.; Gianoli, A. Identifying the Results of Smart City Development: Findings from Systematic Literature Review. Cities 2019, 95, 102397. [Google Scholar] [CrossRef]
  15. Millimet, D.L.; Roy, J. Empirical Tests of the Pollution Haven Hypothesis when Environmental Regulation is Endogenous. J. Appl. Econ. 2015, 31, 652–677. [Google Scholar] [CrossRef]
  16. Liu, K.; Lin, B.Q. Research on Influencing Factors of Environmental Pollution in China: A Spatial Econometric Analysis. J. Clean. Prod. 2019, 206, 356–364. [Google Scholar] [CrossRef]
  17. Tang, L.; Wu, J.Q.; Yu, L.; Bao, Q. Carbon Allowance Auction Design of China’s Emissions Trading Scheme: A Multi-agent Based Approach. Energy Policy 2017, 102, 30–40. [Google Scholar] [CrossRef]
  18. Sheng, P.F.; Guo, X.H. The Long-run and Short-run Impacts of Urbanization on Carbon Dioxide Emissions. Econ. Model. 2016, 53, 208–215. [Google Scholar] [CrossRef]
  19. Ahmed, Z.; Wang, Z.H.; Ali, S. Investigating the Non-linear Relationship between Urbanization and CO2 Emissions: An Empirical Analysis. Air Qual. Atmos. Health 2019, 12, 945–953. [Google Scholar] [CrossRef]
  20. Dong, B.Y.; Ma, X.J.; Zhang, Z.L.; Zhang, H.B.; Chen, R.M.; Song, Y.Q.; Shen, M.C.; Xiang, R.B. Carbon Emissions, The Industrial Structure and Economic Growth: Evidence from Heterogeneous Industries in China. Environ. Pollut. 2020, 262, 114322. [Google Scholar] [CrossRef]
  21. Huang, C.; Wang, J.W.; Wang, C.M.; Cheng, J.H.; Dai, J. Does Tourism Industry Agglomeration Reduce Carbon Emissions? Environ. Sci. Pollut. Res. 2021, 28, 30278–30293. [Google Scholar] [CrossRef]
  22. Liu, X.; Bae, J. Urbanization and Industrialization Impact of CO2 Emissions in China. J. Clean. Prod. 2018, 172, 178–186. [Google Scholar] [CrossRef]
  23. Bibri, S.E.; Krogstie, J. Smart Sustainable Cities of the Future: An Extensive Interdisciplinary Literature Review. Sustain. Cities Soc. 2017, 31, 183–212. [Google Scholar] [CrossRef]
  24. Sarwar, S. Role of Urbanization and Urban Income in Carbon Emissions: Regional Analysis of China. Appl. Ecol. Environ. Res. 2019, 17, 10303–10311. [Google Scholar] [CrossRef]
  25. Muñoz, P.; Zwick, S.; Mirzabaev, A. The Impact of Urbanization on Austria’s Carbon Footprint. J. Clean. Prod. 2020, 263, 121326. [Google Scholar] [CrossRef]
  26. Zhang, S.; Li, Z.; Ning, X.; Li, L. Gauging the Impacts of Urbanization on CO2 Emissions from the Construction Industry: Evidence from China. J. Environ. Manag. 2021, 288, 112440. [Google Scholar] [CrossRef] [PubMed]
  27. Feng, D.; Wang, Y.; Su, B.; Hua, Y.; Zhang, Y. The Process of Peak CO2 Emissions in Developed Economies: A Perspective of Industrialization and Urbanization. Resour. Conserv. Recycl. 2019, 141, 61–75. [Google Scholar]
  28. Chikaraishi, M.; Fujiwara, A.; Kaneko, S.; Poumanyvong, P.; Komatsu, S.; Kalugin, A. The Moderating Effects of Urbanization on Carbon Dioxide Emissions: A Latent Class Modeling Approach. Technol. Forecast. Soc. 2015, 90, 302–317. [Google Scholar] [CrossRef]
  29. Echeverri, L.G. Investing for Rapid Decarbonization in Cities. Curr. Opin. Environ. Sustain. 2018, 30, 42–51. [Google Scholar] [CrossRef]
  30. Wells, L.; Rismanchi, B.; Aye, L. A Review of Net Zero Energy Bildings with Reflections on the Australian Context. Energy Build. 2018, 158, 616–628. [Google Scholar] [CrossRef]
  31. Hast, A.; Syri, S.; Lekavicius, V.; Galinis, A. District Heating in Cities as a Part of Low-carbon Energy System. Energy 2018, 152, 627–639. [Google Scholar] [CrossRef]
  32. Giest, S. Big Data Analytics for Mitigating Carbon Emissions in Smart Cities: Opportunities and Challenges. Eur. Plan. Stud. 2017, 25, 941–957. [Google Scholar] [CrossRef] [Green Version]
  33. Riadh, A.-D. Dubai the Sustainable, Smart City. Renew. Energy Environ. Sustain. 2022, 7, 1–12. [Google Scholar]
  34. Contreras, G.; Platania, F. Economic and Policy Uncertainty in Climate Change Mitigation: The London Smart City Case Scenario. Technol. Forecast. Soc. 2019, 142, 384–393. [Google Scholar] [CrossRef]
  35. Bracco, S.; Delfino, F.; Laiolo, P.; Morini, A. Planning & Open-air Demonstrating Smart City Sustainable Districts. Sustainability 2018, 10, 4636. [Google Scholar]
  36. Ruggieri, R.; Ruggeri, M.; Vinci, G. Efficient Energy and Electric Transport in a Smart City: Evaluation of Sustainability and Competitiveness. In Proceedings of the 2020 IEEE International Conference on Environment and Electrical Engineering and 2020 IEEE Industrial and Commercial Power Systems Europe (EEEIC/I&CPS Europe), Madrid, Spain, 9–12 June 2020; pp. 1–4. [Google Scholar]
  37. Hoang, A.T.; Pham, V.V.; Nguyen, X.P. Integrating renewable sources into energy system for smart city as a sagacious strategy towards clean and sustainable process. J. Clean. Prod. 2021, 305, 127161. [Google Scholar] [CrossRef]
  38. Zawieska, J.; Pieriegud, J. Smart city as a tool for sustainable mobility and transport decarbonization. Transp. Policy 2018, 63, 39–50. [Google Scholar] [CrossRef]
  39. Vaidya, B.; Mouftah, H.T. Smart electric vehicle charging management for smart cities. IET Smart Cities 2020, 2, 4–13. [Google Scholar] [CrossRef]
  40. Ruggieri, R.; Ruggeri, M.; Vinci, G.; Poponi, S. Electric mobility in a smart city: European overview. Energies 2021, 14, 315. [Google Scholar] [CrossRef]
  41. Oralhan, Z.; Oralhan, B.; Yiğit, Y. Smart city application: Internet of things (IoT) technologies based smart waste collection using data mining approach and ant colony optimization. Int. Arab. J. Inf. Technol. 2017, 14, 423–427. [Google Scholar]
  42. Kylili, A.; Fokaides, P.A. European smart cities: The role of zero energy buildings. Sustain. Cities Soc. 2015, 15, 86–95. [Google Scholar] [CrossRef]
  43. Caponio, G.; Massaro, V.; Mossa, G.; Mummolo, G. Strategic energy planning of residential buildings in a smart city: A system dynamics approach. Int. J. Eng. Bus. Manag. 2015, 7, 20. [Google Scholar] [CrossRef]
  44. Preston, S.; Mazhar, M.U.; Bull, R. Citizen engagement for co-creating low carbon smart cities: Practical Lessons from Nottingham City Council in the UK. Energies 2020, 13, 6615. [Google Scholar] [CrossRef]
  45. Caragliu, A.; Del Bo, C.F. Smart innovative cities: The impact of Smart City policies on urban innovation. Technol. Forecast. Soc. Chang. 2019, 142, 373–383. [Google Scholar] [CrossRef]
  46. Wang, J.X.; Deng, K. Impact and mechanism analysis of smart city policy on urban innovation: Evidence from China. Econ. Anal. Policy 2022, 73, 574–587. [Google Scholar] [CrossRef]
  47. Qian, Y.; Liu, J.; Cheng, Z.; Forrest, J. Does the smart city policy promote the green growth of the urban economy? Evidence from China. Environ. Sci. Pollut. Res. 2021, 28, 66709–66723. [Google Scholar] [CrossRef] [PubMed]
  48. Li, L.; Zheng, Y.; Zheng, S.; Ke, H. The new smart city programme: Evaluating the effect of the internet of energy on air quality in China. Sci. Total Environ. 2020, 714, 136380. [Google Scholar] [CrossRef]
  49. Feng, Y.; Hu, S. The effect of smart city policy on urban Haze pollution in China: Empirical evidence from a quasi-natural experiment. Pol. J. Environ. Stud. 2022, 31, 2083–2092. [Google Scholar] [CrossRef]
  50. Chu, Z.; Cheng, M.; Yu, N.N. A smart city is a less polluted city. Technol. Forecast. Soc. Chang. 2021, 172, 121037. [Google Scholar] [CrossRef]
  51. Wang, K.L.; Pang, S.Q.; Zhang, F.Q.; Miao, Z.; Sun, H.P. The impact assessment of smart city policy on urban green total-factor productivity: Evidence from China. Environ. Impact Assess. 2022, 94, 106756. [Google Scholar] [CrossRef]
  52. Jiang, H.; Jiang, P.; Wang, D.; Wu, J. Can smart city construction facilitate green total factor productivity? A quasi-natural experiment based on China’s pilot smart city. Sustain. Cities Soc. 2021, 69, 102809. [Google Scholar] [CrossRef]
  53. Yu, Y.; Zhang, N. Low-carbon city pilot and carbon emission efficiency: Quasi-experimental evidence from China. Energy Econ. 2021, 96, 105125. [Google Scholar] [CrossRef]
  54. Cavada, M.; Hunt, D.; Rogers, C. Do smart cities realise their potential for lower carbon dioxide emissions? Proc. Inst. Civ. Eng. Eng. Sustain. 2016, 169, 243–252. [Google Scholar] [CrossRef]
  55. Yigitcanlar, T.; Kamruzzaman, M.D. Does smart city policy lead to sustainability of cities? Land Use Policy 2018, 73, 49–58. [Google Scholar] [CrossRef]
  56. Heuse, P.; Zimmer, H. The Europe 2020 strategy. Econ. Rev. 2011, 2, 21–45. [Google Scholar]
  57. Witkowski, K. Internet of Things, Big Data, Industry 4.0-Innovative Solutions in Logistics and Supply Chains Management. Procedia Eng. 2017, 182, 763–769. [Google Scholar] [CrossRef]
  58. Zhang, Y.; Zhang, S. The impacts of GDP, trade structure, exchange rate and FDI inflows on China’s carbon emissions. Energy Policy 2018, 120, 347–353. [Google Scholar] [CrossRef]
  59. Mahmood, H.; Alkhateeb, T.T.Y.; Furqan, M. Industrialization, urbanization and CO2 emissions in Saudi Arabia: Asymmetry analysis. Energy Rep. 2020, 6, 1553–1560. [Google Scholar] [CrossRef]
  60. Beck, T.; Levine, R.; Levkov, A. Big bad banks? The winners and losers from bank deregulation in the United States. J. Financ. 2010, 65, 1637–1667. [Google Scholar] [CrossRef] [Green Version]
  61. Baron, R.M.; Kenny, D.A. The moderator–mediator variable distinction in social psychological research: Conceptual, strategic, and statistical considerations. J. Pers. Soc. Psychol. 1986, 51, 1173–1182. [Google Scholar] [CrossRef]
  62. Feng, H.; Rui, X. Does the concentration of producer services reduce carbon emissions? Spatial econometric analysis of panel data of cities at and above the prefecture level in China. J. Quant. Tech. Econ. 2017, 34, 40–57. [Google Scholar]
  63. Grossman, G.M.; Krueger, A.B. Economic growth and the environment. Q. J. Econ. 1995, 110, 353–377. [Google Scholar] [CrossRef] [Green Version]
  64. Xu, B.; Lin, B. Investigating spatial variability of CO2 emissions in heavy industry: Evidence from a geographically weighted regression model. Energy Policy 2021, 149, 112011. [Google Scholar] [CrossRef]
  65. Guo, Q.; Wang, Y.; Dong, X. Effects of smart city construction on energy saving and CO2 emission reduction: Evidence from China. Appl. Energy 2022, 313, 118879. [Google Scholar] [CrossRef]
  66. Zhang, Y.-J.; Liu, Z.; Zhang, H.; Tan, T.-D. The impact of economic growth, industrial structure and urbanization on carbon emission intensity in China. Nat. Hazards 2014, 73, 579–595. [Google Scholar] [CrossRef]
  67. Halkos, G.E.; Paizanos, E.A. The effects of fiscal policy on CO2 emissions: Evidence from the USA. Energy Policy 2016, 88, 317–328. [Google Scholar] [CrossRef]
  68. Cai, X.; Lu, Y.; Wu, M.; Yu, L. Does environmental regulation drive away inbound foreign direct investment? Evidence from a quasi-natural experiment in China. J. Dev. Econ. 2016, 123, 73–85. [Google Scholar] [CrossRef]
  69. Xu, T.; Kang, C.; Zhang, H. China’s efforts towards carbon neutrality: Does energy-saving and emission-reduction policy mitigate carbon emissions? J. Environ. Manag. 2022, 316, 115286. [Google Scholar] [CrossRef]
  70. Shao, H.; Cheng, J.; Wang, Y.; Li, X. Can Digital Finance Promote Comprehensive Carbon Emission Performance? Evidence from Chinese Cities. Int. J. Environ. Res. Public Health 2022, 19, 10255. [Google Scholar] [CrossRef]
  71. Yu, Y.; Zhang, N. Does smart city policy improve energy efficiency? Evidence from a quasi-natural experiment in China. J. Clean. Prod. 2019, 229, 501–512. [Google Scholar] [CrossRef]
Figure 1. Mechanisms of action of smart city construction on urban carbon dioxide emission reduction.
Sustainability 15 05085 g001
Figure 2. Carbon emission trends of pilot cities (treatment groups) and non-pilot cities (control groups).
Sustainability 15 05085 g002
Figure 3. Parallel trend test.
Sustainability 15 05085 g003
Figure 4. Placebo test results.
Sustainability 15 05085 g004
Table 1. Descriptive statistics results.
VariableFull SampleControl GroupTreatment Group
SampleMSDSampleMSDSampleMSD
l n c a r b o n 3285−4.06250.57911950−4.01050.56641335−4.09500.5959
l n p g d p 32851.18030.706319501.08630.658013351.31780.7507
c o n s u m p 32850.37300.109319500.37370.113213350.37210.1032
d e n s i t y 32850.04240.034519500.03920.033613350.04710.0353
u r b a n 32850.40500.296419500.37960.293413350.44190.2969
f i s c a l 32850.06500.023019500.06160.027613350.06990.0319
i n n o v a 328525.6469245.3006195017.1465143.3207133538.0631343.3075
f d i 328539.9929122.5896195020.847139.6656133567.9587182.6987
s t r u c t u r e 32851.58801.194219501.71441.373613351.40130.8295
Table 2. Benchmark regression results.
(1)(2)(3)(4)(5)(6)(7)
s m a r t −0.0669 ***−0.0424 ***−0.0400 ***−0.0400 ***−0.0412 ***−0.0436 ***0.0278 ***
(−6.8858)(−5.6456)(−5.3837)(−5.3827)(−5.5745)(−5.9207)(4.5276)
l n p g d p −0.5958 ***−0.5405 ***−0.5405 ***−0.5436 ***−0.5414 ***0.5508 ***
(−45.5585)(−37.3606)(−37.3544)(−37.8055)(−37.7839)(56.3577)
c o m s u m p 0.3775 ***0.3775 ***0.3689 ***0.3665 ***−0.6583 ***
(8.5028)(8.5013)(8.3607)(8.3399)(−19.4297)
d e n s i t y −0.01250.16950.13260.0371
(−0.0635)(0.8611)(0.6759)(0.2109)
u r b a n 0.0712 ***0.0639 ***−0.0484 ***
(6.5862)(5.8811)(−3.0019)
f i s c a l 0.6556 ***−0.1551 *
(5.0118)(−1.7111)
_cons−3.4956 ***−3.3268 ***−3.4656 ***−3.4650 ***−3.4934 ***−3.5225 ***1.0720 ***
(−396.8900)(−406.8000)(−190.3000)(−174.2300)(−172.8200)(−168.0800)(10.8786)
Time FE
City FE
Observations3285328532853285328532853285
R-squared0.90430.90650.90650.90650.90780.90850.9677
Note: t-statistics in parentheses; *** p < 0.01, * p < 0.1; “√” is “control”.
Table 3. Mechanism inspection.
(1)
innova
(2)
lncarbon
(3)
fdi
(4)
lncarbon
(5)
structure
(6)
lncarbon
s m a r t 1.3097 *−0.0379 ***24.6060 ***−0.0336 ***0.0081−0.0411 ***
(1.7804)(−5.3632)(6.3982)(−4.6346)(0.1897)(−5.7453)
i n n o v a −0.0022 ***
(−12.8365)
f d i −0.0004 ***
(−12.0132)
s t r u c t u r e −0.0012
(−0.3945)
Control variables
Time FE
City FE
_cons40.8856 ***−2.7433 ***45.5993 ***−3.5039 ***1.3931 ***−3.5181 ***
(5.6790)(−39.4274)(4.1703)(−169.1000)(11.5145)(−163.9600)
Observations328532853285328532853285
R-squared0.16230.91570.10530.91270.13090.9113
Note: t-statistics in parentheses; *** p < 0.01, * p < 0.1; “√” is “control”.
Table 4. Combined effect inspection.
(1)
ifs
(1)
lncarbon
s m a r t 0.0004 **
(2.2582)
−0.0675 ***
(−10.0618)
i f s −8.0484 ***
(−9.7727)
Control variables
Time FE
City FE
_cons0.0069 **
(2.2162)
1.1639 ***
(8.7464)
Observations32853285
R-squared0.09110.9238
Note: t-statistics in parentheses; *** p < 0.01, ** p < 0.05, “√” is “control”.
Table 5. PSM-DID regression results.
(1)
Radius Matching
(2)
Kernel Matching
(3)
Nearest Neighbor Matching
s m a r t −0.0389 ***−0.0366 ***−0.0361 ***
(−5.2958)(−4.9242)(−4.8697)
Control variables
Time FE
City FE
_cons−3.4720 ***−3.4805 ***−3.4930 ***
(−161.6300)(−160.4800)(−160.7800)
Observations301530453075
R-squared0.91530.91230.9118
Note: t-statistics in parentheses; *** p < 0.01, “√” is “control”.
Table 6. Considering relevant policies in the same period.
(1)
Samples Covering Only Low-Carbon Pilot Cities
(2)
Samples Covering Only Energy-Saving and Emission Reduction Demonstration Cities
(3)
Samples Covering Only Carbon Trading Pilot Cities
s m a r t −0.0923 ***−0.0839 **−0.1477 ***
(−5.6957)(−2.5198)(−8.1833)
Control variables
Time FE
City FE
_cons−3.5033 ***−3.5542 ***−3.7334 ***
(−227.9100)(−108.4200)(−220.3800)
Observations1260315540
R-squared0.85470.83830.9393
Note: t-statistics in parentheses; *** p < 0.01, ** p < 0.05; “√” is “control”.
Table 7. Heterogeneity of environmental constraints.
(1)
Strong Environmental Constraints
(2)
Weak Environmental Constraints
s m a r t −0.0324 ***−0.0411
(−3.8104)(−1.6557)
Control variables
Time FE
City FE
_cons−3.7487 ***−3.3332 ***
(−136.6500)(−76.4473)
Observations16951590
R-squared0.93820.8936
Note: t-statistics in parentheses; *** p < 0.01; “√” is “control”.
Table 8. Heterogeneity of industrial bases.
(1)
Old Industrial Bases
(2)
Non-Old Industrial Bases
s m a r t −0.0009−0.0563 ***
(−0.0897)(−5.7453)
Control variables
Time FE
City FE
_cons−3.3920 ***−3.5645 ***
(−121.07)(−127.76)
Observations11252160
R-squared0.93980.9004
Note: t-statistics in parentheses; *** p < 0.01; “√” is “control”.
Table 9. Heterogeneity of resource endowment.
(1)
Resource-Based Cities
(2)
Non-Resource-Based Cities
s m a r t −0.0032−0.0705 ***
(−0.3109)(−6.9646)
Control variables
Time FE
City FE
_cons−3.3863 ***−3.6210 ***
(−119.1100)(−115.8600)
Observations14101875
R-squared0.92140.9047
Note: t-statistics in parentheses; *** p < 0.01; “√” is “control”.
Disclaimer/Publisher’s Note: The statements, opinions and data contained in all publications are solely those of the individual author(s) and contributor(s) and not of MDPI and/or the editor(s). MDPI and/or the editor(s) disclaim responsibility for any injury to people or property resulting from any ideas, methods, instructions or products referred to in the content.

