Article

The Impact of AfCFTA on Welfare and Trade: Nigeria and South Africa in Light of Core Export Competences

by
Gabriel Mhonyera
* and
Daniel Francois Meyer
College of Business and Economics, University of Johannesburg, Johannesburg 2006, South Africa
*
Author to whom correspondence should be addressed.
Sustainability 2023, 15(6), 5090; https://doi.org/10.3390/su15065090
Submission received: 3 January 2023 / Revised: 3 March 2023 / Accepted: 10 March 2023 / Published: 13 March 2023
(This article belongs to the Section Economic and Business Aspects of Sustainability)

Abstract

:
The African Continental Free Trade Area (AfCFTA) entered into force in May 2019 after surpassing the required 22 ratifications. This article combines the decision support model (DSM) and the Global Trade Analysis Project (GTAP) computable general equilibrium (CGE) model to make quantitative assessments of the expected welfare and trade effects of the AfCFTA on Nigerian and South African sectors possessing sustained export potential within the AfCFTA member states. By specifying two scenarios of AfCFTA membership, the simulation results reveal positive welfare gains for Nigeria (USD 146.12 million) and South Africa (USD 1.46 billion), originating from the GTAP sectors identified with sustainable export opportunities in the AfCFTA member states. The trade deal is also expected to be net-trade-creating, with a net trade of USD 2.15 billion at the global level. The assessments in this article are valuable in informing trade policy in light of core export competencies and the size, growth and consistency of the import demand in AfCFTA countries. It is also the first time elements of a product-level export market analytical tool are harmonised with a CGE model in the welfare and trade assessments of regional and/or bilateral trade arrangements. Policymakers and export promotion associations in both Nigeria and South Africa are recommended to utilise the results found in this article as a point of departure in leveraging the welfare-improving sustained export opportunities identified within the AfCFTA.

1. Introduction

Validating a significant step towards expanding Africa’s regional integration and development agenda, the extraordinary summit of the African Union (AU), held in Kigali, Rwanda, on the 21st of March 2018, launched the African Continental Free Trade Area (AfCFTA). The AfCFTA is a flagship project of the AU’s Agenda 2063 [1]. Moreover, it is a strategic initiative in the context of industrialisation, as well as economic progress and advancement of the African continent. Negotiations to institute the AfCFTA were initiated in Addis Ababa, Ethiopia, in January of 2012 during the 18th ordinary session of the assembly of Heads of State and Government of the AU [2]. The Heads of State and Government reached a consensus on a roadmap for establishing the AfCFTA by the suggestive date of 2017.
It was during the 10th extraordinary summit of the AU assembly of Heads of State and Government where the agreement establishing the AfCFTA, the protocol on trade in goods, the protocol on trade in services, and the protocol on rules and procedures on the settlement of disputes were adopted and initially signed by 44 member states of the AU [3]. Interestingly, the largest economies in Africa, such as Nigeria and South Africa, were not part of the initial signatories to the AfCFTA. However, South Africa and four other AU members later signed the agreement at the 31st AU summit held on the 1st of July 2018 in Nouakchott, Mauritania, bringing the number of signatories to 49 [4]. By the end of March 2019, 52 countries, including Botswana and Zambia, had signed the consolidated text of the AfCFTA. Nigeria and Benin later signed the AfCFTA Agreement during the 12th extraordinary session of the assembly of the AU on the AfCFTA, held on the 7th of July 2019 in Niamey, Niger. This extraordinary session marked the launch of the operational phase of the AfCFTA [2].
AfCFTA covers a market of approximately 1.2 billion people and a Gross Domestic Product (GDP) of USD 3.4 trillion [5]. In addition, AfCFTA will gradually eliminate tariffs on intra-African trade, making it easier for African exporters to access the expanding continental market [6]. For instance, African exporters face an average tariff of 6.1% when they export within Africa. This is considerably higher than the average tariffs they face when they export to other destinations outside Africa. Projections from [5] further point out that, by eliminating tariffs, the AfCFTA has the potential to boost intra-African trade by 52.3%, and this will double if non-tariff barriers are also diminished.
The negotiations towards the AfCFTA are seen as an exceptional opportunity to usher in augmented economic growth and increased economic and trade opportunities for millions of African citizens [6]. Deepened regional integration of this nature can contribute considerably to poverty alleviation, employment creation and the promotion of equality. In this regard, apportioning the gains of the AfCFTA is vital, not merely for fairness reasons, but also to guarantee the functionality of the trade agreement for member states at distinct developmental phases. Furthermore, trade arrangements not grounded on a win–win approach are likely to remain unexecuted or collapse since members have little or no interest in their application [7].
In recent years, such perceived unfairness among member countries of similar regional bodies like the European Union (EU) and the North America Free Trade Agreement (NAFTA), has propelled some countries to either exit (Brexit, for instance) or call for radical transformation and reform (NAFTA, for example). In the case of the AfCFTA, Nigeria, South Africa, and other countries such as Botswana, expressed their reservations about the fairness and potential welfare and trade implications for businesses and people of their respective economies at the initial stages of the agreement.
However, it is not a secret that countries such as Nigeria and South Africa, considered the “big brothers”, have a strong significance in the African continent’s economic growth and development endeavours. Nigeria, in particular, accounts for about 18.06% of Africa’s GDP and is regarded as the largest economy in Africa as of 2020 [8]. Although the country experienced a recession in 2015, it is still arguably expected to improve the prospects of economic growth and development in the African continent. Furthermore, Nigeria is the most populated country in Africa and its population forms approximately 16% of the anticipated AfCFTA market coverage. On the other hand, South Africa, the third largest economy in Africa, accounting for 14.02% of the continent’s GDP, possesses a more diversified economic and industrial base than most of its African counterparts.
While Nigeria and South Africa are expected to achieve overall welfare and trade gains from the formation of the AfCFTA, the extant literature that has quantified the welfare and trade impacts of the formation of the AfCFTA [9,10,11,12,13,14] has not considered the respective members’ core export competences, and the size, growth and consistency of the import demand in AfCFTA countries. This is the gap that this article aims to occupy by assessing the welfare and trade impacts of the AfCFTA in light of Nigeria and South Africa’s core export competencies and the size, growth and consistency of the import demand in AfCFTA countries.
By combining Filters 1 and 2 of the decision support model (DSM) and the Global Trade Analysis Project (GTAP) computable general equilibrium (CGE) model, this article assesses the expected welfare and trade effects of the AfCFTA on Nigerian and South African sectors possessing sustained export potential in AfCFTA member states. Such an assessment is significant in informing trade policy by isolating the welfare and trade effects of the AfCFTA on sectors that promise the survival and growth of export initiatives between Nigeria, South Africa and the rest of the AfCFTA members. In terms of the scholarly information within the public domain, this is the first time elements of a product-level export market analytical tool are harmonised with a CGE model in welfare and trade assessments of regional and/or bilateral trade arrangements.

2. Literature Review

The fundamental economic intention of RTAs is to weaken trade impediments and liberalise the rules governing trade and investment between two or more trading nations [15]. This accelerates market access, which is extremely significant for export expansion, export proceeds, and investment. However, since the establishment of the World Trade Organization (WTO) in 1995, RTAs have expanded more rapidly, and they have developed into a considerable element of international trade [16]. This may be partially credited to the discontent with the multilateral trade negotiation process, as evidenced by the protracted completion and the controversial failure of the Doha round of negotiations. Moreover, RTAs can be negotiated and executed more swiftly than multilateral trade agreements.
Nonetheless, the perceived benefits of intra-regional trade initiatives, such as the AfCFTA, go beyond increased intra-African trade, leading to economic growth and development [17]. In fact, the AfCFTA is centred around re-establishing the geo-economic landscape of continental Africa and shedding the legacy of a more divided continent and fragmented markets. Hence, the genuine test of the trade arrangement will be how swiftly AU nations can expedite export diversification and product sophistication and make trade extra inclusive [18].

2.1. Theoretical Underpinnings

The debate on trade theories and the effects of international trade policies on the general welfare of trading nations has been prevalent since the era of the ancient Greeks. Free trade is fundamentally a theoretical concept in which the government imposes no tariff and non-tariff restrictions on trade [19]. On the opposite extreme is the policy of protectionism, which is a defensive trade policy aimed at eliminating the likelihood of external competition [20]. In reality, even those governments that generally embrace free trade policies still impose some measures to restrict imports and exports to a certain extent.
The theoretical foundation of this article is positioned within both the classical and neoclassical traditional international trade theories. Regardless of the school of thought, these trade theories declare that free trade benefits the trading countries, making it the best trade arrangement for the welfare of nations in solitude and collectively at a global level [21]. In advocating for free trade, Ref. [22] challenged the mercantilist policy, the main economic thinking of the 17th and 18th Centuries, based on maintaining a favourable trade balance by exporting more than you import. Ref. [22] put forward the theory of absolute advantage in which he argued that two countries can gain from trade by specialising in producing those products for which they have an absolute advantage and trade with each other. The theory moved away from mercantilism and implied core competencies and limited government involvement in the economy, and significantly reduced trade barriers.
Building on the absolute advantage theory, Ref. [23] introduced an important modification of the theory when the author observed that countries can still benefit from trade without clear absolute advantages. According to Ref. [23], what was important was the comparative advantage of each trading country in production. In other words, what matters is relative production efficiency. The theory of absolute and comparative advantage only considered labour as a factor of production [21]. Hence, the comparative advantage theory went through a series of important developments, some of which were due to John Stewart Mill, Alfred Marshal, Bertil Heckscher and Eli Ohlin, and Stolper and Samuelson.
Bertil Heckscher and Eli Ohlin, in particular, developed Ricardo’s doctrine of comparative advantage in the early 20th century by considering more production factors in the Heckscher–Ohlin (HO) theory [24]. The theory posits that a country will be a net exporter of those products utilising production factors that it possesses in relative abundance and a net importer of those products utilising production factors that the country has in relative less abundance [25]. Stolper and Samuelson developed this idea in their widely known Stolper–Samuelson factor price equalisation theorem. The theorem asserts that an ad valorem import tariff (in a two-commodity, two-factor country) will generate a more than proportionate increase in the price of the corresponding intensive factor in that particular industry [26]. Hence, free trade’s effect must equalise factor prices in the participating sectors.
Nonetheless, the law of comparative advantage is considered by many scholars to be the fundamental cornerstone of international trade theory. It remains one of the most significant and uncontested laws of economics [27]. However, the classical and neoclassical international trade theories are not free from shortcomings. For instance, the optimality of free trade asserted by classical and neo-classical orthodox international trade theories is inherently untestable as it compares people’s welfare in two countries. Hence, international trade theories either conflict with reality or take too general forms to be tested, and their side effects are seldom acknowledged [28].
In order to promote free trade and the irrefutable benefits it ushers in, trading parties negotiate and conclude free trade agreements (FTAs). Such trade arrangements include the AfCFTA, discussed in the previous sections of this article. It is essential to note that free trade in any form is only conceivable by means of trade agreements, which are a product of trade negotiations [29]. From this standpoint, the concept of free trade along with the ensuing free trade arrangements cannot be divorced from trade negotiations.
Therefore, on the negotiation side, the game theory can be employed to establish the rationale of why trading nations negotiate and conclude trade agreements. Game theory investigates mathematical representations of interpersonal rivalry and cooperation in a competitive situation [30]. In fact, it can be viewed as the art of strategy, or at the very least, the best decision-making of independent and competitive individuals in a strategic situation [31]. Hence, it logically follows that governments of trading nations also encounter situations resembling the dual-player game theory setting, well-known as the prisoner’s dilemma (PD) [32].
Each person in the PD acts to further his own self-interest. Because of this, each player pursues their fundamental strategy, or the course of action that guarantees them a bigger reward, regardless of what the other player does [33]. The PD is an oligopoly game in which each player’s actions have an impact on the rewards received by the other player [34]. Nevertheless, if each player sticks to their core approach, the result is a symmetric outcome in which each player is worse-off in comparison to if they had each chosen the alternative approach [35].
Due to the interconnectedness of the global economy, protectionist measures have negative impacts elsewhere [36]. In other words, protectionist policies enacted by one government will likely harm the economy of the receiving nation and create political costs for that nation’s administration [37]. If both governments elect to enact protectionist measures, the adverse impacts for the two countries, if not the two governments, will worsen [38]. Furthermore, if both governments decide to respond in opposition to each other’s actions, the damaging effects of protectionist proclivities could become much more austere [32].
Nevertheless, countries can circumvent the reciprocally damaging tendencies of protectionism by opting to participate in trade negotiations (i.e., bilateral, regional, plurilateral, and/or multilateral) intended to liberalise trade [39]. In fact, governments can curtail the short-term political costs associated with protectionism when acting in a collaborative state [37]. Thus, trade negotiations at levels referred herein discourage governments from engaging in what appears to be pragmatic short-term tactics for the benefit of achieving absolute long-term outcomes for their countries and possibly themselves [32].

2.2. Empirical Understandings

A general expectation from a trade agreement regardless of nature is that it must contribute to advancing the welfare of the member states and their citizenry. Similarly, the agreement is broadly anticipated to improve the trade facets of the signatory countries. It is in this setting that several studies in the existing literature employ gravity models [40,41,42], CGE models [10,43,44] and partial equilibrium (PE) models [45,46,47] to assess the welfare and trade impacts of potential trade agreements.
There is also a vast number of extant country-specific studies [48,49,50,51,52] and regional-specific studies [10,14,53,54,55] focusing on the likely welfare and trade implications of trade agreements on member states and outsiders. For the country-specific studies, specifically, a GTAP-CGE model quantification by [56] of the impacts of liberalised trade between India and Sri Lanka in the Indo-Lanka FTA concluded in December, 1998, revealed welfare gains for both India and Sri Lanka. However, the results also indicated that Sri Lanka would gain relatively more than India in terms of GDP and welfare prognostications.
In another country-specific study in which [51] quantitatively assessed the prospective impacts of the China–Pakistan FTA, the results revealed that Pakistan would face negative welfare and trade impacts emanating from the deteriorations in welfare, real GDP and trade balances. On the other hand, China was expected to achieve welfare, real GDP and trade gains from the trade deal. In the case of Pakistan, however, Ref. [51] identifies some potential export sectors that the country could leverage in the China–Pakistan FTA. Such export sectors include textiles, wearing apparel, leather products, plant-based fibres, chemical products, vegetable oil and fats and metal products.
Turning to regional-specific studies, Ref. [53] applied CGE model analysis to evaluate whether East Asian RTAs promote global free trade quantitatively. The results showed that the static effects of existing, proposed and negotiating East Asian RTAs are sufficiently positive on the world and members’ welfare. However, an analytical assessment by [55] of key provisions of the United States–Mexico–Canada Agreement (USMCA) revealed modest aggregate welfare gains driven mainly by improved goods market access, with a trivial effect on the real GDP. Nevertheless, Ref. [55] asserts that the welfare gains from USMCA would be greatly enhanced with the abolition of the United States tariffs on imports of steel and aluminium originating from Canada and Mexico as well as the removal of the Canadian and Mexican import surcharges levied after the US tariffs were instituted.
For the AfCFTA, in particular, several scholarly studies [10,11,12,13,14] that have attempted to estimate and quantify the expected welfare and trade impacts of the continental trade deal exist. These studies have generally indicated that the AfCFTA is anticipated to usher in positive welfare and trade gains. For instance, Ref. [13] finds that the AfCFTA is a net trade-creating FTA and is estimated to improve Nigeria’s total trade by USD 145.00 million, accompanied by a welfare effect of USD 13.00 million. Similarly, Ref. [14] find that the AfCFTA will likely improve Ghana’s total trade by USD 148.30 million and promote welfare by USD 8.60 million.
From the literature, there is consensus that trade agreements improve member countries’ welfare and trade standings. As already alluded to in this article, several studies have been undertaken to isolate the likely welfare and trade implications of prospective and concluded trade agreements by employing gravity, CGE, and PE models. However, it is maintained in this article that assessments of these expectations (i.e., the expected welfare and trade elements) should be executed with cognisance to the members’ core export competencies, on the export supply side, and the sustainability of the import demand within the member states, on the import demand side. This informed the basis of the analysis performed in this article. In fact, in terms of the scholarly information within the public domain, this is the first time elements of a product-level export market analytical tool are harmonised with a CGE model in welfare and trade assessments of regional and/or bilateral trade arrangements.

2.3. Nigeria and South Africa’s Trade Liberalisation Efforts

Since attaining its independence in 1960, Nigeria remains committed to trade liberalisation and internationalism determinations. In addition to being a member of the WTO, the country participates in several bilateral and regional trade initiatives at a multilateral level, including the Economic Community of West African States (ECOWAS) and the AfCFTA. While Nigeria is ranked 26th largest economy in the world, it has already been mentioned in this article that it is regarded as the leading economy and the most populated country in Africa [8]. In global trade terms, Nigeria is the 51st largest exporter and the 64th largest importer. In the African context, the country is the second largest exporter, after South Africa, and the fifth largest importer, after South Africa, Egypt, Morocco and Algeria [57].
Similarly, South Africa has embraced the notion of internationalism since the end of apartheid rule in 1994. The country has witnessed major modifications in trade policies, which have enabled it to engage in extensive trade liberalisation, resulting in a decline of its average most favoured nation (MFN) applied tariffs from 23% in the 1990s to 6.65% in 2017. Individually and as part of the Southern African Customs Union (SACU), South Africa maintains various bilateral trade relations with many countries and trading blocs around the globe [58].
At the global level, South Africa is the 38th largest exporting economy and the 39th largest importing economy. The country is Africa’s largest exporter and importer [57]. Africa has always been a priority in South Africa’s trade policy accomplishments. Hence, over the past years, South Africa has strived to accelerate the regional integration agenda in the African continent [59]. The participation of the country in regional trade integration and liberalisation initiatives such as the tripartite FTA and the AfCFTA attest to this [60].
The following section discusses the research method applied in this article to assess the welfare and trade impacts of the AfCFTA in light of Nigeria and South Africa’s core export competencies and the size, growth and consistency of the import demand in the AfCFTA countries.

3. Research Method

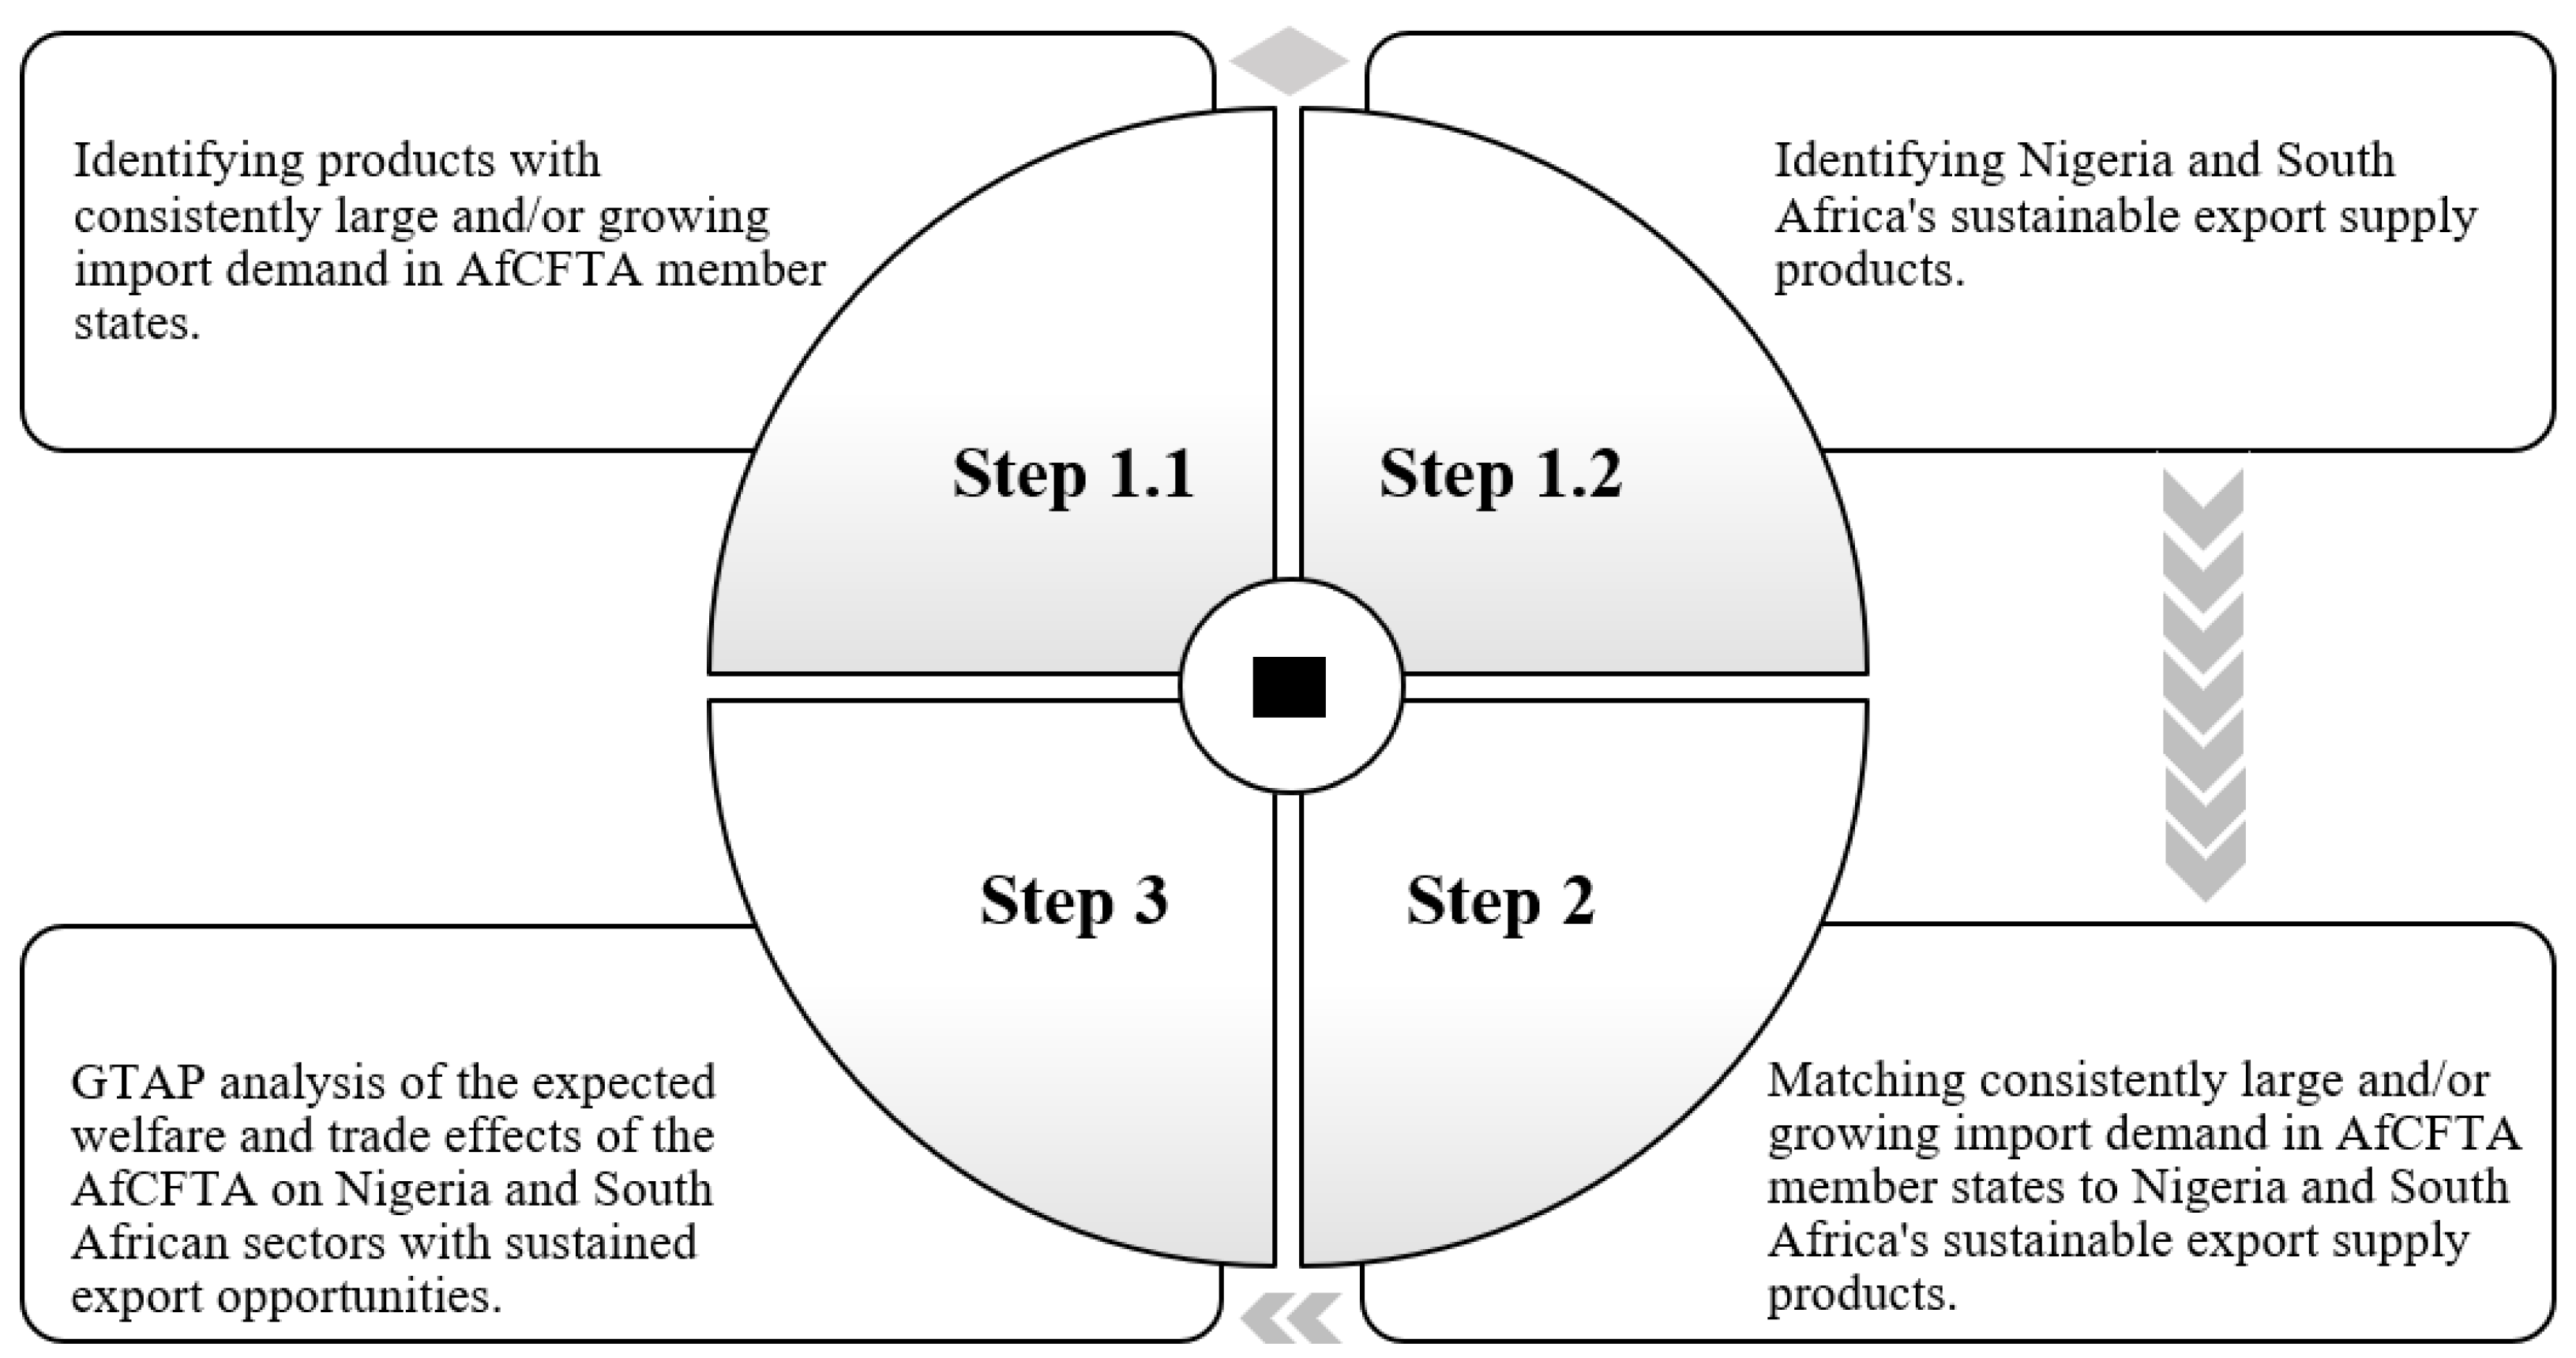
3.1. Empirical Strategy

This article combines Filters 1 and 2 of the DSM [61,62] and the GTAP CGE model [63] to assess the expected welfare and trade effects of the AfCFTA on the Nigerian and South African sectors possessing sustained export potential in AfCFTA member states. An illustrative outline of the empirical technique employed in this article is shown in Figure 1.
Filter 2 of the DSM is applied to identify harmonised system (HS) 6-digit products with consistently large and/or growing import demand in AfCFTA member states (excluding the exporting country under analysis), in Step 1.1; identify Nigeria and South Africa’s sustainable export supply products, in Step 1.2. Following [29], consistently large and/or growing import demand in AfCFTA member states matches Nigeria and South Africa’s sustainable export supply products in Step 2. The welfare and trade effects of the AfCFTA on the Nigerian and South African sectors with sustained export opportunities in AfCFTA member states are then analysed using the GTAP CGE model in Step 3. A discussion of each of these systematic steps is provided in the following section.

3.2. Data Analysis

3.2.1. Step 1.1

On the import demand side, this step follows Filter 2 of the methodology applied in [61,64] in identifying HS6-digit products with a consistently large and/or growing import demand in AfCFTA member states over 5 years from 2014 to 2018. The choice of the upper limit period is motivated by the fact that 2018 is the year before the onset of the COVID-19 pandemic, which significantly affected trade mainly through supply and demand-side conduits. Hence, the trade data of 2019 and beyond might not fully capture the trade capabilities of the countries covered in this article. Of isolated interest in this step are the following three variables: short-term import growth, calculated as a simple annual growth rate in imports; long-term import growth, calculated as the five-year compounded annual growth rate in imports; and the relative import market size, calculated as the ratio of imports of country i for product j and the total world imports of product j.
Identifying products with consistently large and/or growing import demand within the AfCFTA countries involves the computation of the cut-off values for the three variables above. The respective cut-off values are computed as follows.
First, a scaling factor is defined to establish the short- and long-term import growth threshold. This permits accounting for the country i’s degree of specialisation in the exports of product j when computing the cut-off values. Statistically, the scaling factor (Sj) is expressed as [65] as quoted in [64]:
S j = 0.8 + 1 ( R C A j + 0.85 ) exp ( R C A j 0.01 )
where RCAj is the RCA index of the exporting country for product j [66,67]. RCAj is statistically formulated as:
R C A j = ( X i , j X w , j ) ( X i , t o t X w , t o t )
where X is the exports, i is the country, j is the product, w is the world, and tot is the total. For instance, Xi,j is the exports of country i of product j.
The cut-off values are then defined as follows [65], as quoted in [64]:
g i , j G j
where gi,j is the short- or long-term import growth rate of product j in importing country i; and
G j = g w , j s j ,   if   g w , j   0 ;   or   G j   = g w , j s j ,   if   g w , j < 0
With gw,j signifying the growth rate of the aggregate world imports of product j.
Additionally, the comparative import market size of country i for product j is regarded as sufficiently large if [64]:
M i , j C j
where Mi,j is the comparative import market size of product j in country i, and Cj is the cut-off value for comparative import market size considering the exporting country’s level of specialisation in product j such that Cj = 0.02Mw,j, if RCAj  1; or Cj = [(3 − RCAj)/100]Mw,j, if RCAj  < 1 with Mw,j being the total world imports of product j.
For each product–country combination, the procedures outlined above were performed five times for all the respective variables annually from 2014 to 2018 [29,68]). If the criterion mentioned above is satisfied, each product–country combination is allotted ‘1′ or ‘0′ if otherwise. The product–country combinations are then classified as illustrated in Table 1 [64]. Product–country combinations within any of the classifications 3 to 7 annually over the 5 years from 2014 to 2018 are identified as the AfCFTA markets possessing a consistently large and/or growing import demand. However, those product–country combinations within the classifications 0, 1 and 2 over the same 5-year period are eliminated.
Import data at the HS 6-digit level from 2009 to 2018 was accessed from the United Nations Commodity Trade Statistics Database (UN-COMTRADE). While the analysis spans the period from 2014 to 2018, it is necessary to gather import data for 2009 to 2013 for computational purposes of the long-term (i.e., 5-year) import growth rates.

3.2.2. Step 1.2

On the export supply-side, this step determines the HS6-digit level products that Nigeria and South Africa export consistently competitively (i.e., sustainable exports). The assumption is that if a product is exported consistently with a comparative advantage (Revealed Trade Advantage, RTA > 0 and RCA > 0.7) over five years, it can be regarded as a sustainable export. Instead of using the RCA index, which only considers exports, in solitude as a proxy for product-level international competitiveness, this article uses the RTA index, which considers both exports and imports [69]. The RTA is computed by subtracting a country’s revealed import advantage (RMA) from its RCA and is statistically formulated as:
R T A j = R C A j R M A j = ( X i , j X w , j ) ( X i , t o t X w , t o t ) ( M i , j M w , j ) ( M i , t o t M w , t o t )
where X is the exports, M is the imports, i is the country, j is the product, w is the world and tot is the total.
While the RCA measures export specialisation, the RMA determines import specialisation. Hence, an RTA index greater than zero indicates a positive comparative trade advantage or positive trade competitiveness, suggesting that a country is a net exporter and that most of the products it exports are produced domestically as RTA corrects for re-exports.
This article uses RTA > 0 and RCA ≥ 1 as the selection criterion for Nigeria and South Africa’s sustainable exports [62]. This criterion warrants that Nigeria and South Africa are net exporters of the specific product (i.e., RTA > 0), and are specialised in exporting the product (i.e., RCA ≥ 1). Products fulfilling the selection criteria annually over the 5 years from 2014 to 2018 are identified as Nigeria and South Africa’s sustainable exports.

3.2.3. Step 2

Following [29], the AfCFTA product–country combinations identified in Step 1.1 are matched with Nigeria and South Africa’s sustainable exports identified in Step 1.2. Only matching product–country combinations are selected in this step. This entails the elimination of: (i) those product–country combinations identified with consistently large and/or growing import demand in the AfCFTA countries but for which Nigeria and South Africa cannot export sustainably; and (ii) those product–country combinations whose import demand is not consistently large and/or growing in the AfCFTA countries, but for which Nigeria and South Africa can sustainably export the products.
The matched product–country combinations selected in this step are then harmonised with the logical GTAP sectors and utilised to identify the AfCFTA countries with matching sustained import demand for the GTAP CGE model sectoral and regional aggregations.

3.2.4. Step 3

This step utilises the static version of the standard GTAP model (Version 10) to assess the expected welfare and trade effects of the AfCFTA on Nigerian and South African sectors possessing sustained export potential in AfCFTA member states. The standard GTAP Model is a multi-region, multisector, CGE Model with perfect competition and constant returns to scale. In this model, bilateral trade is handled via the Armington assumption, in which products traded internationally are differentiated by country of origin [70].
According to [71], the GTAP 10 database features four reference years (i.e., 2004, 2007, 2011 and 2014) together with 141 GTAP regions for all 65 GTAP sectors. For the model experiments simulated in this article and drawing from the matched product–country combinations identified in Step 2, the aggregation scheme was defined as follows: under Scenario 1 (Nigeria), the 141 GTAP regions were aggregated to 4 new regions, while the 65 GTAP sectors were aggregated to 21 new sectors; under Scenario 2 (South Africa), the 141 GTAP regions were aggregated to 4 new regions, while the 65 GTAP sectors were aggregated to 26 new sectors; and for both scenarios, the eight GTAP factors were aggregated to four new factors considering labour and capital to be mobile, while land (ETRAE value = −1.000) and natural resources (ETRAE value = −0.001) were considered sluggish.
The ultimate objective of the AfCFTA, concerning trade, is to reach full liberalisation (i.e., the gradual elimination of all import taxes and export subsidies). In light of this and to assess the welfare and trade effects of the AfCFTA on Nigerian and South African sectors possessing sustained export potential in the AfCFTA member states, the following model experiments are defined and simulated under these two scenarios:
Scenario 1:
full elimination of the AfCFTA_24 (i.e., AfCFTA members with sustained import demand for Nigeria) import tariffs on all matched sustainable exports originating from Nigeria, and full elimination of Nigeria’s export subsidies on all its matched sustainable exports to the AfCFTA_24; and
Scenario 2:
full elimination of the AfCFTA_37 (i.e., AfCFTA members with sustained import demand for South Africa) import tariffs on all matched sustainable exports originating from South Africa and full elimination of South Africa’s export subsidies on all its matched sustainable exports to the AfCFTA_37.
Since most African countries suffer from high unemployment, the unemployment closure is applied in the case of Nigeria, South Africa, AfCFTA_24, AfCFTA_37 and the ROAfCFTA (i.e., AfCFTA members without sustained import demand for both Nigeria and South Africa) in the simulations under both scenarios.

4. Results and Discussions

The results of the methodological steps employed in this article to assess the expected welfare and trade effects of the AfCFTA on Nigerian and South African sectors possessing sustained export potential in AfCFTA member states are presented and discussed in this section. In this regard, the results of the sustained export opportunities for Nigeria and South Africa in the AfCFTA are presented first. This is followed by the simulation results of the welfare and trade effects of the AfCFTA under the two scenarios.

4.1. Sustained Export Opportunities for Nigeria and South Africa in the AfCFTA

The summary of the results obtained in Steps 1.1 to 2 over the five years from 2014 to 2018 is shown in Table 2. For Nigeria, a total of 494 product–country combinations were identified with consistently large and/or growing import demand in the AfCFTA countries in Step 1.1. Of these 494 product–country combinations, 61 matched (in Step 2) with the 320 products exported by Nigeria consistently competitively selected in Step 1.2. On the other hand, a total of 725 product–country combinations for South Africa were identified with consistently large and/or growing import demand in the AfCFTA member states. Of these, 725 product–country combinations, 145 matched with the 559 products exported by South Africa consistently competitively.
The 61 matched product–country combinations (in the case of Nigeria) and the 145 product–country combinations (in the case of South Africa) were then harmonised with the logical GTAP sectors and used to identify the AfCFTA countries with matching sustained import demand for the sectoral and regional aggregations applied in the model simulations performed in this article.

4.2. Welfare Effects of the AfCFTA under the Two Scenarios

This article quantifies the net welfare improvements originating from the AfCFTA through the equivalent variation (EV). As stated by [72], the EV contrasts the cost of pre- and post-shock levels of consumer utility, both valued at base year prices (2014 prices in this case). Table 3 reveals that both Nigeria and the AfCFTA_24 experience positive welfare gains of USD 146.12 million and USD 93.10 million, respectively, under Scenario 1. This indicates an expansion in economic welfare attributable to the trade creation resulting from the Nigerian sectors possessing sustained export potential in the AfCFTA.
South Africa and the AfCFTA_37 are also expected to experience positive welfare gains of USD1.46 billion and USD 1.72 billion, correspondingly, under Scenario 2. Except for an estimated slight welfare gain of USD 6.33 million achieved by the Rest of AfCFTA under Scenario 2, both the Rest of AfCFTA and the Rest of the World are anticipated to achieve welfare losses under the two scenarios. However, at the global level, the Nigerian and South African sectors possessing sustained export potential in AfCFTA member states are expected to yield combined welfare gains of USD 2.76 billion.
In both scenarios simulated in this article, the major source of welfare gains is the endowment effect. Furthermore, South Africa significantly benefits from the allocative efficiency effect.

4.3. Trade Creation and Diversion of the AfCFTA under the Two Scenarios

The notions of trade creation and trade diversion publicised in the seminal theory of customs unions (CU), put forward by [73], contrast the welfare-augmenting impacts of the created trade agreement with the welfare-diminishing impacts originating from trade discrimination [72]. According to [73], trade creation is defined as the shift in the volume of production of traded goods from a high-cost producer in the created trade agreement to a lower-cost member. In contrast, trade diversion is defined as the shift in members’ source of imports from low-cost non-members to high-cost members, culminating in the weakening of productivity and welfare.
The results of trade creation and trade diversion effects under Scenario 1 are shown in Table 4. Nigeria and the AfCFTA_24 members will likely experience trade creation and diversion in all sectors. It is evident in Table 4 that bilateral AfCFTA_24 real imports from Nigeria increase in all sectors. In contrast, the AfCFTA_24 imports from other regions deteriorate in all the sectors. In this regard, combined trade of USD 619.87 million is created, while trade worth USD 382.86 million is diverted under this scenario.
Under Scenario 2, South Africa and the AfCFTA_37 countries are expected to experience trade creation and diversion in most sectors (see Table 5). It can be seen that the bilateral AfCFTA_37 real imports from South Africa increased in all sectors except for the forestry and oil sectors. In contrast, the AfCFTA_37 imports from other regions are estimated to deteriorate in most sectors. Hence, a collective USD 5.98 billion worth of trade is created, while trade worth USD 4.07 billion is diverted under this scenario.
The increase in bilateral AfCFTA imports in all two scenarios outweighs the reduction in total AfCFTA imports from other regions. This shows that the formation of the AfCFTA is expected to be net-trade-creating in Nigerian and South African sectors with sustained export opportunities within the AfCFTA members. At a global level, a net trade of USD 2.15 billion is created.

5. Conclusions and Recommendations

This article assesses the welfare and trade effects of the AfCFTA on Nigerian and South African sectors possessing sustained export potential in the AfCFTA member states. In light of this, the following model experiments were defined and simulated under these two scenarios: Scenario 1, in which the AfCFTA_24 import tariffs on all matched sustainable exports originating from Nigeria, and Nigeria’s export subsidies on all its matched sustainable exports to the AfCFTA_24, are fully eliminated; and Scenario 2 in which the AfCFTA_37 import tariffs on all matched sustainable exports originating from South Africa and South Africa’s export subsidies on all its matched sustainable exports to the AfCFTA_37, are fully eliminated.
The results reveal positive welfare gains for Nigeria (USD 146.12 million) and South Africa (USD 1.46 billion), originating from the GTAP sectors identified with sustainable export opportunities within the AfCFTA member states. The AfCFTA importing countries also achieve welfare gains of USD 93.10 million (under Scenario 1) and USD 1.72 billion (under Scenario 2), respectively. In both simulated scenarios, the endowment effect is the major source of welfare gains. South Africa also considerably gains from the allocative efficiency effect. The formation of the AfCFTA is also expected to be net-trade-creating in Nigerian and South African sectors with sustained export opportunities within the AfCFTA members. In terms of trade creation and diversion effects, a combined trade of USD 619.87 million is created, while trade worth of USD 382.86 million is diverted under Scenario 1. Likewise, a collective trade worth of USD 5.98 billion is created, while trade worth of USD 4.07 billion is diverted under Scenario 2. At a global level, a net trade of USD 2.15 billion is created.
While several studies such as [9,10,11,12,13,14] have simulated the expected welfare and trade implications of the formation of the AfCFTA on the respective member countries and the regional grouping as a whole indicating positive gain, this is the first time welfare and trade impacts of a potential or concluded trade agreement are viewed from the lens of core export competences and sustained import demand. Hence, the assessments in the present article are significant in informing trade policy by isolating the welfare and trade implications of the AfCFTA on sectors that guarantee the survival and growth of export initiatives between Nigeria, South Africa and the rest of AfCFTA members.
For both Nigeria and South Africa, the results obtained in this article can be utilised as a starting point by policymakers and export promotion organisations in formulating strategies aimed at leveraging the welfare-improving sustained export opportunities identified within the AfCFTA. However, the strategies must be formulated without redirecting focus from addressing other factors that undermines comparative advantages in the regional trading bloc. Such factors include poor trade-related infrastructure, inferior institutional quality, and the expected chronic corruption and bureaucracy in the implementation of the AfCFTA.
The following usual limitations epitomising GTAP model simulations were encountered in this article: (i) the simulated results may not reflect the actual welfare and trade effects emanating from the GTAP sectors identified with sustainable export opportunities within the AfCFTA member states; (ii) only import tariffs and export subsidies were considered in the simulated model experiments. Hence, further welfare and benefits may be anticipated from the liberalisation of non-tariff measures; and (iii) the GTAP model utilised in this article is static, meaning that some dynamic effects of full trade liberalisation were not captured in the simulations performed.
Future research can exploit future data availabilities for real econometric computations that can be compared against the simulated outcomes in this article. A dynamic GTAP CGE model can also be used to undertake a similar assessment as in this article to capture the dynamic effects of the full liberalisation of GTAP sectors possessing sustained export opportunities for specific countries or country groups in the AfCFTA. Further channels in which future research can be directed include: the exploration of diverse trade policy architectures that could be implemented to maximise the potential benefits of the AfCFTA; the analysis of the effects of the AfCFTA on various industries at both the national and regional levels; discussing the challenges faced by small and medium-sized enterprises when trading within the AfCFTA; examining the conduits for further integration between member countries in the AfCFTA in order to increase the economic benefits of the agreement; and considering strategies to address any potential adverse impacts of the AfCFTA.

Author Contributions

Conceptualization, G.M. and D.F.M.; Formal analysis, G.M.; Methodology, G.M.; Supervision, D.F.M.; Validation, D.F.M.; Writing—original draft, G.M.; Writing—review and editing, G.M. and D.F.M. All authors have read and agreed to the published version of the manuscript.

Funding

This research received no external funding.

Data Availability Statement

The data analysed in this article is available upon request.

Conflicts of Interest

The authors declare no conflict of interest.

References

  1. African Union. Agenda 2063: The Africa We Want. 2013. Available online: https://au.int/en/agenda2063/overview (accessed on 28 January 2019).
  2. Trade Law Centre. Status of AfCFTA Ratification. 2019. Available online: https://www.tralac.org/resources/infographic/13795-status-of-afcfta-ratification.html (accessed on 12 February 2019).
  3. Erasmus, G. The AfCFTA: What has Been Achieved and When will it Become Operational? 2018. Available online: https://www.tralac.org/publications/article/13134-the-afcfta-what-has-been-achieved-and-when-will-it-become-operational.html (accessed on 19 August 2019).
  4. African Union. Summary of the Key Decisions and Declarations of the 31st African Union Summit. 2018. Available online: https://au.int/en/pressreleases/20180706/summary-key-decisions-and-declarations-31st-african-union-summit (accessed on 12 February 2019).
  5. United Nations Economic Commission for Africa. African Continental Free Trade Area. 2018. Available online: https://au.int/sites/default/files/documents/33984-doc-qa_cfta_en_rev15march.pdf (accessed on 10 November 2019).
  6. United Nations Economic Commission for Africa. Building a Sustainable and Inclusive Continental Free Trade Area. 2017. Available online: https://www.uneca.org/sites/default/files/PublicationFiles/policy_brief_building_sustainable_and_inclusive.pdf (accessed on 19 August 2019).
  7. United Nations Economic Commission for Africa. Assessing Regional Integration in Africa VIII: Bringing the CFTA About; United Nations: Addis Ababa, Ethiopia, 2017. [Google Scholar]
  8. World Bank. World Development Indicators. 2022. Available online: https://data.worldbank.org/indicator/NY.GDP.MKTP.CD?locations=ZG (accessed on 20 November 2019).
  9. Saygili, M.; Peters, R.; Knebel, C. African Continental Free Trade Area: Challenges and Opportunities of Tariff Reductions; UNCTAD Publishing: Geneva, Switzerland, 2018. [Google Scholar]
  10. Abrego, M.L.; Amado, M.A.; Gursoy, T.; Nicholls, G.P.; Perez-Saiz, H. The African Continental Free Trade Agreement: Welfare Gains Estimates from a General Equilibrium Model; International Monetary Fund: Washington, DC, USA, 2019. [Google Scholar]
  11. Zidouemba, P.R.; Jallab, M.S. The African Continental Free Trade Area and the trade facilitation agreement: Some regional macroeconomic impacts. Int. J. Trade Glob. Mark. 2021, 14, 325–337. [Google Scholar] [CrossRef]
  12. Bengoa, M.; Mathur, S.; Narayanan, B.; Norberg, H.C. Environmental Effects of the African Continental Free Trade Agreement: A Computable General Equilibrium Model Approach. J. Afr. Trade 2021, 8, 36–48. [Google Scholar] [CrossRef]
  13. Oyelami, L.O. Revenue, welfare and trade effects of African Continental Free Trade Agreement (AFCFTA) on Nigerian economy. J. Public Aff. 2021, 22, e2645. [Google Scholar] [CrossRef]
  14. Bayale, N.; Ibrahim, M.; Atta-Mensah, J. Potential trade, welfare and revenue implications of the African Continental Free Trade Area (AfCFTA) for Ghana: An application of partial equilibrium model. J. Public Aff. 2020, 22, e2385. [Google Scholar] [CrossRef]
  15. Mayer, T.; Zignago, S. Market Access in Global and Regional Trade; CEPII: Paris, France, 2005. [Google Scholar]
  16. World Trade Organization. Regional Trade Agreements and Preferential Trade Arrangements. 2017. Available online: https://www.wto.org/english/tratop_e/region_e/rta_pta_e.htm (accessed on 10 February 2022).
  17. Moser, C.; Rose, A.K. Who benefits from regional trade agreements? The view from the stock market. Eur. Econ. Rev. 2014, 68, 31–47. [Google Scholar] [CrossRef] [Green Version]
  18. Songwe, V. Intra-African Trade: A Path to Economic Diversification and Inclusion; The Brookings Institution: Washington, DC, USA, 2019. [Google Scholar]
  19. Nollen, S.D.; Quinn, D.P. Free trade, fair trade, strategic trade, and protectionism in the US Congress, 1987–1988. Int. Organ. 1994, 48, 491–525. [Google Scholar] [CrossRef]
  20. Li, C.; Whalley, J. Trade protectionism and US manufacturing employment. Econ. Model. 2020, 96, 353–361. [Google Scholar] [CrossRef] [Green Version]
  21. Kaldor, N. The foundations of free trade theory and their implications for the current world recession. In Unemployment in Western Countries; Palgrave Macmillan: London, UK, 1980; pp. 85–100. [Google Scholar]
  22. Smith, A. An Inquiry into the Nature and Causes of the Wealth of Nations; Methuen and Company: London, UK, 1776. [Google Scholar]
  23. Ricardo, D. The Principles of Political Economy and Taxation; G. Bell and Sons: London, UK, 1817. [Google Scholar]
  24. Jones, R.W. Factor Proportions and the Heckscher-Ohlin Theorem. Rev. Econ. Stud. 1956, 24, 1–10. [Google Scholar] [CrossRef]
  25. Leamer, E.E.; Levinsohn, J. International trade theory: The evidence. Handb. Int. Econ. 1995, 3, 1339–1394. [Google Scholar]
  26. Chipman, J.S. Factor price equalisation and the Stolper-Samuelson theorem. Int. Econ. Rev. 1969, 10, 399. [Google Scholar] [CrossRef]
  27. Salvatore, D. International Economics, 8th ed.; John Wiley & Sons: Hoboken, NJ, USA, 2004. [Google Scholar]
  28. Rahim, S. What use is the Neo-Classical Theory of International Trade? Lahore J. Econ. 1999, 4, 89–113. [Google Scholar] [CrossRef]
  29. Mhonyera, G.; Steenkamp, E.A.; Matthee, M. Evaluating South Africa’s utilisation of sustained export potential in sub-Saharan Africa. S. Afr. J. Econ. Manag. Sci. 2018, 21, 13. [Google Scholar] [CrossRef] [Green Version]
  30. Myerson, R.B. Game Theory; Harvard University Press: Cambridge, MA, USA, 2013. [Google Scholar]
  31. Straffin, P.D. Game Theory and Strategy; Mathematical Association of America: Washington, DC, USA, 1993. [Google Scholar]
  32. Abbott, K.W. The trading nation’s dilemma: The functions of the law of international trade. Harv. Int. Law J. 1985, 26, 501–532. [Google Scholar]
  33. Dawes, R.M.; McTavish, J.; Shaklee, H. Behaviour, communication, and assumptions about other people’s behaviour in a commons dilemma situation. J. Personal. Soc. Psychol. 1977, 35, 1–26. [Google Scholar] [CrossRef]
  34. Holt, C.A.; Capra, M. Classroom games: A prisoner’s dilemma. J. Econ. Educ. 2000, 31, 229–236. [Google Scholar] [CrossRef]
  35. Roth, A.E.; Murnighan, J.K. Equilibrium behaviour and repeated play of the prisoner’s dilemma. J. Math. Psychol. 1978, 17, 189–198. [Google Scholar] [CrossRef]
  36. Sykes, A.O. Regulatory Protectionism and the Law of International Trade. Univ. Chic. Law Rev. 1999, 66, 1–46. [Google Scholar] [CrossRef]
  37. Rodrik, D. Has globalisation gone too far? Challenge 1998, 41, 81–94. [Google Scholar] [CrossRef]
  38. Kee, H.L.; Neagu, C.; Nicita, A. Is Protectionism on the Rise? Assessing National Trade Policies during the Crisis of 2008. Rev. Econ. Stat. 2013, 95, 342–346. [Google Scholar] [CrossRef] [Green Version]
  39. Milner, H.V. Resisting Protectionism: Global Industries and the Politics of International Trade; Princeton University Press: Princeton, NJ, USA, 1989. [Google Scholar]
  40. Cernat, L. Assessing regional trade arrangements: Are South-South RTAs more trade diverting. Glob. Econ. Q. 2001, 2, 235–259. [Google Scholar]
  41. Caliendo, L.; Parro, F. Estimates of the Trade and Welfare Effects of NAFTA. Rev. Econ. Stud. 2014, 82, 1–44. [Google Scholar] [CrossRef] [Green Version]
  42. Timsina, K.P.; Culas, R.J. Australia’s Free Trade Agreements (FTAs) and Potentiality of Wheat Exports: A Panel Gravity Model Approach. J. East-West Bus. 2021, 28, 61–88. [Google Scholar] [CrossRef]
  43. Mustilli, F. Estimating the economic gains of TTIP. Intereconomics 2015, 50, 321–327. [Google Scholar]
  44. Timini, J.; Viani, F. A highway across the Atlantic? Trade and welfare effects of the EU-Mercosur agreement. Int. Econ. 2022, 169, 291–308. [Google Scholar] [CrossRef]
  45. Makochekanwa, A. Welfare Implications of COMESA-EAC-SADC Tripartite Free Trade Area. Afr. Dev. Rev. 2014, 26, 186–202. [Google Scholar] [CrossRef]
  46. Jagdambe, S.; Mouzam, S.M. Evaluating the trade, revenue and welfare implication of plantation crops under ASEAN-India FTA. J. Asian Econ. Integr. 2019, 1, 224–241. [Google Scholar] [CrossRef]
  47. Biden, S.; Ker, A.P.; Duff, S. Impacts of trade liberalisation in Canada’s supply managed dairy industry. Agric. Econ. 2020, 51, 535–552. [Google Scholar] [CrossRef]
  48. Hertel, T.W.; Walmsley, T.; Itakura, K. Dynamic Effects of the "New Age" Free Trade Agreement between Japan and Singapore. J. Econ. Integr. 2001, 16, 446–484. [Google Scholar] [CrossRef] [Green Version]
  49. Siriwardana, M.; Yang, J. GTAP Model Analysis of the Economic Effects of an Australia–China FTA: Welfare and Sectoral Aspects. Glob. Econ. Rev. 2008, 37, 341–362. [Google Scholar] [CrossRef]
  50. Cho, S.-W.; Yoon, G. Sectoral analysis of an Australia–India free trade agreement. J. Asia Pac. Econ. 2014, 19, 205–229. [Google Scholar] [CrossRef]
  51. Hussain, C.; Shah, S.Z.A. Quantitative assessment of Pakistan and China free trade agreement. Pak. J. Commer. Soc. Sci. 2017, 11, 293–308. [Google Scholar]
  52. Wei, D.; Chen, Z.; Rose, A. Estimating economic impacts of the US-South Korea free trade agreement. Econ. Syst. Res. 2019, 31, 305–323. [Google Scholar] [CrossRef]
  53. Park, I. East Asian regional trade agreements: Do they promote global free trade? Pac. Econ. Rev. 2006, 11, 547–568. [Google Scholar] [CrossRef]
  54. Lee, H.; Itakura, K. The welfare and sectoral adjustment effects of mega-regional trade agreements on ASEAN countries. J. Asian Econ. 2018, 55, 20–32. [Google Scholar] [CrossRef] [Green Version]
  55. Burfisher, M.E.; Lambert, F.; Matheson, M.T.D. NAFTA to USMCA: What is Gained? International Monetary Fund: Washington, DC, USA, 2019. [Google Scholar]
  56. Siriwardana, M. An Analysis of the Impact of Indo-Lanka Free Trade Agreement and Its Implications for Free Trade in South Asia. J. Econ. Integr. 2004, 19, 568–589. [Google Scholar] [CrossRef] [Green Version]
  57. International Trade Centre. List of Importers for the Selected Product in 2021: Total All Products. 2022. Available online: https://www.trademap.org/Country_SelProduct.aspx?nvpm (accessed on 9 June 2022).
  58. South Africa, Department of Trade and Industry. Trade, Exports and Investment. 2017. Available online: https://www.thedti.gov.za/trade_investment/ited_trade_agreement.jsp (accessed on 20 November 2019).
  59. South Africa, Industrial Development Corporation. Export Opportunities for SOUTH Africa in Selected African Countries. 2014. Available online: http://www.idc.co.za/home/financial-results/research-reports.html (accessed on 16 October 2019).
  60. South Africa, Department of Trade and Industry. Memorandum. 2018. Available online: https://www.thedti.gov.za/parliament/2018/TFTA%20_COMESA_EAC_SADC.pdf (accessed on 20 November 2019).
  61. Cuyvers, L.; De Pelsmacker, P.; Rayp, G.; Roozen, I.T.M. A decision support model for the planning and assessment of export promotion activities by government export promotion institutions: The Belgian case. Int. J. Res. Mark. 1995, 12, 173–186. [Google Scholar] [CrossRef]
  62. Cuyvers, L.; Viviers, W. Export Promotion: A Decision Support Model Approach; African Sun Media: Stellenbosch, South Africa, 2012. [Google Scholar]
  63. Hertel, T.W. Global Trade Analysis: Modeling and Applications; Cambridge University Press: Cambridge, UK, 1997. [Google Scholar]
  64. Cuyvers, L. Identifying export opportunities: The case of Thailand. Int. Mark. Rev. 2004, 21, 255–278. [Google Scholar] [CrossRef]
  65. Willemé, P.; Van Steerteghem, D. Een Normatief Model Voor de Planning van Export-Bevorderende Activiteiten van de Vlaamse Dienst voor de Buitenlandse Handel. Unpublished work. 1993. [Google Scholar]
  66. Balassa, B. Trade Liberalisation and Revealed Comparative Advantage; Yale University Growth Centre: New Haven, CT, USA, 1965. [Google Scholar]
  67. Reis, J.G.; Farole, T. The Trade Competitiveness Diagnostics Toolkit; World Bank: Washington, DC, USA, 2012. [Google Scholar]
  68. Mhonyera, G. Identifying Priority Products and Sectors for Bilateral Trade Negotiations: The Case of AGOA beyond 2025. Ph.D. Thesis, North-West University, Potchefstroom, South Africa, 2020. [Google Scholar]
  69. Vollrath, T.L. A theoretical evaluation of alternative trade intensity measures of revealed comparative advantage. Rev. World Econ. 1991, 127, 265–280. [Google Scholar] [CrossRef]
  70. Armington, P.S. A Theory of Demand for Products Distinguished by Place of Production. Staff. Pap. Int. Monet. Fund 1969, 16, 159–178. [Google Scholar] [CrossRef]
  71. Aguiar, A.; Chepeliev, M.; Corong, E.L.; McDougall, R.; Van Der Mensbrugghe, D. The GTAP Data Base: Version 10. J. Glob. Econ. Anal. 2019, 4, 1–27. [Google Scholar] [CrossRef] [Green Version]
  72. Burfisher, M.E. Introduction to Computable General Equilibrium Models; Cambridge University Press: New York, NY, USA, 2017. [Google Scholar]
  73. Viner, J. The Customs Union Issue; Carnegie Endowment for International Peace: New York, NY, USA, 1950. [Google Scholar]
Figure 1. Visual illustration of the empirical technique applied in this article. Source: authors’ own figure.
Sustainability 15 05090 g001
Table 1. Classification of product–country combinations in Step 1.1.
VariableClassification
01234567
Short-term import market growth01001101
Long-term import market growth00101011
Relative import market size00010111
Source: adapted from Cuyvers (2004:261) [64].
Table 2. Synopsis of the results obtained in Sections 1.1 to 2 for both Nigeria and South Africa.
NigeriaTotal
Step 1.1Product–country combinations identified with consistently large and/or growing import demand in the AfCFTA from 2014 to 2018494
Step 1.2Products consistently competitively exported by Nigeria (i.e., sustainable exports selected in Step 1.2, with RCA > 0.7 and RTA > 0 from 2014 to 2018)320
Step 2Product–country combinations identified with consistently large and/or growing import demand in the AfCFTA from 2014 to 2018, matching Nigeria’s sustainable exports61
South AfricaTotal
Step 1.1Product–country combinations identified with consistently large and/or growing import demand in the AfCFTA from 2014 to 2018725
Step 1.2Products consistently competitively exported by South Africa (i.e., sustainable exports selected in Step 1.2, with RCA > 0.7 and RTA > 0 in 2014 to 2018)559
Step 2Product–country combinations identified with consistently large and/or growing import demand in the AfCFTA from 2014 to 2018 matching South Africa’s sustainable exports145
Source: authors’ own table.
Table 3. EV decomposition for AfCFTA under the two scenarios (2014 USD million).
Allocative Efficiency EffectEndowment EffectTerms of Trade EffectInvestment-Savings EffectTotal
Scenario 1
Nigeria27.7753.5380.49−15.66146.12
AfCFTA_2423.47110.16−33.51−7.0293.10
Rest of AfCFTA−0.780.03−0.430.07−1.11
Rest of World−9.020.00−46.5822.61−32.99
Total (World)41.44163.72−0.030.01205.13
Scenario 2
South Africa685.89911.24−132.14−5.921459.07
AfCFTA_37−26.001255.95558.81−65.211723.54
Rest of AfCFTA−2.38−2.2010.650.266.33
Rest of World−273.540.00−436.8470.87−639.50
Total (World)383.972164.990.480.002549.45
Source: GTAP 10 model simulation.
Table 4. Trade creation and trade diversion effects under Scenario 1 (2014 USD million).
SectorChange in Real AfCFTA_24 Imports from NigeriaChange in Real AfCFTA_24 Imports from Other Regions
Animal products not elsewhere specified0.00−0.04
Beverages and tobacco products58.04−18.83
Bovine cattle, sheep and goats0.00−0.06
Bovine meat products0.01−0.61
Chemical products83.69−62.62
Crops not elsewhere specified6.74−3.24
Ferrous metals6.02−3.61
Food products not elsewhere specified72.86−33.10
Forestry0.07−0.02
Leather products125.79−78.28
Manufactures not elsewhere specified15.47−10.49
Metal products8.24−6.04
Metals not elsewhere specified24.21−16.38
Oil seeds1.18−1.13
Petroleum, coal products16.03−8.09
Processed rice0.29−0.73
Sugar0.24−0.99
Textiles199.87−135.38
Vegetable oils and fats0.40−1.94
Vegetables, fruit, nuts0.82−0.88
Total619.97−382.46
Source: GTAP 10 model simulation.
Table 5. Trade creation and trade diversion effects under Scenario 2 (2014 USD million).
SectorChange in Real AfCFTA_37 Imports from South AfricaChange in Real AfCFTA_37 Imports from Other Regions
Beverages and tobacco products64.74−17.07
Chemical products530.37−390.93
Crops not elsewhere specified1.66−0.99
Dairy products44.77−24.97
Ferrous metals84.77−75.00
Fishing0.100.30
Food products not elsewhere specified164.22−66.82
Forestry−0.540.39
Machinery and equipment not elsewhere specified1152.19−893.32
Manufactures not elsewhere specified150.13−86.50
Metal products274.55−166.54
Metals not elsewhere specified10.10−8.93
Mineral products not elsewhere specified31.35−16.50
Minerals not elsewhere specified0.347.35
Motor vehicles and parts999.13−727.86
Oil0.00−41.37
Paper products, publishing151.96−98.24
Petroleum, coal products1800.89−1175.18
Rubber and plastic products181.82−126.38
Textiles101.46−57.22
Vegetable oils and fats14.63−9.70
Vegetables, fruit, nuts114.88−41.51
Wearing apparel88.96−41.43
Wood products18.64−10.51
Wool, silk-worm cocoons2.96−1.90
Total5984.08−4070.83
Source: GTAP 10 model simulation.
Disclaimer/Publisher’s Note: The statements, opinions and data contained in all publications are solely those of the individual author(s) and contributor(s) and not of MDPI and/or the editor(s). MDPI and/or the editor(s) disclaim responsibility for any injury to people or property resulting from any ideas, methods, instructions or products referred to in the content.

