Article

Financial Indicators’ Performance and Green Financing Projects: A Comparative Study from PSX and NYSX

1
Chinese Academy of Science and Technology for Development, Beijing 100038, China
2
Uswa Institute of Higher Education, Punjab University, Islamabad 46000, Pakistan
3
Institute of Business Management Sciences, University of Agriculture, Faisalabad 38040, Pakistan
4
Department of Marketing, University of Barishal, Barishal 8254, Bangladesh
5
Department of Mathematical Methods in Economics, Tashkent State University of Economics, Tashkent 100066, Uzbekistan
*
Author to whom correspondence should be addressed.
Sustainability 2023, 15(6), 5132; https://doi.org/10.3390/su15065132
Submission received: 15 September 2022 / Revised: 27 December 2022 / Accepted: 1 January 2023 / Published: 14 March 2023
(This article belongs to the Special Issue Sustainability of Corporate Governance and Enterprise Environment)

Abstract

:
In Modern era, the Researchers are keenly interested in different areas of green financing projects such as green economics, green trade, green sustainable development activities, green climatic and environment quests, green investment and financial ventures, and green public policy-related topics, respectively. Owing to the lower cost of production for sustainable development, a healthy climate, and a neat environment is needed, this study is structured to build the significant relationship between various green sustainable development projects, the financial effectiveness and performance of PSX and NYSX, respectively. For this purpose, the time series data for 2000–2020 are collected from IFS, WBI, SBP, the Federal Reserve system, S&DP, and the UNDP financial reports. The empirical analysis reveals the insignificant effects of green investment, financial projects, public policies, and social green projects on the financial performance of PSX, whereas the empirical modeling also attests that all the green factors significantly affect the performance of NYSX except the green economic and trading projects and renewable energy green projects, which are insignificant predictors with respect to FIP-NYSX. Moreover, the index for human development insignificantly affects the prediction of FIP-NYSX. The mixed empirical results guide policymakers, the board of PSX and NYSX, and the management of green financing companies to reconsider their policies and objectives with respect to successful green operations and the financial performance of PSX and NYSX.

1. Introduction

The whole world has been facing problems on many financial, social, political, economic, environmental, and ecological grounds for the last two decades. To combat all of these problems, policies have been structured for many years, and these are still ongoing processes undertaken by policymakers and financial analysts [1,2]. After the Soviet Union collapsed and the emergence of new states on international geography, the financial crises of 1998–2008, the shock of nine eleven in the USA, the killing of Osama Bin Laden, the after-effects of tsunami disasters in various Asian states, the American occupation of Afghanistan in the name of the War on Terror and their long stay in the central Asian regions for their own economic and financial interests, then the evacuation of American troops from Afghanistan and the emergence of the Iranian and North Korean nuclear weapons programs, the whole global population is facing unending political and climatic challenges [3,4]. Recently, COVID-19 also increased hardships for residents of the whole Earth with respect to food, air, water, energy, funds, and investment, all of which ultimately led to the collapses of financial and investment institutions [5]. Undoubtedly, a joint effort by the international community of allied countries was undertaken to meet the energy and food needs of the people of developed and developing economies so that they would be able to emerge after the COVID-19 pandemic. However, the real essence of this study is not to link the recent COVID-19 activity with the problematic state of green financing projects. According to Bogdan et al. [6], green financing projects are aimed at assisting international communities, investors, and residents to capture funds from designated sources to alleviate problems at the energy, climate, and investment levels. The core objective of green financing is to provide the funds and ascertain that these funds are actually being utilized to meet the financial needs of climatic and environmental changes [7]. The green financing funds are basically provided for the installation of climatic instruments to foresee the abrupt ecological, metrological, and geographical conditions for the bio diversification at different lands, etc. In Pakistan, the green financing demand structure has been introduced, as in many advanced economies such as the UK, USA, China, Russia, and India. In all of these mature economies, green financing projects are funded by investment companies, national institutions, and foreign banks [8,9].
The Economic Forum of Green Horizon Summit (EFGHS) on 11 November 2020 was globally inclined to protect the environment from natural disasters and direct banks and investors to invest in green financing projects and to provide operational loans for greening projects. According to the Intergovernmental Panel on Climate Change’s (IPCC) 2018 reports [10], the adaptation and mitigation of abrupt changes in climatic conditions are dealt with by climatic finance as sustainable finance controls social, environmental, and governance-related projects. On the other hand, green financing covers all areas, including climatic finance and sustainable finance, with the addition of environmental goals [8]. The central banks of all the developed countries are considering financing their green projects through green investments such as the floatation of green bonds [11,12]. The very first green bond was floated in financial markets by the joint mutual partnership of the European Investment Bank (EIB) and the World Bank (WB). It was rated at AAA by Moody’s, AAA by the S&P, and AAA by Fitch, which ranks it as “Prime.” These bonds were legally floated on the capital markets in November 2008, and its market reached the tremendous figure of USD 1.2 Trillion by the end of 2008. The market of green investment bonds soon reached USD 2.8 trillion by 2020 [13]. The capital raised through these types of green bonds was given to member countries for green financing projects, including climatic and sustainable development efforts. Green loans are another type of green financing that is provided to SMEs [14].
From this discussion, we come to know that green financing covers broader areas, including green investment activity, green trade and economic projects, green environmental and climatic projects, and green social projects and policies [15]. In essence, these are the broader areas that we have to test statistically in their relationship with the performance of the Pakistani and American stock exchanges. More broadly speaking, these are the stock markets all over the global arena where the shares of firms from different industries are floated and traded afterward. The capital markets (stock markets) are regulated and controlled by the controlling bodies, which are the Securities and Exchange Commission in the case of the USA and the Securities and Exchange Commission of Pakistan (SECP) in connection with the financial markets system of Pakistan [16]. These are stock markets which play the role of facilitators of funds from the investors to the companies which are in need of these funds to accommodate the needs of their capital projects. The performance of the stock market is measured through the market capitalization or turnover of traded shares on these financial markets. The performance of the stock markets is also increased if the return on assets (ROA), return on investment (ROI), and return on capital employed (ROCE) ratios of the listed firms are improved [9,17]. The stock markets are constantly and continually monitored by the investors, financial legal advisors, industry practitioners, and security brokers. The established and officially regulated stock markets are also liable to protect the rights of investors who are in hope of handsome dividend announcements and capital return (i.e., share price increases). The financial markets are also affected by the tremendous political, social, economic, and technological changes and by the decisions of the policy makers of the countries [2]. The regulatory bodies are answerable to the general public if there is any misalignment, either from the firms’ distortion or by the investors’ dissatisfaction towards the firms’ performance, because the green financing projects are in need of sufficient funds to satisfy their long-term and operational needs, which are provided by the general public. Therefore, the companies which are engaged in sustainable development programs, energy renewable projects, climatic projects, and environmental policies are inclined to issue their shares [18] in the capital markets to meet their liquidity needs. In Pakistan, the firms which are inclined towards green financing investment projects issue their stock publicly through the investment banker, and, after consideration, these shares are introduced on the floors of Pakistan Stock Exchange (PSX). The PSX is fully authorized by the SECP for the trading of financial and non-financial securities. The green investment banks and green renewable energy firms are especially in need of huge funds because the green projects extend beyond 5–5 years, normally elongating to 20–30 years [2,10,12,18]. Owing to the requirement of funds for the implementation of green projects, the green financing firms intend to float their shares or bonds so that short term and long-term liquidity needs would be realized to cultivate the results of their green efforts. The past studies were conducted to elaborate the green issue only in a limited context, covering the data of normally ten years or by adopting the Hausman test and VAR model [19] to integrate the relationship of green management and firms’ performance. The study conducted by [20,21] compares the performance level of high-performing green financing firms and low-level sustainable development firms. The studies of [20,21] describe the influence of green financing on the economic growth of Vietnam by taking the sample of sustainable development firms with the mediating effect of COVID-19’s shocks. Ref. [21] conducted a study of the stock market capitalization and economic development. After taking a keen review of the stock market performance (market capitalization), considering the green financing and sustainable development programs and ultimately aiming to fill the gap in the previous studies, this study aimed to check the simultaneous combined effect of green factors: (1) green finance investment activities; (2) green trading and economic activities; (3) green environmental and climatic projects; (4) green renewable energy projects; (5) green social and public policies projects, with the controlling effect of (6) exchange rate and human development index on the performance of the Pakistan Stock Exchange and the New York Stock Exchange. This study uses the techniques of ARDL [20], taking the sample data for green financing and stock market capitalization of the firms listed n PSX and NYSX from 2000–2020. To prove the significance and objectives of this study, the remaining sections are structured as follows: the Methodology section (3) follows the Literature Review section (2); then there is the Data Analysis and Discussion section (4), and the Conclusion, Future Recommendations, Implications and Policy Implications, and Limitations section (5) is the last part of this green finance study, in which we compare the results and findings with the literature review and problem statement.

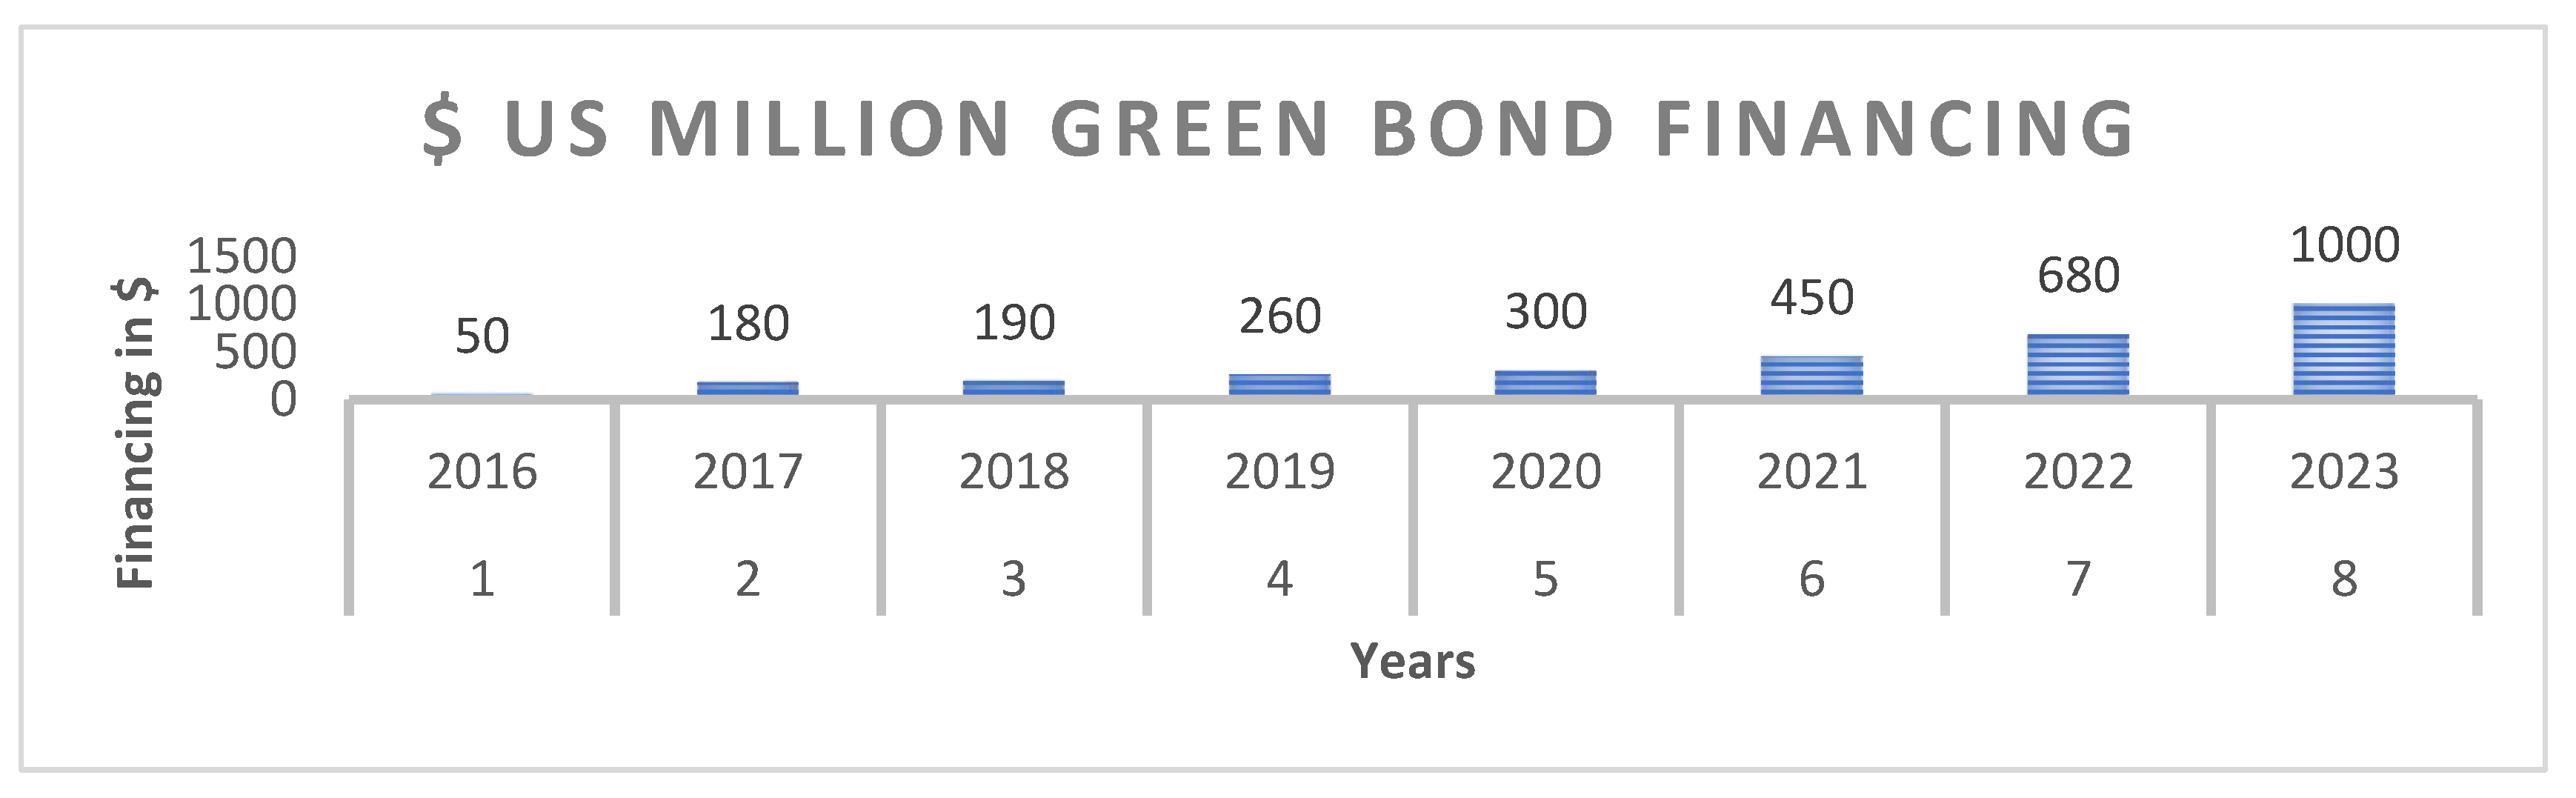
1.1. Green Financing Management in United States of America

The United States is occupying about one-fifth of the whole world. There have been many destructive events in most of the areas of the USA due to environmental and climatic abrupt changes. There have been volcanos, tornadoes, ocean strong winds, ocean floods, and forests cultivating on a large scale due to the dwelling of the residents. The shortfall of energy, the less air per capita, the future problems for the oil industry, the imposed wars of the USA on underdeveloped countries, the craze for power over of the whole global village, and the recent presidential election in the USA are the major instances that justify the green management activities in the United States. The United States is involved in green financing programs to combat energy needs and demands. It has started many sustainable development programs under the UNDP and United Nations charter to promote the environment.
In the USA, the cottage investors and consumers are provided green loans for the sake of environmental and renewable energy projects. The green loans are helpful for the construction of solar panel roofs, energy saving gadgets, the automation of solar energy ATMs, wind energy projects, fossil fuels energy, energy saving gas and electric meters [22]. Green personal loans are also being aided by the UNDP (United Nations Development Programs) and under UNEP (United Nations Environmental Planning) for the installation of energy saving and eco-friendly gadgets which are fixtures of the automation of homes, hotels, restaurants, and kitchens, in addition to solar panels [23]. Green home finance loans are also provided to the residents of far-flung and depressed areas so that they would be able to construct buildings under sustainable development plans and also renovate the infrastructure for green social and environmental projects so that the climate would be eco-friendly for all the residents of the USA and its neighboring countries as well.
Figure 1 presents the graphical representation of green financing in US dollars. We can observe that the trend of green financing bonds by USA investors for the sustainable development institutions increased every year between 2016–2021, while forecasting is also being conducted for the upcoming years.
The Figure 2 describes the market share of green bonds, social bonds, sustainability-linked loans, sustainable bonds, green Loans, and sustainability-linked bonds in the green finance market in the united states. It can be estimated that all of the green finance programs will show an upward increasing trend; only in the COVID-19 pandemic years of 2018–2020 is the demand for green loans and sustainability-linked loans falling down in United States.

1.2. Green Financing Structure in Pakistan

Since the last two decades, the Pakistan is facing a severe energy crises that needs the serious attention of the policy makers and energy-related firms in Pakistan. To combat the energy crises, the different commercial banks of Pakistan, under the supervision of the State Bank of Pakistan (SBP), have launched different green energy projects to promote their energy structure. The commercial banks and SMEs banks in Pakistan are supporting green loans to the firms which are making solar panels and other automated gadgets which are controlled and run by the green energy. The installation cost is high, but this is a one-time cost before startup. Green energy sector firms are registered on the Pakistan Stock Exchange as well; therefore, they contribute towards the performance of the capital market of Pakistan. The access of firms (listed on PSX) to green investment banks for renewable energy financing projects is easy and with minimal terms and conditions. The current and past Prime Ministers (PMLN and PTI) also stressed the need to pursue a clean and green Pakistan. The position of Pakistan in the international Environmental Performance Index (EPI) is 142. This is a low position, but it is expected to grow in the near future if consistent public policy and green social projects for the sustainable development of Pakistan are undertaken. Currently, in Pakistan, many green finance projects are under consideration by the higher governance, just like green projects in China and Nepal. Green wind and climatic projects are also under consideration by the green firms of Pakistan. In CPEC, many green projects are being initiated with the help of Russia, China, Turkey, and many other Eastern states. Special green packages are being offered from the Asian Development Bank (ADB) and the World Bank (WB) to Pakistan, just as ADP and WB are offering to India, Nepal, Sri Lanka, Bangladesh, and Bhutan. At present, Pakistan is spending almost USD 1.8 billion out of a USD 18.5 billion package on green climatic projects. The rest of the amount is for the other green finance projects in Pakistan. China is the big stakeholder in the green financing programs of Pakistan. It promised to provide almost USD 6.7 billion by the end of 2021. On the other hand, the USA and China both are asserting the SBP for the continuation of green bonds and green loans to fulfill the green financing needs of Pakistan.

2. Literature Review

This part of the study contributes to the existing literature on green financial activities after conducting an in-depth review of the different theoretical and empirical advances of previous researchers. The green finance sustainable development programs in the USA and Pakistan have been in vogue since in last two decades after the many upheavals of the previous century in social, moral, economic, trading, ecological, climatic and financial banking activities. The literature also demonstrates that stock markets are hand in hand with the green financing firms. NYSX and PSX have been playing a pivotal role in the financial and economic growth of the USA and Pakistan since its evolution. Owing to the popularity of green financing projects, the shares of the green management firms have had a higher capitalization growth rate both in dividends attraction and capital prices in the stock markets of Pakistan and USA. Therefore, to strengthen the support and justification of this study, we are inclined to present this section of the green financing sustainability study in two parts, which are as follows.

2.1. Theoretical Background of the Study

The green finance sustainable development projects are supported by the EURACE agent-based macro-economic model [13]. This theoretical model discovers that a well-knitted mechanism of economic policy is aimed to foster the growth of green investment, especially in the area of renewable energy. This model is also linked with the mechanism of firms’ performance in stock markets. According to this model, the imported fossil fuels are more effective in energy generation, with the positive flow of funds in the capital markets by the investors resulting in positive developments in the employment rate, GDP, and inflation rate. This model also supports that the consumption power of households for renewable energy products is increased, resulting in sustainable growth in the economic and ecological system [13].
Another theory that gained much popularity in the area of green financing is the grey systems theory. The grey systems theory was originally presented by [24] at the International Conference on Green Financing in Nanjing, China. Ref. [24] argues that the whole world is working on the principles of grey financing. According to grey finance theory, Artificial Intelligence techniques are playing a key role in the justification of micro-finance and macro-finance [7]. On the other hand, [25] have applied the grey system theory in their study to mitigate the supplier selection processes for green financing sustainable development projects. Ref. [25] also contributed to aligning the grey system theory with the fuzzy set theory and maintained that problems of decision making and practical follow up should be controlled by combining them. The grey system theory also suggests how to mitigate the risk faced by banks which are providing green loans for sustainable development programs [22,26]. The grey system theory has its application in electronic materials such as solar panels; in sustainable development such as climatic and environmental programs, which are related to weather disasters and water sanitation for households; and marine eco-environment industries, which are related to ocean life projects [25]. Beyond all these sustainable activities, grey system theory is also applicable in the selection of hospital location with a view to discovering a friendly, calm environment to save the lives of the affected patients [13]; for space selection projects, especially when the weather is abruptly uncertain; and for the financial risk assessment of the economic and trading activities for solar ATMs installed at diversified locations to mitigate the risk of hydroelectricity [22,26].
Green economics is the green finance theory that covers the broader area of sustainable growth development programs and argues that green financing is green economics [27]. According to [28], the whole world is the paradigm of ecosystem and the authors emphasize that markets’ globalizations, financial systems, and abrupt crises all over the financial markets due to news and ecological changes result in the investment in green management projects. Ref. [28] also suggests that all of social structures are linked by the economic and environmental needs and respond accordingly. This theory debates the importance of green management in all economic, climatic, and environmental priorities [29]. The green economics paradigms are mandatory for all the banking, social, taxation, welfare, employment, weather, energy, and sustainable growth projects [30]. The green economics theory also uncovers new areas of eco-disciplines, including the feminism protection projects’ verdicts of the global scholars having different school of thoughts. Green social and economic policies also debate of this theory [27], as these policies determine the income level of households to calculate the GDP/capita to forecast climate change projects and financial management of green projects accordingly.

2.2. The Empirical Literature of the Study

From the empirical literature for the green financing projects, it unfolds that green management has become one of the eminent subjects of the financial projects. The sustainable, environmental, and energy-based projects are gaining popularity among the domestic and cottage investors, and larger firms are harvesting the opportunity of green products through investment by green loans and green bonds. The fossil fuels projects, energy solar panels, wind energy plants, green financial loans and bonds, green feminization, green ATMs technology, green pollution projects, green sanitation and water projects, green micro and macro policies, green talent hunt programs, green plantation projects, green climatic projects, green weather technology, green housing schemes through green loans, and green marine management are the broader areas of green financing, which are supported by the empirical literature of Pakistan, USA, and globally as well.
Ref. [20] observed the relationship between green management financing and economic growth of the firms. The sampled firms are listed on the Vietnam Stock Exchange (VSE). They argued that firms which are financed for green projects, especially sustainable development projects, are more progressive in terms of the economic development; even during the COVID-19 pandemic, the firms with green products performed better on the Vietnam Stock Exchange than non-green firms [8]. Refs. [30,31,32,33] also observed during the recent pandemic that COVID-19 influences positively the financial growth of firms which undertake green energy- and environmental protection-related projects. It is also observed, on the basis of strong empirical evidence, that green financing loans provided by the green banks also undertake a key role to stimulate economic growth because these loans are only supplied to firms which are engaged in demanding and producing green products as these firms are likely to pay the green loans with no risk [30,31,32,33]. The stock returns associated with the firms listed on PSX and other exchanges, such as NYSE, LSE, and ASX, have strong relationships with macroeconomic factors such as exchange rate, GDP, and prevailing uncertain inflation (CPI). The green financing products of green firms are directly or indirectly related to the microeconomic factors [30,31,32,33]. Ref. [34], in his causality study, found that real exchange rates and GDP impact green technology projects. Prices of green imported technology and products are highly correlated with the exchange rate of the country [34]. The stock prices of the green firms are the reflection of the green products’ sales in financial and non-financial markets. In addition the green energy renewable projects fluctuate as the exchange rates of the countries engaged in green projects experience upheaval [35].
The research work of [36] unfolds the ecological economics that play a key role in green management financing. The central banks have the key concern for controlling and monitoring green financing projects [37,38]. In their studies, [36] observed that central banks promote green technology-related projects by supporting renewable energy firms and sustainable development programs. They ascertained that central banks have access to IMF and World Bank databases in connection with green financing activities; accordingly, these are able to support climate- and environment-related projects and adapt their policies as per the green management demand of firms [37,38]. The consensus about supporting the central bank for green management financing projects is mixed. On the other side [11], the central banks have a weak structural paradigm for supporting environmental and climatic change programs. In their database study of 135 central banks, [39] claim that almost 40% of central banks are supporting the government and public policy-related projects; whereas only 12% of central banks are involved in the operations of green bonds and green financing loans to promote the green financing firms’ products.
The performance levels of the green management firms is determined by the efficiency of the stocks of these green-based firms. In the stock markets, the shares are regulated and monitored by the exchange authorities, but the prices of stocks are the results of larger numbers of buyers and sellers who behave according to the efficient market hypothesis (EMH: Fama and French) [40]. This model (EMH) demonstrates that stocks of green firms and non-green firms both follow the principles of EMH [40]. Another theory, named the random walk theory [41], also follows the principle of EMH. According to random walk theory, the investors behave as fundamental analysts and technical analysts [41]. Ref. [2] found that the financial information of the green finance- and non-finance-based firms is highly correlated with the stock returns, which is consistent with the arbitrage pricing theory [16]. Ref. [34], in their study of the relationship between the stock market and economic growth in Kenya found that an increase in the NSE-20 share index potentially signals the markets expectation of higher dividends, corporate profits, and, in turn, higher economic growth.
The findings of [37] determine that there were varied behaviors and financial performance of individual investors in Kenya, with some investors exhibiting rational behavior during the investment decisions, while others were involved in irrational activities. The objectives of the study are based on a gap in the exiting literature, discovered Through the keen review of problem statements. On the basis of justified theoretical and empirical support, we were able to construct the following tentative hypotheses for the financial indicators’ performance (both NYSX and PSX), green finance factors, and controlling indicators.
Firstly, “If we promote the green investment financial projects (H1), then financial performance of both NYSX and PSX is enhanced.” Secondly, “If green economic and trading projects (H2) are developed in the USA and Pakistan, then capital markets’ financial indicators of both the USA and Pakistan are expected to be augmented.” Moreover (H3), “If the green companies are inclined to boost the green climatic and environmental activities in the USA and Pak (H3), then it is definitely probable to expect a meaningful change in the indexes of Pakistani and American stock exchanges.” Fourthly, “If the firms are permissible for renewable energy green projects in the USA and Pakistan (H4), then trading financial indexes of PSX and NYSX are jacked up consequently.” Coming to the next hypothesized statement (H5): “If the public policy and social green projects are prompted in enriched green areas of both the USA and Pakistan, then financial indicators’ performance of PSX and NYSX may obviously be produced.” Successively, “If the foreign exchange rate (FXR, H6) in the USA and Pakistan is stable during the phases of green projects, then financial indicators of both PSX and NYSX are expected to perform significantly.” Finally, “If the index for human development (IFHD, H7) for the green labor markets of Pakistan and the USA is projected to be significant and refined, then the stock markets of both the USA and Pakistan may be expected to behave positively to protect the green investors’ interests in return for the green investment”.

3. Methodology of the Study

It is argued that before estimating the data and to test the constructed hypotheses of any study, it is necessary to present the appropriate methods of estimation [5]. The Methodology section of the current green financing and financial indicators’ performance study is presented in the following segments.

3.1. Research Design of Study

This green financing and financial indictors’ performance study is descriptive and explanatory in nature that ensures a cause-effect relationship. Therefore, we can say that this study identifies the causal relationship between financial indictors’ performance (PSX and NYSE markets capitalizations as percentage of GDP) and all green financing projects, including the green finance investment activities, green trading and economic activities, green environmental and climatic projects, green renewable energy projects, and green social and public policies projects. The causal relationship makes this green business study comprehensible even for the general person who has little bit knowledge about the financial activities of the financial markets [42]. The causal relationship (cause–effect) becomes stronger if some controlling factors are involved in the study. Therefore, the exchange rate and the human development index are used as the controlling factors to make this causal relationship more reliable.

3.2. Sampling and Data Measurement

This study uses the purposive sampling technique; it is clear from the article that only those firms listen on PSX and NYSX are the samples which are involved in green financing programs and projects. As to their green products, either they are floating green bonds or acquire green loans to continue their operations. The green firms are from the investment sector, trade sector, energy sector, economic sector, social sector, policy sector, labor sector, and financial sector. The data of this study are secondary in nature and are collected from the official website of NYSX, PSX, daily business recorders, annual reports of the Federal Reserve system, USA, annual reports of State Bank of Pakistan, annual reports of the Energy Commission of Pakistan, annual reports of World Bank indicators, annual reports of international financial statistics and annual human development reports of UNDP for the period 2000–2020 (20 years green data for Pakistan and USA). The following Table 1 elaborates all the factors (predictors and predicted) with their measurements along and data sources.

3.3. Methodology and Techniques for Estimation and Analysis

This green finance projects–financial indictors’ performance study is deductive in nature; it measures the effect of predictors on the predicted factor (cause–effect relationship) and verifies the results of previous studies in the area of sustainable development programs. The data analysis of this study has been undertaken through EViews version 7, the most reliable financial statistical and mathematical software; many researchers of the past have used it to establish a solid causal relationship [43,44]. We applied different tests in this study, such as augmented Dickey–Fuller test, to check the stationarity of the data (the accepted value is 2 if p ≤ 0.05) to avoid spurious relationships. The stationarity was also checked through the Levin, Lin, and Chu Test (accepted value is −2.69 if p ≤ 0.05), and Pearson and Shin W-stat (if p ≤ 0.05). The purpose of the ADF test is to check the null hypothesis (H0) that unit root is present in the data and the alternative hypothesis (H1) that there is no unit root in the data. This study selects the autoregressive distributive lag (ARDL) model for the estimation of results on the basis of data specifications after checking the stationarity of the data. ARDL is applied on those data where some factors are stationary at level and the remaining factors become stationary at the first difference or first unit root [45,46]. In the green management financing studies, as the firms are the samples, Pooled OLS [47] is applied where p-values of all the factors are <0.05, showing that all the factors are stationary at level. The VECM (vector error correction model) is applied on those data where all the factors are not stationary at level, otherwise these factors become stationary at first difference or first root [14].
The general mathematical model to check the unit root in the data is given:
D (Yt) = α0 + βt + ƳYt−1 + D (Yt (−1)) + µt.
In the above model, α0 is the intercept at constant, β is the slope tangent of the ADF equation, Y is the estimated study variable, which is also called the coefficient of the study Factor(s), and µt is the error term involved in the ADF test equation. Keeping in view the above general unit root test equation, the following models are developed to check the unit root of the data in each study variable.
To check the stationarity of the data by ADF test for green investment and financial projects, the following model is developed:
D(GIAFPt) = α0 + βt + GIAFPt−1 + D(GIAFPt (−1)) + µt.
For stationarity of green economic and trading projects, this equation is tested:
D(GEATPt) = α0 + βt + GEATPt−1 + D(GEATPt (−1)) + µt.
For stationarity of green climatic and environmental activities, this ADF test is run:
D(GCAEAt) = α0 + βt + GCAEAt−1 + D(GCAEAt (−1)) + µt.
For stationarity of renewable energy green activities, the following ADF model is tested:
D(REGPt) = α0 + βt + REGPt−1 + D(REGPt (−1)) + µt.
For stationarity of public policies and social green projects, this ADF model is checkedL
D(PPSGPt) = α0 + βt + PPSGPt−1 + D(PPSGPt (−1)) + µt.
In addition, to check the stationarity of data for the controlling factors, foreign exchange rate and index for human development, the following ADF models are tested:
D(FXRt) = α0 + βt + FXRt−1 + D(FXRt (−1)) + µt;
D(IFHDt) = α0 + βt + IFHDt−1 + D(IFHDt (−1)) + µt.
The cointegration is also undertaken in the studies where ARDL and VECM models are applied after checking the unit root of the data. This statistical valid measurement tests the long run relationship between two non-stationary time series. We applied the ARDL bound test to check the cointegration of our datasets [14]. The mathematical model of ARDL Bound Test for Cointegration is given below:
∆ (FIPt) PSX, NYSX = α0 + ∑ δ1 ∆FIPt−1 +∑ δ2 ∆ GIAFPt−1 + ∑ δ3 ∆GEATPt−1 + ∑ δ4 ∆GCAEAt−1
            + ∑ δ5∆REGPt−1 + ∑ δ6 ∆PPSGPt−1 + ∑ δ7 ∆FXRt−1 + ∑ δ8 ∆IFHDt−1 +
             Ψ1FIPt−1 + Ψ2 GIAFPt−1 + Ψ3 GEATPt−1 + Ψ4 GCAEAt−1 + Ψ5 REGPt−1 +
  Ψ6 PPSGPt−1 + Ψ7 FXRt−1 + Ψ8 IFHDt−1 + µt.
In the above model, α0 is the intercept, δ1, δ2……… δ8, are the estimates of the lagged value of first difference of the dependent and independent factors; Ψ1, Ψ2………. Ψ8 are the coefficients of lagged value of predicted and predictors; and µt is the “error term” in the ARDL Bound Test equation.
The ultimate objective of this study is to establish the long run effect of green financing projects on financial indicators’ performance (FIP). For that, the ARDL robust analysis is applied. The structured model for ARDL robust analysis is given below:
FIPt = β0 + ∑ α1 FIPt +∑ α2 GIAFPt +∑ α3 GEATPt + ∑ α4 GCAEAt + ∑ α5REGPt +
∑ α6PPSGPt + ∑ α7 FXRt + ∑ α8 IFHDt + εt.      
In the above equation, β0 is the intercept of equation, α1, α2. ………. α8 are the coefficients of FIP of PSX and NYSX, and all the green finance predictors, where εt is the error term present in the ARDL robust analysis equation.

4. Data Estimated Results, Findings, and Discussion

This section of the study is aimed to present the results which are generated by running the data into the EViews version 7, which is user friendly. Descriptive statistics are present in the following Table 2.
Almost all the means for the Pakistani green projects and controlling factors (FXR, IFHD) are high and acceptable (round or >3), other than the GIEFP and GEATP; on the other side, all the mean scores for the USA’s green projects and controlling factors are also as high as >3; only the mean score for GIAFP < 3 (2.75); the rest are acceptable. The S.D. values for the Pakistani green factors and controlling factors (CFs) show greater dispersion of all the data around the mean other than the REGP (0.78-low dispersion); similarly, for the USA, all the S.D. values show greater dispersion around the M.V.; only the REGP (1.78:S.D.) and IFHD (1.25:S.D.) show moderately low dispersion of data. Overall, all the descriptive statistics are good enough to be accepted.
The correlation matrix of the desired relationship shown below (Table 3), describes the significant relationship for all the predictors (green factors and controlling factors) and the FIP (predicted). This matrix is based on the results of the Pearson’s correlation test in EViews (software for social sciences analysis). The values (left portion) in the given Table 3 predict the significant average positive relationship between all the factors in case of financial indictor performance of PSX, where few relationships are also negatively significant; while, in case of financial performance for NYSX, the relationship between predictors and predicted is more significant than the PSX case, and only a few relationships are negatively significant, indicating that green financing projects increase the business level of the financial markets and resultantly increase the demands for the green companies’ securities because of the attraction for the investors in this innovative area of study.
To run ARDL model, first, it is ensured that all the data series should be stationary. To make the data stationary, the augmented Dickey–Fuller test (ADF-test) is applied to avoid spurious relationships. The models/equations for all the ADF-tests on each of the factor (green/controlled/predicted) are shown in the methodological portion (Section 3). For the PSX-case, the results (left side of Table 4: ADF-tests) indicate that only three factors are stationary at level, while five models (GEATP, GCAEA, FXR, IFHD, and FIP) are stationary at first difference or first order; on the other hand, the results (ADF-tests, Table 4) for the NYSX-case indicate that four factors are stationary at level; whereas the remaining four factors become stationary after taking the first order/first difference.
ARDL bound test is run to check the co-integration between two or more non-stationary time series data (ARDL model). The test is run at all significant levels (1%, 5%, and 10%) to check if the critical value becomes required (3.457 is acceptable). The results of the bound test (Table 5) are shown below at level and at first order (−1). For the ARDL bound test, the F-score (should be >10) is also shown for both PSX-FIP/all predictors and NYSX-FIP/all predictors, which is accepted (∵ F = 35.85 and 76.25).
In the last section of results and findings, to check the long-term effect of all the green financing and controlling factors on FIP for both PSX and NYSX, the robust analysis for ARDL has been conducted in EViews version 7. The robust analysis technique (ARDL) ensures the impact of all green financing factors on the performance level of PSX and NYSX (the market capitalization growth of PSX and NYSX during trading).
The results of the ARDL estimates for long-term robust analysis are given in Table 6 and Table 7. In the case of PSX, the findings (Table 6) expose that green investment and financial projects (GIAFP) have an insignificant effect (t-value = 1.68 < 1.96; p = 0.197 < 0.05) on the financial performance of PSX (FIP), which indicates the low level of investment in the stocks of green companies and green bonds in Pakistan. This insignificant result leads to the rejection of the first hypothesis and, resultantly, the first objective of this study is not met. These results are consistent with the results of [13,48], who also observed a similar insignificance for green finance investment activities and suggest avoiding the super deals in green common stocks and loans. Comparatively, for the financial performance of NYSX, the findings reveal that GIAFP have a significant impact (t = 2.85; p = 0.028) on the performance of NYSX indicators (FIP). This supports the first hypothesis of the study and meets the first objective in the case of NYSX performance. For green economic and trading projects, the results determine that they have a significant impact on FIP in the case of PSX, due to the significant t-value (2.544) and p-stat (0.032), which both indicate that the PSX indicator (FIP-PSX) is increased through investing in economic and trading green projects. With respect to the significance of the results regarding our second hypothesis, we are able to meet the second objective of study. These results are consistent with [2], who also recommended the trading and economic green projects as positive and healthy signs of for increase of PSX indicator (FIP-PSX). In the case of NYSX performance (FIP-NYSX), against our expectations, we find that green economic and trading projects (GEATP) have insignificant effects on the NYSX-FIP (t-stat = 1.562; p = 0.112). These insignificant results lead to the rejection of the second hypothesis of the study in the case of NYSX-FIP; resultantly, our second objective is not met. It is observed (Table 6) that green climatic and environmental activities (GCAEA) are significant predictors of FIP-PSX (t-value = −2.17; p = 0.047), which leads to the acceptance of our third hypothesis in case of PSX’s financial performance and also meets the third objective. This positive indication of GCAEA for the FIP-PSX is consistent with the results of [8,28,48]. In the case of NYSX, the results show that GCAEP also have a strong, significant impact on the FIP, owing to a significant t-value (−3.234) and highly significant p-value (0.003 < 0.05). Therefore, the third hypothesis, in the case of NYSX-FIP, is also accepted, leading to the fulfillment of third objective as well. The higher t-score for GCAEP in the case of the USA indicates that climatic and environmental related firms’ stocks are frequently traded in the capital markets of the USA. It can be noticed from the Table 6 that all the renewable energy green projects (REGP) have a significant effect (t-value = 4.766; p-stat = 0.002) on the PSX-FIP, leading to the acceptance of the fourth hypothesis and ultimately meeting the fourth objective; this all indicates the prevailing trend of green projects in renewable energy in Pakistani firms subscribed to PSX. These findings are aligned with the results of [20,21] in the case of REGPs. On the contrary, the results (Table 6) indicate that GREP is an insignificant predictor (t-value = 1.113; p = 0.234 > 0.05) of FIP-NYSX, resulting in the rejection of the fourth hypothesis, which does not support the fourth objective of the study. This indicates that stocks of REGPs’ firms are less frequently traded on NYSX compared to other green projects. The results (Table 6) also show that public policies and social green projects do not predict the PSX-FIP significantly, owing to an insignificant t-value (1.182) and p-value (0.198). Because of these insignificant estimates, the fifth hypothesis is rejected in case of PSX-FIP; thus, the fifth objective is not fulfilled. These results are consistent with the studies conducted by [14]. This insignificance indicates that social and public policies-related projects are not satisfactory contributors towards the financial performance of PSX (FIP-PSX). However, on the other hand, in the context of the USA, the PPSGP is a highly significant predictor of NYSX-FIP (t-value = 3.578; p= 0.002). This supports the fifth hypothesis in the case of NYSX-FIP, thus meeting the fifth objective of the study for the USA. As far as controlling factors (FXR and IFHD) are concerned, the results indicate that FXR is the significant predictor of PSX-FIP (t-value = 2.011; p= 0.046) and also for the NYSX-FIP; the FXR is significant (t-value = 2.984; p= 0.023), leading to the acceptance of sixth hypothesis of study and also meeting the relevant objective in the case of both FIP-PSX and FIP-NYSX. These findings of the study are aligned with the results of [16,30,37]. For the PSX financial indicator’s performance, the results (Table 6) indicate that IFHD impacts highly significantly on PSX-FIP (t-value = 3.423; p= 0.004), which supports the last hypothesis and meets the seventh objective of the study. On the contrary, for NYSX financial indicator performance, IFHD is the insignificant predictor for NYSX-FIP, rejecting the last hypothesis; resultantly, seventh objective in case of FIP-NYSX is not achieved. Similar results were observed by [30,37].

5. Conclusions, Policy Implications, Limitations, and Recommendations for Future Researchers

This chapter presents the brief and concise summary of the conclusion based on the empirical results and findings of this research attempt. The policy implications of this research paper are also part of this section. The researchers also have to face a lot of limitations while conducting the research; this section also encompasses those limitations. Future researchers need guidance from the research findings of the previous studies; this part of the study also provides recommendations to researchers in this area of green financing.

5.1. Conclusions and Policy Implications of the Study

The green management studies encompass many subject areas of interests to researchers, including the sustainable development programs, environment protection green projects, green financing areas (corporate green bonds, green funds, and corporate green stocks), energy renewable green programs, and the climatic green projects, etc. These areas of green studies inspire and motivate researchers to investigate the depths of these areas and reach significant conclusions to benefit the residents of the Earth. Many green environmental protection agencies are operating green projects all around the world to save the Earth from the mass destruction. Owing to these justifications, this study is an attempt to investigate the green projects for trade, investment, financial aspects, renewable energy, climate, and public policy green projects concerning the performance of the PSX and NYSX. To test the green concerns empirically for the financial performance of PSX and NYSX, a number of factors—green investment and financial projects, green economic and trading projects, green climatic and environmental activities, renewable energy green activities, public policies and social green projects—have been extracted from the green literature. The effect of the controlling factors, namely, the foreign exchange rate and the human development index, on the performance of PSX and NYSX is also tested. The impact of all the green financing elements and controlling factors in the long-term are checked for the period 2000–2020 (20 years), using ARDL robust analysis with ADF test, Pearson correlation analysis, and descriptive analysis. Before estimation, it was expected that all the green and controlling factors will significantly affect PSX-FIP and NYSX-FIP. However, contrary to this expectation, we concluded that green investment and financial projects and public policies and social green projects insignificantly affected for financial performance of PSX; while, on the other hand, it is concluded that public policies and social green projects, renewable energy green projects, and the human development index insignificantly affected insignificantly the financial performance of NYSX. These mixed (significant and insignificant) results stimulate researchers and institutions to promote the green financing.
This green financing projects and financial performance-interlinked study investigates the formulation and implementation of structured and constructive policies for green financing projects in the far flung areas of the USA and Pakistan, in service of sustainability of the inhabitants of these areas. The insignificant results of this green financing study prompt policy makers to reconsider policies regarding insignificant green financing and controlling factors. The policy makers in Pakistan are required to explore the weaknesses and implications of this study for green investment and the financial sub-elements, such as investment in green bonds and stocks and green commodities securities. Furthermore, the financial and regulatory authorities of the Pakistan Stock Exchange (PSX) must investigate why the securities markets are slow with respect to green investment in financial companies and also in social public policy-related companies. As far as the financial performance of NYSX is concerned, the regulatory authorities must restructure the policies for green economic and trading firms’ performance, and the performance of green renewable energy firms should be also reconsidered and reconciled as well. In addition, the state owned regulatory institutions must realize the importance of green trading projects and renewable energy programs to investors and households. Those companies which are not following the green rules and raising awareness about green projects to save the environment from mass destruction should be fined and ultimately locked out. Finally, policy makers of the USA and Pakistan and the regularity bodies of these developed and developing nations must arrange seminars for the promotion, development, awareness, formulation, and implementation of green financing projects in service to the true performance of PSX and NYSX (i.e., market capitalization growth).

5.2. Limitations and Future Recommendations

For the successful completion of any research project, the timely availability and supply of data is a recognized supplement, otherwise findings are hard to meet. This study was conducted for the period 2000–2020 by taking the time series data for the market capitalization of PSX and NYSX and secondary time series data for green financing elements and controlling factors. The compilation and extraction of data for the period 2000–2010 (10 years) became difficult because green projects are newly born (starting mostly since 2020) in Pakistan, and published data is limited in the hands of S&DP (UNDP) departments only. The managers in these departments are less cooperative, while obtaining the data for the USA and NYSX was also a the hard task. In any case, the data was ultimately compiled by the sources discussed in Table 1. Moreover, many of the green companies do not have sufficient published data even for their own green projects, and PSX’s reports were also ambiguous regarding the yearly time series data for the listed green companies. As regards the second limitation, the annual data is used for ARDL robust analysis of the estimation of the results and findings. The study’s findings could have been more reliable by using the quarterly or monthly data series for PSX and NYSX and for listed green companies. Finally, the PSX and NYSX seem to be more attentive towards the protection of non-green companies than green financing firms, which also poses limits on findings of our study due to which few insignificant findings are achieved, and objectives are not fully accomplished as were expected.
Concerning future research direction, for the development and implementation of green financing projects, it is recommended that the corporate governance code must by synchronized to accelerate the needs and growth of green projects in Pakistan and the USA, even though these practices are already frequently in vogue in USA. Secondly, the more significant findings can be explored by conducting a similar sort of study for monthly and quarterly time series data. Thirdly, instead of applying the ARDL estimation by time series data, the study findings may be achieved by using the OLS pooled regression model for cross-section data series after testing the random effect or fixed effect through the Hausman test. Fourth, this study has been conducted for a twenty year period (2000–2020); in future, data series beyond 20 years (attained by increasing the data size) may be tested, either by including more green projects such as sustainable development projects, or by deleting the existing elements of green financing. Fifth, instead of using the FXR and IFHD as controlling factors, these (FXR and IFHD) can be used as mediators or moderators for the constructive findings. Finally, it is recommended that the regulatory, monitory, and constitutional authorities of Pakistan and the USA promote the awareness for green financing projects through more seminars, workshops, training sessions, and social media publicization and that they publicize it through print media as well. They, along with the collaboration of green firms as partners, must facilitate and encourage the researchers who provide green literature and green innovation projects.

Author Contributions

The idea was provided by J.Y., M.N.J.M. and M.H.; M.N.J.M., J.Y., M.H., M.A.K. and R.S. have conducted data acquisition, analysis, and written the whole draft. J.Y. and M.N.J.M. read and approved the final version. All authors have read and agreed to the published version of the manuscript.

Funding

This research received no external funding.

Institutional Review Board Statement

Not applicable.

Informed Consent Statement

Not applicable.

Data Availability Statement

Not applicable.

Conflicts of Interest

The authors declare no conflict of interest.

References

  1. BIS. Issues in the governance of central banks. In A Report from the Central Bank Governance Group; Bank for International Settlements: Basel, Switzerland, 2009. [Google Scholar]
  2. Haq, I.U.; Maneengam, A.; Chupradit, S.; Suksatan, W.; Huo, C. Economic Policy Uncertainty and Cryptocurrency Market as a Risk Management Avenue: A Systematic Review. Risks 2021, 9, 163. [Google Scholar] [CrossRef]
  3. BIS. Central Bank Governance and Financial Stability. A Report by a Study Group; Bank for International Settlements: Basel, Switzerland, 2011. [Google Scholar]
  4. D’Adamo, I.; Gastaldi, M.; Morone, P. The post COVID-19 green recovery in practice: Assessing the profitability of a policy proposal on residential photovoltaic plants. Energy Policy 2020, 147, 111910. [Google Scholar] [CrossRef]
  5. Sadiq, M.; Nonthapot, S.; Mohamad, S.; Ehsanullah, S.; Iqbal, N. Does green finance matter for sustainable entrepreneurship and environmental corporate social responsibility during COVID-19? China Financ. Rev. Int. 2021, 12, 317–333. [Google Scholar] [CrossRef]
  6. Bogdan, A.; Istudor, N.; Gruia, R.; Tobă, G.F.; Bulz, N.; Gâf-Deac, I.; Paşalău, C. New holistic approach of bioeconomics and ecoeconomics theories, practical bridging from the green economy to blue economy, trough new integrated and innovative paradigm about “bio-eco-geo-economy”. Procedia Econ. Financ. 2014, 8, 83–90. [Google Scholar] [CrossRef] [Green Version]
  7. Ding, J. The relations study on green finance and upgrading of industrial structure in China-based on grey correlation analysis model. In Proceedings of the 2019 3rd International Conference on Education, Culture and Social Development (ICECSD 2019), Guilin, China, 28–30 June 2019. [Google Scholar]
  8. Mallick, D.; Rahman, A. Inclusive economic growth and climate-resilient evelopment in Bangladesh. In Bangladesh’s Economic and Socialprogress; Springer: Berlin/Heidelberg, Germany, 2020; pp. 89–114. [Google Scholar]
  9. Nazir, M.S.; Nawaz, M.M.; Gilani, U.J. Relationship between economic growth and stock market development. Afr. J. Bus. Manag. 2010, 4, 3473–3479. [Google Scholar]
  10. IPCC. Global Warming of 1.5 °C—Summary for Policymakers; IPCC: Incheon, Republic of Korea, 2018. [Google Scholar]
  11. NGFS. First Progress Report—October 2018; Central Banks and Supervisors Network for Greening the Financial System: Paris, France, 2018. [Google Scholar]
  12. Okodua, H.; Ewetan, O.O. Stock market performance and sustainable economic growth in Nigeria: A bounds testing co-integration approach. J. Sustain. Dev. 2013, 6. [Google Scholar] [CrossRef] [Green Version]
  13. Ponta, L.; Raberto, M.; Teglio, A.; Cincotti, S. An agent-based stock-flow consistent model of the sustainable transition in the energy sector. Ecol. Econ. 2018, 145, 274–300. [Google Scholar] [CrossRef] [Green Version]
  14. Sinha, A.; Mishra, S.; Sharif, A.; Yarovaya, L. Does green financing help to improve environmental & social responsibility? Designing SDG framework through advanced quantile modelling. J. Environ. Manag. 2021, 292, 112751. [Google Scholar]
  15. Zhou, X.; Tang, X.; Zhang, R. Impact of green finance on economic development and environmental quality: A study based on provincial panel data from China. Environ. Sci. Pollut. Res. 2020, 27, 19915–19932. [Google Scholar] [CrossRef]
  16. Raza, S.A.; Jawaid, S.T.; Afshan, S.; Abd Karim, M.Z. Is stock market sensitive to foreign capital inflows and economic growth? Evidence from Pakistan. J. Chin. Econ. Foreign Trade Stud. 2015, 8, 142–164. [Google Scholar] [CrossRef] [Green Version]
  17. Magani, A.G.; Magani Ochieng, R. Anatomy of Asset Pricing: Single-Factor, Multi-Factor, Arbitrage and Behavioural Asset Pricing Models. 2020. Available online: https://www.researchgate.net/profile/Geofrey-Magani/publication/343682628_Anatomy_of_Asset_Pricing_Single-Factor_Multi-Factor_Arbitrage_and_Behavioural_Asset_Pricing_Models/links/5f38cbff458515b729246a21/Anatomy-of-Asset-Pricing-Single-Factor-Multi-Factor-Arbitrage-and-Behavioural-Asset-Pricing-Models.pdf (accessed on 5 August 2022).
  18. Dzingai, I.; Fakoya, M.B. Effect of corporate governance structure on the financial performance of Johannesburg Stock Exchange (JSE)-listed mining firms. Sustainability 2017, 9, 867. [Google Scholar] [CrossRef] [Green Version]
  19. Alshehhi, A.; Nobanee, H.; Khare, N. The impact of sustainability practices on corporate financial performance: Literature trends and future research potential. Sustainability 2018, 10, 494. [Google Scholar] [CrossRef] [Green Version]
  20. Ngo, T.Q.; Doan, P.N.; Vo, L.T.; Tran HT, T.; Nguyen, D.N. The influence of green finance on economic growth: A COVID-19 pandemic effects on Vietnam Economy. Cogent Bus. Manag. 2021, 8, 2003008. [Google Scholar] [CrossRef]
  21. Shahbaz, M.; Khan, S.; Tahir, M.I. The dynamic links between energy consumption, economic growth, financial development and trade in China: Fresh evidence from multivariate framework analysis. Energy Econ. 2013, 40, 8–21. [Google Scholar] [CrossRef]
  22. Wang, X.; Hawkins, C.V.; Lebredo, N.; Berman, E.M. Capacity to sustain sustainability: A study of US cities. Public Adm. Rev. 2012, 72, 841–853. [Google Scholar] [CrossRef]
  23. Owen, R.; Brennan, G.; Lyon, F. Enabling investment for the transition to a low carbon economy: Government policy to finance early stage green innovation. Curr. Opin. Environ. Sustain. 2018, 31, 137–145. [Google Scholar] [CrossRef]
  24. Liu, Z.; Lin, M.; Wierman, A.; Low, S.H.; Andrew, L.L. Greening geographical load balancing. ACM SIGMETRICS Perform. Eval. Rev. 2011, 39, 193–204. [Google Scholar]
  25. Golmohammadi, D.; Mellat-Parast, M. Developing a grey-based decision-making model for supplier selection. Int. J. Prod. Econ. 2012, 137, 191–200. [Google Scholar] [CrossRef]
  26. Wang, W. Research on the correlation between green finance and solid waste disposal based on grey correlation. In E3S Web of Conferences (Vol. 300); EDP Sciences: Les Ulis, France, 2021. [Google Scholar]
  27. Cato, M.S. Green Economics: An Introduction to Theory, Policy and Practice; Routledge: Abingdon-on-Thames, UK, 2012. [Google Scholar]
  28. Hickel, J.; Kallis, G. Is green growth possible? New Political Econ. 2020, 25, 469–486. [Google Scholar] [CrossRef]
  29. Zhang, D.; Mohsin, M.; Rasheed, A.K.; Chang, Y.; Taghizadeh-Hesary, F. Public spending and green economic growth in BRI region: Mediating role of green finance. Energy Policy 2021, 153, 112256. [Google Scholar] [CrossRef]
  30. Zhang, S.; Wu, Z.; Wang, Y.; Hao, Y. Fostering green development with green finance: An empirical study on the environmental effect of green credit policy in China. J. Environ. Manag. 2021, 296, 113159. [Google Scholar] [CrossRef]
  31. Zhang, X.; Jin, Y.; Shen, C. Manufacturers’ green investment in a competitive market with a common retailer. J. Clean. Prod. 2020, 276, 123164. [Google Scholar] [CrossRef]
  32. Olweny, T.O.; Kimani, D. Stock market performance and economic growth Empirical Evidence from Kenya using Causality Test Approach. Adv. Manag. Appl. Econ. 2011, 1, 177. [Google Scholar]
  33. Muhammad, N.; Rasheed, A.; Husain, F. Stock prices and exchange rates: Are they related? evidence from south asian countries [with comments]. Pak. Dev. Rev. 2002, 535–550. [Google Scholar] [CrossRef]
  34. Dikau, S.; Volz, U. Central bank mandates, sustainability objectives and the promotion of green finance. Ecol. Econ. 2021, 184, 107022. [Google Scholar] [CrossRef]
  35. Aduda, J.; Odera, E.; Onwonga, M. The Behaviours and Financial Performance of Individual Investors in the Trading Shares of Companies Listed at The Nairobi Stock Exchange, Kenya. J. Financ. Invest. Anal. 2012, 1, 33–60. [Google Scholar]
  36. Ahmed, W.; Najmi, A. Developing and analyzing framework for understanding the effects of GSCM on green and economic performance: Perspective of a developing country. Manag. Environ. Qual. Int. J. 2018, 29, 740–758. [Google Scholar] [CrossRef]
  37. McDaniels, J. Greening the Rules of the Game: How Sustainability Factors Are Being Incorporated into Financial Policy and Regulation-Inquiry Working Paper 18/01 May 2018. Available online: https://wedocs.unep.org/handle/20.500.11822/25525;jsessionid=2DC5D041960AA6BFD09382E16D5E5FB8 (accessed on 5 August 2022).
  38. Sewell, M. History of the efficient market hypothesis. Rn 2011, 11, 4. [Google Scholar]
  39. Malkiel, B.G. Returns from investing in equity mutual funds 1971 to 1991. J. Financ. 1995, 50, 549–572. [Google Scholar] [CrossRef]
  40. Cooper, M.; Norcross, J.C. A brief, multidimensional measure of clients’ therapy preferences: The Cooper-Norcross Inventory of Preferences (C-NIP). Int. J. Clin. Health Psychol. 2016, 16, 87–98. [Google Scholar] [CrossRef] [PubMed] [Green Version]
  41. Salkind, N.J. (Ed.) Encyclopedia of Research Design; Sage: Newcastle upon Tyne, UK, 2010; Volume 1. [Google Scholar]
  42. Anigbogu, U.E.; Nduka, E.K. Stock market performance and economic growth: Evidence from Nigeria employing vector error correction model framework. Econ. Financ. Lett. 2014, 1, 90–103. [Google Scholar] [CrossRef]
  43. Gough, I. Climate Capitalism: Emissions, Inequality, Green Growth: Climate Change, Capitalism and Sustainable Wellbeing; Edward Elgar Publishing: Cheltenham, UK, 2017. [Google Scholar]
  44. GhaffarianHoseini, A.; Dahlan, N.D.; Berardi, U.; GhaffarianHoseini, A.; Makaremi, N.; GhaffarianHoseini, M. Sustainable energy performances of green buildings: A review of current theories, implementations and challenges. Renew. Sustain. Energy Rev. 2013, 25, 1–17. [Google Scholar] [CrossRef]
  45. Hongming, X.; Ahmed, B.; Hussain, A.; Rehman, A.; Ullah, I.; Khan, F.U. Sustainability Reporting and Firm Performance: The Demonstration of Pakistani Firms. SAGE Open 2020, 10, 2158244020953180. [Google Scholar] [CrossRef]
  46. Ren, X.; Shao, Q.; Zhong, R. Nexus between green finance, non-fossil energy use, and carbon intensity: Empirical evidence from China based on a vector error correction model. J. Clean. Prod. 2020, 277, 122844. [Google Scholar] [CrossRef]
  47. Raberto, M.; Ozel, B.; Ponta, L.; Teglio, A.; Cincotti, S. From financial instability to green finance: The role of banking and credit market regulation in the Eurace model. J. Evol. Econ. 2019, 29, 429–465. [Google Scholar] [CrossRef] [Green Version]
  48. Ullah, H.; Wang, Z.; Mohsin, M.; Jiang, W.; Abbas, H. Multidimensional perspective of green financial innovation between green intellectual capital on sustainable business: The case of Pakistan. Environ. Sci. Pollut. Res. 2021, 29, 5552–5568. [Google Scholar] [CrossRef]
Figure 1. Green financing investment in the United States from 2016 to 2023. Source: NYSX and Financial Times.
Sustainability 15 05132 g001
Figure 2. Green financing investment in United States from 2016–2023.
Sustainability 15 05132 g002
Table 1. Factors measurement and data sources.
Factors NamesAcronym Measurement Sources
Green Investment and Financial ProjectsGIAFPProportion of Green loans/GDPFRS, SBP, WBI, IFS
Green Economic and Trading ProjectsGEATPProportion of trade in green tools/GDPFRS, SBP, ADBI, WBI, IFS
Green Climatic and Environmental ActivitiesGCAEAProportion of funds for environment and climate projects/GDPFRS, SBP, WBI, IFS
Renewable Energy Green ProjectsREGPProportion of renewable energy investment/GDPFRS, SBP, ADBI, WBI
Public Policies and Social Green ProjectsPPSGPProportion of funds for social and Public projects/GDPFRS, SBP, ADBI, WBI
Foreign Exchange RateFXRRs. value/USD valueFRS, SBP, IFS, www.yahoo.fiance.com (accessed on 5 August 2022)
Index For Human DevelopmentIFHDTotal Labor/GDPFRS, SBP, Annual UNDP Reports
Financial Indictors Performance (PSX, NYSX)FIP (PSX, NYSX) FRS, PSX, Business Recorder, Financial Times
Note: variables with measurements and sources developed by the authors.
Table 2. Summary of descriptive statistics.
Descriptives For FIP of PSX and Green Finance ProjectsDescriptives For FIP of NYSX and Green Finance Projects
VariablesObs.S.D.M.V.Min.VMax.VVariablesObs.S.D.M.V.Min.VMax.V
GIAFP202.760.810.780.84GIAFP202.202.752.253.54
GEATP204.970.650.480.74GEATP203.853.122.763.40
GCAEA20−5.563.762.485.87GCAEA20−4.875.343.487.87
REGP200.7876.4640.25110.54REGP201.7887.2560.48120.94
PPSGP209.6428.9222.8731.96PPSGP207.59100.450.87150.46
FXR2010.5212.864.8722.67FXR204.4346.8624.8770.96
IFHD202.782.781.253.87IFHD201.2575.2745.90.100.87
FIP20112.9458.5298.87770.43FIP2045.983205.2548.83500.7
Source: Statistical analysis conducted by the authors.
Table 3. Pearson correlation matrix.
Pearson’s Correlations For FIP of PSX, Green Finance Projects and Controlling FactorsPearson’s Correlations For FIP of NYSX, Green Finance Projects and Controlling Factors
GIAFPGEATPGCAEAREGPPPSGPFXRIFHDFIPGIAFPGEATPGCAEAREGPPPSGPFXRIFHDFIP
GIAFP1 1
GEATP0.351 0.651
GCAEA0.420.761 0.570.871
REGP0.48−0.54−0.371 0.76−0.740.561
PPSGP0.280.430.29−0.481 0.560.490.45−0.721
FXR0.500.260.320.480.271 0.620.430.52−0.590.471
IFHD0.460.390.240.43−0.340.371 0.380.600.44−0.680.530.561
FIP0.58−0.470.260.510.530.280.2210.74−0.350.540.710.67−0.470.521
Source: Statistical analysis conducted by the authors.
Table 4. ADF unit root test.
ADF-Results For PSX, CFs, and Green ProjectsADF-Results For NYSX, CFs, and Green Projects
Target VariablesADF-Test (p-Value)Critical ValueDecision Order of Integration Target VariablesADF-Test (p-Value)Critical ValueDecision Order of Integration
GIAFP−3.274−3.457I(0)∆GIAFP−3.981−3.457I(1)
∆GEATP−4.573−3.457I(1)GEATP−2.654−3.457I(0)
∆GCAEA−7.542−3.457I(1)GCAEA−1.876−3.457I(0)
REGP1.847−3.457I(0)∆REGP4.653−3.457I(1)
PPSGP2.764−3.457I(0)PPSGP2.907−3.457I(0)
∆FXR−5.896−3.457I(1)∆FXR−6.785−3.457I(1)
∆IFHD−6.985−3.457I(1)∆IFHD−5.634−3.457I(1)
∆FIP−8.782−3.457I(1)FIP−3.112−3.457I(0)
The decision rule for order of integration: if the statistic value (p-stat) of ADF Test is greater than the critical value of ADF Test (−3.457), then first order of difference is taken.
Table 5. ARDL bound test results.
ModelsF-Value PSX.Lag Factors for PSXF-Value for NYSXLag Factors For NYSXSignificance LevelCritical Values of Bound Test For PSX-PerformanceCritical Values of Bound Test For NYSX
FIP/All Predictors I(0)I(1)I(0)I(1)
35.85576.2540.013.2974.3763.1844.750
0.052.5753.4572.7803.457
0.102.2013.0942.4383.347
Note: The cointegration exists among the non-stationary time series data as F-stat (35.85) > 10.
Table 6. ARDL long-term robust analysis (coefficients for all predictors).
Robust Analysis For PAK. FIP and All PredictorsRobust Analysis For USA. FIP and All Predictors
FactorsBetaS.E.t-Valuep-ValueHypothesesObjectivesBetaS.E.t-Valuep-ValueHypothesesObjectives
GIAFP−428.654254.9801.6810.197H1 is not metObj.1 is not met692.386244.6492.8530.028H1 is metObj.1 is met
∆GEATP2456.265965.5482.5440.032 *H2 is metObj.2 is also met−3578.2652293.4671.5620.112 *H2 is not metObj.2 is not met
∆GCAEA−875.487402.285−2.170.047 *H3 is metObj.3 is also met−2875.487891.754−3.2340.003 *H3 is metObj.3 is also met
REGP1265.547265.4.7660.002 *H4 is metObj.4 is also met2784.5732501.3471.1130.234 *H4 is not metObj.4 is not met
PPSGP457.448384.2291.1820.198H5 is not metObj.5 is not met1485.479415.1453.5780.002H5 is metObj.5 is met
∆FXR−715.45355.76−2.0110.046 *H6 is metObj.6 is met1876.952629.4532.9840.023 *H6 is metObj.6 is met
∆IFHD87.29325.4983.4230.004 *H6 is metObj.6 is also met486.908383.8521.2680.275 *H6 is not metObj.6 is not met
Predicted: FIP (PAK, USA); predictors: GIAFP, ∆GEATP, ∆GCAEA, REGP, PPSGP; controlling factors are ∆FXR and ∆IFHD and (*) determines the significance of factors at 5% significant level.
Table 7. Other coefficients of different test estimates.
FOR. PAKFOR. USA
TestsCoefficientsTestsCoefficientsTestsCoefficientsTestsCoefficients
R20.7854Adjusted R20.7465R20.83Adjusted R20.7930
S.D. of Predicted FIP1145.3487S.E. of ARDL Regression570.9854S.D. of Predicted FIP895.658S.E. of ARDL Regression485.2364
F (7, 20)14.48p-value (F)0.0008564F (7, 20)28.96p-value (F)0.000065
Mean Dependent Variance2450.8769Sum Squared Residual32,856,498Mean Dependent Variance1750.5692Sum Squared Residual5,489,4726
Log-Likelihood−195.8548Akaike Criterion428.593Log-Likelihood−148.8520Akaike Criterion648.728
Schwarz Criterion435.674Durbin-Watson value1.9468Schwarz Criterion572.740Durbin-Watson value2.3571
Note: All the estimates in this table are the results of robust analysis of the ARDL model.
Disclaimer/Publisher’s Note: The statements, opinions and data contained in all publications are solely those of the individual author(s) and contributor(s) and not of MDPI and/or the editor(s). MDPI and/or the editor(s) disclaim responsibility for any injury to people or property resulting from any ideas, methods, instructions or products referred to in the content.

