Abstract
In order to clarify the influence of fault dislocation on tunnel lining, the FEM and single factor variable methods were used to explore the influence of the degree of fault dislocation, dip angle, width, the intersection angle between the strike and the tunnel axis, and the fault dislocation form on the lining structure response, based on which length of the lining anti-dislocation set-up for engineering design was obtained. The research shows that the maximum displacement of the lining is basically consistent with the fault displacement; with the increase of the fault width, the overall fortification range of the tunnel increases. Among the three types of fault dislocation, the axial force of the lining caused by reverse fault dislocation is the largest, the level of normal fault is the moderate, and the strike-slip fault is the smallest. With the increase of the intersection angle between the fault strike and the tunnel axis, the lining gradually changes from tension-shear failure to shear failure. It is suggested that the tunnel should cross the fault at a large angle as far as possible. If it is unavoidable to cross the fault when selecting the tunnel route in the project, the tunnel axis should be selected to cross the fault vertically as far as possible.
1. Introduction
The possible dislocation of faults during earthquakes can have a huge impact on the tunnel lining structure, and fault dislocation will lead to large deformations in the longitudinal and transverse directions of the tunnel lining structure across the fault [1,2,3].
In order to clarify the effect of fault dislocation on the tunnel lining structure, many scholars have studied this problem by using model tests. Kontogianni et al. [4] studied the effect of the fault dip angle on the dynamic response characteristics of the tunnel lining structure. Lin et al. [5] analyzed the influence of the elastic modulus and expansion angle of the surrounding rock on the force and deformation characteristics of the tunnel lining under the effect of reverse fault dislocation. Fang et al. [6] compared the dynamic response characteristics of the lining structure under earthquake, with and without a fault fracture zone. Liu et al. [7] analyzed the effect of a 75° dip angle reverse fault dislocation on a highway tunnel. Liu et al. [8] studied the effect of the fault dip angle on the force characteristics of the tunnel lining. Geng [9] and Xu [10] studied the effect of the fault dislocation on tunnels under different surrounding rock conditions. Baziar et al. [11] studied the effect of the fault dislocation on the force characteristics of the lining. Liu et al. [12] studied the influence of the creeping fault on tunnels in deep faults by the indoor test method, and the research showed that the tunnel damage range is mostly distributed in the range of 3.5 to 4.0 times the tunnel diameter. Wang et al. [13] used large-scale model tests to study the influencing mechanism of the fault dislocation on the tunnel. The research shows that the tunnel failure mode can be divided into slight damage, moderate damage, and serious damage. Under the normal fault dislocation, the tunnel in the fault fracture zone bears the combined bending and shear failure, and the tunnel far away from the fault experiences compression failure. Wang et al. [14] used the scale model test to study the influence of the length of the lining section, the form of the lining joint, and the width of the deformation joint between the lining sections, on the mechanical properties of the tunnel crossing the fault. The research shows that a flexible connection of the length of the lining section, a shortening of the length of the lining section, and an appropriate increase of the width of the deformation joint are beneficial for the safety of the tunnel lining.
Considering that indoor model tests cannot effectively show the original ground stress field due to many limitations, such as model size and material properties, which make the test results differ significantly from the actual monitoring values, the use of numerical models to study the dynamic response characteristics of tunnels is gradually gaining attention. Ioannis et al. [15] established a numerical model, based on actual engineering, to analyze the response law of an immersed tube tunnel subjected to seismic loading when crossing a fault fracture zone. Yang et al. [16] used a three-dimensional discrete element model to study the dynamic response of a tunnel–fault system. Zhang [17] used a numerical model to compare the dynamic response characteristics of a cross-fault tunnel subjected to fault dislocation and seismic loading. Liu [18] established a numerical model based on the actual project, to analyze the influence of the fault dislocation, the surrounding rock conditions, and other factors on the force characteristics of the lining. Pellet et al. [19] used a finite difference model to study the width of the fault fragmentation zone, the initial geological conditions, and the excavation progress during construction, on the response of the tunnel lining and the surrounding rock stress field and displacement field during fault dislocation in a cross-fault tunnel. Anastasopoulos et al. [15] established a numerical model based on nonlinear theory, and used a quasi-static calculation method to obtain the nonlinear response characteristics of the tunnel lining stresses and deformations during the fault dislocation. Xiong et al. [20] established a numerical model based on the actual fault conditions in the Weihe basin, and investigated the effects of the fault dislocation, dip angle, depth of burial, and the intersection angle between the tunnel axis and the fault fragmentation zone on the force and deformation of the tunnel lining. Seokwon et al. [21] studied the response of the tunnel lining when the intersection angle between the fault fragmentation zone and the tunnel axis was different, using numerical analysis. Jiao et al. [22] investigated the damage mechanism of tunnel-crossing faults under the action of obliquely incident seismic p-waves using numerical analysis. Zhou et al. [23] established the Jiaozhou Bay Second Submarine Tunnel in Jiaozhou as a prototype with flexible joints, and used model tests and numerical simulation to study the deformation and failure mechanism of the submarine tunnel under the dislocation of the strike-slip fault. The results show that increasing the lining thickness, reducing the lining length, and reducing the tunnel diameter can effectively ensure tunnel safety. Chen et al. [24] regarded dislocation load as impact load, and used a finite fault model and the Okada dislocation theory model to analyze the deformation mechanism of a cross-fault tunnel, and used the finite element method to verify the results. Huang et al. [25] studied the mechanical response of a tunnel across a strike-slip fault under earthquake by using the finite element method. The influence of the angle between the tunnel axis and the fault strike, epicenter distance, and earthquake magnitude was studied. The results show that with the gradual decrease of the angle between the tunnel axis and the fault strike, the tensile deformation of the tunnel first increases and then decreases. The damage degree of the lining first increases and then decreases with the increase of the epicenter distance; the damage degree of the lining increases sharply with the increase of the earthquake magnitude. Wu et al. [26] used the finite element method to study the impact of a reverse fault on a tunnel. The research results show that the fault displacement has a large influence on the deformation of the lining joint. Additionally, the tensile deformation of the tunnel roof has a positive correlation with the buried depth. Yan et al. [27] proposed a calculation method to estimate the tunnel response caused by fault movement in regard to the lining connection nodes, by using the theoretical analysis method.
Studies have been conducted to better address the dynamic response characteristics of cross-fault tunnel lining structures under dynamic loads, such as fault dislocation and the corresponding fracture resistance measures, but they are mostly limited to qualitative analysis, without targeted quantitative analysis of the impact range of the fault, and without reasonable longitudinal fortification length.
However, due to the wide variety of fault properties and the uncertainty of the tunnel axis, the tunnel axis often crosses the fault fragmentation zone in an oblique manner, which causes the tunnel lining structure to be simultaneously subjected to compression shear, tension shear, and bending along the longitudinal direction. This mechanical behavior is very complex, and engineering designers are usually unable to fully consider the intertwined effects of various factors, thus making the design of cross-fault tunnel support structures difficult. In order to study the force and deformation characteristics of the tunnel lining structure under fault dislocation, and to provide support for the design of the support structure, a nonlinear finite element method is used to analyze the deformation and force characteristics of the tunnel under fault dislocation. This method is also used to analyze the influence law of the fault dislocation, fault dip angle, and other factors, on the force and deformation of the tunnel lining through various parameters, and to analyze the influence range of the fault fragmentation zone on the axial lining. Then, theoretical analysis is used to obtain the anti-staggered lining length for cross-fault tunnel lining.
2. Computational Model and Boundary Conditions
2.1. Simulation of Fault Dislocation and Interaction
The current simulation of the fault fracture zone primarily uses the weakened zone model, i.e., the rock parameters within the fracture zone are weakened. In order to describe the deformation and damage of the tunnel lining caused by fault dislocation, a nonlinear contact model is used between the fault fragmentation zone and the surrounding rocks of the upper and lower discs, and between the lining and the surrounding rocks. Specifically, the surface–surface nonlinear contact model is selected to simulate the interaction between the tunnel and the soil. The master–slave contact is selected. The tunnel surface with high rigidity is regarded as the main surface, and the soil surface is regarded as the slave surface. The master–slave surface forms the face–surface contact pair. Normal behavior adopts a “hard contact” simulation, allowing contact separation. Tangential behavior uses a penalty function to describe friction behavior. In this study, the friction coefficient between the tunnel and soil is taken as tan (2/3 φ), with φ representing the internal friction angle of the soil mass corresponding to the contact surface [22].
When the fault dislocation is simulated, the hanging wall surrounding rock is the active disk, and the forced displacement along the dislocation surface is applied at the bottom of the hanging wall to transfer the load to the lining through the contact. Then, the lining unit generates internal force and deformation, and the system regains equilibrium.
2.2. Computational Model and Boundary Conditions
The calculation prototype is selected from a cross-fault tunnel with a fault dip angle of 75° and a width of 30 m. The fault has a creep-slip dislocation of 20 cm over 100 years, and research shows that the model boundary has less influence on the calculation results when the calculation model is larger than 5–6 times the diameter of the hole [18]. The calculation range is taken as 300 m longitudinally, 30 m for the fault fragmentation zone, 130 m laterally, 110 m vertically, and 250 m for the tunnel depth. The composite lining consists of an initial support and secondary lining, and the internal diameter of the tunnel is 10 m. Considering the contact relationship between the initial support and secondary lining, the ideal stratigraphic-structural model of initial support and surrounding rock deformation is adopted in a safe way. The initial support consists of C20 shotcrete with a thickness of 20 cm, and the secondary lining consists of concrete with a thickness of 50 cm and a strength grade of C30. The calculation model is shown in Figure 1.
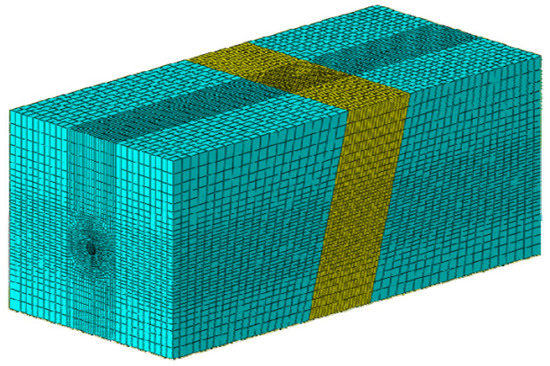
Figure 1.
Finite element calculation model.
In order to accurately simulate the actual situation, the following surrounding rock material properties are used: the geotechnical elastic-ideal plastic Drucker–Prager constitutive law; the surrounding rock, fault fracture zone, and primary lining use the three-dimensional solid unit (C3D8R); and the secondary lining uses the shell unit (S4R). The calculation parameters of the surrounding rock and lining are taken as shown in Table 1. When simulating the normal fault dislocation, we fix the outer boundary of the hanging wall, constrain the normal displacement on the left and right sides of the hanging wall, and apply the displacement along the dislocation face at the bottom boundary of the hanging wall to simulate the relative dislocation process of the hanging wall and the footwall. When simulating reverse fault dislocation, the direction of the displacement constraint imposed on the bottom of the hanging wall is opposite to that of the normal fault. When simulating strike-slip fault dislocation, we fix the outer boundary of the footwall and apply horizontal displacement constraints on the left and bottom boundary of the hanging wall, while the right side only constrains the axial and vertical displacement. When displacement constraints are imposed by different dislocation modes, the displacement along the direction of the dislocation plane is not constrained on the left and right sides of the fault fracture zone, so as to ensure that the part of the fault fracture zone can produce coordinated displacement with the hanging wall dislocation under the action of dislocation.

Table 1.
Indicators of physical and mechanical parameters of the surrounding rock.
2.3. Calculation Scheme
In order to study the influence of the fault factors on the tunnel, the overall calculation scheme is shown in Table 2.
Table 2.
Calculation scheme.
The initial calculation conditions are as follows: positive fault dislocation, a fault dip angle of 75°, a fault fragmentation width of 30 m, fault alignment and tunnel axis orthogonal, the amount of dislocation is 0.2 m. The calculation model is shown in Figure 2.
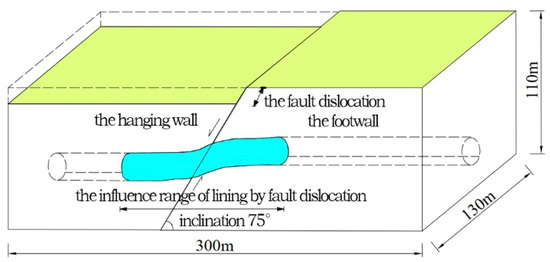
Figure 2.
Schematic diagram of normal fault dislocation.
The basic flow of simulation calculation in each case is shown in Figure 3. Initially, the ODB file corresponding to the stress result under the dead load is calculated, without considering the fault dislocation as the initial stress file. Then, the numerical simulation calculation under the action of fault dislocation is carried out. The numerical simulation calculation under fault dislocation is divided into two steps. The first step is to balance the geostress, which is achieved by importing the ODB file corresponding to the initial stress result. The second step is to simulate the fault dislocation, and apply the corresponding displacement by displacement loading simulation.
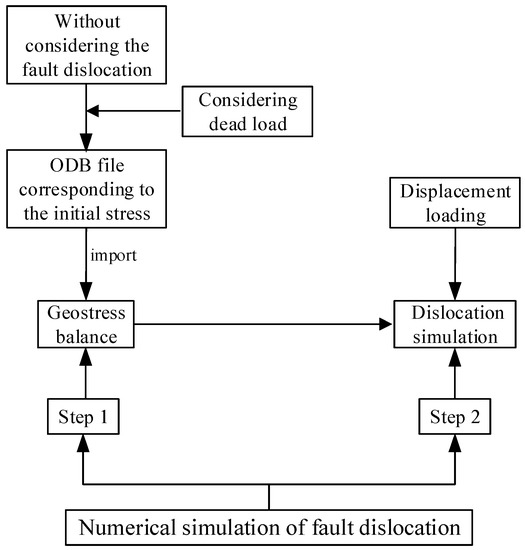
Figure 3.
Simulation calculation process.
3. Calculation Results Analysis
The deformation and stress analysis of the tunnel lining is divided into maximum value analysis and maximum absolute value analysis. The mass point on the lining is constrained by the surrounding rock, and moves with the surrounding rock under the action of fault dislocation; the mass point is damaged and destroyed in the movement, which leads to the destruction of the lining structure when it reaches a certain value. Therefore, the maximum value analysis can truly reflect the dislocation response law of the lining structure. Taking the initial calculation condition as an example, we discuss the deformation and stress maxima of the lining under the action of fault dislocation, so as to judge the stress state of the lining.
3.1. Analysis of Lining Deformation
When the fault is dislocated, the hanging wall slides downward along the dislocated side, which affects the fault fragmentation zone and the surrounding rock of the footwall. The top of the footwall near the fragmentation zone also produces a small amount of settlement, and the lining structure is affected by the surrounding rock constraint, resulting in “S” shaped bending occurring along the longitudinal direction. The lining deformation cloud diagram is shown in Figure 4. In the process of fault dislocation, the surrounding rock transmits a load to the lining through circumferential contact pressure and longitudinal frictional resistance, resulting in simultaneous vertical bending deformation of the tunnel lining and axial stretching.

Figure 4.
Cloud map of lining deformation (m).
The distribution curves of lining vault displacement (the direction consistent with fault dislocation is taken as positive) and maximum principal strain along the axial direction of the tunnel are plotted as shown in Figure 5a and Figure 5b, respectively. Combined with Figure 5a,b, it can be seen that the lining vault displacement in the hanging wall is basically equal to 0.2 m of dislocation. The lining vault displacement in the footwall is very small, and the maximum main strain of the lining in this range is very small; the lining in the hanging wall in this range only makes a top-to-bottom translation movement with the hanging wall, while the lining in the footwall remains fixed. The place where the lining is subject to severe deformation is the fault fracture zone and its two sides, which indicates that when the normal fault is dislocated, the affected range of the lining is primarily concentrated near the fault fracture zone, about 20–30 m on both sides of the fault fracture zone. At the same time, it can be seen that the extreme value of the maximum principal strain curve is about at the junction of the fault fracture zone and the surrounding rock of the upper and lower wall, with the extreme values of −2.37 × 10⁻⁴ and 1.29 × 10⁻³, respectively. When the normal fault is dislocated, the deformation of the lining vault at the junction of the fault fracture zone and the surrounding rock of the upper and lower wall is opposite, and the tensile stress of the lining vault at the junction of the fault fracture zone and the surrounding rock of the footwall changes greatly, which can lead to tensile failure.
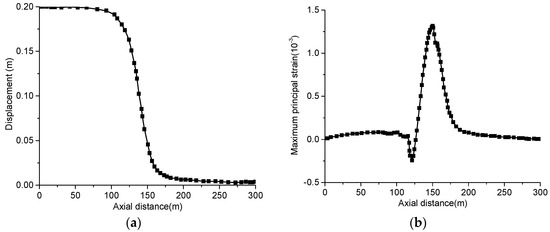
Figure 5.
Lining displacement and maximum principal strain. (a) Distribution of the tunnel arch vault displacement along the axial direction. (b) Distribution of maximum principal strain along the axial direction.
3.2. Analysis of Lining Stresses
The maximum and minimum principal stress clouds of the tunnel lining structure under the effect of positive fault dislocation are shown in Figure 6a and Figure 6b, respectively. For the purpose of observation, the deformation of the tunnel lining structure is enlarged 20 times. From Figure 6a, it can be seen that the maximum and minimum principal stresses in the lining structure are primarily distributed in the fault fracture zone and within a certain range on both sides, and there are obvious stress concentrations at the junction of the fault fracture zone and the upper and footwall surrounding rocks. The stress concentration phenomenon is especially obvious at the top of the lining arch, the arch waist, and the arch foot. Therefore, under the effect of positive fault dislocation, the tunnel lining arch vault, arch waist, and arch foot are the key parts of the anti-fracture protection. The protection length can be based on the lining displacement and the maximum main strain along the axial distribution law, which were determined initially.
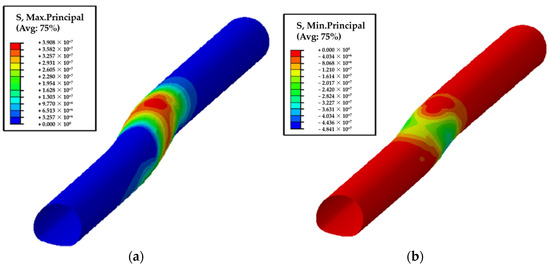
Figure 6.
Cloud map of lining principal stress (Pa). (a) Maximum principal stress. (b) Minimum principal stress.
3.3. Analysis of the Internal Forces of Lining Axial Section
Figure 7a shows the distribution curve of the bending moment along the axial direction in each section, with the lining arch bottom under tension and arch top under positive pressure. It can be seen from the figure that the bending moment distribution is localized near the fault dislocation surface due to the fault dislocation. The bending moment value of the liner within a certain range of the fault fragmentation zone and both sides changes more drastically; with the increase of the distance from the fault fragmentation zone, the bending moment value gradually converges to a stable smaller value. The bending moment of the section in the fault zone decreases linearly with the increase of the axial distance; the rate of change of the bending moment is equal, which indicates that the bending deformation of each section in the fault zone is basically the same when the positive fault is dislocated. The difference between the fault zone and the upper and footwall surrounding rock interface on both sides of the surrounding rock conditions results in extreme values of the lining bending moment, so the tunnel through the fault zone should receive extra attention when setting up this part of the prevention.
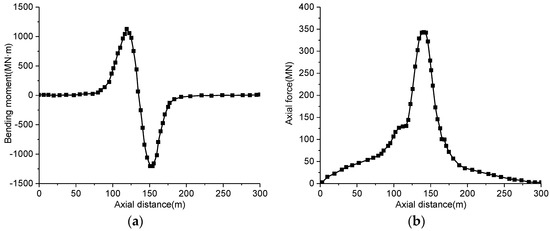
Figure 7.
Internal forces of the lining. (a) Distribution of the bending moment along the axial direction in each section of lining. (b) Distribution of the axial force along the axial direction in each section of lining.
Figure 7b shows the distribution curve of the axial force along the axial direction for each tunnel lining section, with positive axial tension on the lining. As can be seen from the figure, the axial force in each section is positive; the tunnel lining as a whole is subjected to tensile force when the positive fault is dislocated. The axial force increases with the increase of the longitudinal distance, and reaches the extreme value at the junction between the fault fragmentation zone and the surrounding rock of the footwall, and then decreases with the increase of the axial distance. This is because the frictional force on the tunnel lining in the upper and footwalls is opposite to the lining deformation direction; the deformation of the surrounding rock in the fault fragmentation zone under the dragging of the hanging wall is larger than the deformation of the lining in the fragmentation zone, which creates the direction of the frictional force and lining deformation. The direction of friction is consistent with the direction of lining deformation. At the same time, it can be seen that the axial force and the rate of change of axial force are larger at the junction of the fault fragmentation zone and the surrounding rock of the footwall, so preventing tensile damage in this part, when the positive fault is dislocated, should be focused on.
3.4. Internal Force Analysis of a Typical Section
In order to further study the stress and deformation of each key point of the typical section of the tunnel lining, the typical sections along the axial direction of the lining were selected to study the stress of each key point of the section. From the aforementioned stress distribution, it can be seen that the stress concentration primarily occurs in and near the fault fracture zone, so the five typical section locations are: 20 m from the dislocation surface in the hanging wall, the junction between the fracture zone and the hanging wall, the middle of the fracture zone, the junction between the fracture zone and the footwall, and 20 m from the fracture zone in the footwall, as shown in Figure 8a; the key points in the section are arranged as shown in Figure 8b.

Figure 8.
Section position and key points. (a) Typical cross-section location. (b) Cross-section key point arrangement.
We extract the bending moment and axial force at each key point of the five typical sections, where the axial force is positive in circular tension, and the bending moment is positive in tension on the inner side of the lining. Since the lining is symmetrical to the left and right, only the left key point is taken for analysis.
The bending moment distribution of key points in each section is shown in Figure 9a. It can be seen from the figure that the bending moment gradually changes from negative to positive during the change from the top to the bottom of the arch in the section ①-①, while the bending moment gradually changes from positive to negative in the section ⑤-⑤. This means that the upper and footwall lining is subject to the opposite bending moment, that is, there is a counter-bending point between the two sections, which is consistent with the bending moment distribution curve shown in Figure 7a. The bending moment gradually decreases in the process of changing from the top to the bottom of the arch in the section ②-②, while the bending moment gradually increases in the section ③-③ and the section ④-④, except for the bottom of the arch. This indicates that the top of the arch at the junction of the fault-breakage zone and the hanging wall is easily damaged by bending, while the foot of the arch at the junction of the fault-breakage zone and the footwall is easily damaged. At the same time, it can be seen that the arch bottom of the section ②-② and the section ③-③, and the arch top bending moment of the section ④-④ are obviously smaller than other key points, which is because this part has the tendency to detach from the surrounding rocks when the positive fault is dislocated, thus leading to the smaller force and the easily damaged footwall.
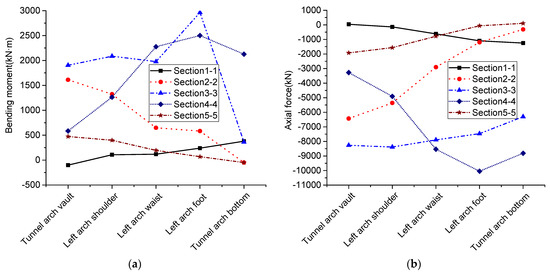
Figure 9.
Force at key points. (a) Bending moment at key points. (b) Axial force at key points.
Figure 9b shows the distribution of axial force at each key point of the different sections. It can be seen that the axial force at each key point of the different sections is almost all negative, which indicates the overall reduction of the lining cross-section when the positive fault is dislocated. The axial force from the top to the bottom of the arch in the section ②-②gradually decreases, while the axial force in the section ④-④ gradually increases, which indicates that the top of the arch of the section at the junction of the fault fragmentation zone and the hanging wall is easily damaged by compression. The foot and bottom of the arch of the section at the junction of the fault fragmentation zone and the footwall are easily damaged by compression. The differences in axial force at each key point of the section ③-③ are small, which is due to the fact that the section ③-③ is located in the fault fracture zone; the difference in the surrounding rock conditions is small, and the overall force of the lining is more uniform. The axial force at each key point of the section ①-① and the section ⑤-⑤ is significantly smaller than that of other sections, which indicates that the axial force at each key point of the section decreases significantly with the increase of distance from the fault fragmentation zone when the positive fault is dislocated.
4. Parameter Analysis
4.1. Analysis of the Effect of Fault Dislocation on Tunnel Lining Response
Whether it is stick-slip stagger or creep-slip stagger, the amount of fault stagger represents the magnitude of energy release. With the increase of fault stagger, the upper and lower extended fractures continue to penetrate, and then trigger the permanent deformation of the engineering site, resulting in passive damage to the engineering structure. The larger the amount of dislocation, the more strain energy is released from the fault dislocation, and thus more deformation energy is transferred to the tunnel lining. Therefore, the deformation and mechanical response characteristics of the tunnel are studied by setting different dislocations, which are shown in Table 2. The calculation model and the arrangement of the key points of the section are as described previously.
4.1.1. Analysis of Lining Deformation
The distribution curves of vault displacement and maximum principal strain along the axial direction at different fault dislocations are shown in Figure 10a,b. It can be seen from the curves that the deformation of the tunnel lining structure near the fault fragmentation zone is more intense. With the increase of dislocation, the lining displacement increases accordingly, and the maximum displacement is basically equal to the dislocation, showing a linear correlation, indicating that the lining movement is completely restrained by the surrounding rock when the lining deformation is simulated by the stratigraphic-structural method. The strongly deformed lining area is within a certain range in the fault and both sides, which may be the first area to experience shear or tensile damage; with the increase of dislocation amount, the potential surface shear damage gradually spreads to both sides of the fault. The hanging wall dislocation involves the fault as well as the footwall surrounding rock, so strain is generated in the fault fragmentation zone and the lining in the footwall. The distribution law of the maximum principal strain along the axial direction is essentially the same when the dislocation is different, and the peak of the maximum principal strain increases approximately linearly with the increase of the fault dislocation, so the larger the fault dislocation, the greater the chance of tensile damage to the lining.
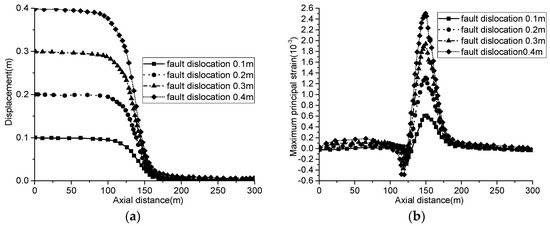
Figure 10.
Dislocation affects lining deformation. (a) Distribution of displacement along the axial direction in the arch vault. (b) Distribution of maximum principal strain along the axial direction in the arch vault.
4.1.2. Analysis of Internal Force of Lining along Axial Section
Figure 11a is the distribution curve of the bending moment along the axial direction of each section at different fault dislocations. It can be seen from the curve that the fault dislocation primarily affects the fault fragmentation zone and the lining within a certain range on both sides. The distribution range of the bending moment is essentially the same for different fault dislocations, but the peak bending moment varies greatly: when the dislocation increases from 0.1 m to 0.4 m in 0.1 m increments, the peak bending moments are 5.10 × 10⁵ kN·m, 1.04 × 10⁶ kN·m, 1.65 × 10⁶ kN·m, and 1.97 × 10⁶ kN·m, respectively. The peak bending moment appears near the junction of the fault fragmentation zone and the upper and footwall. Due to the restraining effect of the surrounding rock, the value of the lining moment in the surrounding rock on both sides of the fracture zone gradually decreases until it tends to a stable smaller value, indicating that the tunnel bending deformation gradually decreases in this section.

Figure 11.
Dislocation momentum affects the internal force of the lining. (a) Distribution of the bending moment of each section of lining along the axial direction. (b) Distribution of the axial force of each section of lining along the axial direction.
Figure 11b shows the distribution curves of the axial force along the axial direction for each section with different fault dislocations. As can be seen from the figure, the distribution pattern of the axial force along the axial direction is essentially the same, with the maximum value appearing near the fault dislocation surface, and gradually decreasing on both sides. The axial force is positive when the fault is dislocated, which means that the lining as a whole is subject to tensile action. When the dislocation amount increases from 0.1 m to 0.4 m, the peak axial force is 1.57 × 10⁵ kN, 3.43 × 10⁵ kN, 5.12 × 10⁵ kN, 6.54 × 10⁵ kN, which increases gradually with the increase of the fault dislocation amount. In the range of axial y = 0–100 m, the tunnel axial force gradually increases along the longitudinal direction, but the increase is smaller, which means that the tunnel located in the hanging wall is less affected by the dislocation because it is farther away from the dislocation surface. In the axial direction y = 100–120 m, the axial force increases rapidly, indicating that this section of the tunnel generates a larger axial force as the distance from the dislocation decreases. At axial y = 120–150 m, the tunnel is subjected to larger axial forces and is most susceptible to tensile damage. After the axial y = 150 m, the axial force gradually decreases due to the constraint effect of the lower rock boundary.
4.1.3. Internal Force Analysis of the Typical Section
In order to further study the force situation of each key point of the typical lining section, the bending moment and axial force of each key point of the five typical sections were analyzed. The distribution of the bending moment at key points of each typical section with different fault dislocations is shown in Figure 12a–e. As can be seen from the figures, the bending moment distribution of each section is similar for different dislocations. The bending moment values at the key points of the section ①-① and the section ⑤-⑤ are significantly smaller than those of other sections at different dislocations, indicating that these two sections are less affected by dislocations because they are farther away from the fault fragmentation zone. The section ②-②, section ③-③, and section ④-④ are closer to the dislocation surface, and the bending moment values at each key point are more influenced by the fault dislocation. The bending moment value of each key point in different sections increases with the increase of fault movement, but the increase gradually decreases, which is primarily because the plastic deformation range of the surrounding rock gradually expands with the increase of fault movement, and cannot provide greater resistance. At the same time, it can be seen that the section ②-② arch top and the section ③-③ and the section ④-④ arch foot bending moment value increased significantly larger than other key points with the increase of fault dislocation, so we can determine the key location of each section fortification. In addition, because the section ②-② and the section ③-③ arch bottom and the section ④-④ arch top have a tendency to detach from the surrounding rock when the fault is dislocated, they are almost not affected by the fault dislocation.
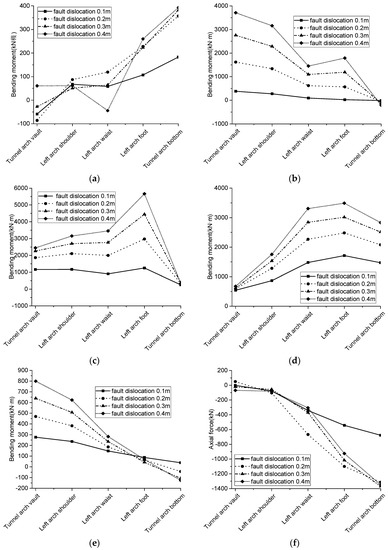
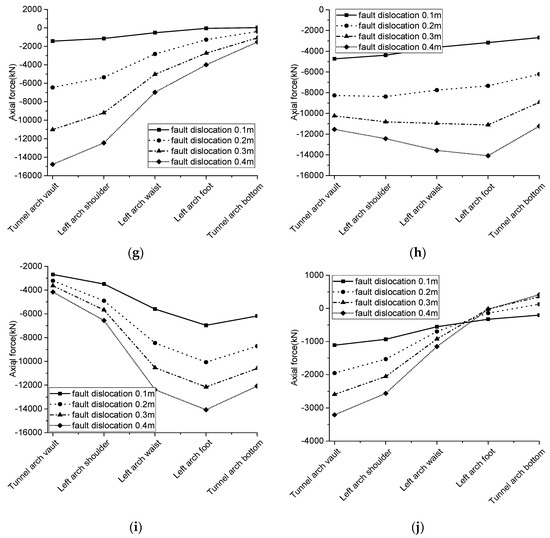
Figure 12.
Dislocation affects the bending moment and axial force at key points of the lining section. (a) The section ①-① bending moment. (b) The section ②-② bending moment. (c) The section ③-③ bending moment. (d) The section ④-④ bending moment. (e) The section ⑤-⑤ bending moment. (f) The section ①-① axial force. (g) The ②-② cross-sectional axial force. (h) The ③-③ cross-sectional axial force. (i) The section ④-④ axial force. (j) The section ⑤-⑤ axial force.
Figure 12f–j show the axial forces at the key points of each section for different fault dislocations. As can be seen from the figures, the distribution of axial force at the key points of each section with different fault dislocation is essentially similar. The axial force at each key point of the section ①-① and the section ⑤-⑤ varies less with the fault dislocation, that is, these two sections are less affected because they are far away from the fault dislocation. The axial force at each key point of the section ②-② and the section ④-④ gradually increases with the increase of fault dislocation, but the scope of increase gradually decreases. The section ②-② arch top and the section ④-④ arch bottom part increase is significantly greater than other key points, that is, the part easily experiences extrusion damage. The axial force of the part is significantly greater than other key points, so that the circumferential compression deformation of the part and the adjacent parts is not coordinated, making the junction susceptible to tensile damage. The difference between the axial force of each key point in the section ③-③ is small and basically consistent with the increase of fault dislocation. The section ③-③ is located in the middle of the fault fragmentation zone, with small differences in the surrounding rock properties, and the lining section as a whole is more uniformly compressed in the circumferential direction.
4.2. Analysis of the Effect of Fault Dip Angle on Tunnel Lining Response
The fault dip angle has a great impact on the tunnel when the fault is dislocated. In actual construction, if it is unavoidable to cross the fault, the shortest route will be selected to cross the fault fracture zone. Therefore, the fault dip angle when the tunnel crosses the fault fracture zone is often large, generally greater than 45°. The calculation conditions for the influence of the fault dip angle on the response of the lining are shown in Table 2. The response law of the tunnel at different fault dip angles is analyzed through the deformation and stress characteristics of the lining.
4.2.1. Analysis of Lining Deformation
The distribution curves of the lining arch top displacement and maximum principal strain along the axial direction when the fault dip angle is different are shown in Figure 13a and Figure 13b, respectively. It can be seen from the figures that the distribution pattern of the arch top displacement along the axial direction is essentially the same when the fault dip angle is different. There is only a slight difference at the junction of the fault and the upper and footwalls, and the larger the fault dip angle, the more drastic the displacement curve changes. The maximum principal strain is primarily concentrated in the fault zone and its two sides. The smaller the fault dip angle, the larger the strain value, which means that smaller fault dip angles decrease the safety of the tunnel, so a larger dip angle should be chosen when the tunnel crosses a fault. With the increasing inclination of the fault, the location of the peak maximum principal strain at the top of the arch gradually shifts towards the footwall, which is primarily due to the change in the lining from tensile to shear deformation. Meanwhile, the maximum principal strain curve shows that the smaller the dip angle of the fault, the larger the affected area of the tunnel crossing, so when crossing a smaller dip angle fault, effective measures must be taken to ensure safety, and the length of protection should be increased appropriately.
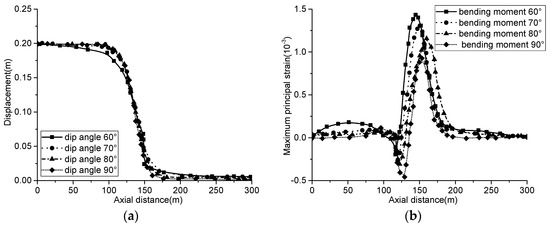
Figure 13.
The influence of the fault dip angle on lining deformation. (a) The distribution of vault displacement along the axial direction. (b) The distribution of maximum principal strain in the vault along the axial direction.
4.2.2. Analysis of Internal Force of the Lining along Axial Section
The distribution curves of the lining section bending moment along the axial direction with different fault dip angles are shown in Figure 14a. From the figure, it can be seen that the distribution curves of the tunnel bending moment along the axial direction under the effect of different fault dip dislocations are not very different, which means that the influence of the fault dip angle on the tunnel lining bending moment is relatively small. In general, the change in the dip angle only has a certain effect on the peak bending moment. The larger the dip angle, the higher the peak bending moment, but when the dip angle of the fault increases to 70°, the peak bending moment changes very little.
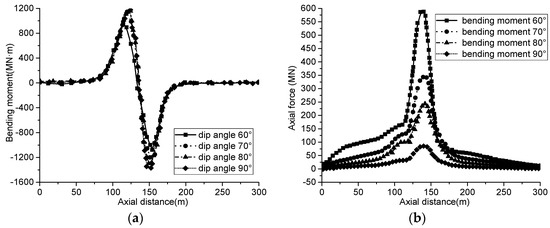
Figure 14.
The influence of the fault dip angle on the lining internal force. (a) The distribution of the bending moment of each section of lining along the axial direction. (b) The distribution of the axial force of each section of lining along the axial direction.
Figure 14b shows the distribution curves of the axial force along the axial direction of each section when the fault dip angle is different. From the figure, it can be seen that the distribution law of the axial force of each section along the axial direction is basically the same at different fault dip angles, which increases and then decreases with the increase of axial distance. The axial force at different fault dip angles is positive, indicating that the liner is subjected to tensile force as a whole. However, with the increase of fault dip angles, the axial force gradually decreases; the peak value of the axial force decreases significantly, which is primarily due to the change of the tunnel liner from tensile shear deformation to shear deformation. At the same time, it can be seen that when the fault inclination increases, the rate of change of the axial force near the dislocation surface is significantly reduced. The incoordination of tensile deformation between adjacent parts of the lining is significantly reduced, thus reducing the tensile damage of the lining along the axial direction. Therefore, the tensile damage of the lining can be effectively reduced when the tunnel crosses a fault fragmentation zone with a larger dip angle.
4.2.3. Internal Force Analysis of Typical Section
The distribution of the bending moment at key points of each section at different fault dip angles is shown in Figure 15a–e. It can be seen from the figure that the bending moment value at each key point of different sections is essentially consistent with the change rule of fault dip angle. The section ①-① and the section ⑤-⑤ are far away from the fault dislocation surface, so the bending moment distribution curve of each key point is not much different, that is, they are only slightly affected by the fault dip angle. The bending moment values at each key point of the section ②-②, section ③-③, and section ④-④ decrease with the increase of fault dip angle, which is mainly because the tunnel lining cross-section bears tensile and shear deformation when the fault dip angle is small, and the tunnel lining mainly bears shear deformation. When the fault dip angle is 90°, the section ②-②arch bottom, the section ③-③ arch bottom, and the section ④-④ arch top have a tendency to separate from the surrounding rock, so they are almost not affected by the change of the fault dip angle.
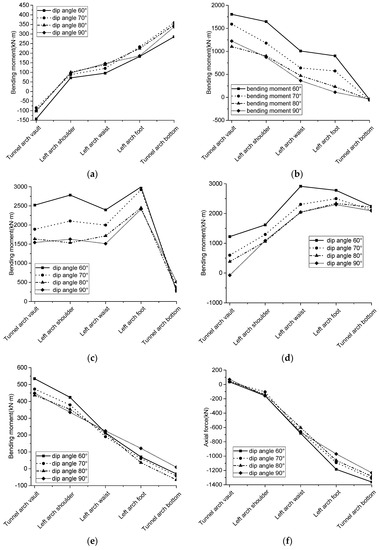
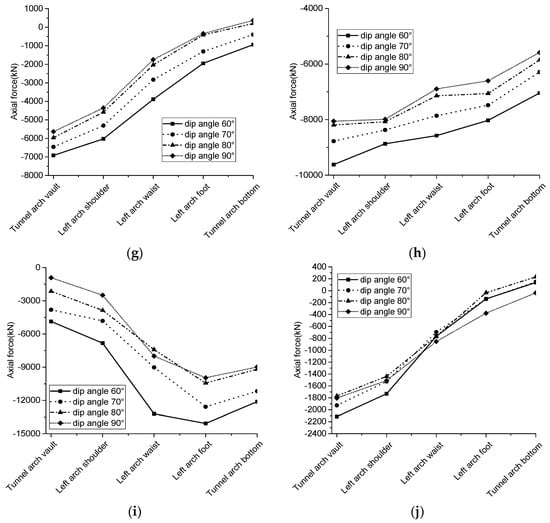
Figure 15.
The influence of the fault dip angle on the bending moment and axial force at key points of the lining section. (a) The bending moment of the section ①-①. (b) The bending moment of the section ②-②. (c) The bending moment of the section ③-③. (d) The bending moment of the section ④-④. (e) The bending moment of the section ⑤-⑤. (f) The axial force of the section ①-①. (g) The axial force of the section ②-②. (h) The axial force of the section ③-③. (i) The axial force of the section ④-④. (j) The axial force of the section ⑤-⑤.
Figure 15f–j shows the distribution curves of the axial force at the key points of each section at different fault dip angles. As can be seen from the figures, the distribution pattern of the axial force at key points of each section at different fault dip angles is essentially the same. The axial force distribution curves of the key points of the section ①-① and section ⑤-⑤ vary very little with the fault dip and almost coincide, that is, these two sections are less influenced by the fault dip because they are far from the fault dislocation surface. The axial force at each key point of the section ②-②, section ③-③, and section ④-④ gradually decreases with the increase of the fault dip angle, which is primarily due to the tunnel lining changing from tensile shear deformation to shear deformation, caused by the increase of the fault dip angle. Therefore, when the tunnel passes through a fault with a large dip angle, it can effectively avoid local damage because the circumferential pressure reaches the compressive strength of the concrete first; the greater the dip angle of the fault, the greater the safety of the tunnel lining.
4.3. Analysis of the Effect of Fault Width on Tunnel Lining Response
To better compare and analyze the effect of fault width on the lining response, the total length of the model and the length of the hanging wall were kept constant during the calculation process, and the fault width was continuously increased while the length of the lower tray was gradually reduced by equal length. The leftmost part of the hanging wall of the tunnel is used as the starting point of the horizontal coordinate, and each point up the tunnel axis is the horizontal coordinate in m. Then, the position of each part of the tunnel in the surrounding rock can be determined according to the y-coordinate. The y-coordinate values for the hanging wall, fault zone, and footwall for different fault widths are shown in Table 3.
Table 3.
Correspondence of coordinates for different fault widths.
4.3.1. Analysis of Lining Deformation
The distribution curves of the displacement and maximum principal strain along the axial direction of the tunnel lining vault are plotted, as shown in Figure 16a and Figure 16b, respectively. From Figure 16a, it can be seen that the range of severe lining deformation is influenced by the fault width. When the fault width increases from 10 m to 50 m, the scope of severe deformation of the lining continuously moves towards the footwall. With the increase of the fault width, the dislocation of the hanging wall of the fault involves the fracture zone and the limited area of the footwall, resulting in the deformation of the fracture zone and the footwall. At the same time, it can be seen that the change of the maximum principal strain curve of the vault with the fault width is similar to the displacement curve. The peak principal strain constantly moves towards the footwall, and the peak position appears at the junction of the fault fragmentation zone and the surrounding rock of the footwall; the peak maximum principal strain slightly decreases.

Figure 16.
The influence of fault width on lining deformation. (a) The distribution of the arch vault displacement along the axial direction. (b) The distribution of the the arch vault maximum principal strain along the axial direction.
4.3.2. Analysis of Internal Force of Lining along Axial Section
Figure 17a shows the distribution curve of the section bending moment along the axial direction at different fault widths. As can be seen from the figure, the distribution pattern of the section bending moment along the axial direction is essentially the same at different fault widths, but the main affected range of the lining increases with the increase of the fault width. The peak value of the section bending moment decreases with the increase of the fault width, which is primarily due to the increase of the fault width and the increase of the lining bending deformation range, weakening the stress concentration. The peak position of the section bending moment gradually shifts in the direction of the footwall with the increase of the fault width, indicating that the dislocation surface is shifted to a certain extent during the fault dislocation. It should be noted that when the fault width is small, the peak position of the positive bending moment is in the hanging wall, and gradually shifts to the junction between the fault fragmentation zone and the hanging wall as the fault width increases; it shifts to the fault fragmentation zone when the fault width continues to increase. The peak position of the negative bending moment is located at the junction between the fault fragmentation zone and the footwall.
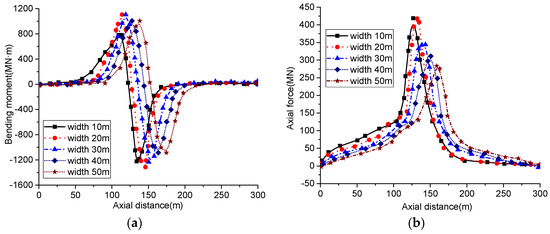
Figure 17.
The influence of the fault width on the lining internal force. (a) The distribution of the bending moment of each section of lining along the axial direction. (b) The distribution of the axial force of each section of lining along the axial direction.
Figure 17b shows the distribution curve of the axial force along the axial direction for different fault widths, which shows that the axial force values are positive, indicating that the lining is mainly stretched along the axial direction. When the hanging wall is dislocated, the fracture zone and the footwall area are involved, so that the fault dislocation is not only confined to the dislocation surface, but also expands along the footwall direction to the rock body in the fracture zone. Therefore, the larger the fault width is, the more the dislocation surface moves into the fault fragmentation zone, so the location of the peak axial force is also shifted. At the same time, with the increase of the fault width, the peak axial force gradually decreases. This indicates that a larger fault width results in a smaller incongruous tensile deformation between the fault fracture zone and the lining in the fault fracture zone caused by the hanging wall dislocation; a smaller positive friction force results in a reduction of the peak axial force.
4.3.3. Internal Force Analysis of Typical Section
The distribution of the bending moment at key points of each section at different fault widths is shown in Figure 18a–e. As can be seen from the figure, the bending moment values at the key points of the section ①-① and section ⑤-⑤ are significantly smaller than those of other sections. The variation is smaller at different fault widths, which is primarily due to the fact that these two sections are farther away from the fault dislocation surface, and are therefore less influenced by the fault dislocation. The bending moment value of each key point of the section ②-② gradually decreases with the increase of the fault width. When the fault width increases to 40 m, the bending moment value of each key point is almost unchanged, which means that with the increase of the fault width, the fault dislocation surface gradually shifts to the inside of the fault fragmentation zone along the footwall direction. This results in the bending moment value of each key point of the section ②-② decreasing significantly with the increase of the distance from the fault dislocation surface. The bending moment value of each key point in the section ③-③ and section ④-④gradually decreases with the increase of the fault width. At the same dislocation, the larger the fault width is, the larger the range of plastic deformation in the fault zone, and thus the smaller the resistance force generated.
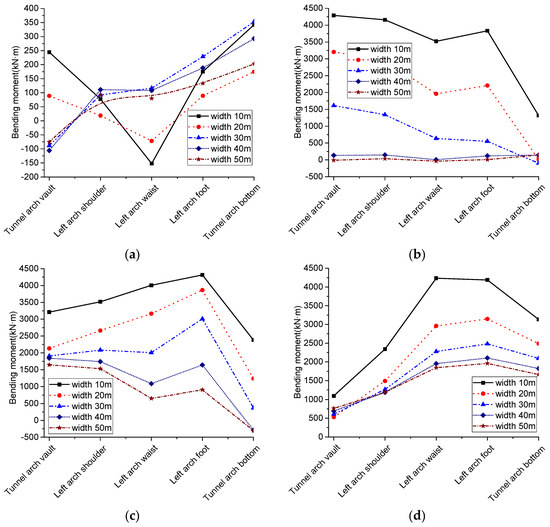
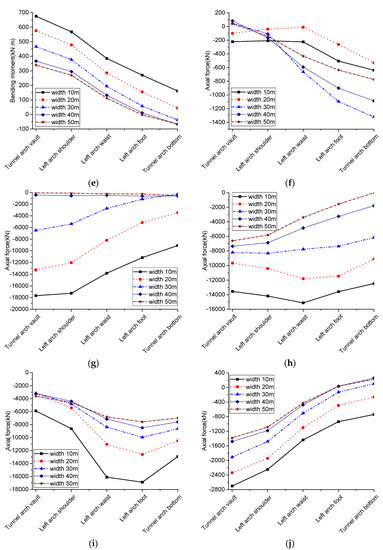
Figure 18.
The influence of the fault width on the bending moment and axial force at key points of the lining section. (a) The bending moment of the section ①-①. (b) The bending moment of the section ②-②. (c) The bending moment of the section ③-③. (d) The bending moment of the section ④-④. (e) The bending moment of the section ⑤-⑤. (f) The axial force of the section ①-①. (g) The axial force of the section ②-②. (h) The axial force of the section ③-③. (i) The axial force of the section④-④. (j) The axial force of the section ⑤-⑤.
The axial forces at the key points of each section at different fault widths are shown in Figure 18f–j. From the figure, it can be seen that the axial force at each key point of the different sections varies with the fault width in a similar way to the bending moment. The axial force at each key point of the section is smaller, and the variation with the fault width is smaller, because the section ①-① and section ⑤-⑤ are farther from the fault dislocation surface. The value of the axial force at each key point of the section ②-②, section ③-③, and section ④-④ decreases gradually with the increase of the fault width, and when the fault width increases to 40 m, the axial force at each key point is less affected by the fault width. Meanwhile, it should be noted that the maximum difference of the axial force between the key points in the section ②-② and section ④-④ gradually decreases with the increase of the fault width. The incompatibility of the compressional deformation between the key points decreases, which indicates that with the increase of the fault width, the section at the junction of the fault fragmentation zone and upper and footwall changes from combined tensile and compressional deformation to mainly extrusion deformation.
4.4. Analysis of the Effect of Fault Dislocation Form on Tunnel Lining Response
The form of the fault dislocation directly determines the stress state of the tunnel. The influence of the dislocation of a normal fault, a reverse fault, and a strike-slip fault on the internal force and deformation of the tunnel lining is studied. The calculation conditions are shown in Table 2.
4.4.1. Analysis of Lining Deformation
The distribution curves of the displacement and maximum principal strain along the axial direction are plotted as shown in Figure 19a and Figure 19b, respectively, from which it can be seen that the maximum displacement is equal to the fault dislocation. Under different fault dislocation forms, the distribution curve of the maximum principal strain of the lining along the axial direction varies greatly, but the parts with large strain are concentrated in the fault fracture zone and within a certain range on both sides. At the same time, it can be seen that the maximum principal strain of the lining is located near the junction of the fault fracture zone and the upper and lower walls. The deformation of the lining is primarily concentrated in the fault fracture zone and within a certain range on both sides.
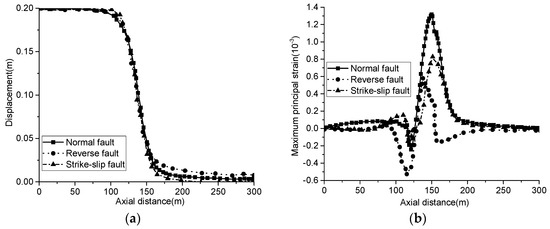
Figure 19.
The fault dislocation form affects the lining deformation. (a) The distribution of the arch vault displacement along the axial direction. (b) The distribution of the arch vault maximum principal strain along the axial direction.
4.4.2. Analysis of Internal Force of Lining along Axial Section
Figure 20a shows the distribution of the bending moment of the lining along the axial direction under the effect of different fault dislocation forms. The peak position of the positive and negative bending moment is essentially the same under the effect of three types of dislocation, while the peak value has a large difference. Comparing the bending moment peaks under the three forms of dislocation, it can be seen that the lining moment peak caused by the reverse fault dislocation is the largest, which means that the bending damage caused by the reverse fault dislocation to the lining structure will be more obvious. From the engineering point of view, under the effect of the positive and inverse fault dislocation, the tunnel lining structure may produce dislocation in the vertical direction, which is the most unfavorable engineering situation. For example, a serious dislocation in the vertical direction of the diversion tunnel will lead to a reduction of the tunnel section headroom, affecting the diversion of water. The dislocation of the slip fault makes the structure deformed in the horizontal plane, which is relatively simple to repair, but still presents the problem of waterproofing of the lining near the dislocated surface.

Figure 20.
The form of fault dislocation affects the internal force of the lining. (a) Distribution of bending moment of each section of lining along the axial direction. (b) Distribution of axial force of each section of lining along the axial direction.
Figure 20b shows the distribution of the axial force of the lining along the axial direction under the effect of different fault dislocation forms. The distribution of the axial force along the axial direction of different fault dislocation forms differs greatly, which is mainly because the lining is subjected to tensile-shear deformation when the positive fault is dislocated, compression-shear deformation when the reverse fault is dislocated, and shear deformation when the strike-slip fault is dislocated. When the positive and reverse faults are dislocated, the value of the lining axial force is significantly larger than that of the strike-slip fault. In addition, the peak value of the section axial force during the normal fault and strike-slip fault dislocation is located at the junction of the fault fracture zone and footwall. The peak value of the section axial force during the reverse fault dislocation is located at the junction of the fracture zone and hanging wall, so different parts of the lining shall be strengthened according to the different fault dislocation forms.
4.4.3. Internal Force Analysis of Typical Section
The distribution of the bending moment at the key points of each section in the form of different fault dislocation is shown in Figure 21a–e. It can be seen from the figures that the axial force distribution of each section during the reverse fault dislocation is almost opposite to that of the normal fault dislocation.
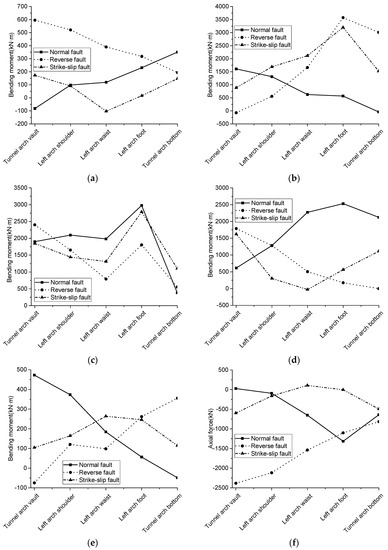
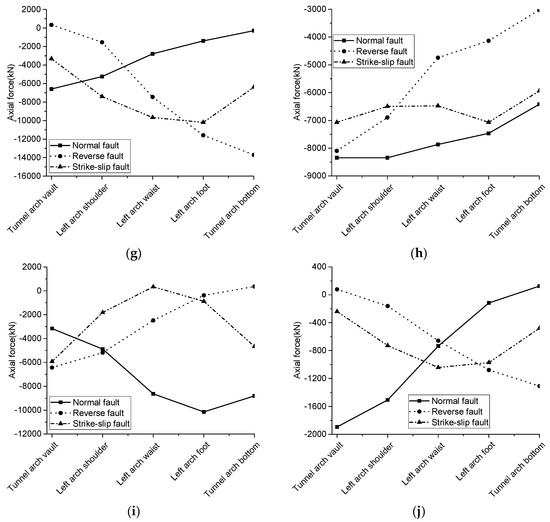
Figure 21.
The form of the fault dislocation affects the bending moment and axial force at the key points of the lining section. (a) The bending moment of the section ①-①. (b) The bending moment of the section ②-②. (c) The bending moment of the section ③-③. (d) The bending moment of the section ④-④. (e) The bending moment of the section ⑤-⑤. (f) The axial force of the section ①-①. (g) The axial force of the section ②-②. (h) The axial force of the section ③-③. (i) The axial force of the section ④-④. (j) The axial force of the section ⑤-⑤.
For example, the bending moment from the arch top to the arch bottom of the section ②-② decreases gradually during the normal fault dislocation, while the bending moment increases gradually during the reverse fault dislocation. When the normal fault dislocation is used, the section arch top at the junction of the fault fracture zone and the hanging wall is prone to bending damage, while the section arch bottom is prone to bending damage during the reverse fault action. Therefore, targeted anti-fault measures should be taken according to the actual fault dislocation form. The bending moment value at the key points of each section is small and has no obvious distribution law when the strike-slip fault is dislocated, which indicates that the damage is relatively small when the strike-slip fault is dislocated. Therefore, the anti-slip measures for the normal fault and reverse fault dislocations of the cross-fault tunnel lining should be emphatically considered.
Figure 21f–j show the distribution of the axial force at the key points of each section when different faults are dislocated. As can be seen from the figure, when the reverse fault is dislocated, the axial force distribution law of each key point is opposite to that when the normal fault is dislocated. For example, when the normal fault is dislocated, the axial force from the arch vault to the arch bottom of the section ②-② is gradually reduced, and the arch vault is prone to compression failure. When the reverse fault is dislocated, the axial force from the arch vault to the arch bottom of the section ②-② is gradually increased, and the arch bottom is prone to compression failure. At the same time, it should be noted that the maximum difference of the axial force between each key point in the same section of the reverse fault dislocation is larger than that of the positive fault dislocation. The compression deformation between each key point in the section of the reverse fault dislocation is more uncoordinated, and the joint damage of tension and compression is more serious. In addition, the value of the axial force is smaller when the strike-slip fault is dislocated, which means that the hazard is relatively small when the strike-slip fault is dislocated.
4.5. Analysis of the Effect of Fault Alignment and Tunnel Axis Intersection Angle on Tunnel Lining Response
The occurrence of the faults encountered in the project is very different. The tunnel axis often crosses the fault in an oblique way, resulting in the deformation of the tunnel lining in the longitudinal interlace, such as tension and compression, bending and torsion, shear, etc. The complexity of its mechanical behavior has brought great difficulties to the tunnel support design. Therefore, this section mainly discusses the mechanical and deformation characteristics of the lining when the intersection angle between the tunnel axis and the fault strike (hereinafter referred to as the intersection angle) is different. The specific calculation conditions are shown in Table 2.
4.5.1. Analysis of Lining Deformation
Figure 22a,b show the distribution curves of the arch waist displacement and the arch waist maximum principal strain along the axial direction at different intersection angles. From the figures, it can be seen that the distribution form of the arch waist displacement along the axial direction is essentially the same for different intersection angles. The larger the intersection angle, the more drastic the displacement distribution curve changes; the smaller the intersection angle, the smoother the displacement distribution curve. The maximum peak principal strain of the arch waist decreases gradually with the increase of the intersection angle, which is primarily caused by the change of the lining from tensile shear deformation to shear deformation. In addition, when the angle of the intersection is less than 80°, the arch waist strain is positive, indicating that the overall tension is high. When the angle of the intersection is greater than 80°, the arch waist at the junction of the fault breakage zone and the hanging wall experiences compression strain. For concrete materials, tensile failure is far easier than compressive failure, so a smaller intersection angle results in reduced safety of the lining. Therefore, when selecting the tunnel alignment, we should try to choose the tunnel axis and the fault direction of a large angle, so as to effectively reduce the tensile stress on the lining, and make full use of the lining concrete compressive properties.
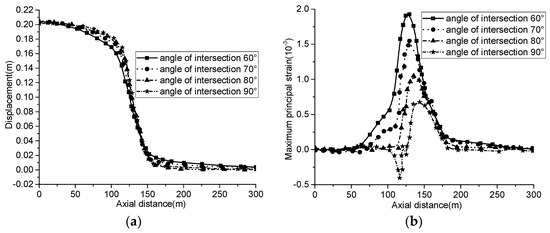
Figure 22.
The fault alignment and the tunnel axis intersection angle affect the lining deformation. (a) The distribution of the vault displacement along the axial direction. (b) The distribution of the maximum principal strain of the arch vault along the axial direction.
4.5.2. Analysis of Internal Forces along the Axial Section of the Lining
Figure 23a,b show the distribution curves of the section bending moment and the axial force along the axial direction for different intersection angles, respectively. It can be seen from Figure 23a that there is no difference in the distribution of the section bending moment along the axial direction when the intersection angle is different, which means that the change of the intersection angle does not affect the magnitude of the bending moment and its influence range. From Figure 23b, it can be seen that the distribution pattern of the axial force along the axial direction of the section differs greatly at different intersection angles. As the intersection angle increases, the main affected range of the lining and the peak value of the axial force gradually decrease, which is primarily due to the fact that when the intersection angle is small, the lining is mainly subjected to tensile-shear deformation, and as the intersection angle increases, the tensile-shear deformation gradually becomes shear deformation. Therefore, in terms of tunnel safety, the larger the angle of the intersection, the safer the tunnel.
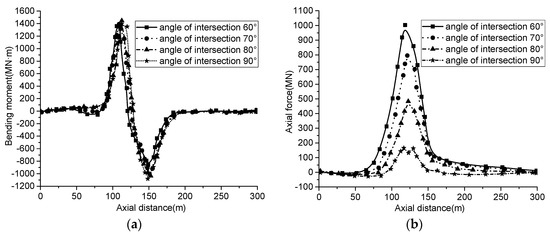
Figure 23.
The angle of the intersection between the fault alignment and the tunnel axis affects the internal force of the lining. (a) The distribution of the bending moment of each section of the lining along the axial direction. (b) The distribution of the axial force of each section of the lining along the axial direction.
4.5.3. Internal Force Analysis of Typical Section
Figure 24a–e show the bending moments at each key point of the section at different intersection angles. As can be seen from the figure, the distribution pattern of the bending moment at each key point of the section is essentially the same. The bending moment at each key point of the section ①-① is obviously larger than that of the section ⑤-⑤, meaning that the fault dislocation has a greater influence on the internal force distribution of the hanging wall lining. The bending moment value at each key point of the section ①-①, section ③-③, and section ④-④ decreases with the increase of the intersection angle, which is mainly because the lining changes from tensile-shear damage to shear damage, making the lining affected range gradually decrease. It should be noted that the bending moment value at each key point of the section ②-② essentially increases with the increase of the intersection angle. Therefore, the larger the intersection angle is, the better it is to reduce the section moment and the safer the lining is, but the damage caused by the excessive shear deformation of the section at the fault dislocation surface should be prevented.
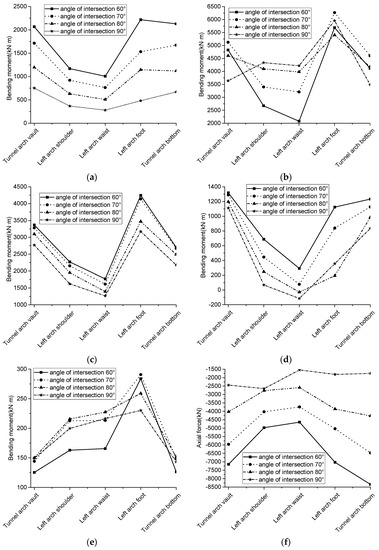

Figure 24.
The intersection angle of the fault strike and the tunnel axis affects the bending moment and the axial force at the key points of lining section. (a) The bending moment of the section ①-①. (b) The bending moment of the section ②-②. (c) The bending moment of section ③-③. (d) The bending moment of the section ④-④. (e) The bending moment of the section ⑤-⑤. (f) The axial force of the section ①-①. (g) The axial force of the section ②-②. (h) The axial force of the section ③-③. (i) The axial force of the section ④-④. (j) The axial force of the section ⑤-⑤.
Figure 24f–j show the axial force at each key point of the cross-section at different intersection angles, and it can be seen from the figure that the axial force distribution law at each key point of the cross-section is essentially the same. The value of the axial force at each key point of the section ①-① is obviously larger than that of the section ⑤-⑤, meaning that the hanging wall lining is more affected under this working condition. At the same time, it can be seen that the axial force value of each key point in the section ①-①, section ③-③, and section ④-④ basically decreases with the increase of the intersection angle, indicating that the larger the intersection angle, the smaller the extrusion deformation of each key point. The incoordination of the compression deformation between adjacent key points in the section decreases, which makes the section gradually change from the joint damage mode of tension and compression to the damage mode of extrusion damage.
5. Investigation of the Length of Tunnel Lining against Dislocation
The structural safety index is reflected by the safety coefficient of the secondary lining, and the minimum safety coefficient of each section in the lining axial direction is used to reflect the safety of the structure. From the aforementioned analysis, it can be seen that the internal force of the liner is concentrated in the fault fragmentation zone and its nearby areas. The fault dislocation, dip angle and dislocation mode do not have significant influence on the distribution range of the internal force of the liner, while the fault width has a greater influence on the distribution range of the internal force. Therefore, we chose to calculate the safety coefficient of the lining along the axial direction for different fault widths, so as to derive the lining fracture-proof length along the axial direction. The minimum safety factor for each axial section of the lining structure will be calculated by taking the safety factor of 2.0 when the reinforced concrete of the tunnel support structure reaches its ultimate strength under the basic combined load, and the range of the safety factor less than 2.0 will be the length of the lining that needs to be fracture-proofed. The distribution of the safety coefficients along the axial direction for each section at different fault widths is shown in Figure 25a–e. The safety coefficients are larger due to the larger axial length and the smaller internal forces on both sides, so the horizontal coordinates are chosen only for the axial direction y = 80–200 m.

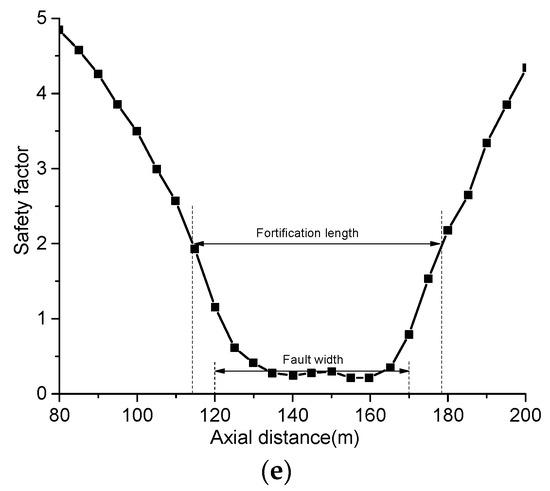
Figure 25.
The distribution of the minimum safety factor of the lining section at different fault widths. (a) Fault width of 10 m. (b) Fault width of 20 m. (c) Fault width of 30 m. (d) Fault width of 40 m. (e) Fault width of 50 m.
As can be seen from Figure 25, the closer to the fault fracture zone, the smaller the minimum safety system of the lining sections. This is because the lining produces a larger deformation in the fault fracture zone, and the interaction force between the surrounding rock and the lining is larger. When the fault width is less than 20 m, and the distance from the fracture zone exceeds a certain distance, the safety factor of each section of the footwall lining will be greater than that of each section of the hanging wall lining. This may be analyzed because the hanging wall is the active plate, and the movement of the hanging wall has a greater impact on the internal force of the lining structure. With the increase of the fault width, the safety factor of the hanging wall lining gradually increases, because with the increase of the fault width, the main influence area of the fault dislocation is shifted to the broken zone. At the same time, it can be seen that the lining anti-staggering set-up range at different fault widths is primarily concentrated in the fault fragmentation zone, and within a certain range on both sides. As shown in Figure 26, with the increase of the fault width, the overall lining protection range increases, but the lining anti-breakage protection length in the upper and footwalls of the fault decreases slightly with the increase of the fault width, and the decrease rate becomes smaller. This is mainly because with the increase of the fault width, the deformation generated by the same dislocation is distributed in a larger range, and the internal force of the lining is reduced, which makes the safety factor increase and the set-up length on both sides decrease.
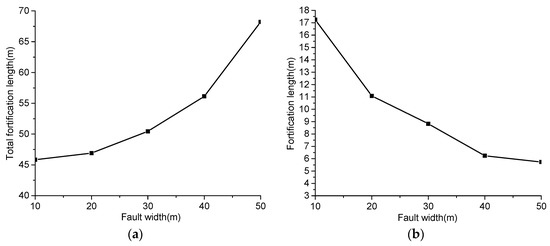

Figure 26.
The fortification length of the lining with different fault widths. (a) The total fortification length. (b) The fortification length of the fault hanging wall. (c) The fortification length of the fault footwall.
6. Engineering Application
The relevant research results in this paper are used to study the reasonable length of the fault-resistant fortification for the Xianglushan Tunnel body section of the Central Yunnan Water Diversion Project under the action of fault dislocation.
In the preliminary support design of the original design, only the length of the system anchor rod, the thickness of the initial support, and the secondary lining were added, and no special design was made with regard to anti-staggering. The fault in the site of the tunnel will produce an average horizontal displacement of 0.35 m within one hundred years, and an earthquake of magnitude 7 or above may occur. Therefore, the length of the anti-staggering fortification during the service period should be considered when designing the support of the tunnel.
The construction conditions and engineering economy are comprehensively considered for the specific working conditions of the Xianglushan Tunnel crossing the fault, and the length of the anti-staggering fortification in the fault fracture zone should be appropriately reduced; the length of the anti-staggering fortification in the fault fracture zone is taken as 8 m, and the length of the anti-staggering fortification in the surrounding rock on both sides is taken as 12 m. At this time, the determined flexible connection length is 0.75 m. Due to the particularity of the material and the small reinforcement ratio, the flexible joint can not only adapt to the formation deformation when the fault moves, but can also indirectly play the role of a seismic joint, so it is not necessary to set the seismic joint repeatedly in the protective enclosure.
7. Conclusions
ABAQUS numerical simulation software was used to establish a stratigraphic-structural model to study the response law of the tunnel lining under the action of fault dislocation, and to analyze the influence of different fault factors on the force and deformation characteristics of the tunnel lining structure, and, on this basis, was combined with the theoretical analysis method to derive the lining dislocation set-up length. The main conclusions obtained are as follows.
- (1)
- The maximum displacement of the lining is essentially consistent with the amount of dislocation, indicating that the lining deformation is controlled by the surrounding rock deformation. The lining structure is constrained by the surrounding rock along the longitudinal “S” shaped bending, and the tunnel structure deformation in the fault and its vicinity is the largest. With the increase of the fault dislocation, the peak bending moment and the axial force of the lining section essentially increase linearly. The fault dip angle mainly affects the force range of the lining, where, as the fault dip angle decreases, the maximum main stress and the maximum main strain distribution range increases, and the axial force of the section gradually increases. This indicates that a dip angle of the fault that is smaller than the tunnel is unfavorable, so the tunnel through the fault should have a larger dip angle.
- (2)
- The influence of the fault width on the tunnel lining mainly depends on its influence range. The wider the fault fracture zone, the larger the deformation range of the fracture zone and the footwall area caused by the hanging wall dislocation. The lining internal force caused by the same dislocation displacement will be distributed in a larger range, which can effectively avoid excessive stress concentration. According to the minimum safety factor of the section, the range of the fault-resistant fortification on both sides of the fault, with different fault widths, can be determined. The results show that with the increase of the fault width, the overall fortification range of the tunnel increases, but the anti-staggered fortification length of the upper and lower wall lining decreases slightly.
- (3)
- The form of the fault dislocation has a decisive influence on the stress state of the tunnel structure. For the lining deformation, the three forms of dislocation cause different directions of lining displacement, resulting in differences in the location of the maximum stress on the tunnel lining. The displacements caused by the normal fault dislocation and reverse fault dislocation are mainly in the vertical direction, and the maximum stresses are on the top and bottom of the arches, respectively; the displacements caused by the strike-slip fault dislocation are mainly in the horizontal direction, resulting in the maximum stresses on the left arch waist of the strike-slip fault. Among the three fault dislocation forms, the axial force generated by the reverse fault dislocation is the largest, followed by the normal fault, and the strike-slip fault is the smallest.
- (4)
- The intersection angle of the fault strike and the tunnel axis has a great influence on the axial force of each section. As the intersection angle increases, the axial force of each section decreases significantly. It can be judged that the lining gradually changes from tensile shear failure to shear failure. Therefore, if it is unavoidable to cross the fault during the tunnel lining selection in the project, the axis should be selected as perpendicular to the strike of the fault as possible.
Author Contributions
Conceptualization, L.B. and F.W.; methodology, F.W.; software, L.B.; validation, F.W.; investigation, F.W.; resources, F.W.; writing—original draft preparation, L.B.; writing—review and editing, F.W.; visualization, L.B.; supervision, F.W.; project administration, F.W. All authors have read and agreed to the published version of the manuscript.
Funding
This work was supported by the National Natural Science Foundations of Shaanxi (No. 2020JM-626), the Project of Yulin Science and Technology Bureau (No.1517-CXY202110602). The financial support is greatly appreciated.
Data Availability Statement
Some or all data that support the findings of this study are available from the corresponding author upon reasonable request.
Conflicts of Interest
The authors declare no conflict of interest.
References
- Wang, W.; Wang, T.; Su, J.; Lin, C.; Seng, C.; Huang, T. Assessment of damage in mountain tunnels due to the Taiwan Chi-Chi Earthquake. Tunn. Undergr. Space Technol. 2001, 16, 133–150. [Google Scholar] [CrossRef]
- Huo, H.; Bobet, A.; Fernández, G.; Ramírez, J. Load transfer mechanisms between underground structure and surrounding ground: Evaluation of the failure of the Daikai station. J. Geotech. Geoenviron. Eng. 2005, 131, 1522–1533. [Google Scholar] [CrossRef]
- Corigliano, M. Seismic Response of Deep Tunnels in Near-Fault Conditions; Politecnico di Torino: Roma, Italy, 2007; pp. 2–22. [Google Scholar]
- Kontogianni, V.A.; Stiros, S.C. Earthquakes and seismic faulting: Effects on tunnels. Turk. J. Earth Sci. 2014, 12, 153–156. [Google Scholar]
- Lin, M.-L.; Chung, C.-F.; Jeng, F.-S.; Yao, T.-C. The deformation of overburden soil induced by thrust faulting and its impact on underground tunnels. Eng. Geol. 2007, 92, 110–132. [Google Scholar] [CrossRef]
- Fang, L.; Jiang, S.P.; Lin, Z.; Wang, F.Q. Shaking table model test study of tunnel through fault. Rock Soil Mech. 2011, 32, 2709–2713 + 2820. [Google Scholar]
- Liu, X.Z.; Lin, L.L. Research on model experiment of effect of thrust with 75° dip angle stick-slip dislocation on highway tunnel. Chin. J. Rock Mech. Eng. 2011, 30, 2523–2530. [Google Scholar]
- Liu, X.; Li, X.; Sang, Y.; Lin, L. Experimental study on normal fault rupture propagation in loose strata and its impact on mountain tunnels. Tunn. Undergr. Space Technol. 2015, 49, 417–425. [Google Scholar] [CrossRef]
- Geng, P.; Wu, C.; Tang, J.L.; Li, L. Analysis of dynamic response properties for tunnel through fault fracture zone. Chin. J. Rock Mech. Eng. 2012, 31, 1406–1413. [Google Scholar]
- Xu, Q.W.; Cheng, P.P.; Zhu, H.H.; Ding, W.Q.; Li, Y.H.; Wang, W.T.; Luo, Y. Model tests and numerical simulations of progressive failure of cross-fault tunnel envelopes. Chin. J. Rock Mech. Eng. 2016, 35, 433–445. [Google Scholar]
- Baziar, M.H.; Nabizadeh, A.; Lee, C.J.; Hung, W.Y. Centrifuge modeling of interaction between reverse faulting and tunnel. Soil Dyn. Earthq. Eng. 2014, 65, 151–164. [Google Scholar] [CrossRef]
- Liu, X.; Zhang, C.; Xiao, H.; Zhou, H.; Chi, F. Deformation and failure characteristics of a deeply buried tunnel subjected to creep slip fault movement: Based on the engineering conditions of Yunnan water intake project. Bull. Eng. Geol. Environ. 2022, 81, 1–16. [Google Scholar] [CrossRef]
- Wang, T.; Geng, P.; Li, P.; Wang, Q.; Wang, L. Deformation and failure of overburden soil subjected to normal fault dislocation and its impact on tunnel. Eng. Fail. Anal. 2022, 142, 106747. [Google Scholar] [CrossRef]
- Wang, Q.; Geng, P.; Li, P.; Wang, T.; Sun, W. Failure analysis and dislocation-resistant design parameters of mining tunnel under normal faulting. Eng. Fail. Anal. 2022, 143, 106902. [Google Scholar] [CrossRef]
- Anastasopoulos, I.; Gerolymos, N.; Drosos, V.; Georgarakos, T.; Kourkoulis, R.; Gazetas, G. Behaviour of deep immersed tunnel under combined normal fault rupture deformation and subsequent seismic shaking. Bull Earthq. Eng. 2008, 6, 213–239. [Google Scholar] [CrossRef]
- Yang, C.W.; Su, T.B.; Zhang, J.J. New Developments in Geotechnical Earthquake Engineering. Adv. Mater. Sci. Eng. 2014, 2014, 1–7. [Google Scholar]
- Zhang, W.Q. Research on seismic damage mechanism and anti-vibration technology of tunnel crossing fault. Master’s Thesis, Southwest Jiaotong University, Chengdu, China, 2012. (In Chinese). [Google Scholar]
- Liu, K. Research on the mechanism of dislocation failure and seismic dynamic response analysis of cross-fault tunnels on Chengdu-Lanzhou Line. Master’s Thesis, Beijing Jiaotong University, Beijing, China, 2011. (In Chinese). [Google Scholar]
- Pellet, F.; Benoit, O. 3-D Numerical simulation of the behaviour of underground structures crossing faulted zone. In Proceedings of the 9th International Congress on Rock Mechanics, Rotterdam, The Netherlands, 4 February 1999. [Google Scholar]
- Xiong, W.; Fan, W.; Peng, J.B.; Deng, L.S.; Yan, F.R. Numerical analysis of the impact of positive fault activity on road ridge tunneling. Chin. J. Rock Mech. Eng. 2010, 29, 2845–2852. [Google Scholar]
- Jeon, S.; Kim, J.; Seo, Y.; Hong, C. Effect of a fault and weak plane on the stability of a tunnel in rock—A scaled model test and numerical analysis. Int. J. Rock Mech. Min. Sci. 2004, 41, 658–663. [Google Scholar] [CrossRef]
- Jiao, H.; Du, X.; Zhao, M.; Huang, J.; Zhao, X.; Ouyang, W. Nonlinear Seismic Response of Rock Tunnels Crossing Inactive Fault under Obliquely Inci-dent Seismic P Waves. J. Earth Sci. 2021, 32, 1174–1189. [Google Scholar] [CrossRef]
- Zhou, G.; Sheng, Q.; Cui, Z.; Wang, T.; Ma, Y. Investigating the Deformation and Failure Mechanism of a Submarine Tunnel with Flexible Joints Subjected to Strike-Slip Faults. J. Mar. Sci. Eng. 2021, 9, 1412. [Google Scholar] [CrossRef]
- Chen, P.; Geng, P.; Chen, J.; Gu, W. The seismic damage mechanism of Daliang tunnel by fault dislocation during the 2022 Menyuan Ms6.9 earthquake based on unidirectional velocity pulse input. Eng. Fail. Anal. 2023, 145, 107047. [Google Scholar] [CrossRef]
- Huang, J.; Chen, X.; Zhao, X.; Zhao, M. Nonlinear Response of Tunnels under Coseismic Displacement Induced by Strike-Slip Fault. Int. J. Géoméch. 2022, 22, 04022177. [Google Scholar] [CrossRef]
- Wu, X.; Nie, C.; Li, D.; Qiu, F.; Tang, Y. Structural Response of a Prefabricated Utility Tunnel Subject to a Reverse Fault. Buildings 2022, 12, 1086. [Google Scholar] [CrossRef]
- Yan, G.; Zhao, B.; Wang, Z.; Gao, B. Simplified analytical solution for responses of fault-crossing tunnels with flexible joints under fault movement. Structures 2022, 45, 984–998. [Google Scholar] [CrossRef]
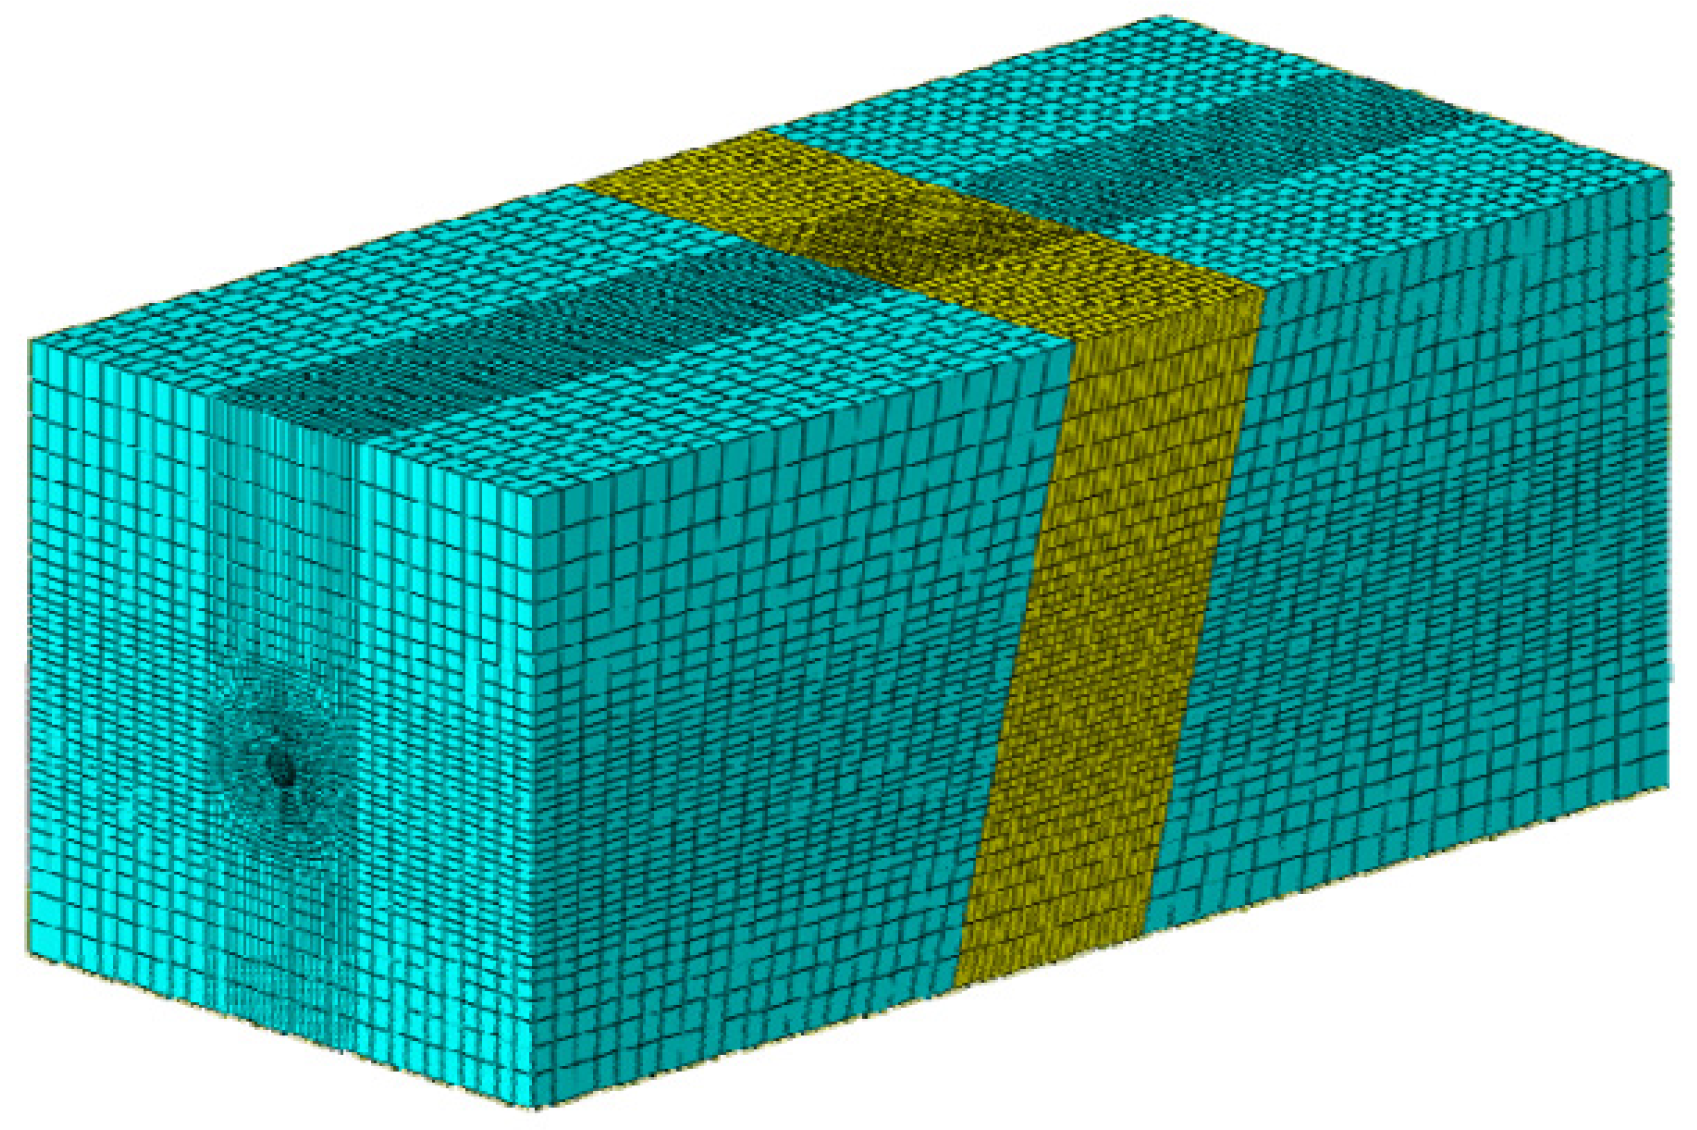
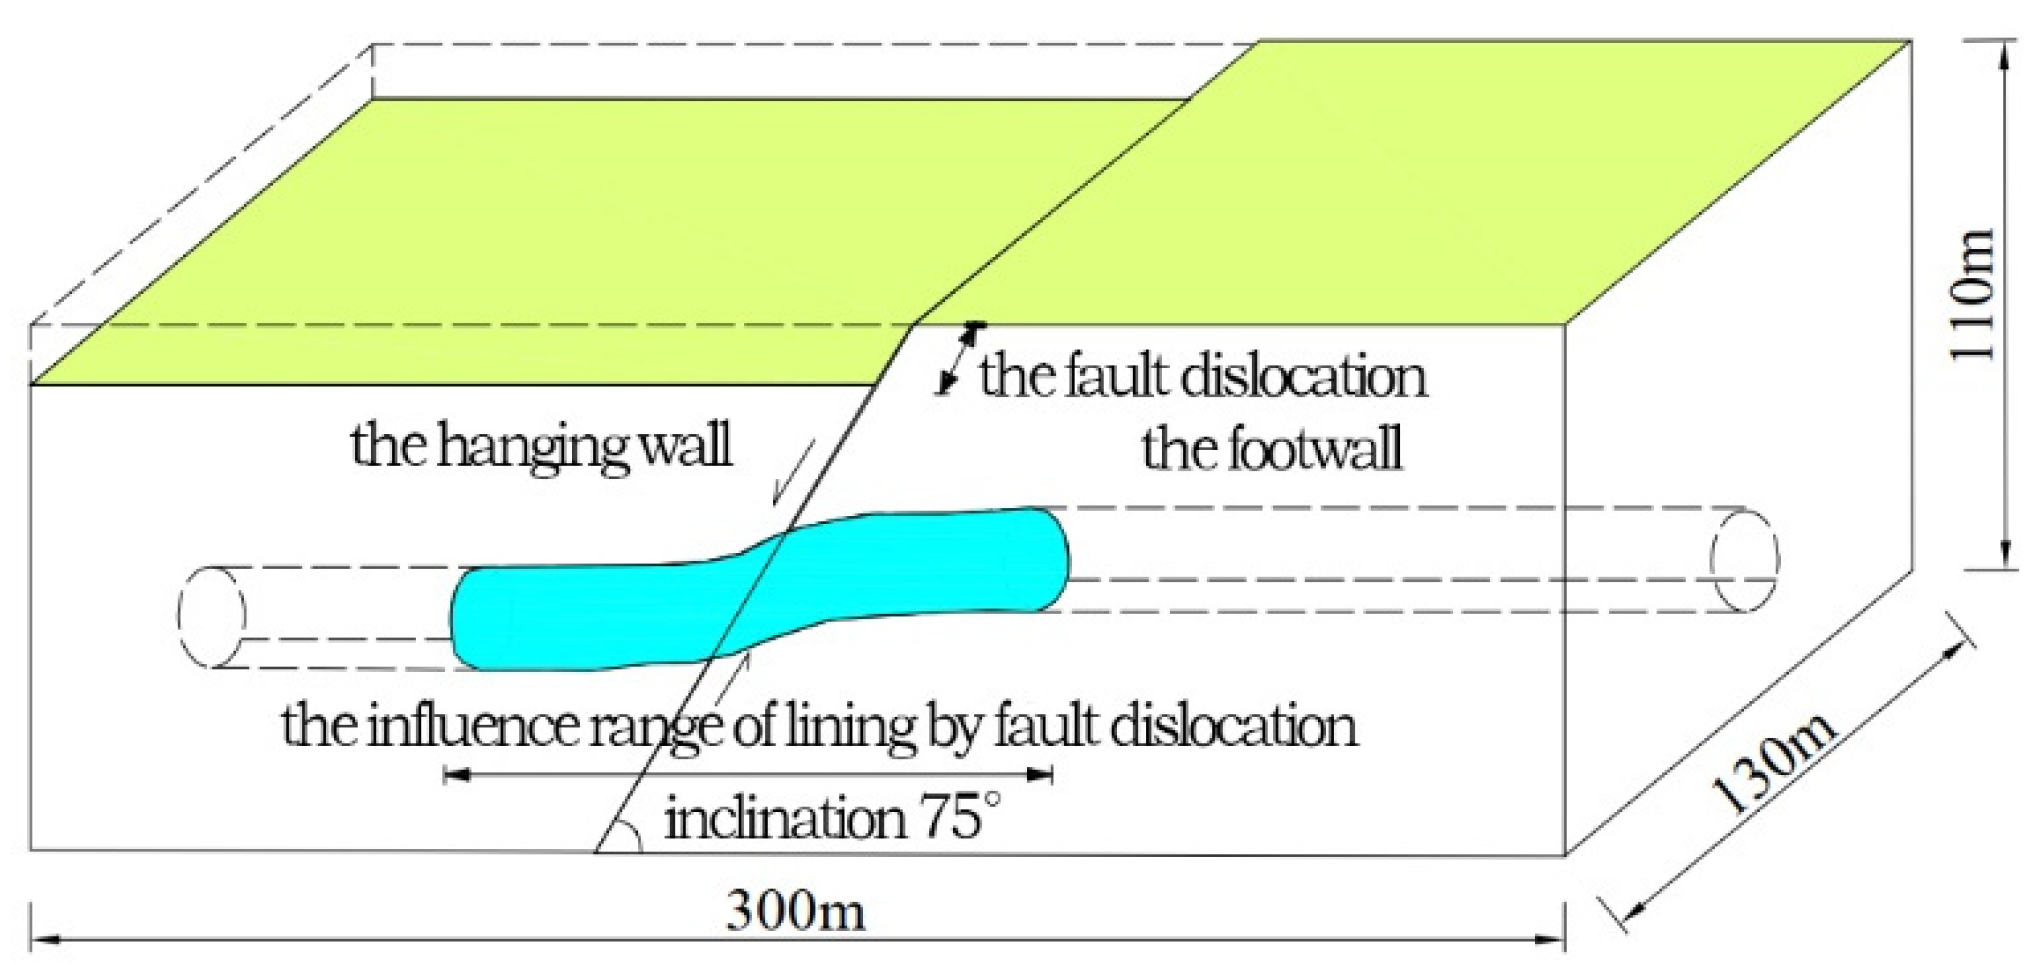

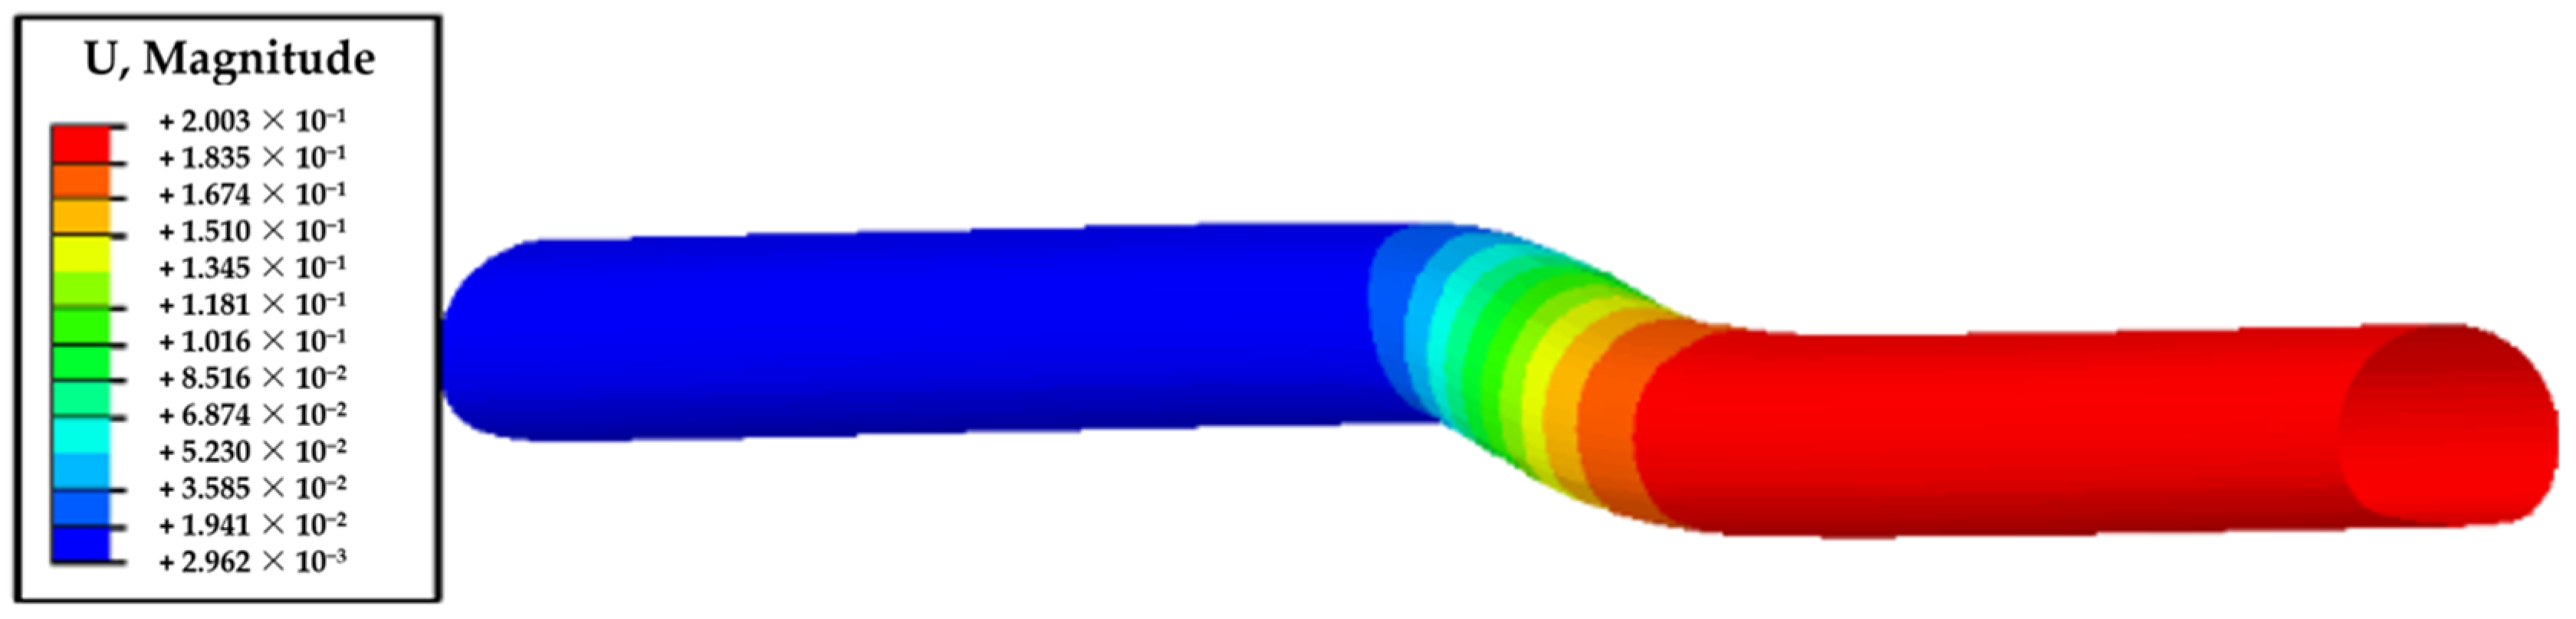
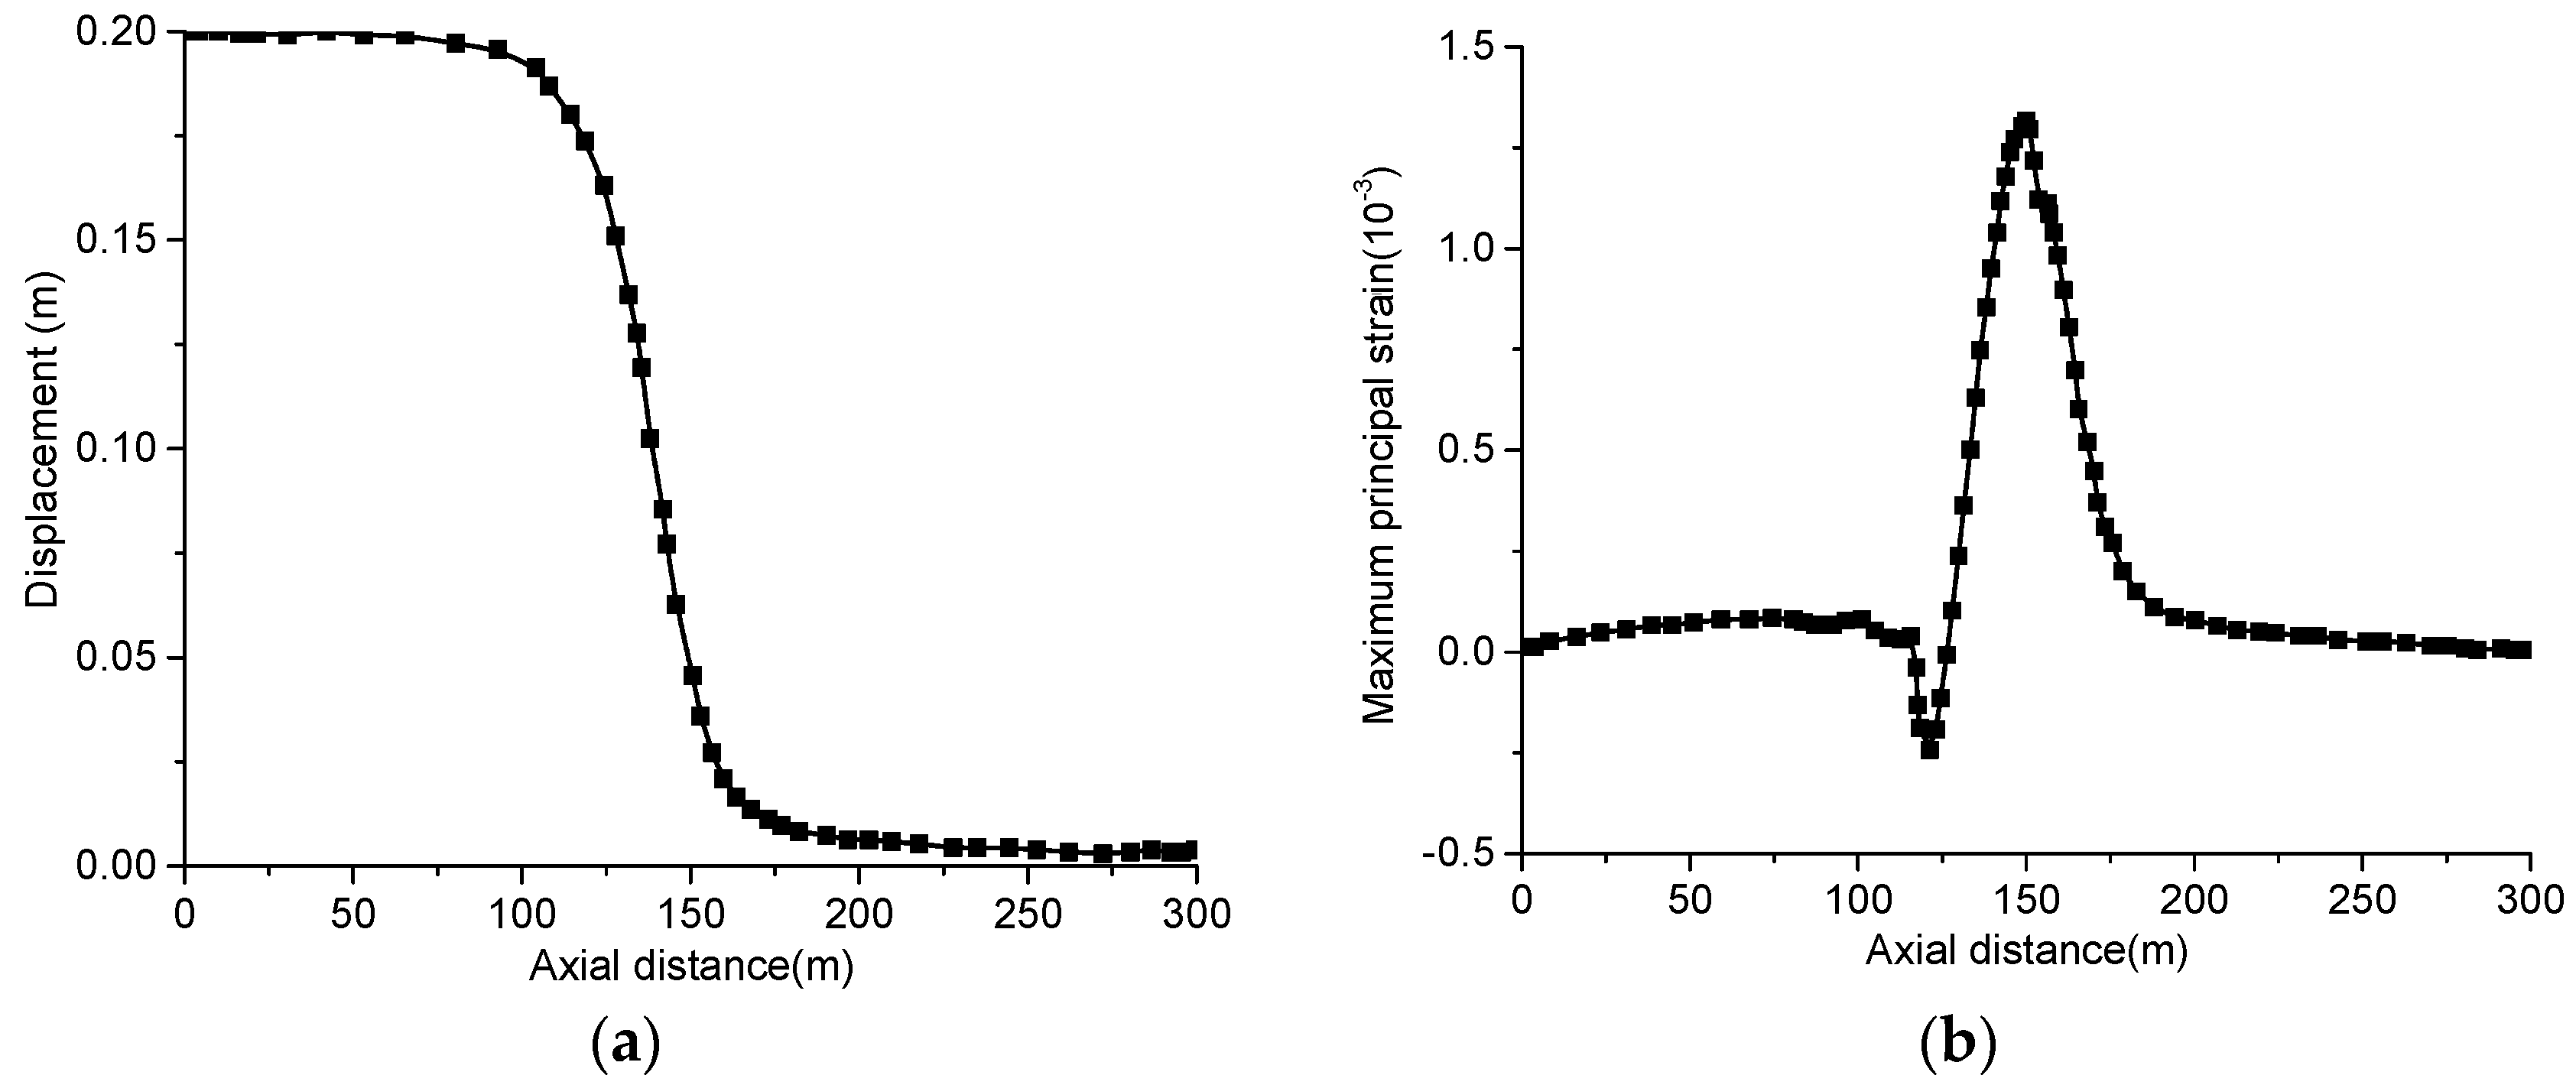
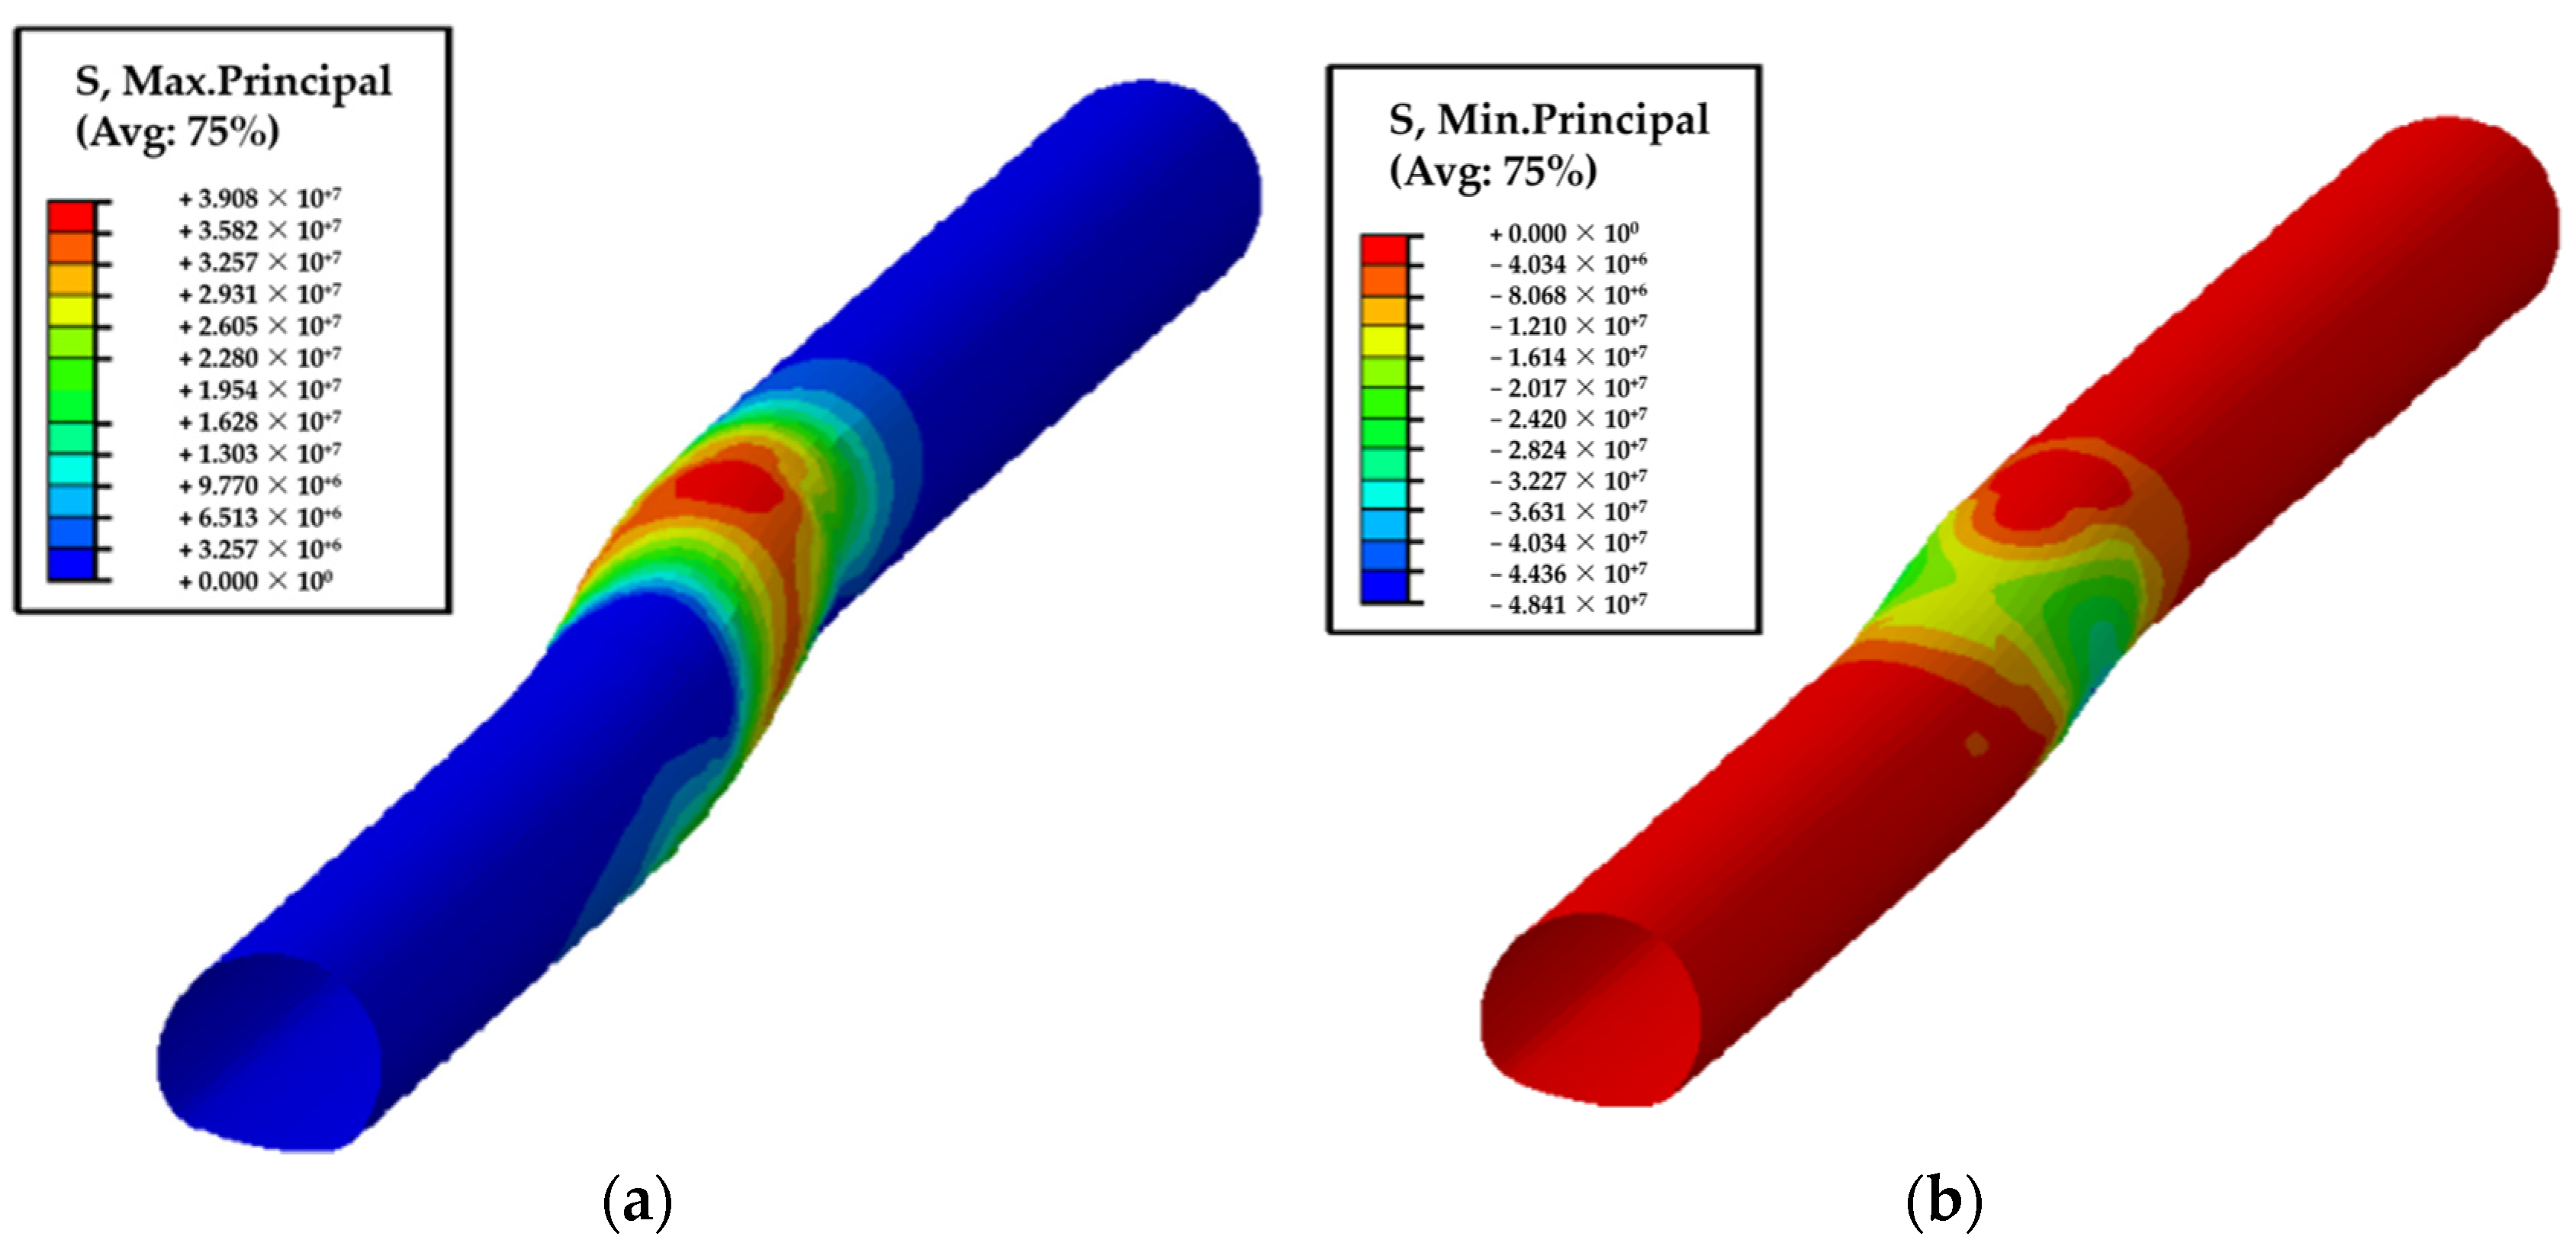
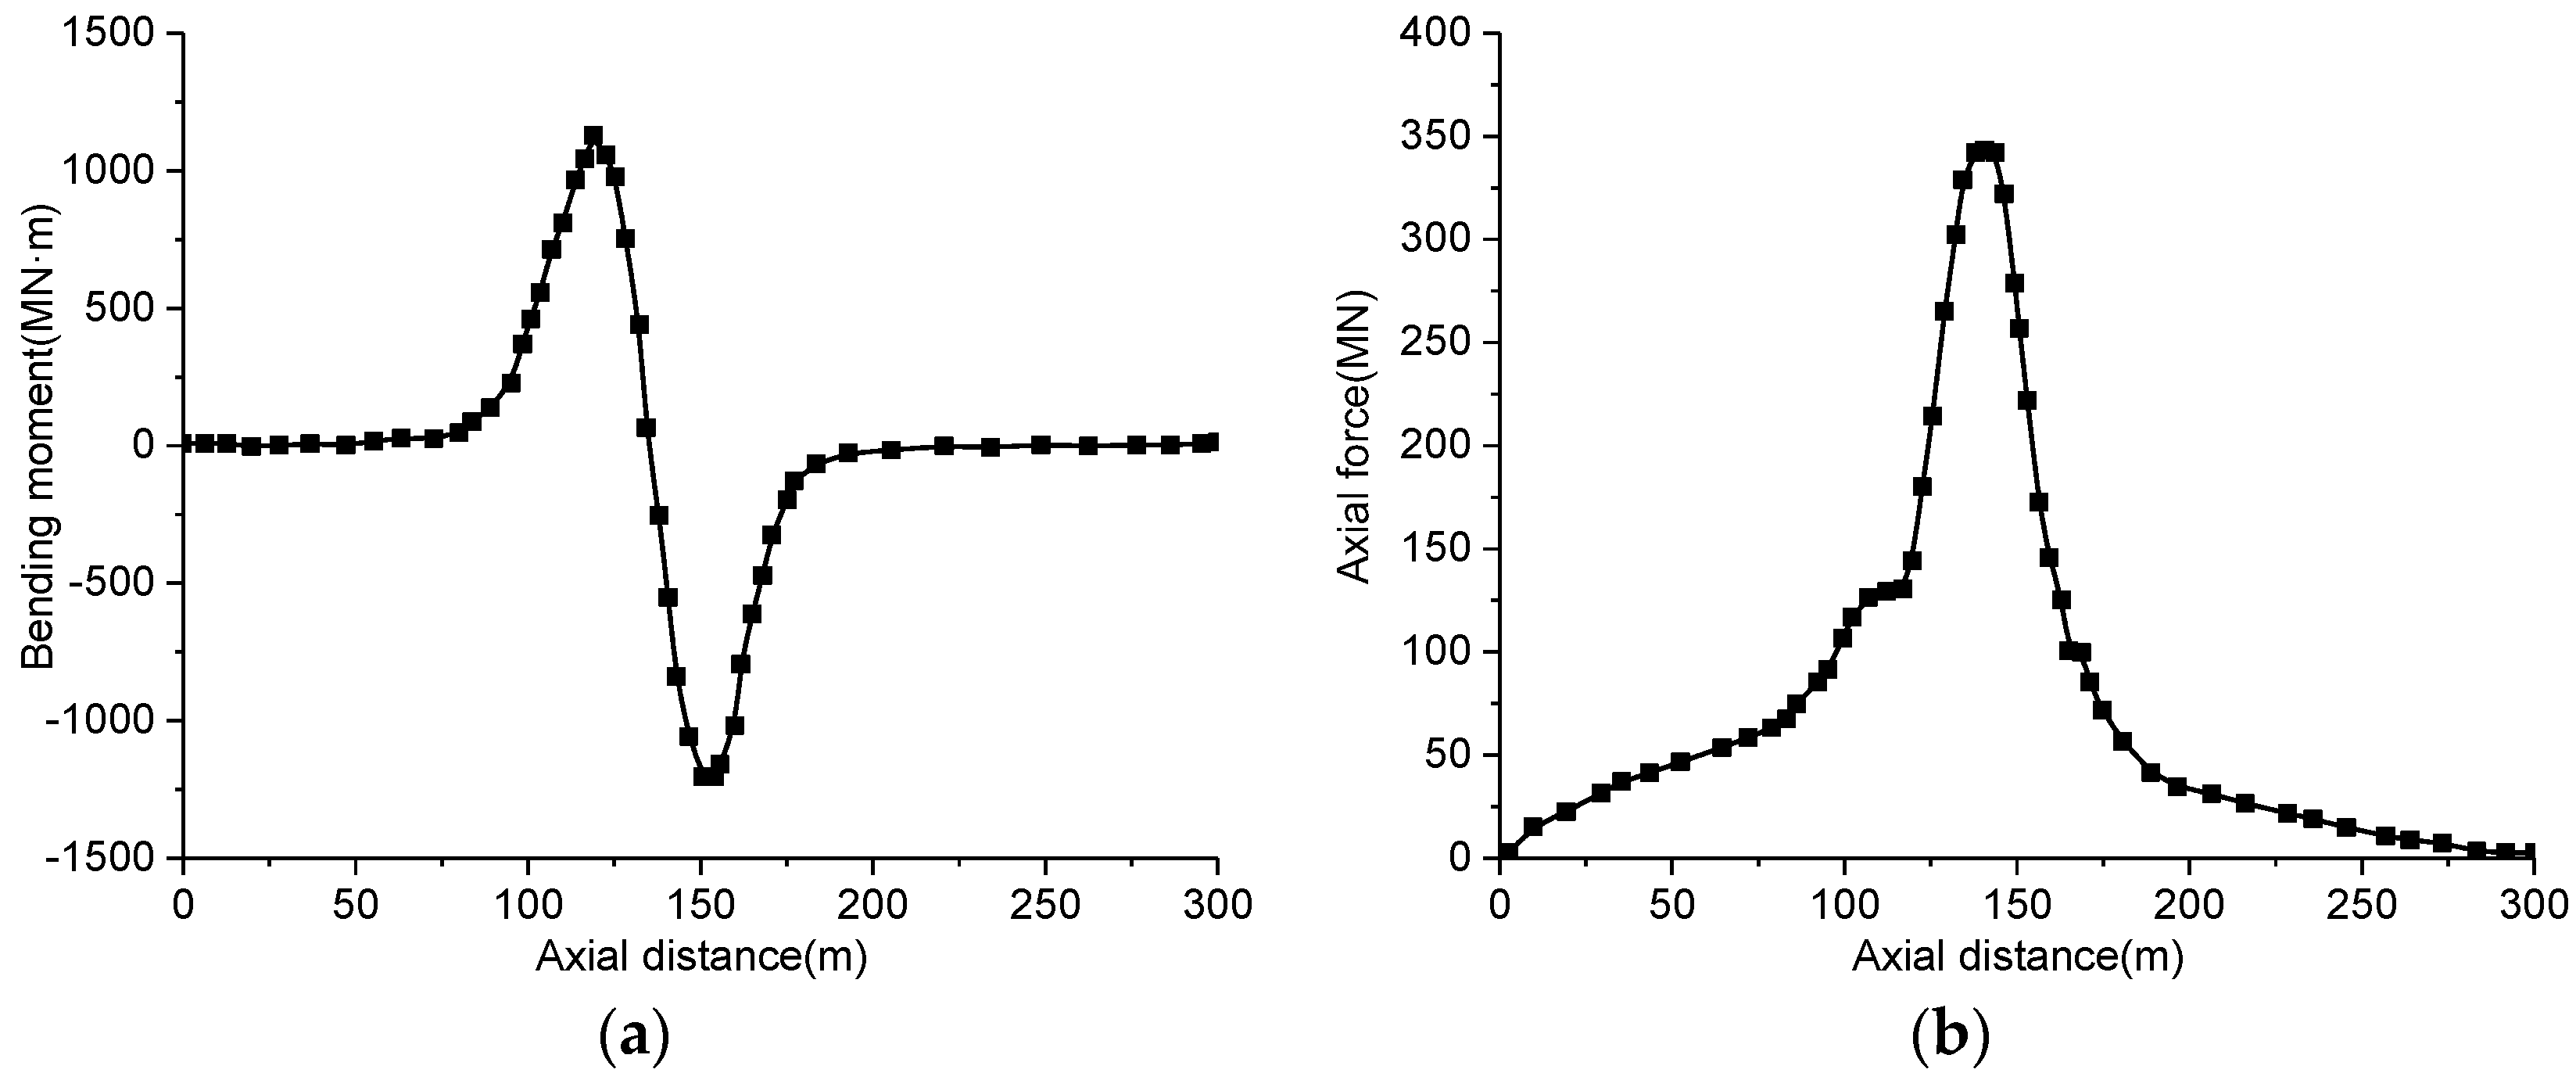
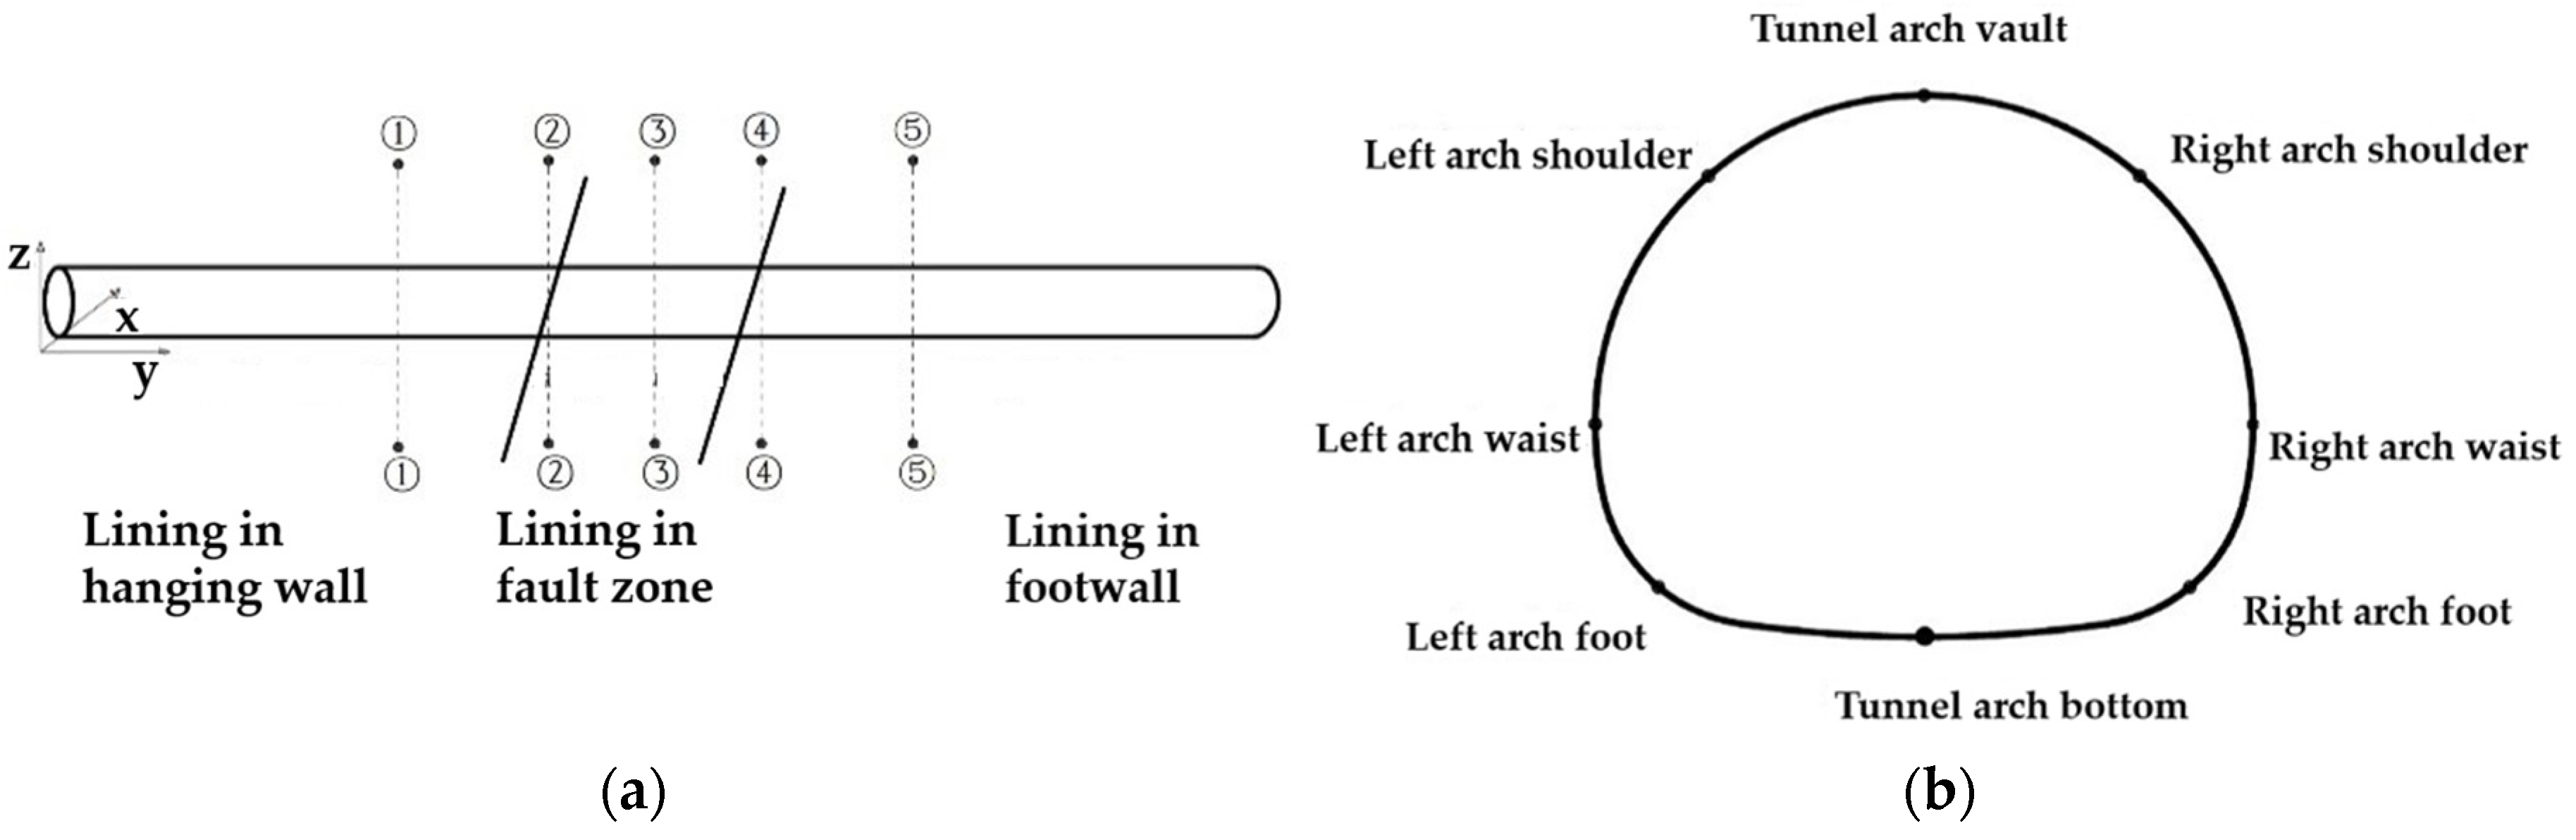
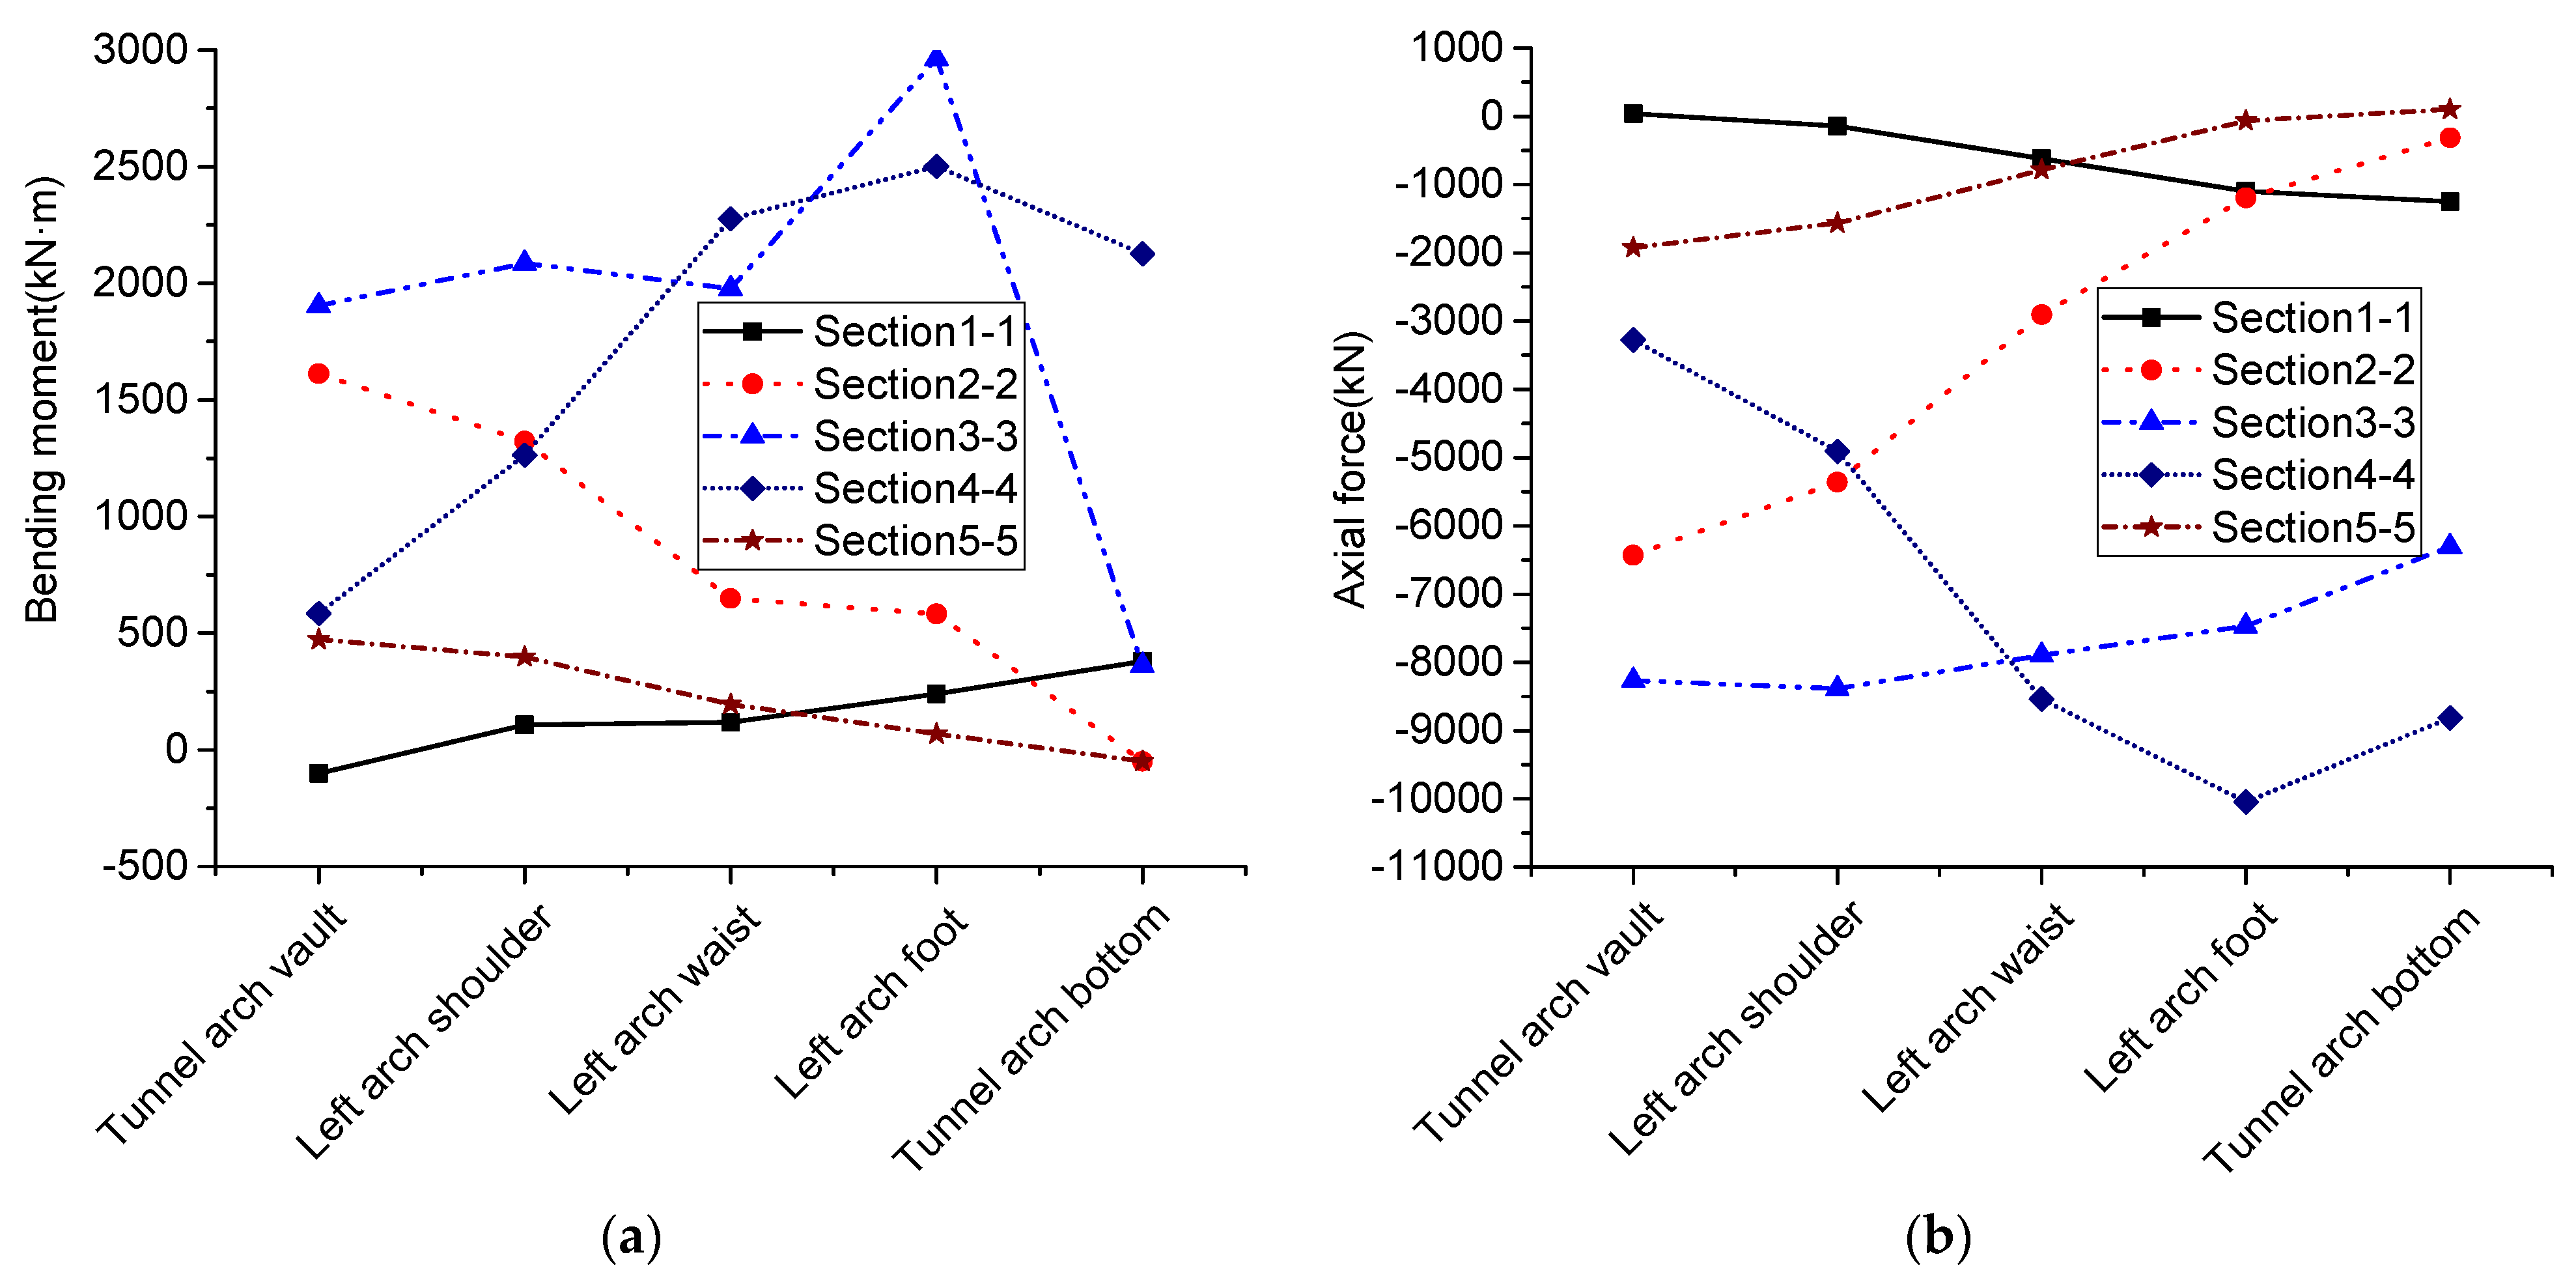

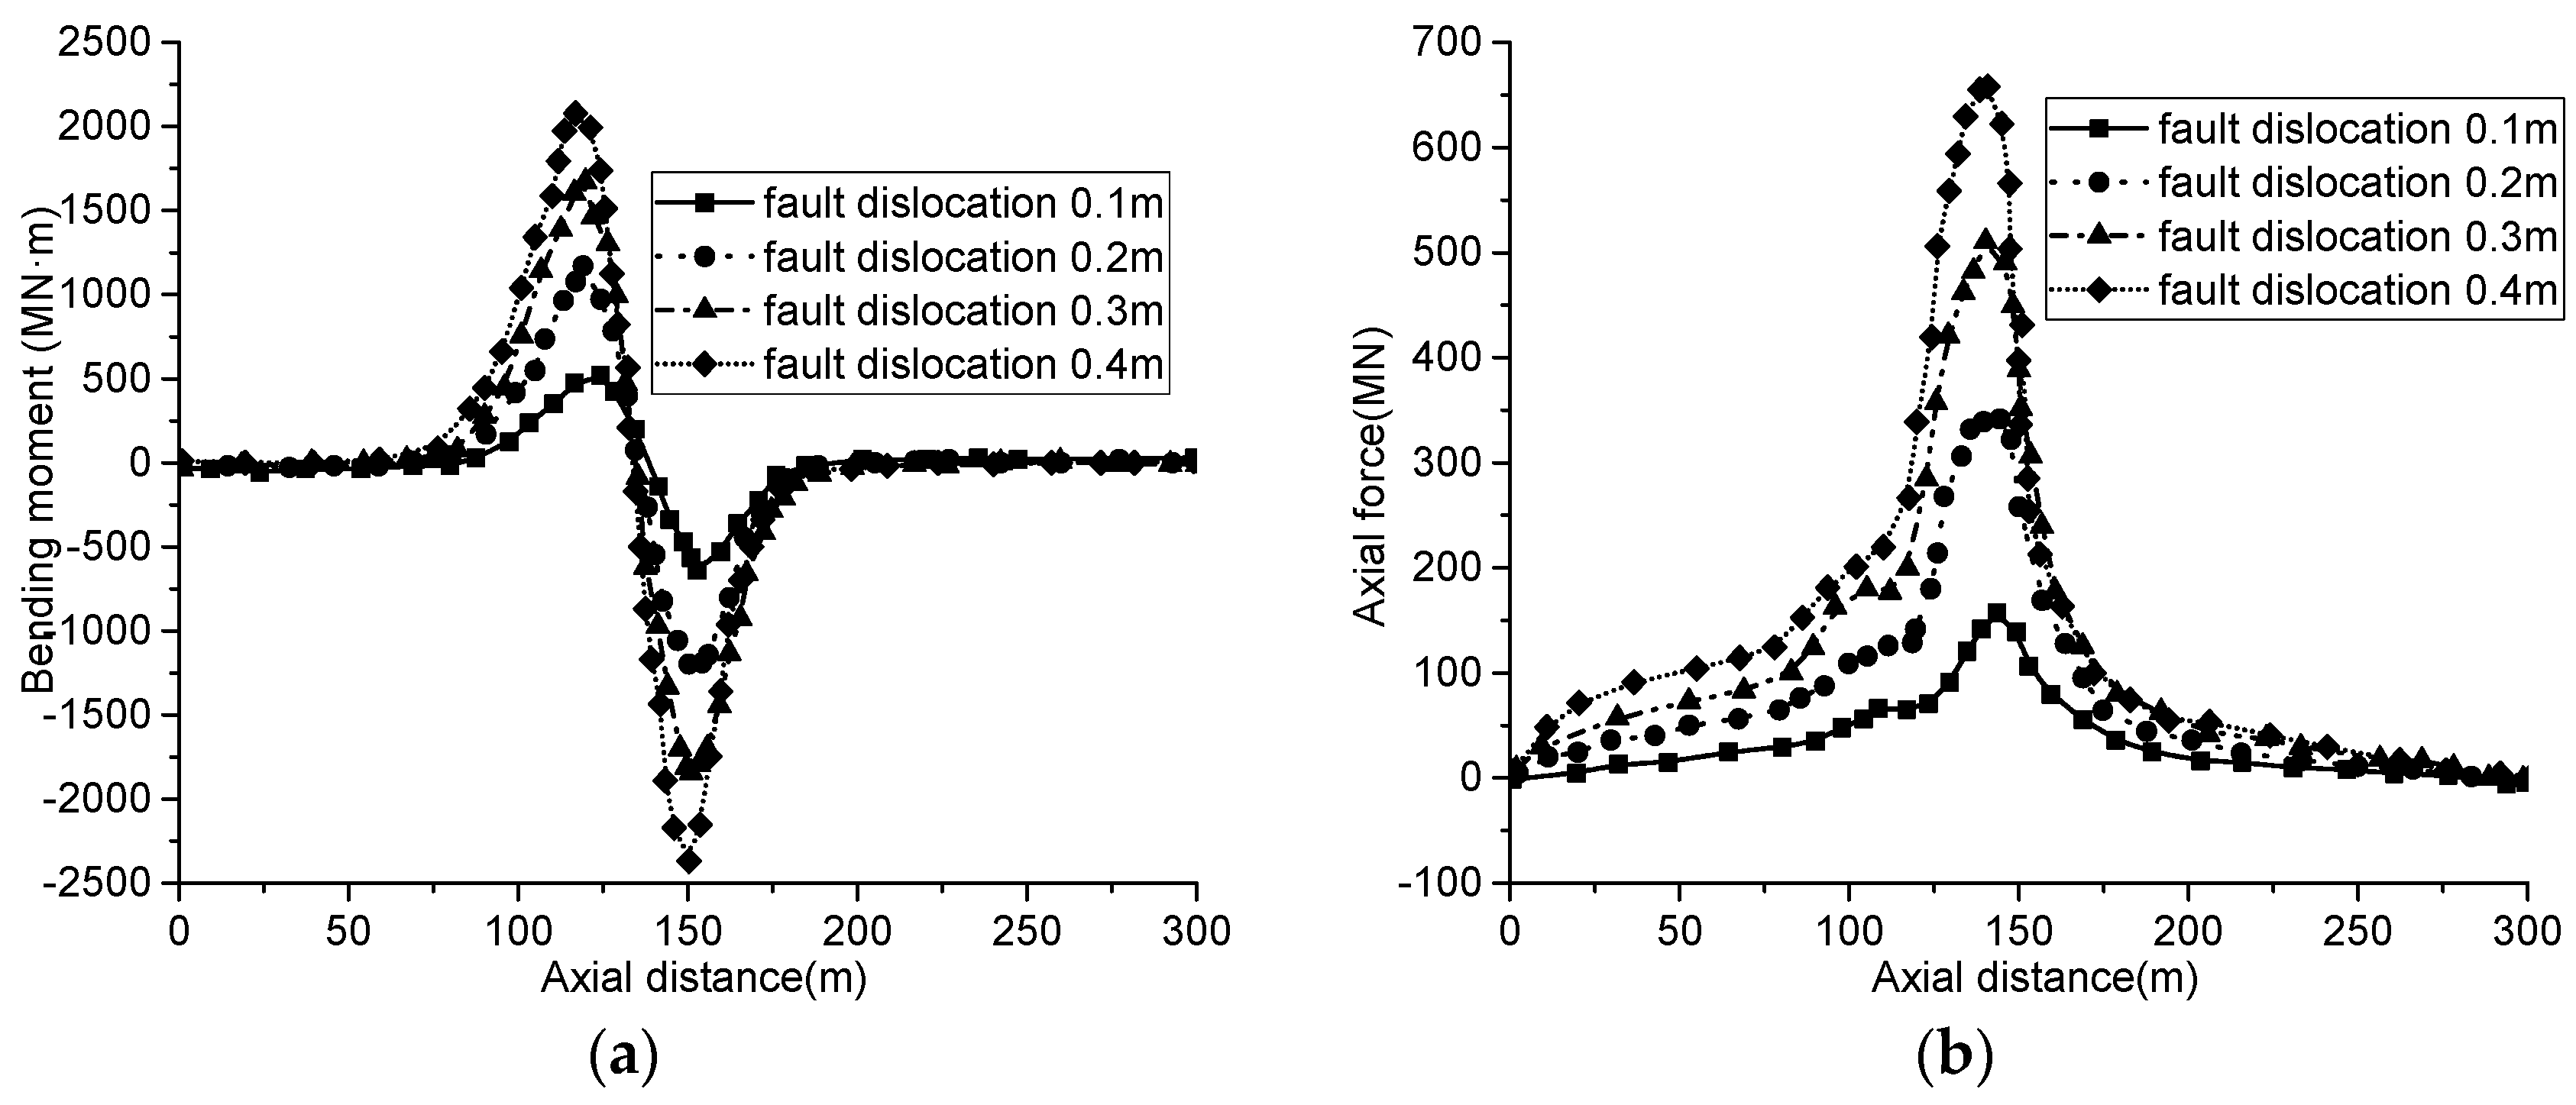
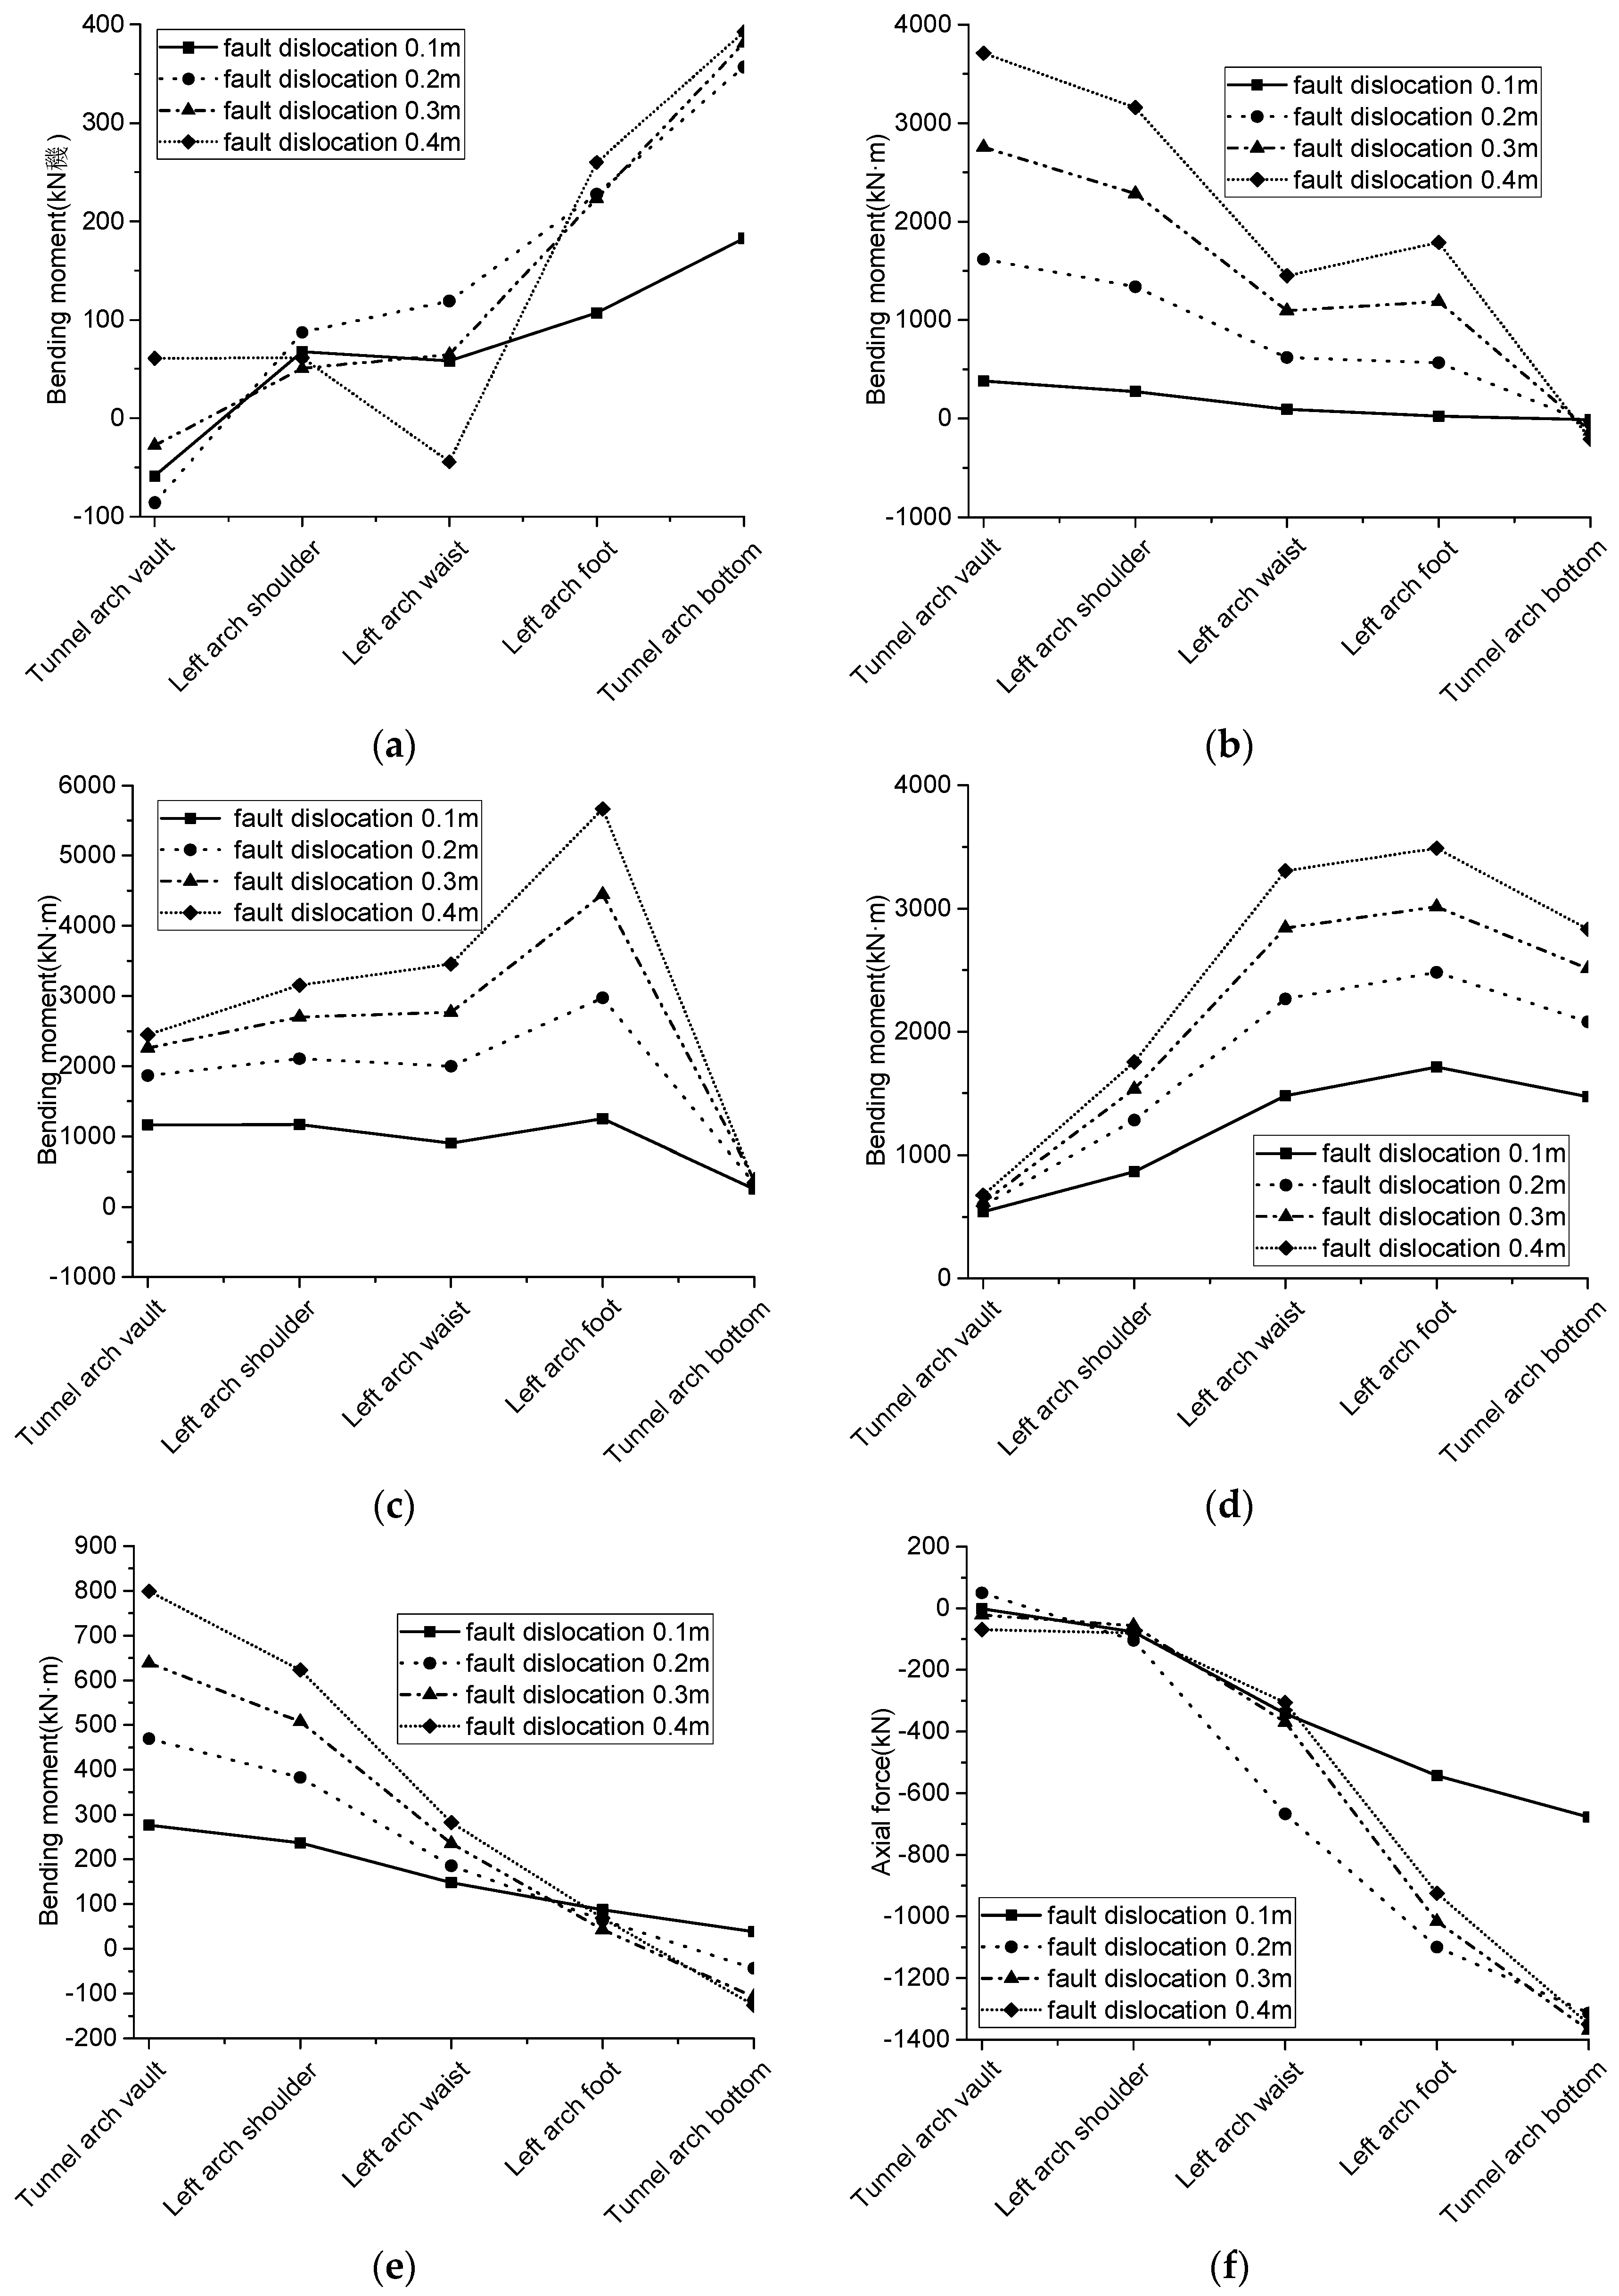
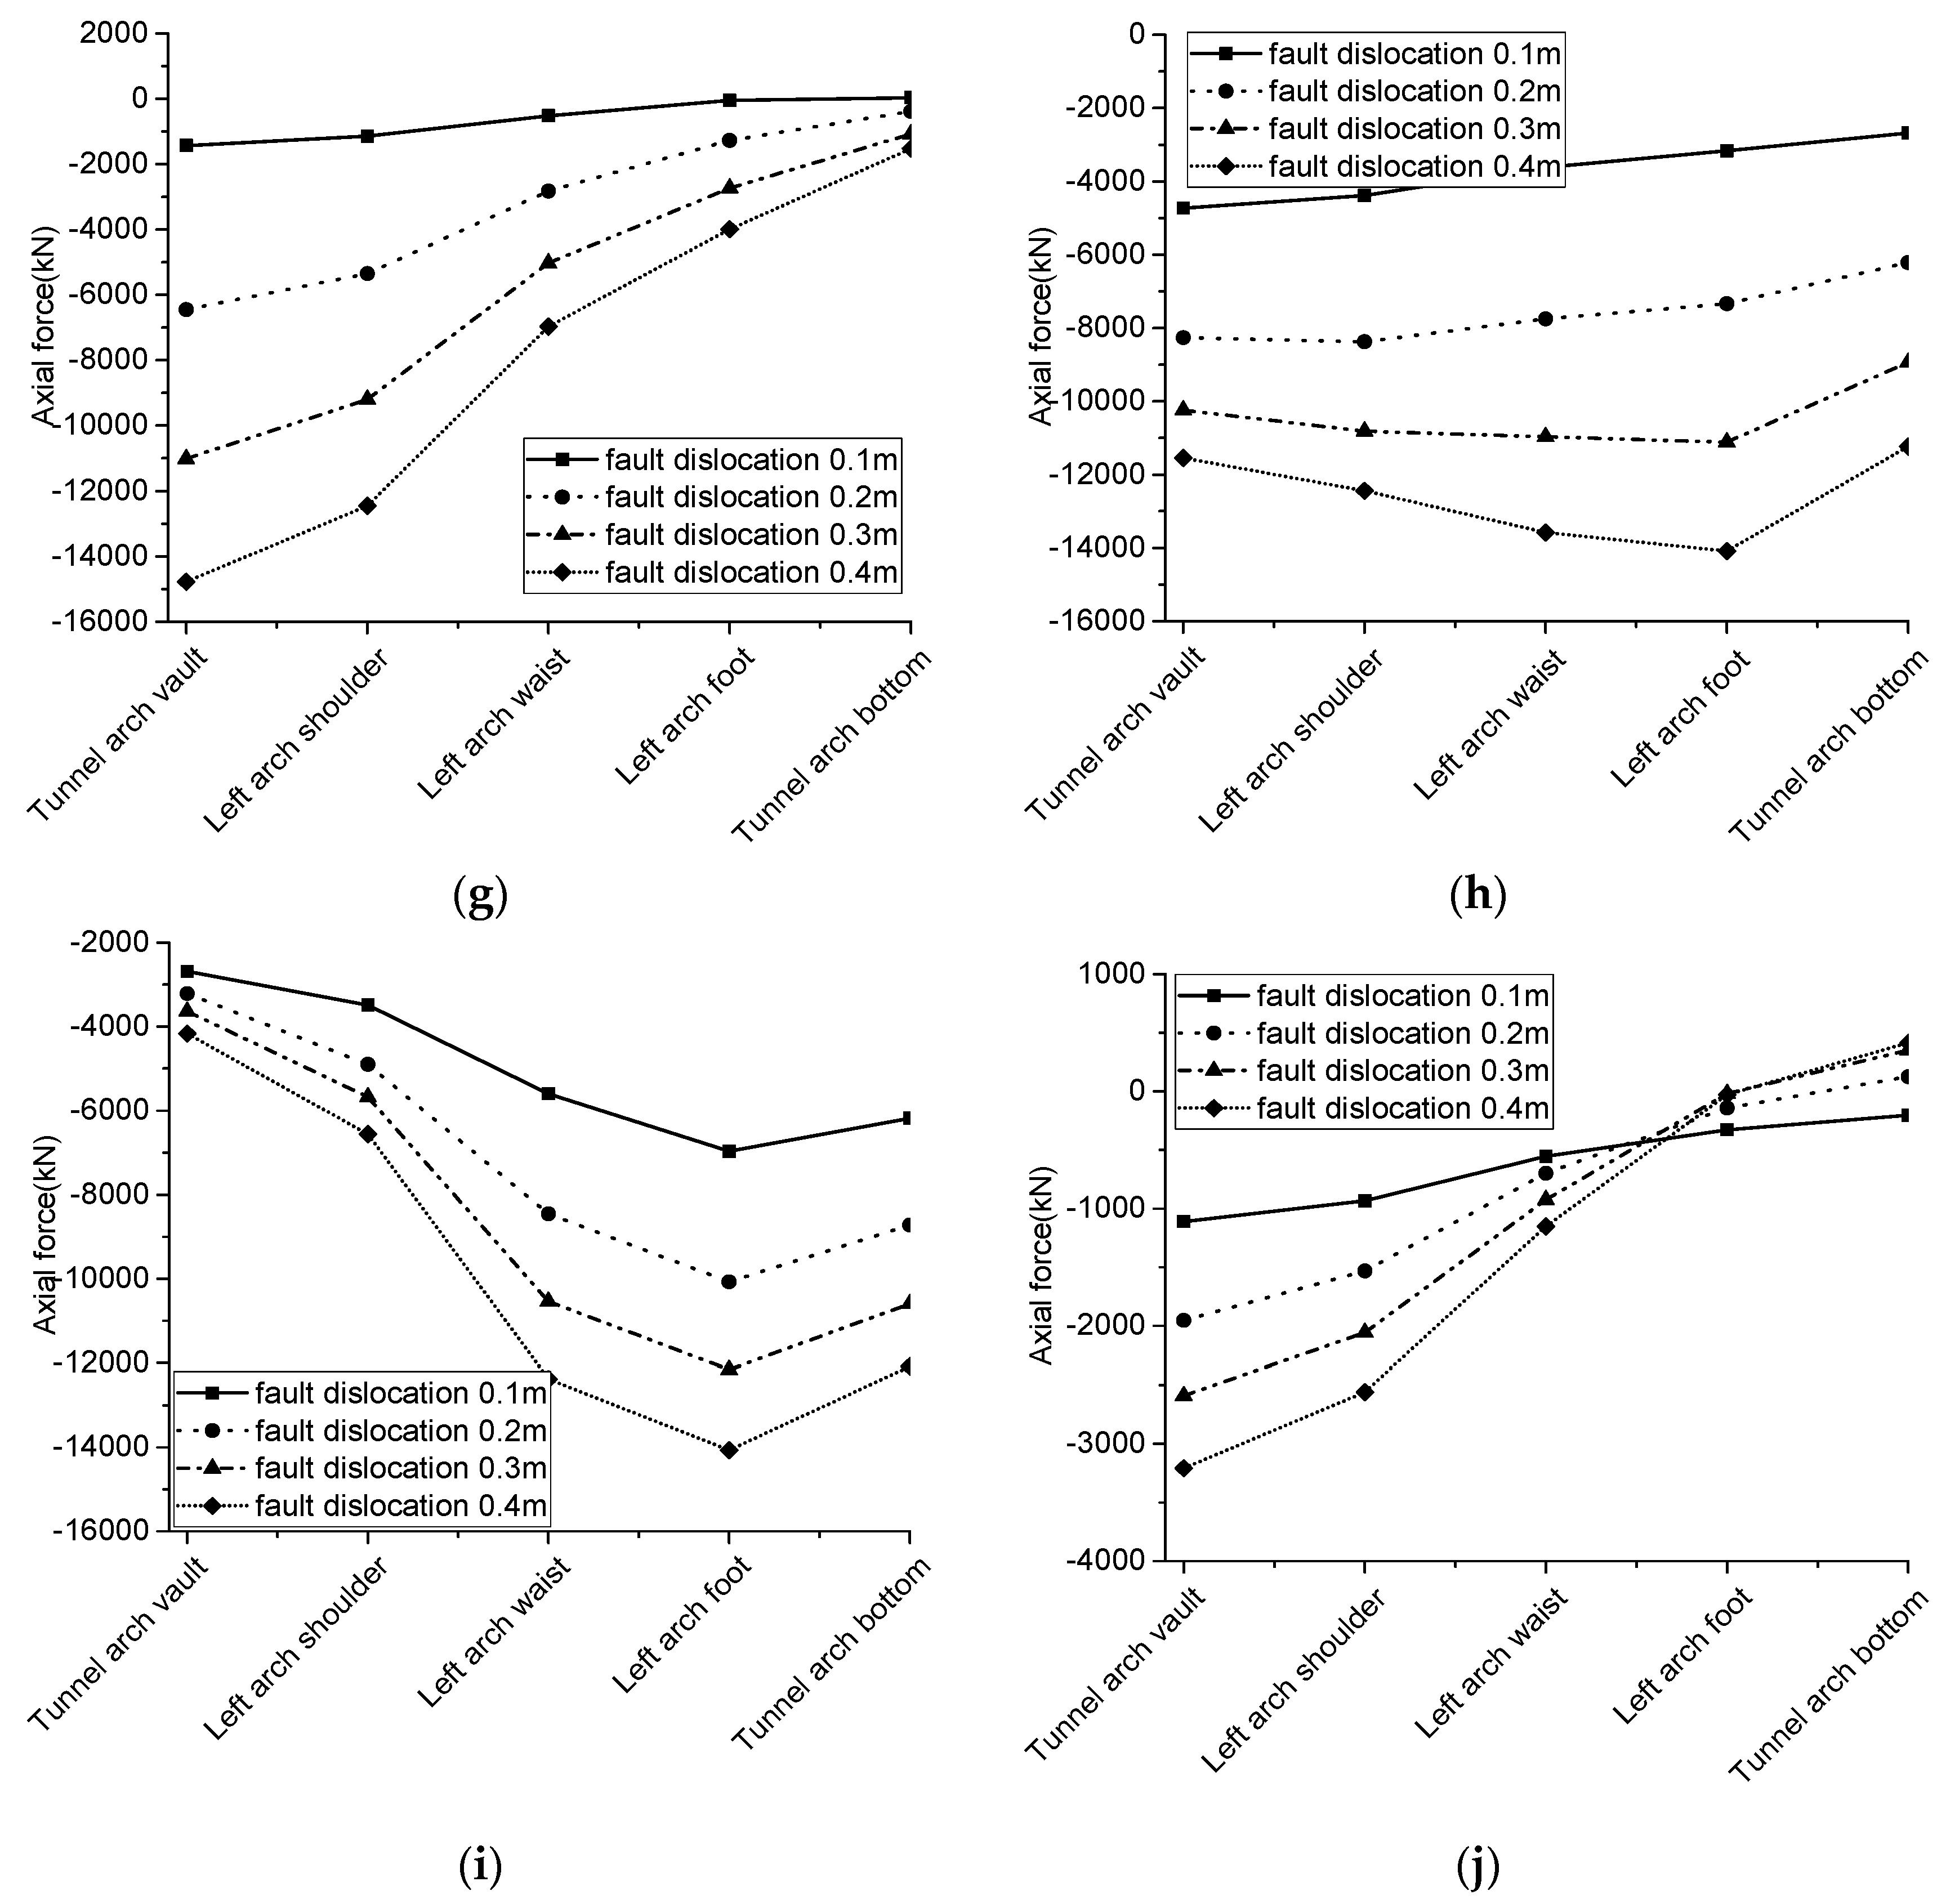

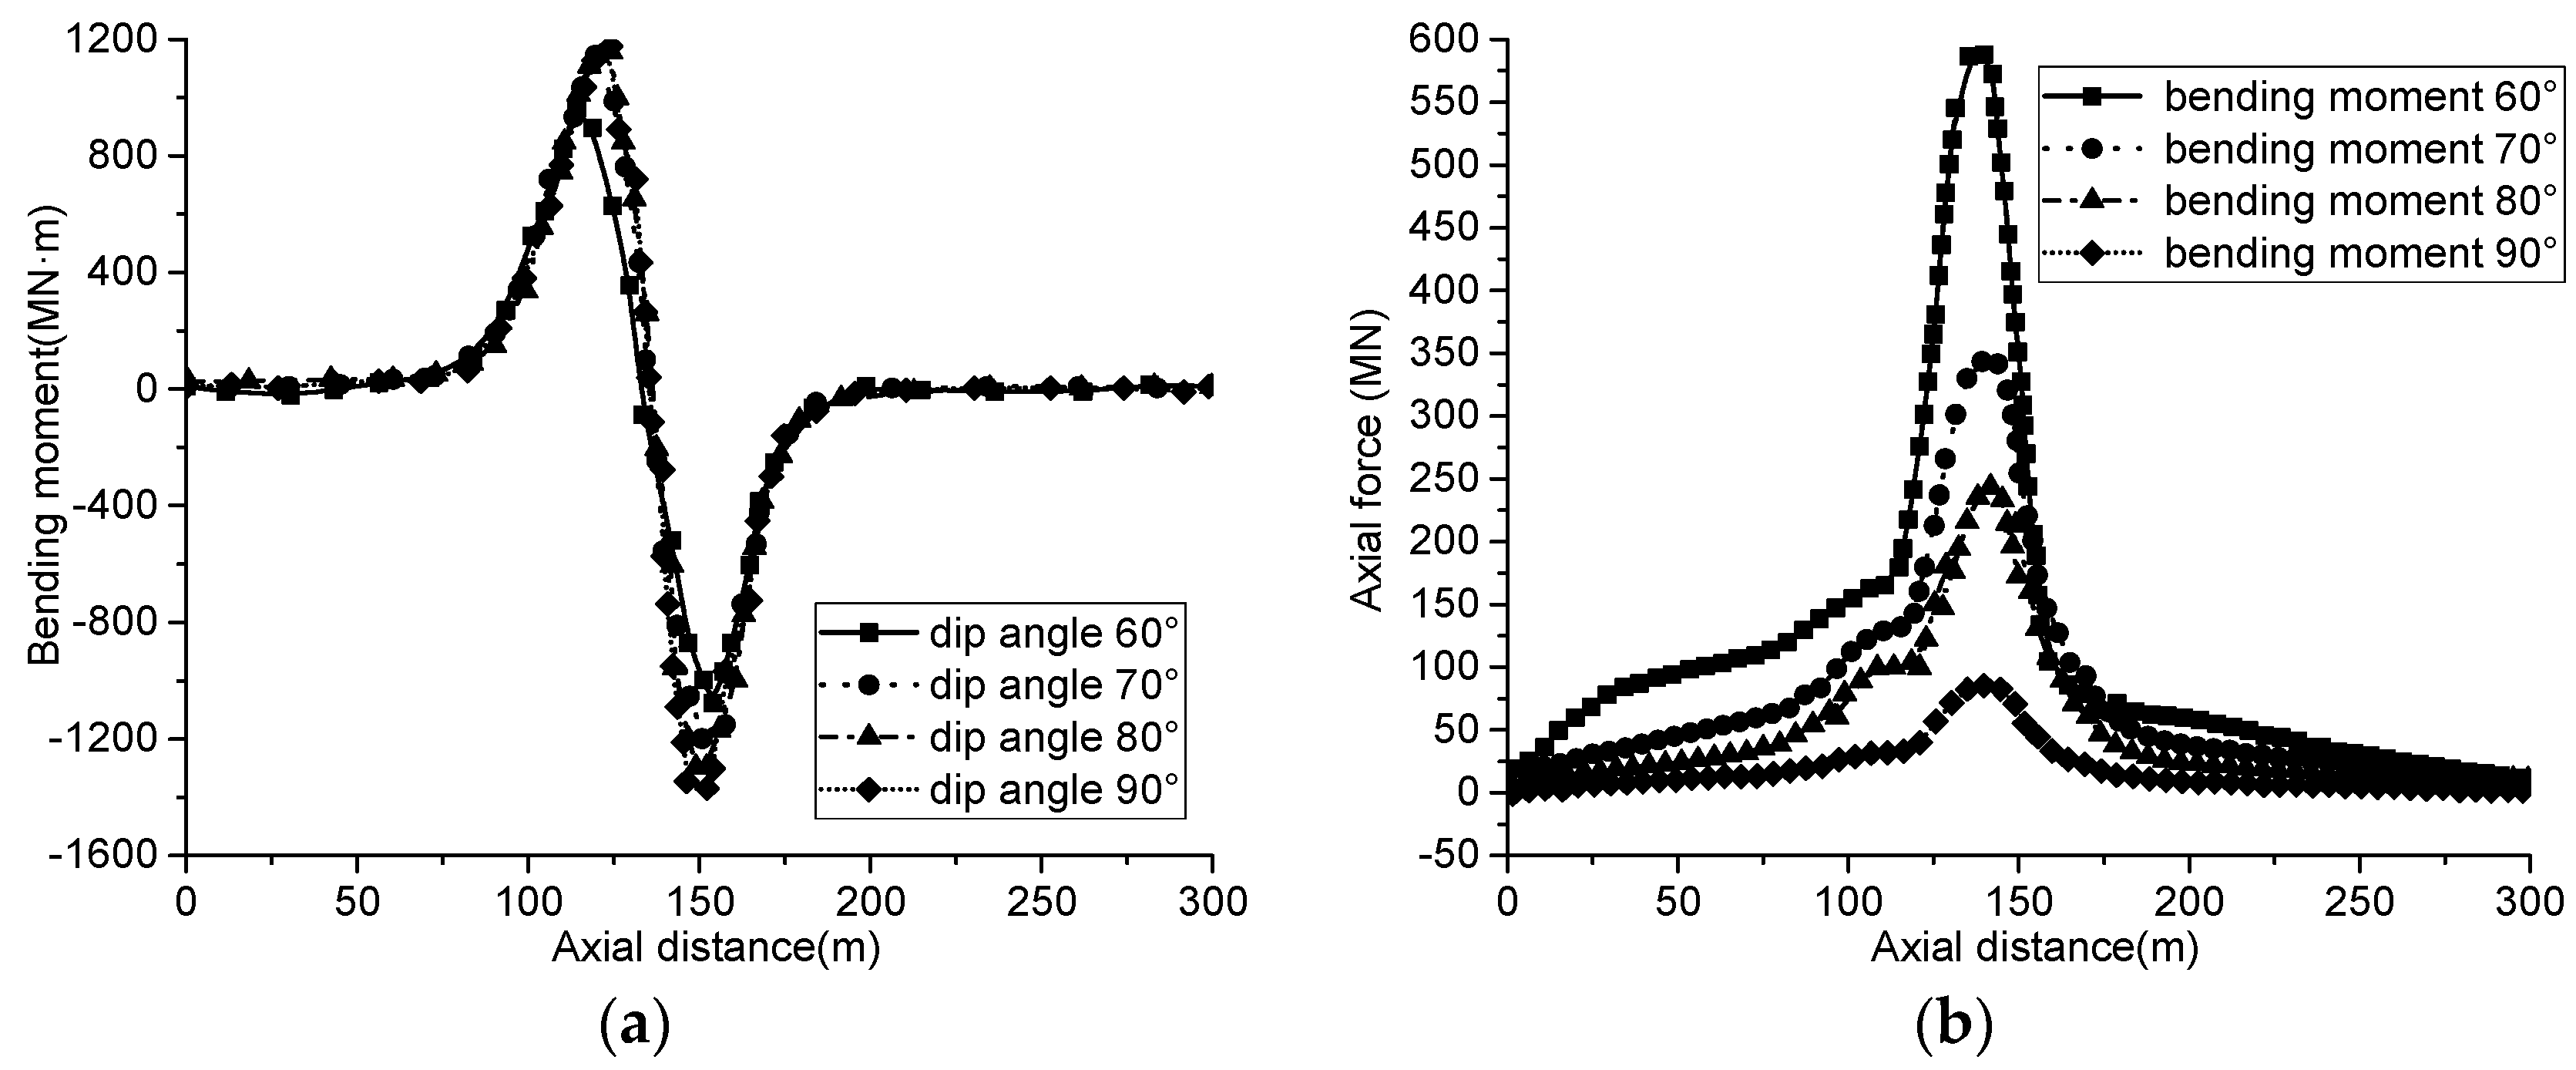

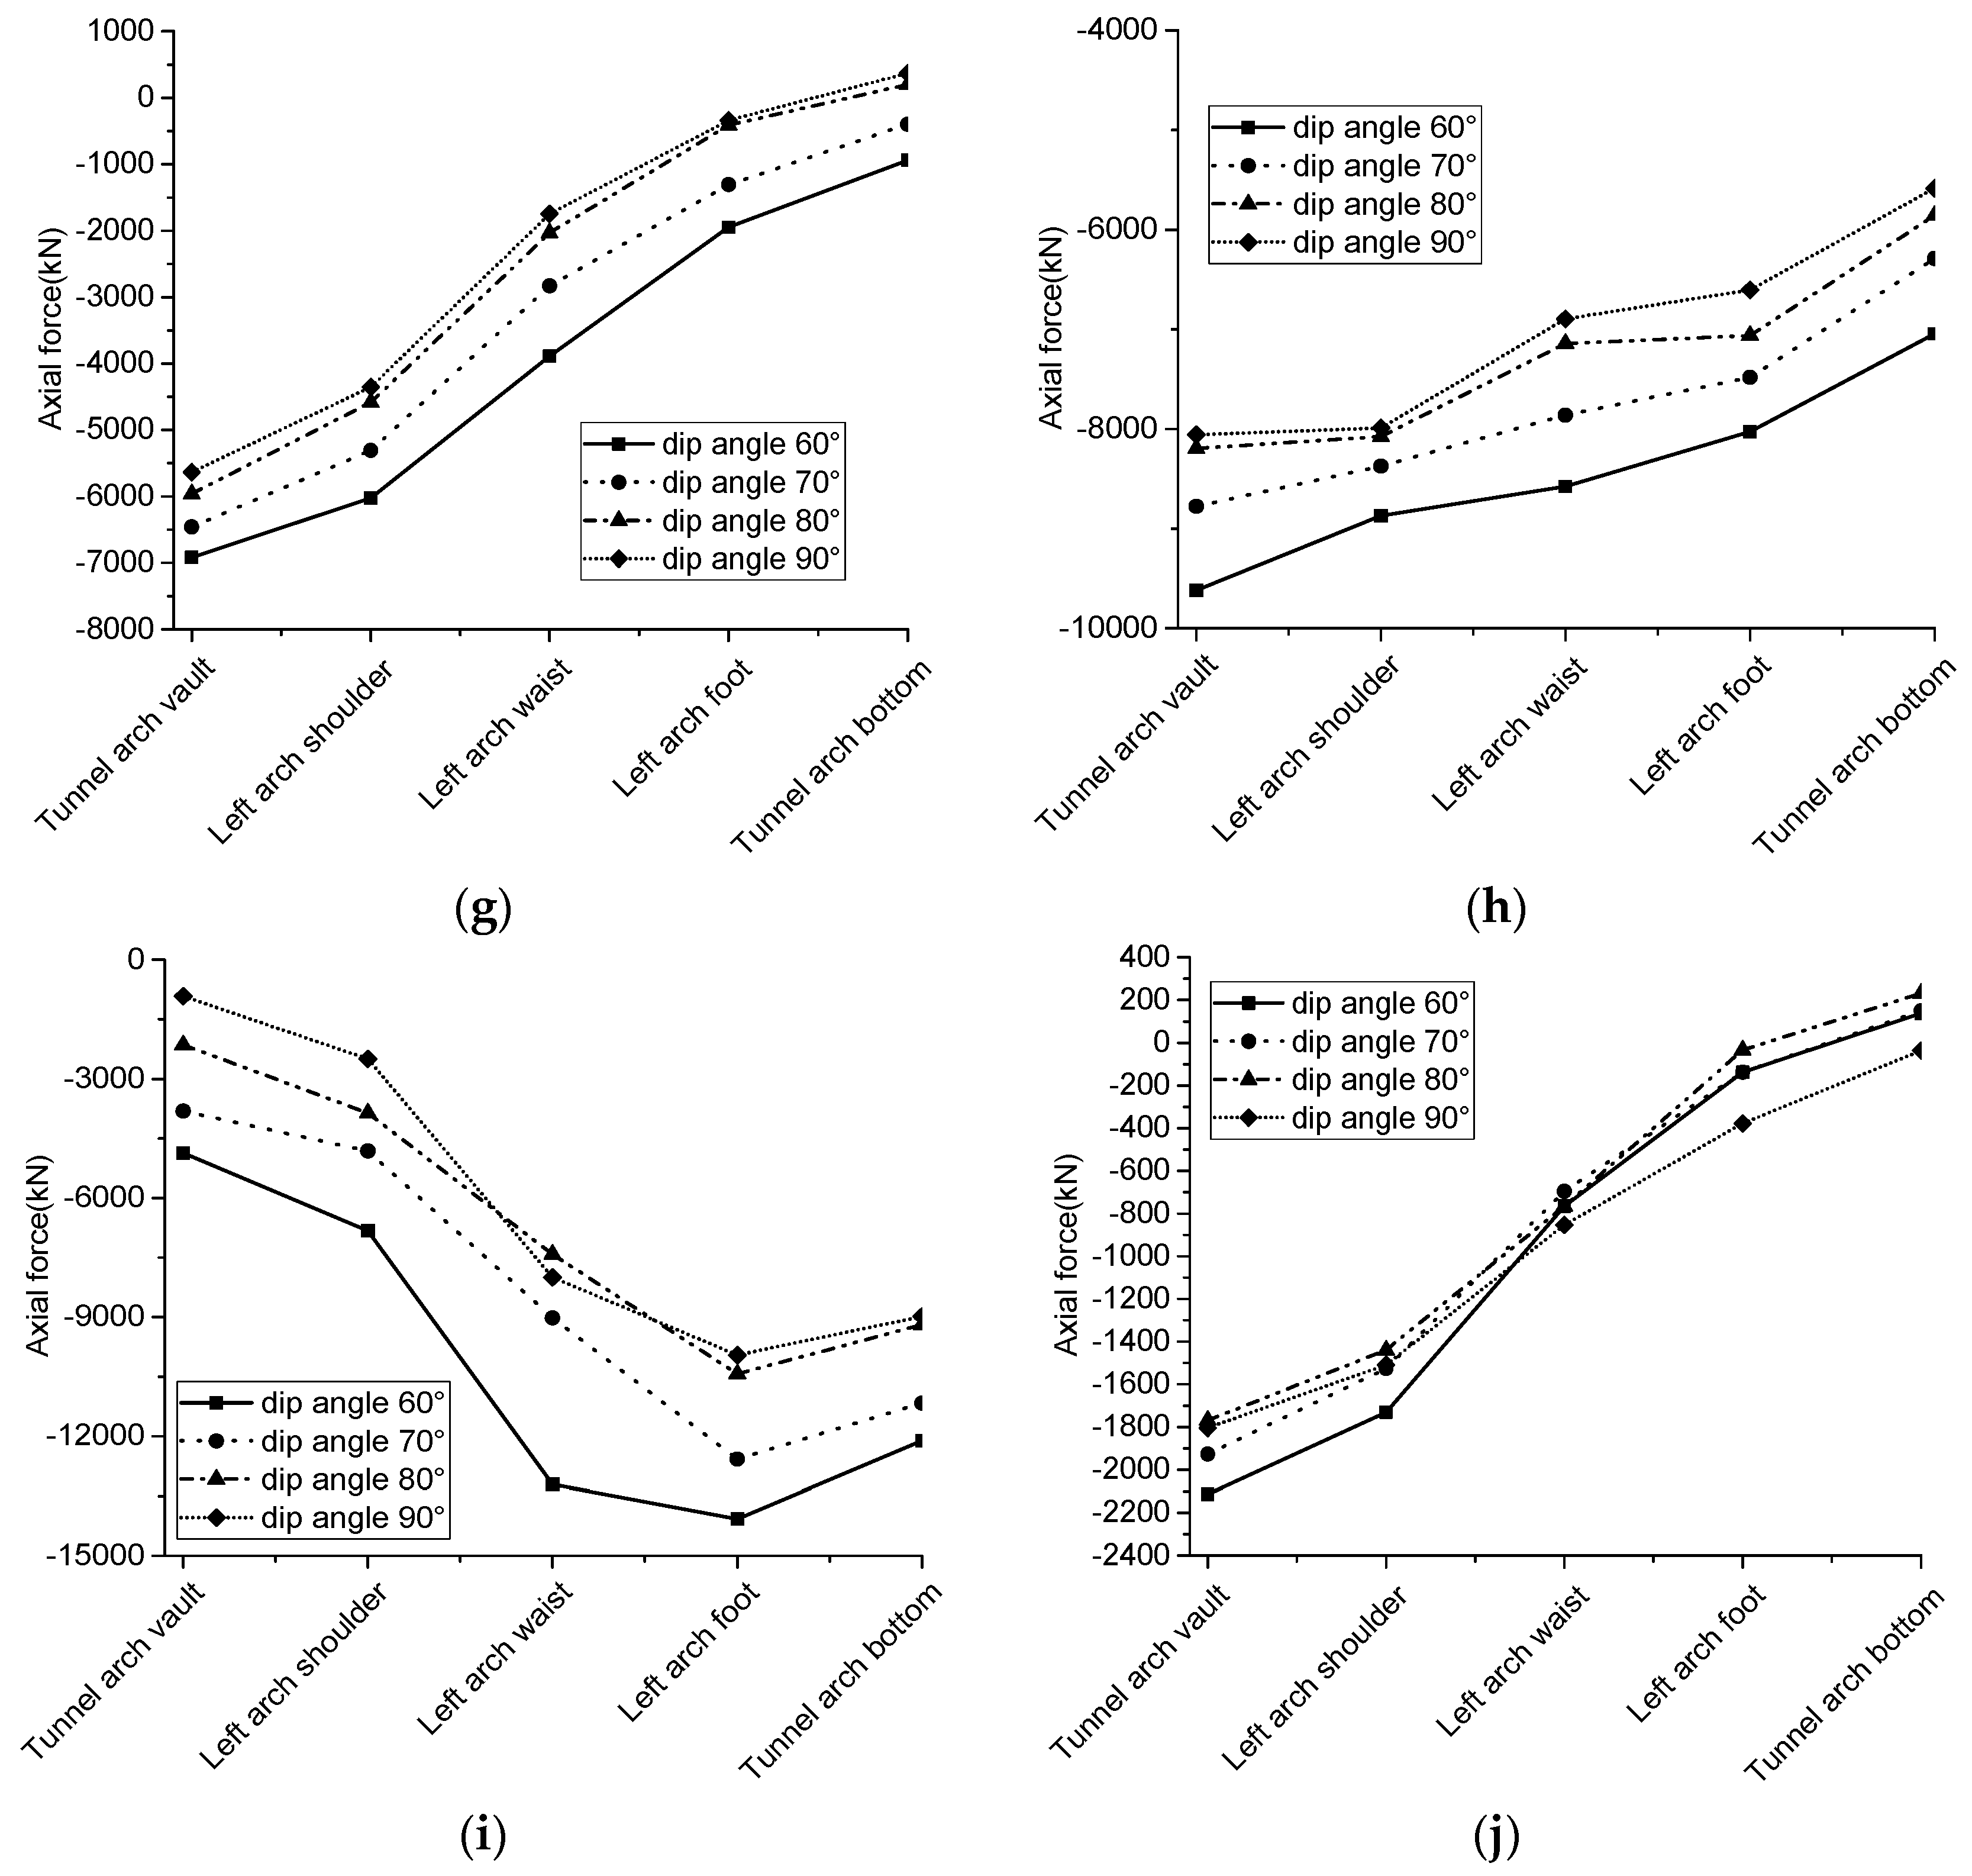

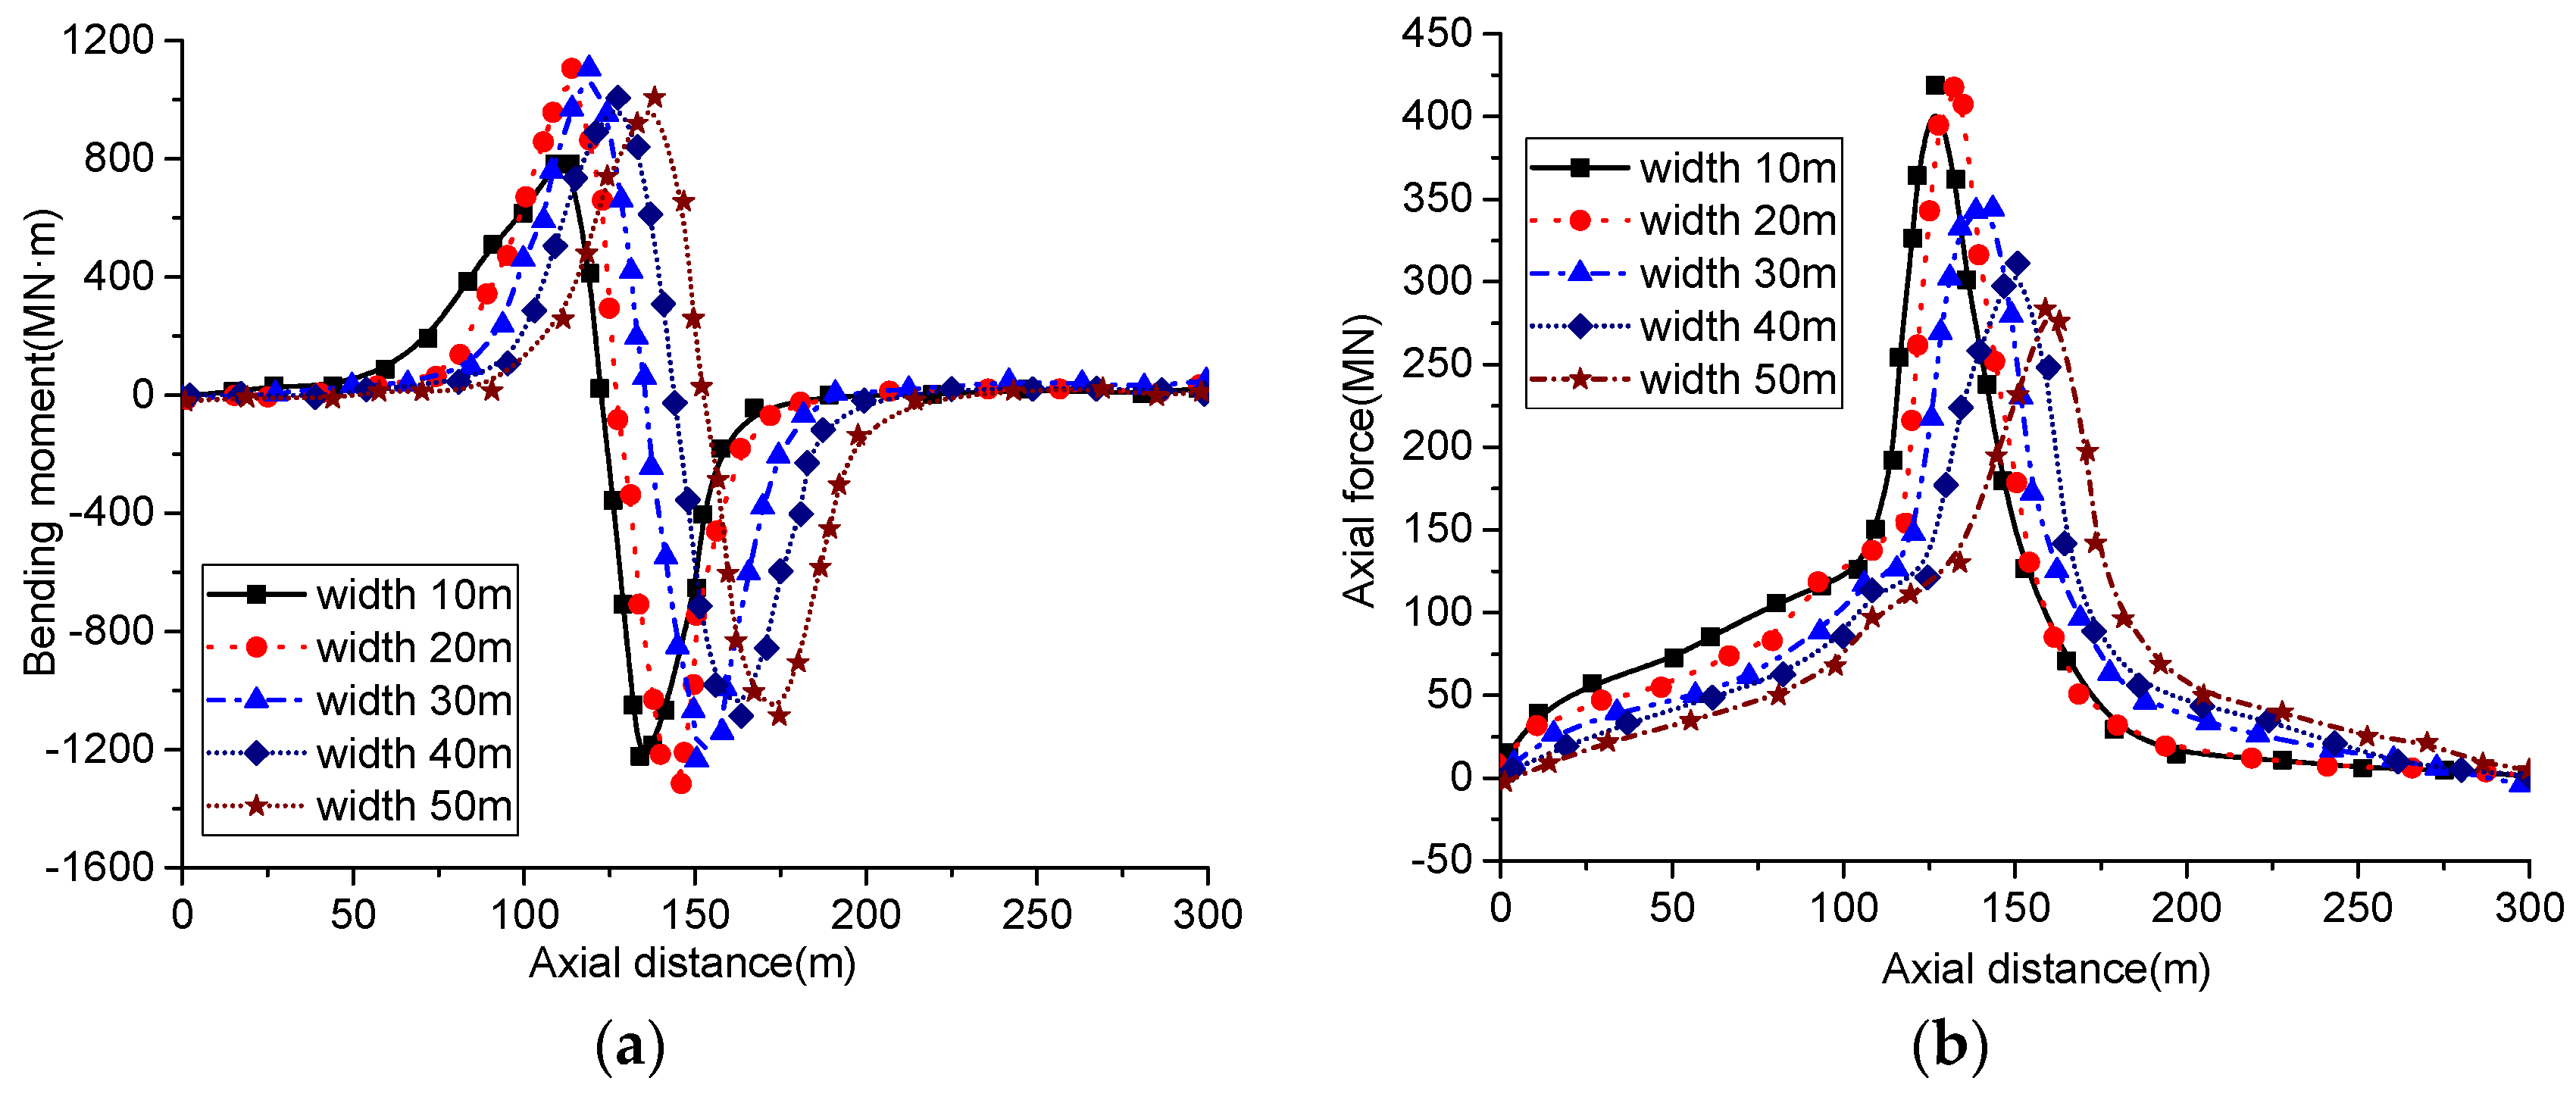
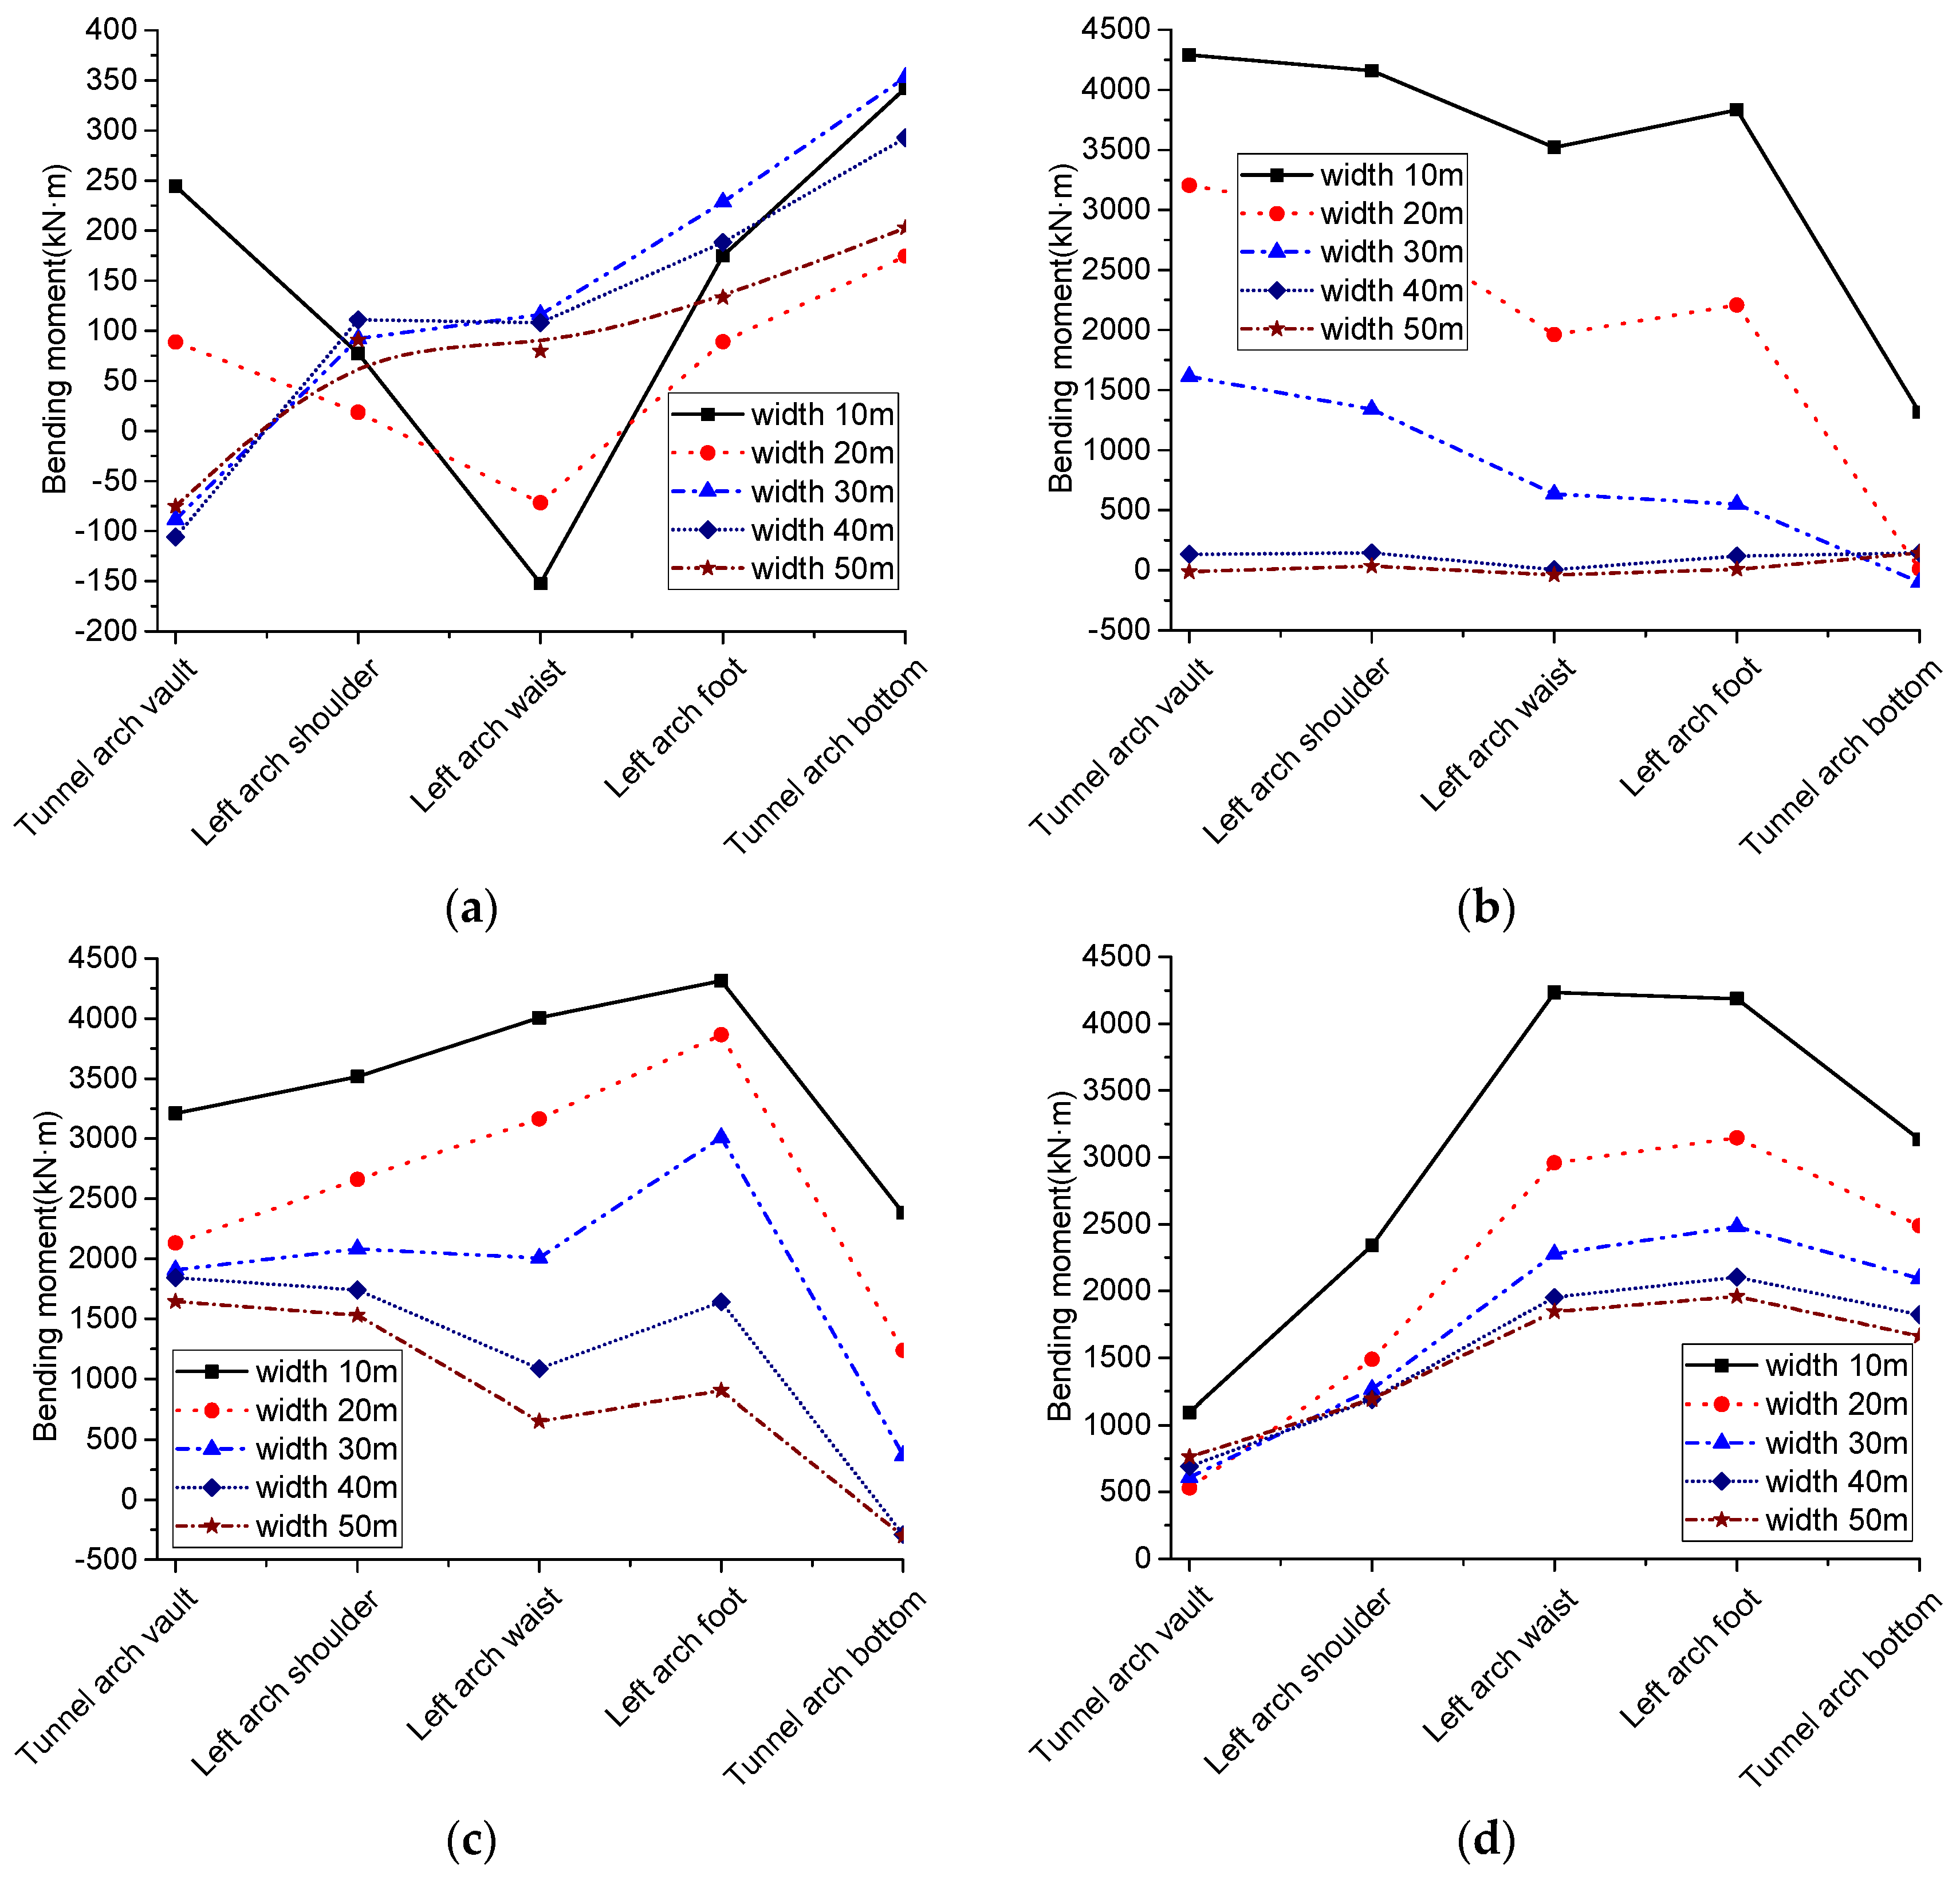
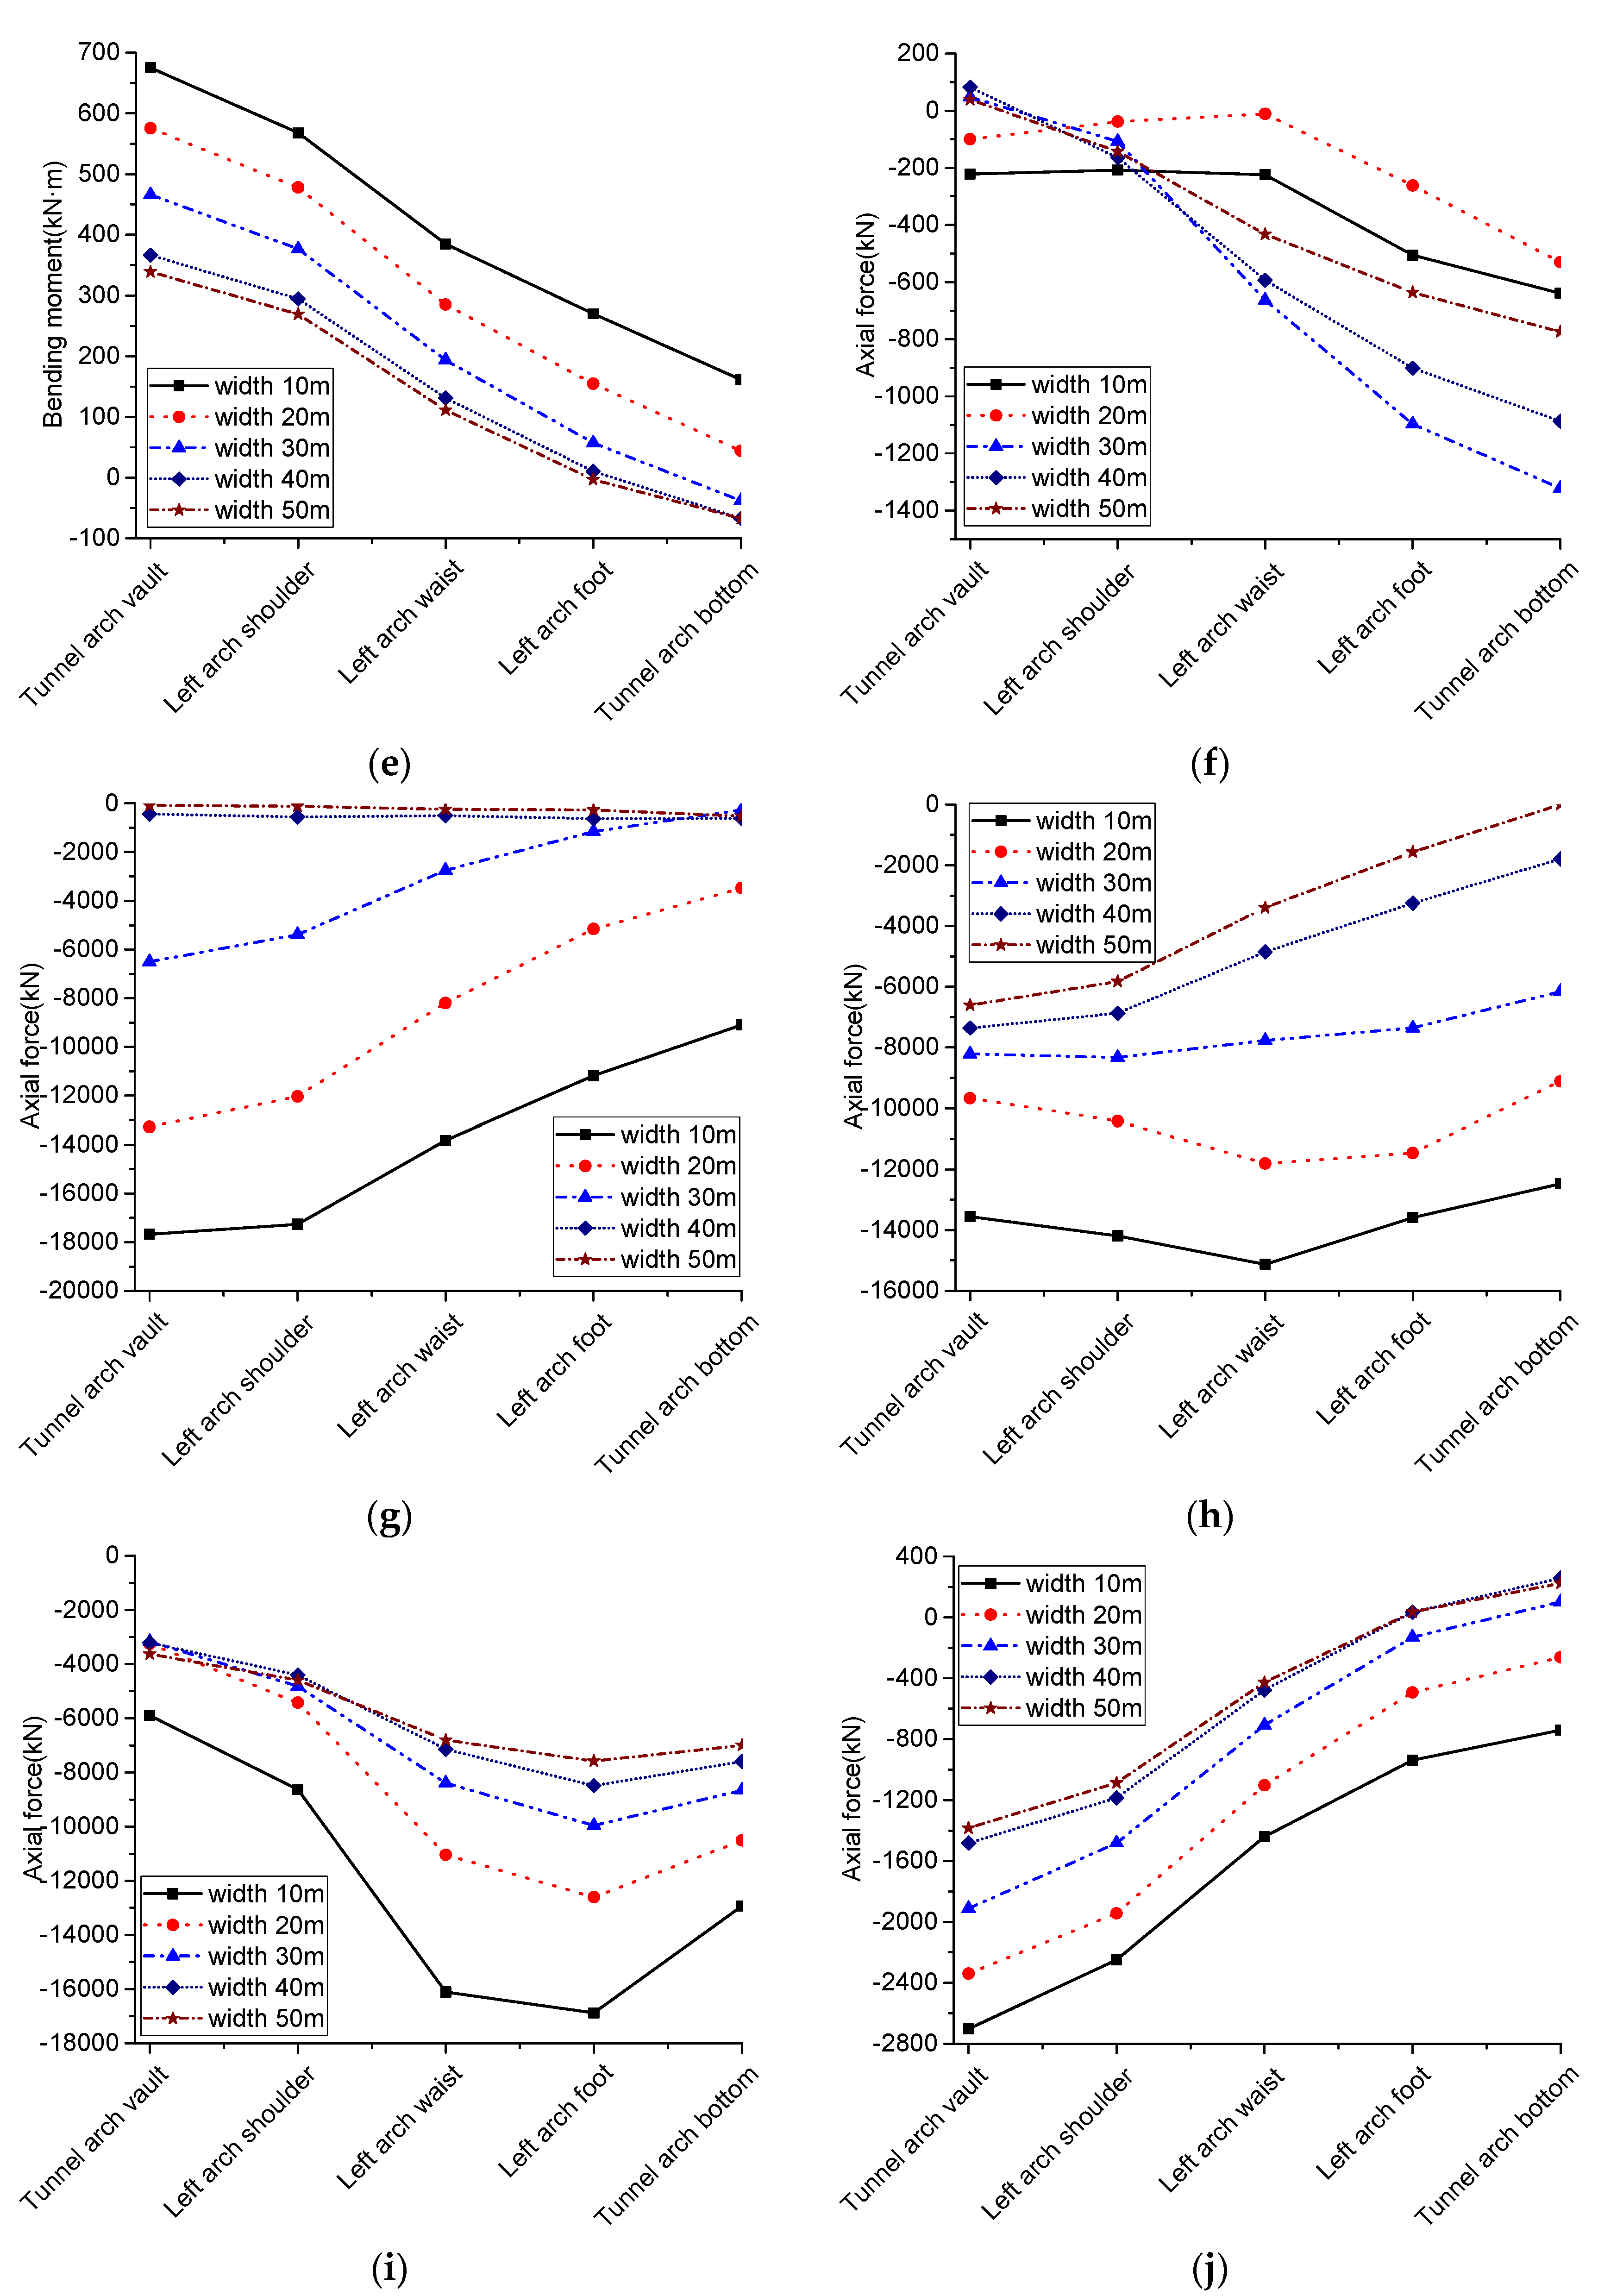
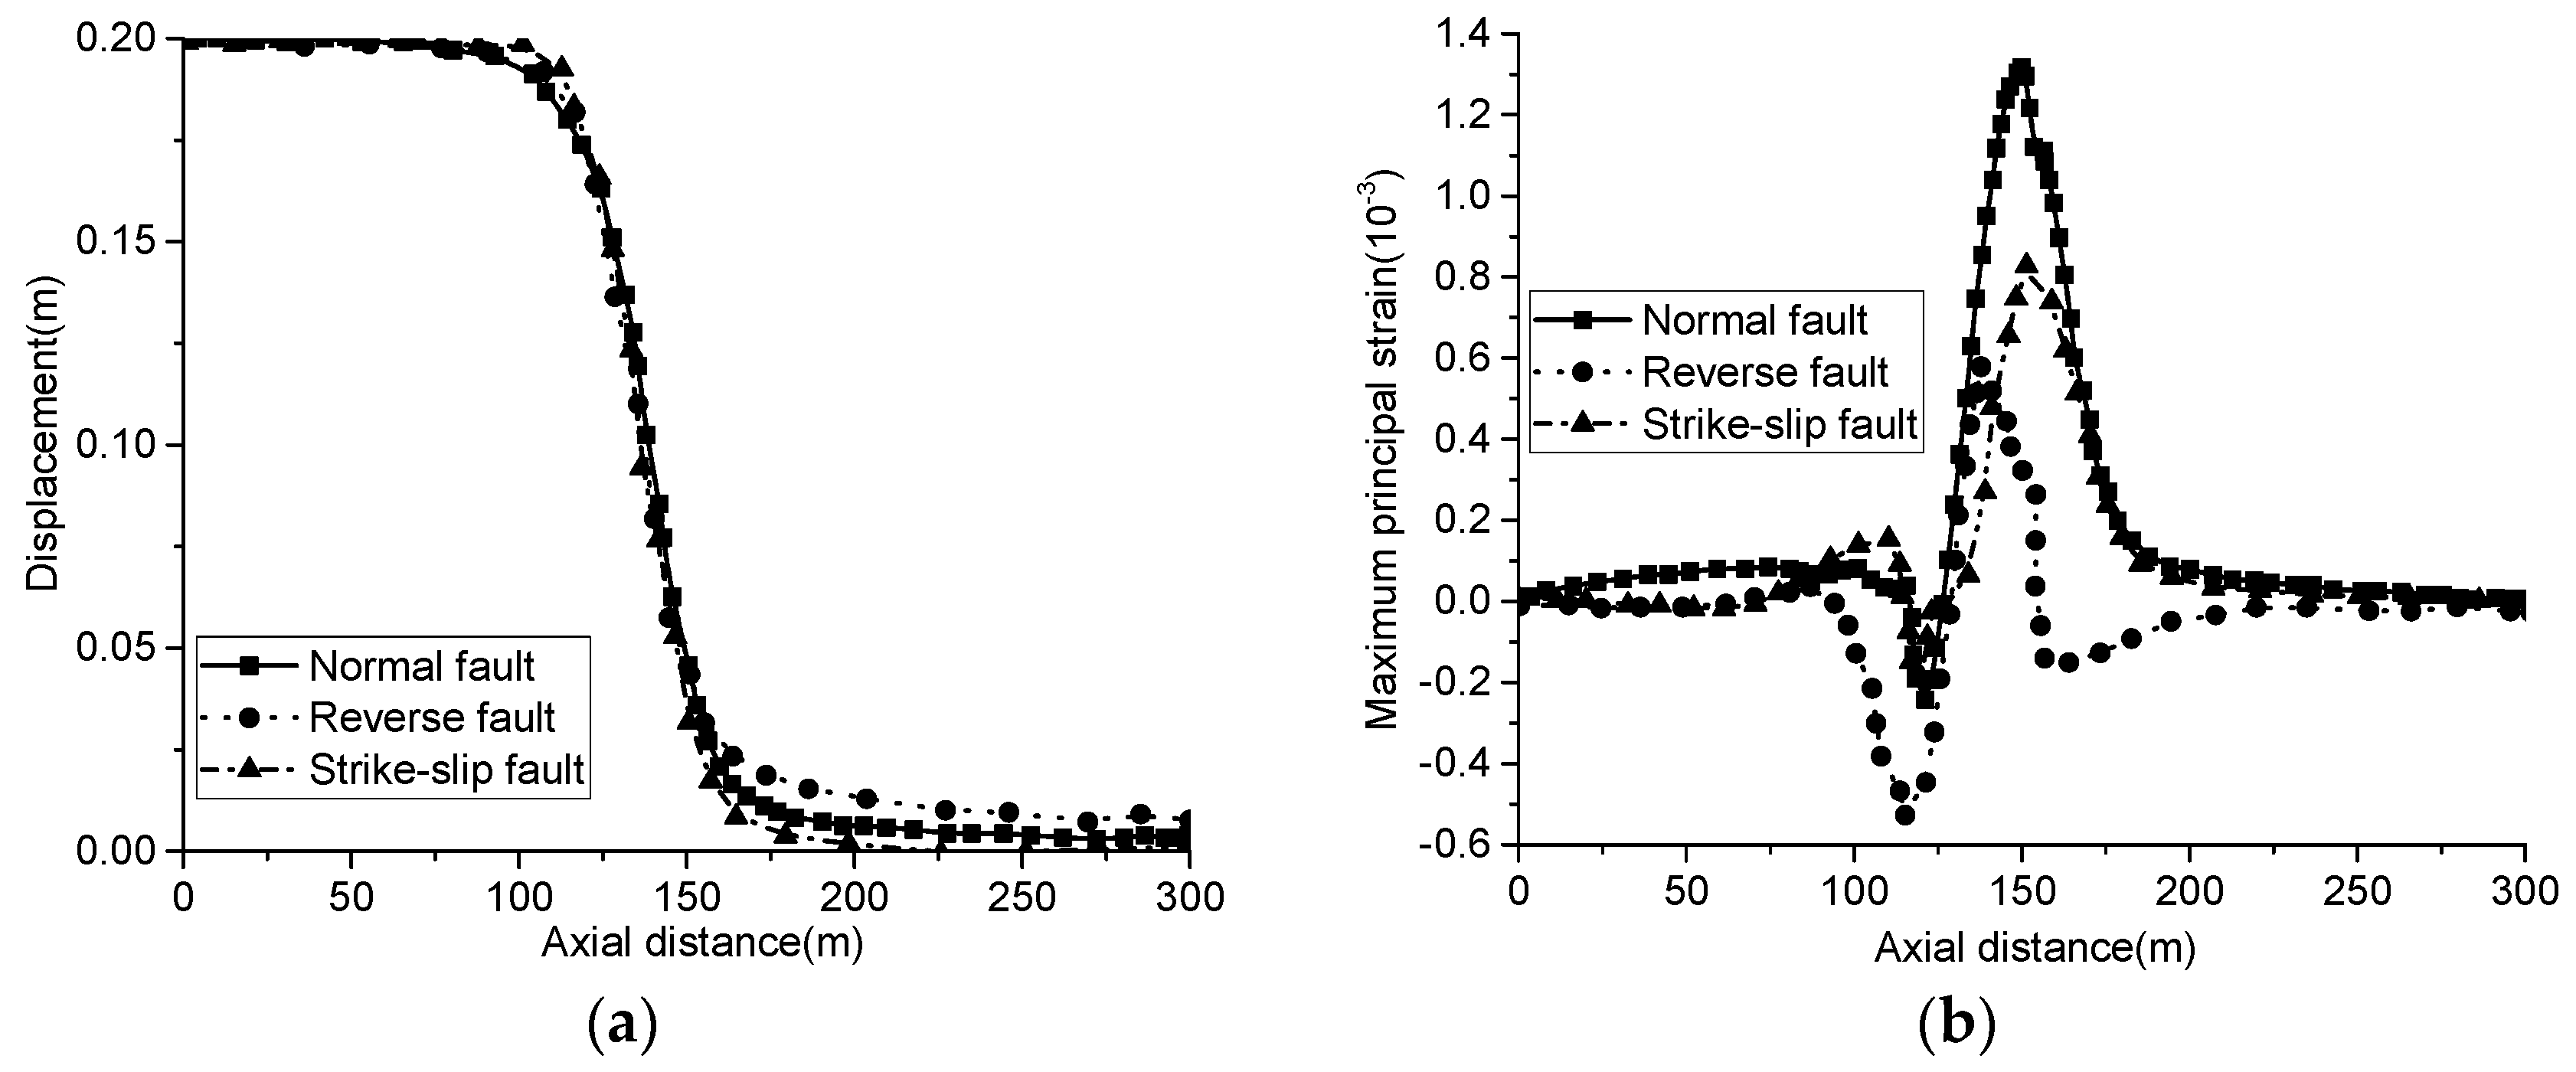
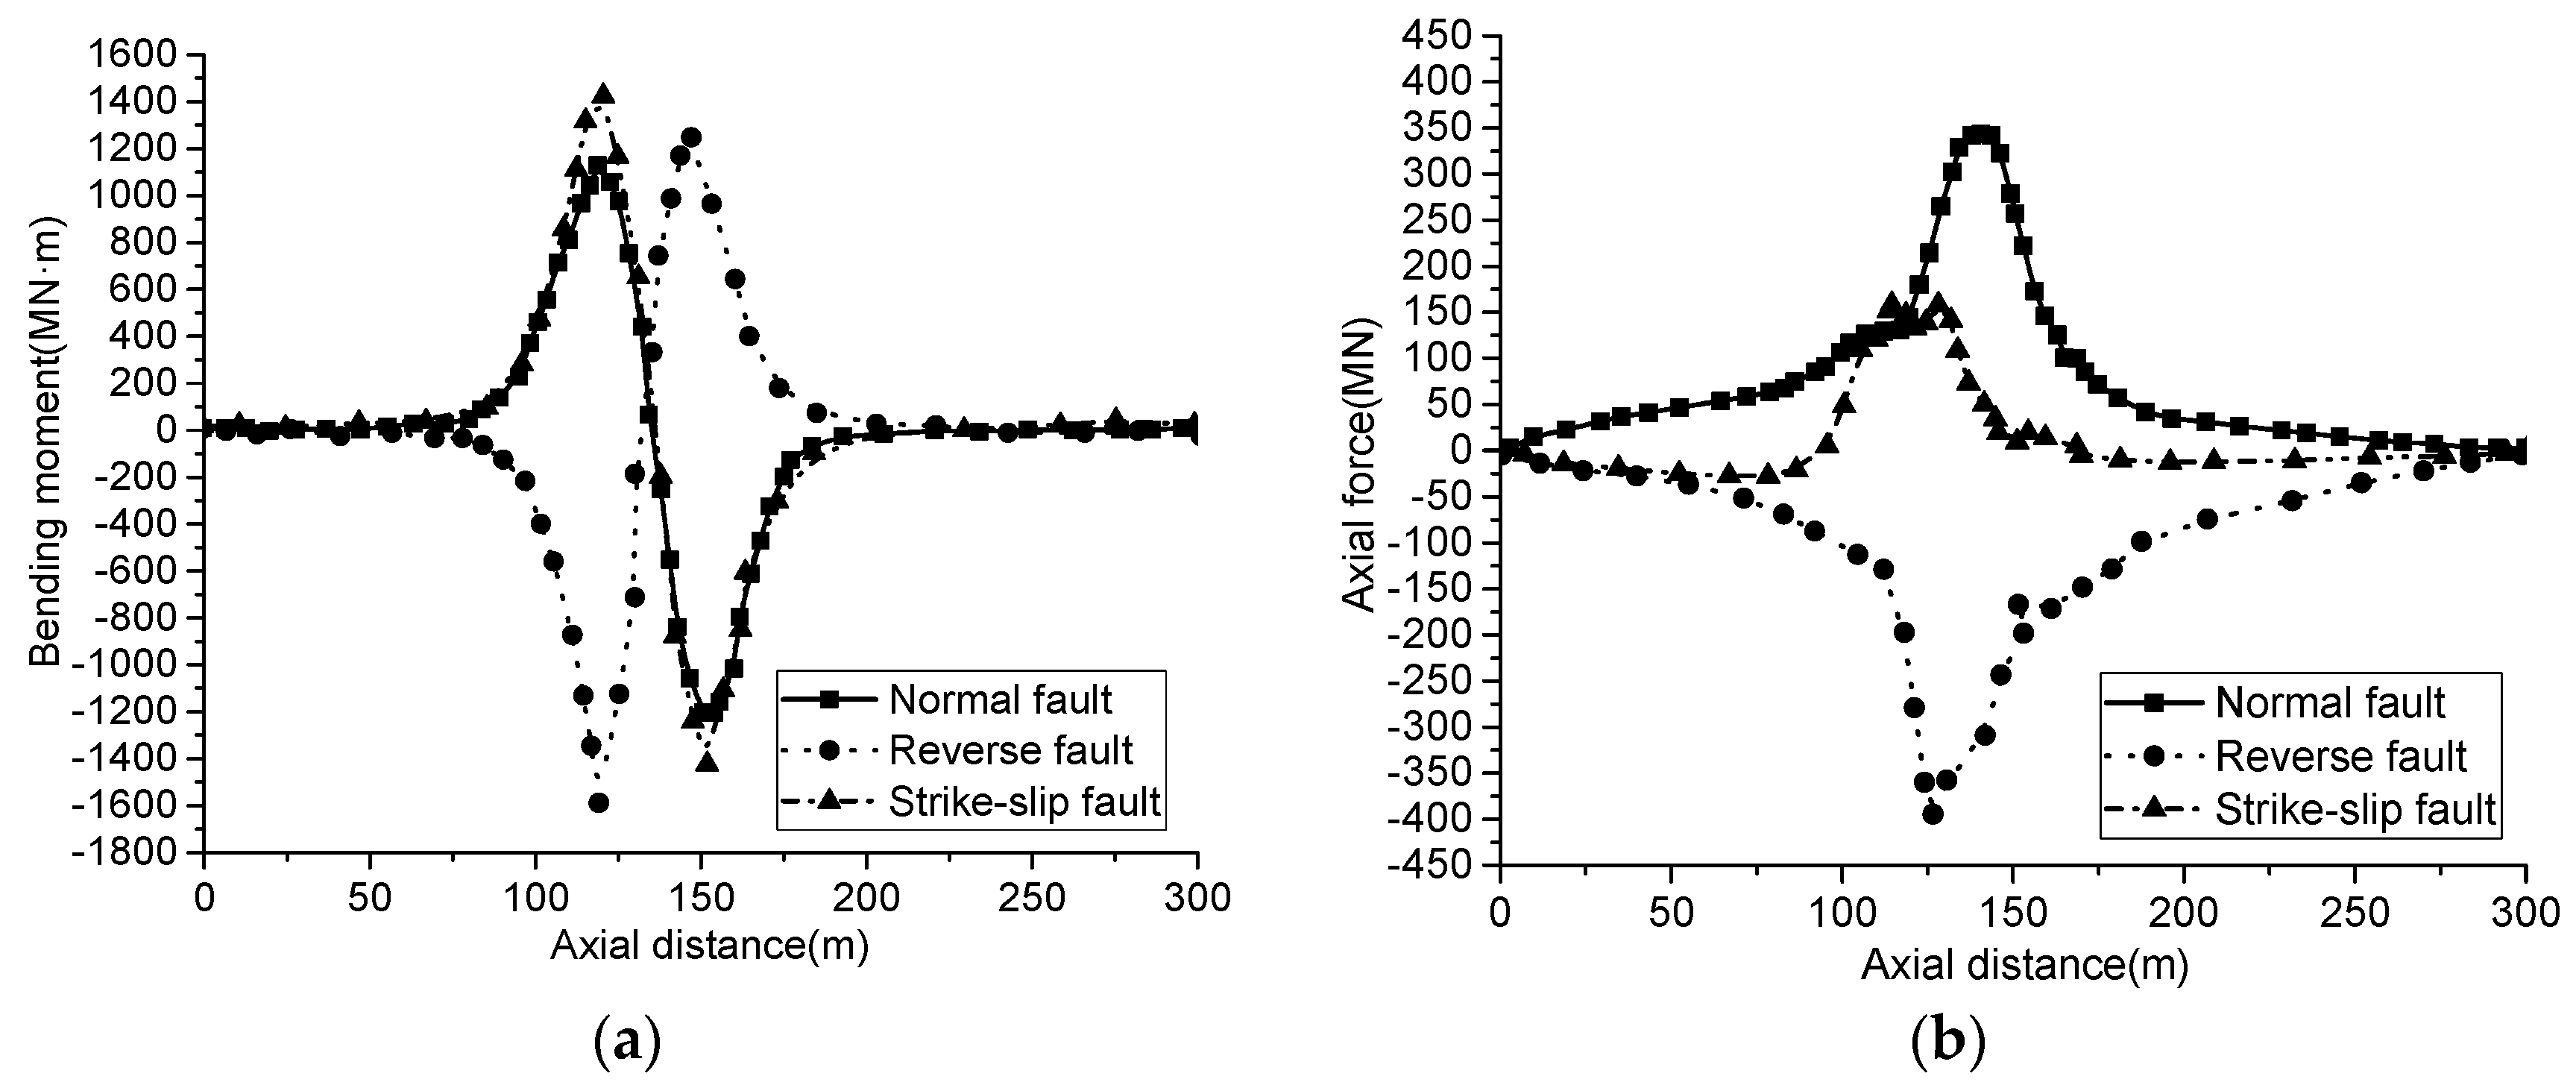

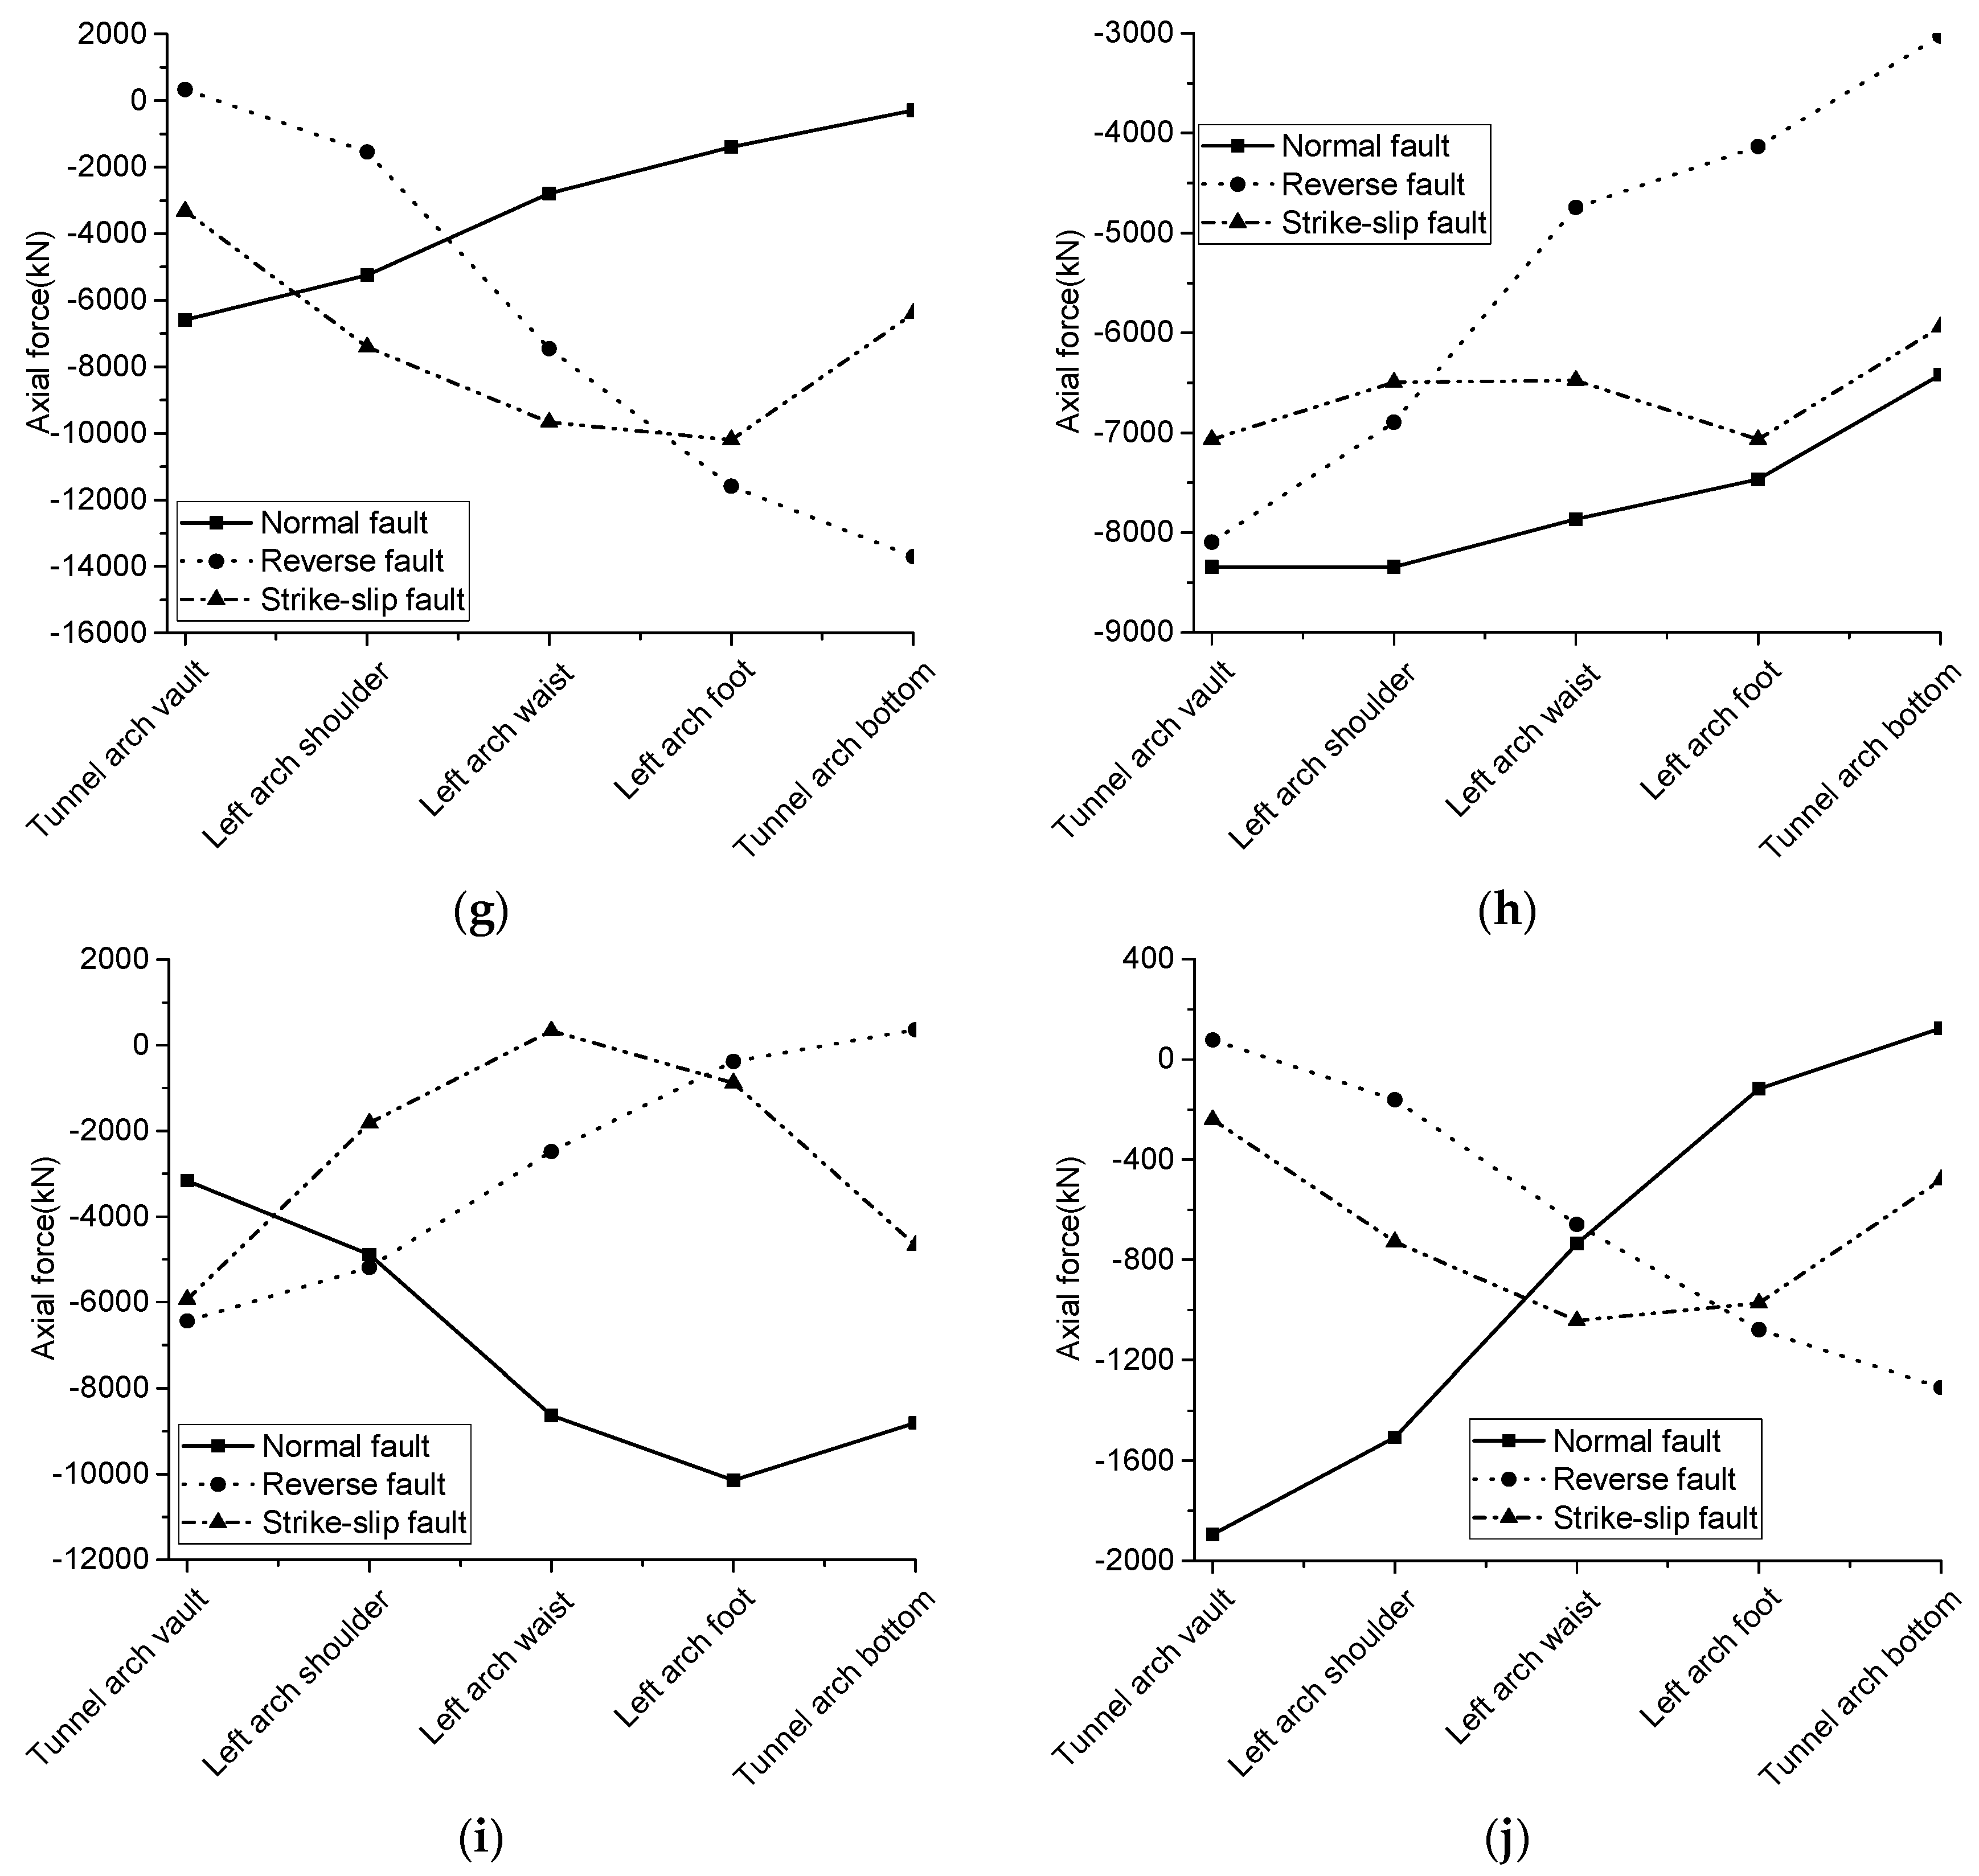
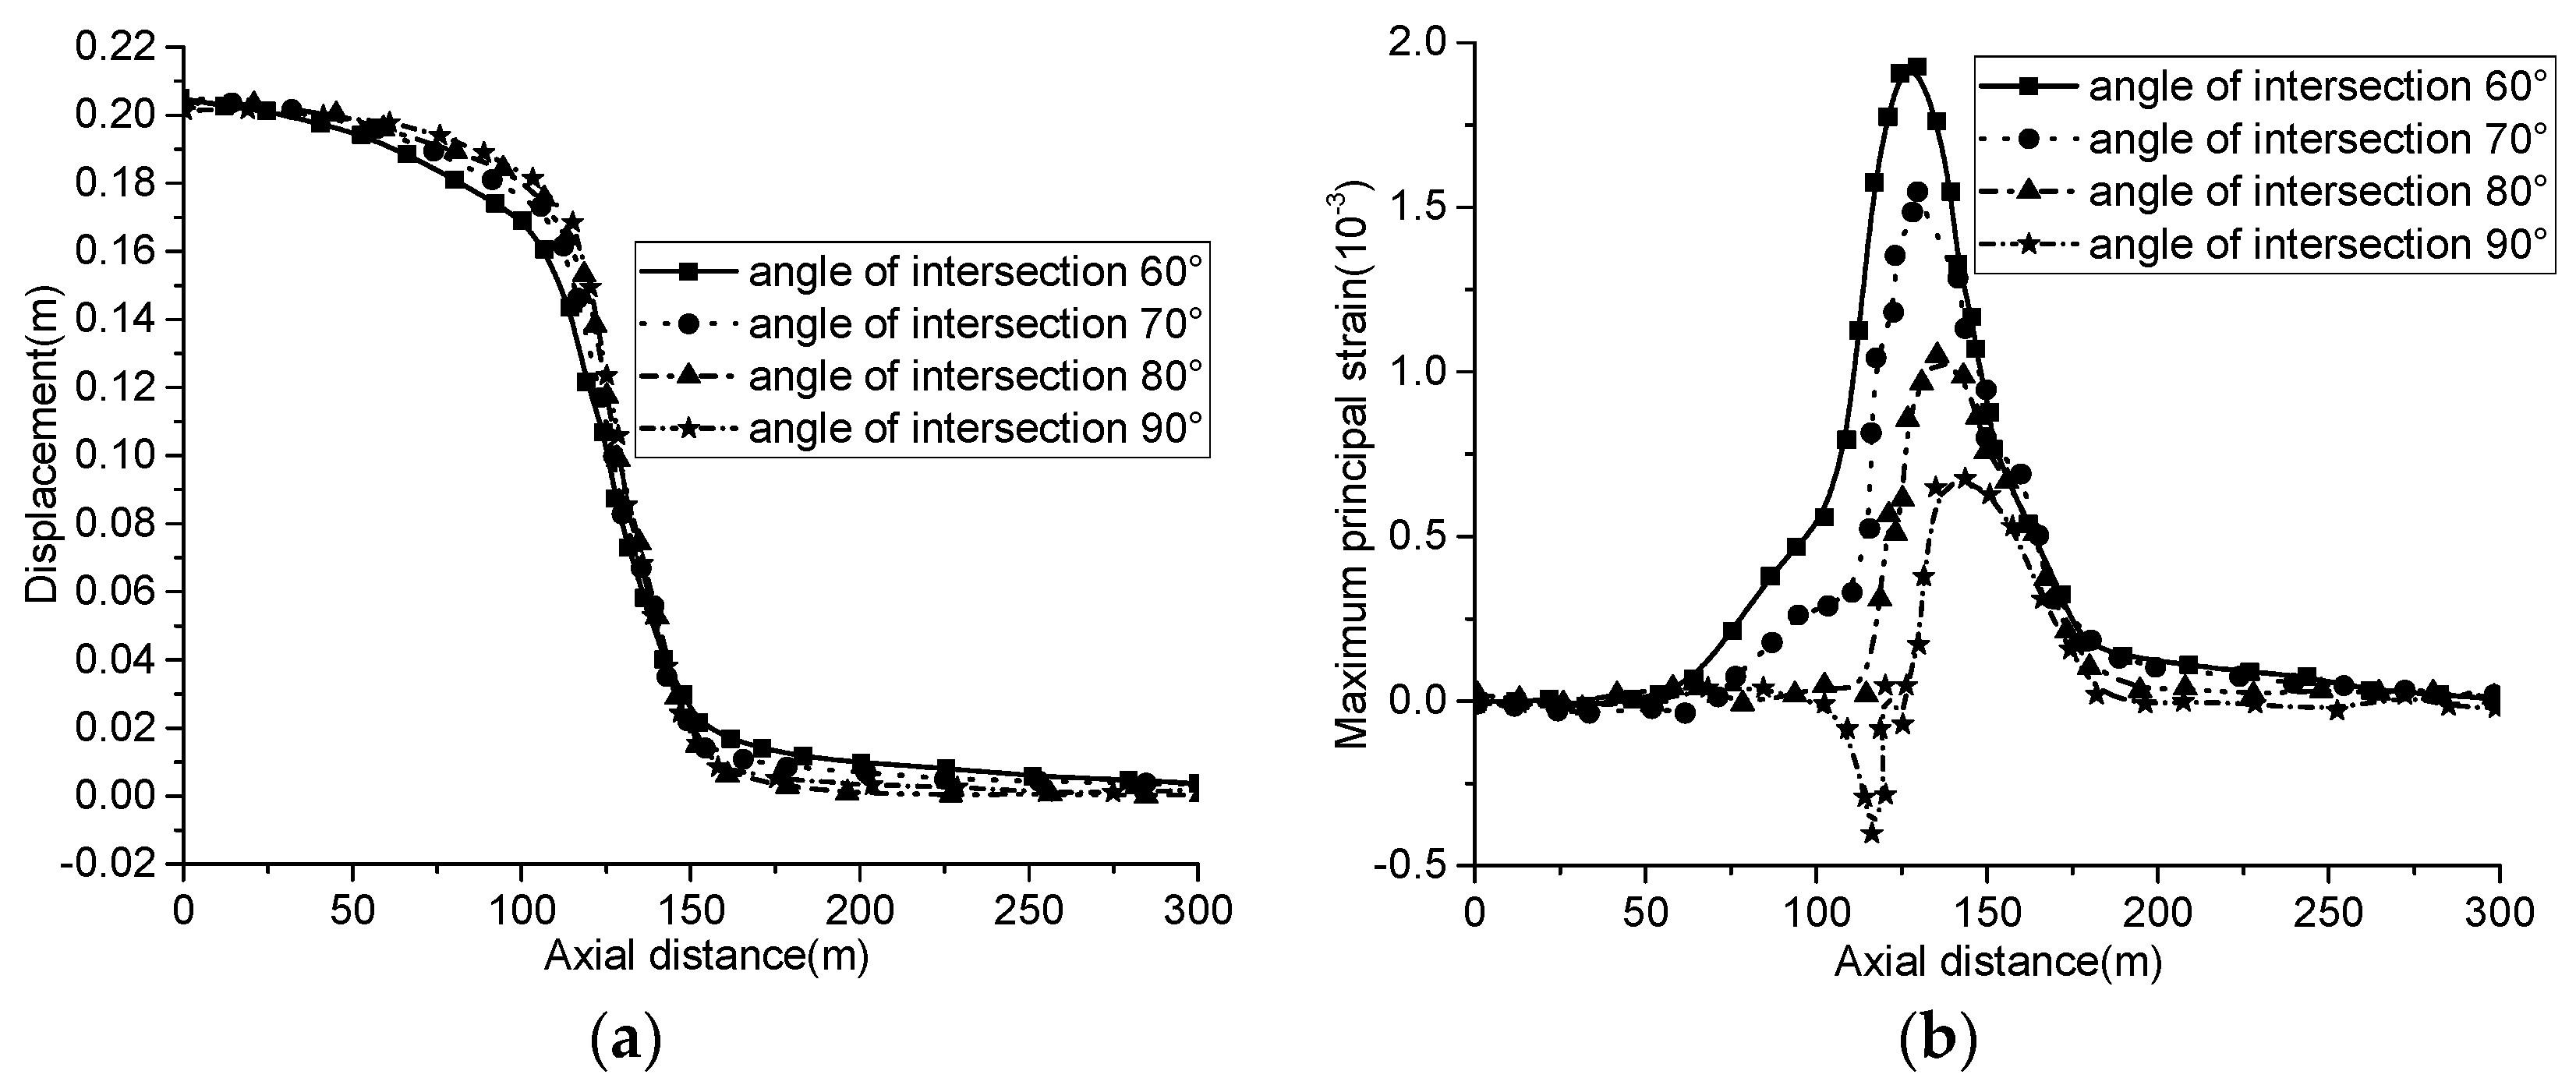
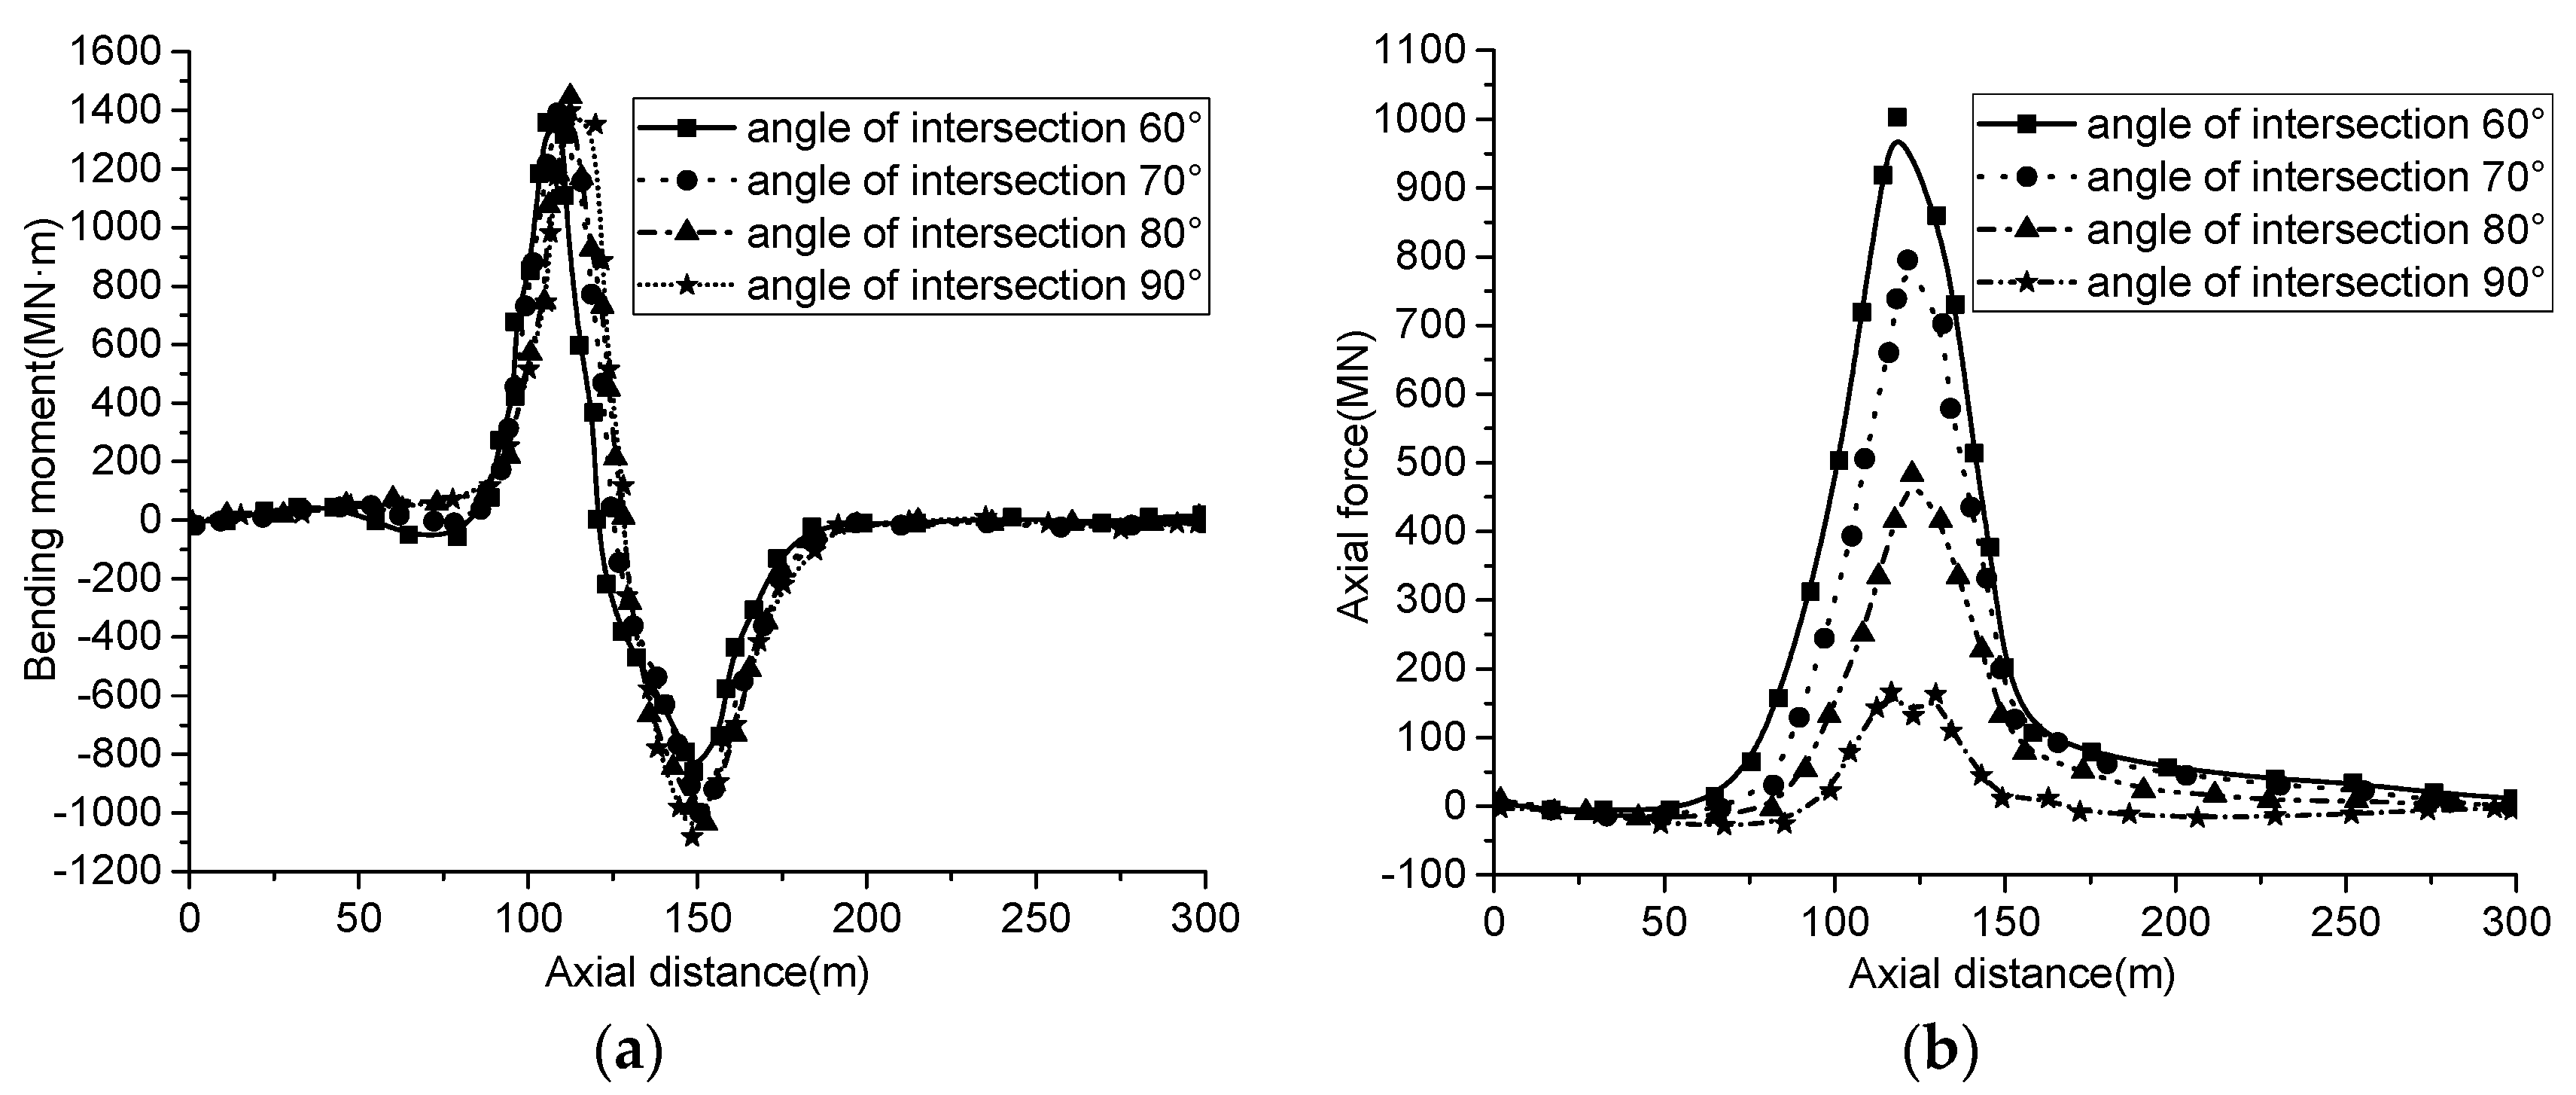
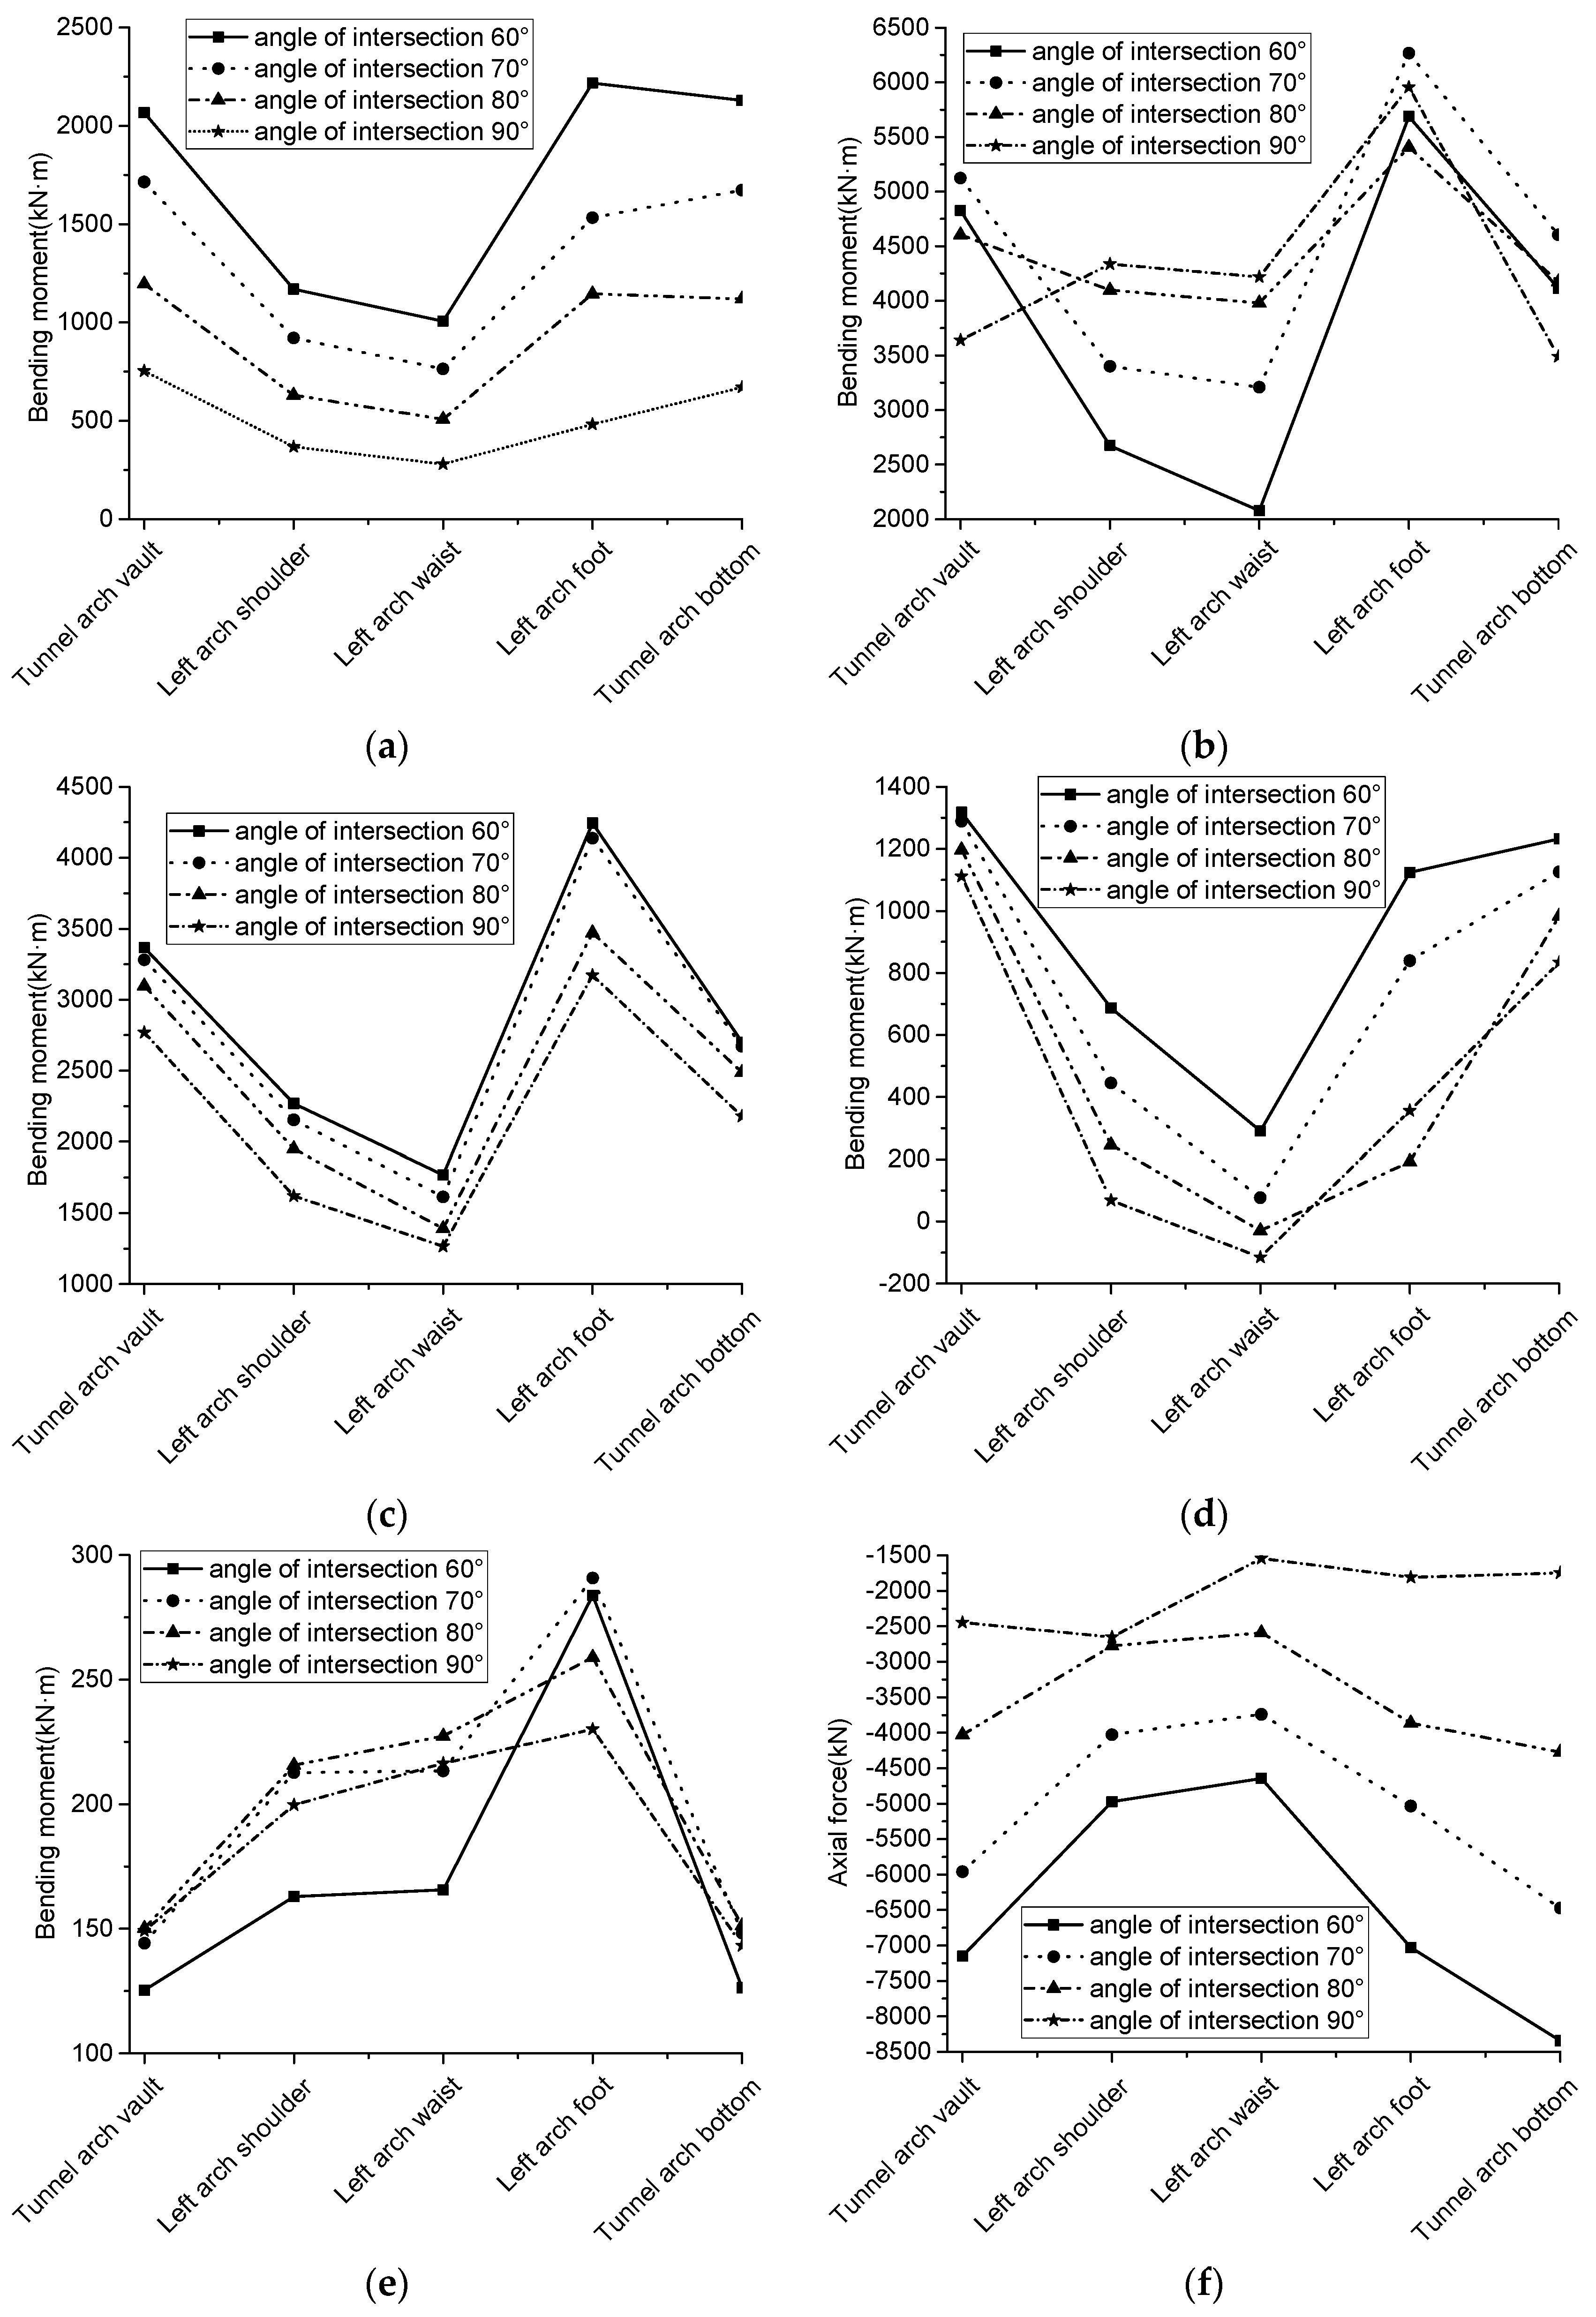
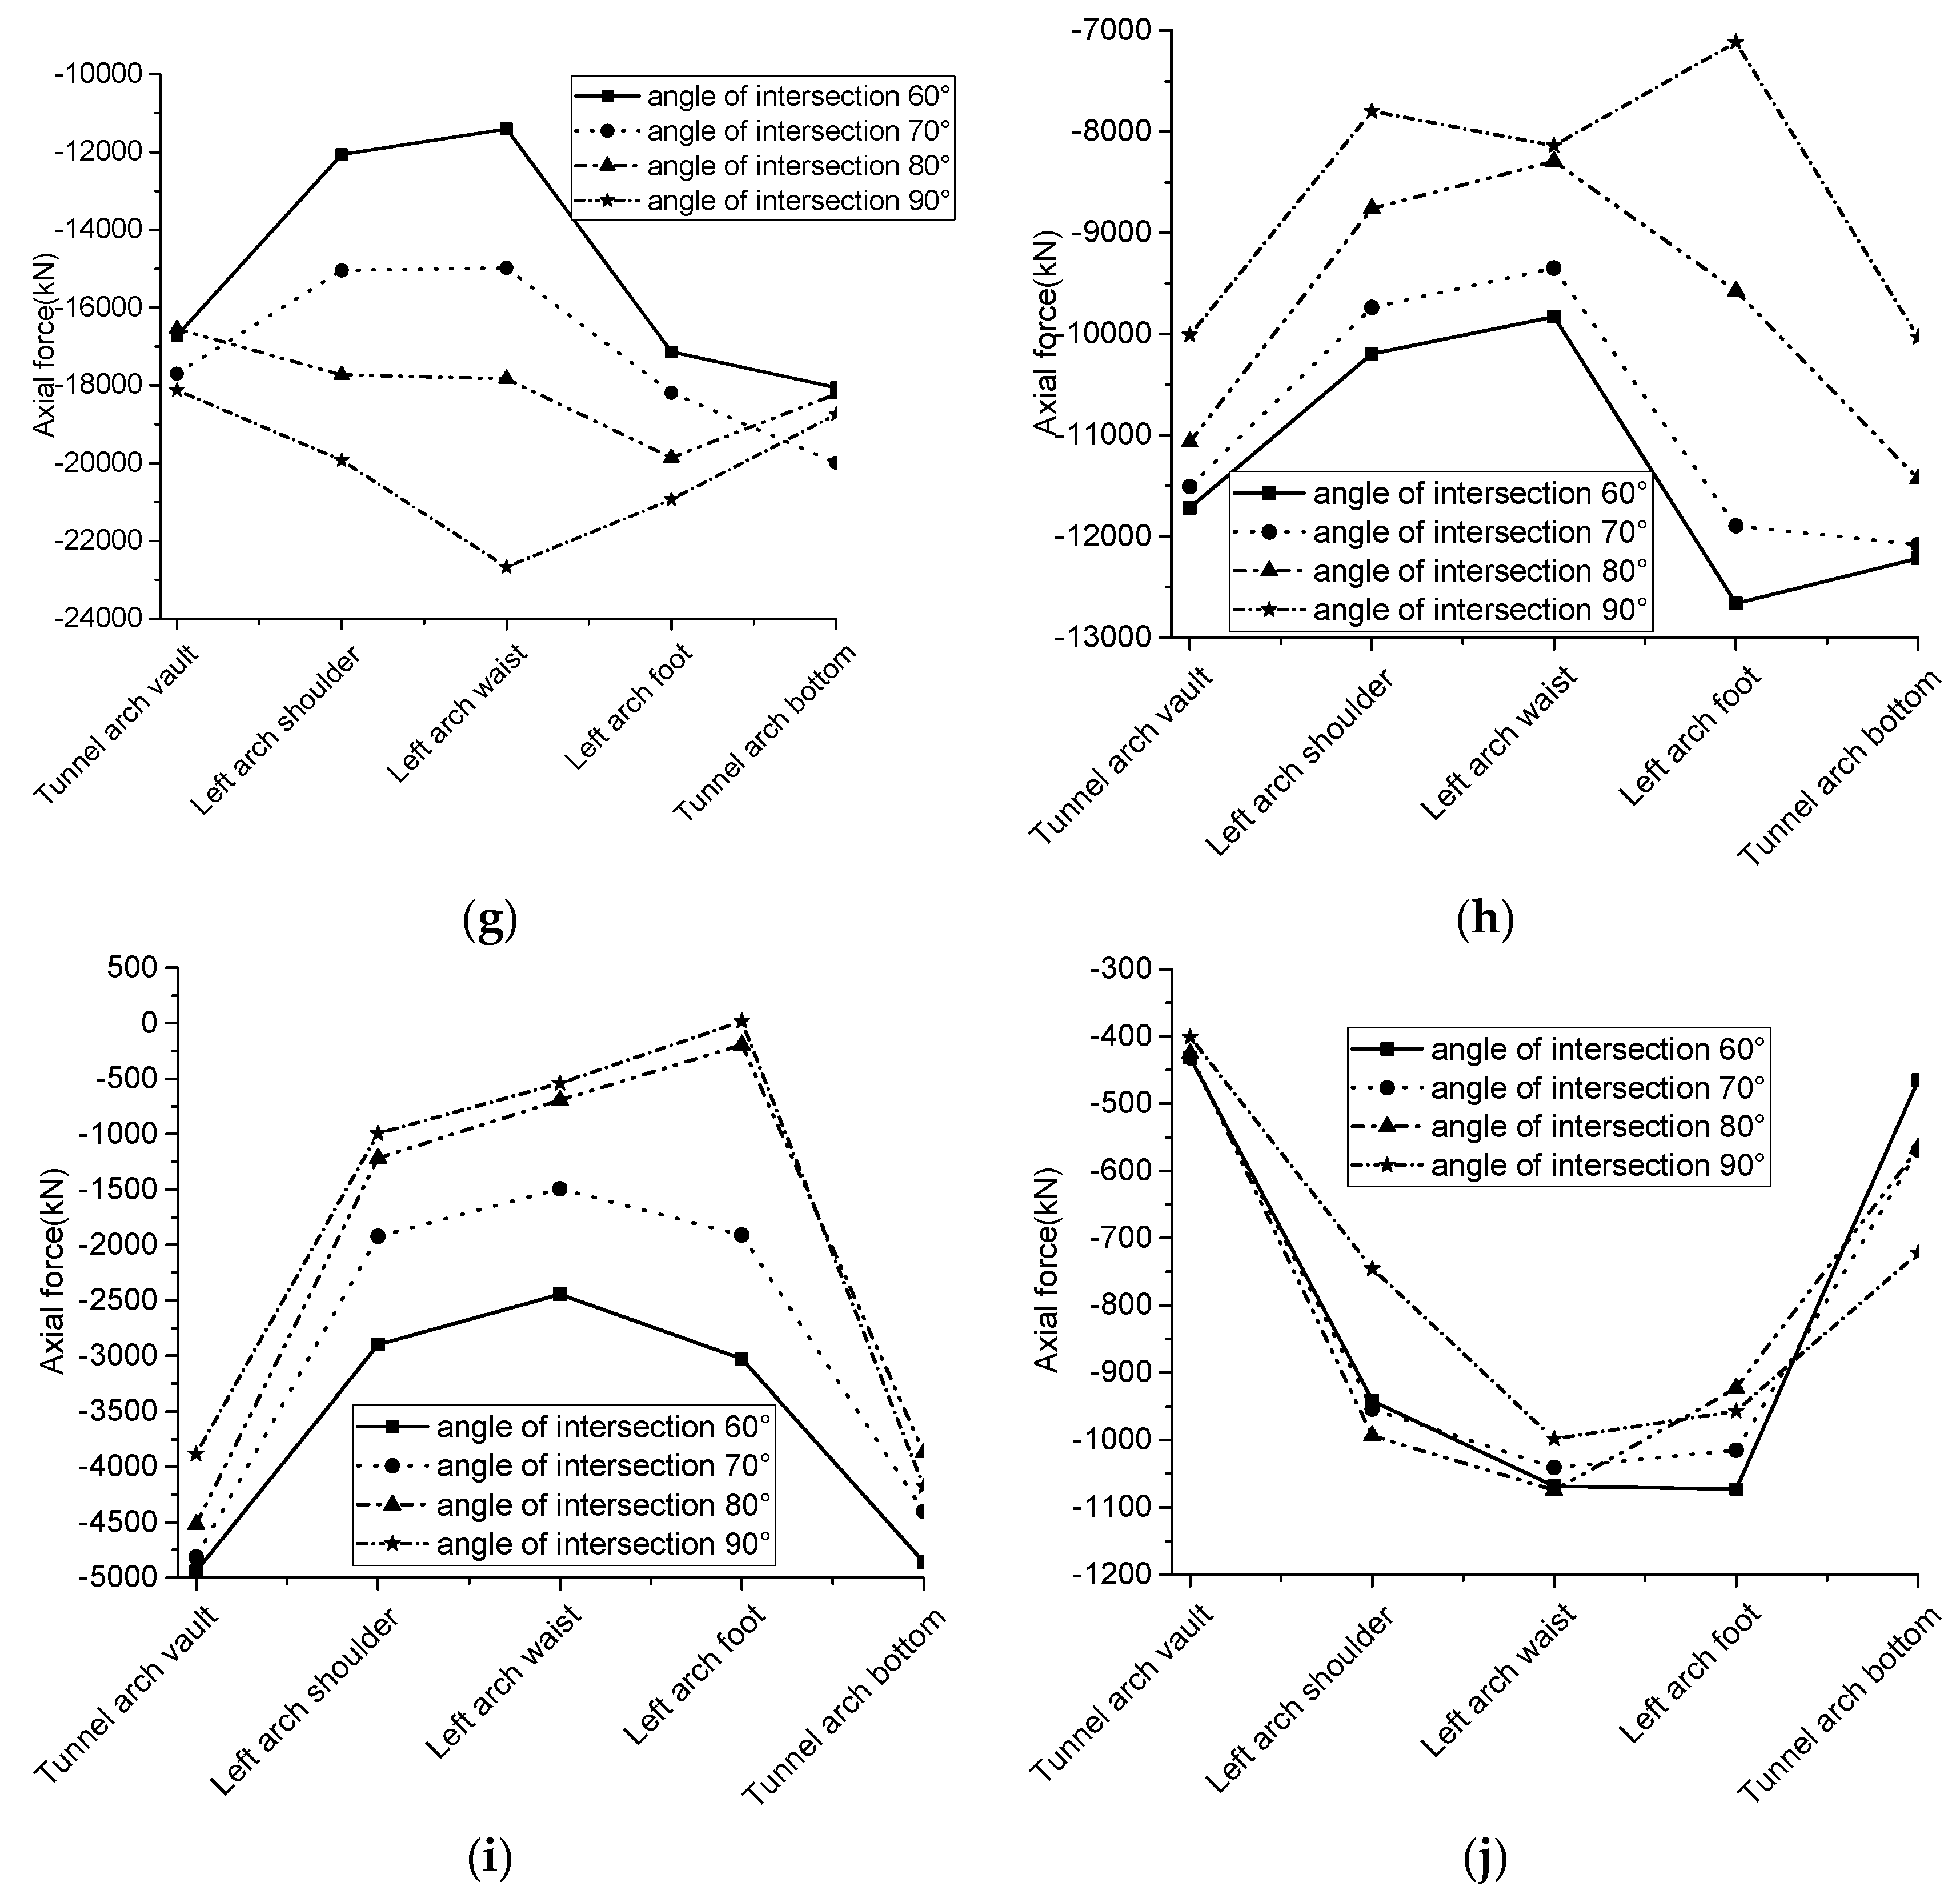
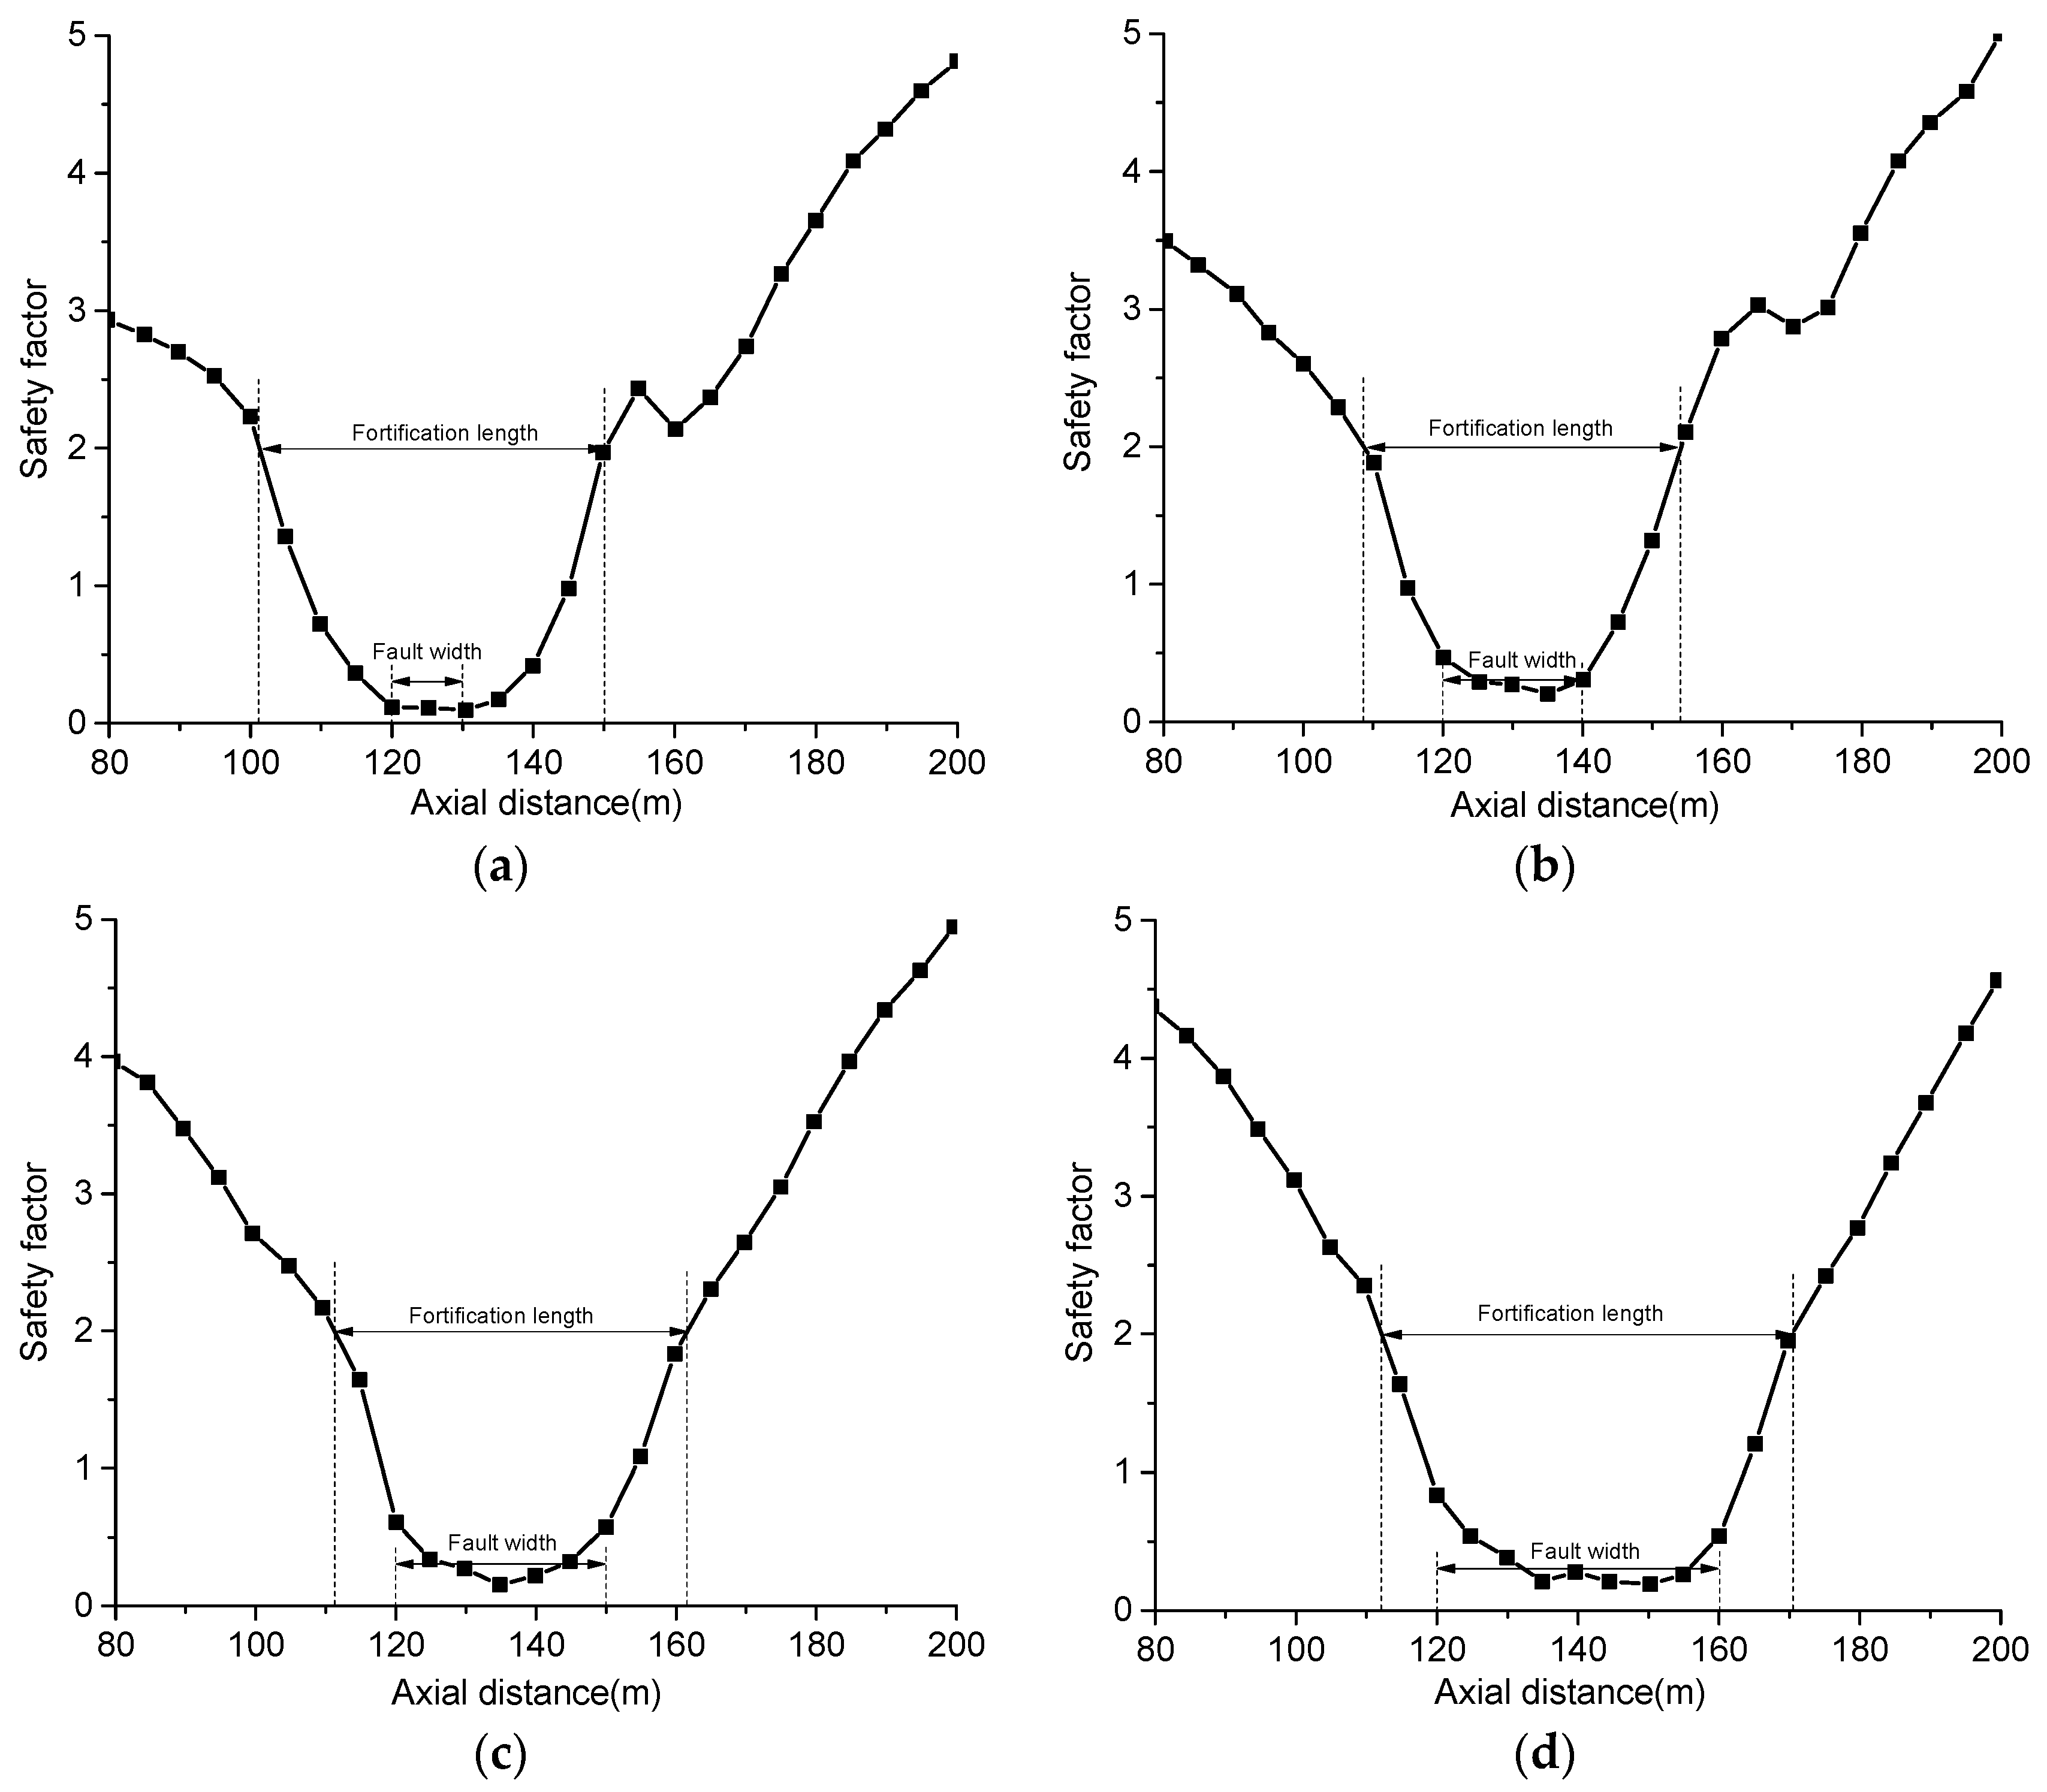
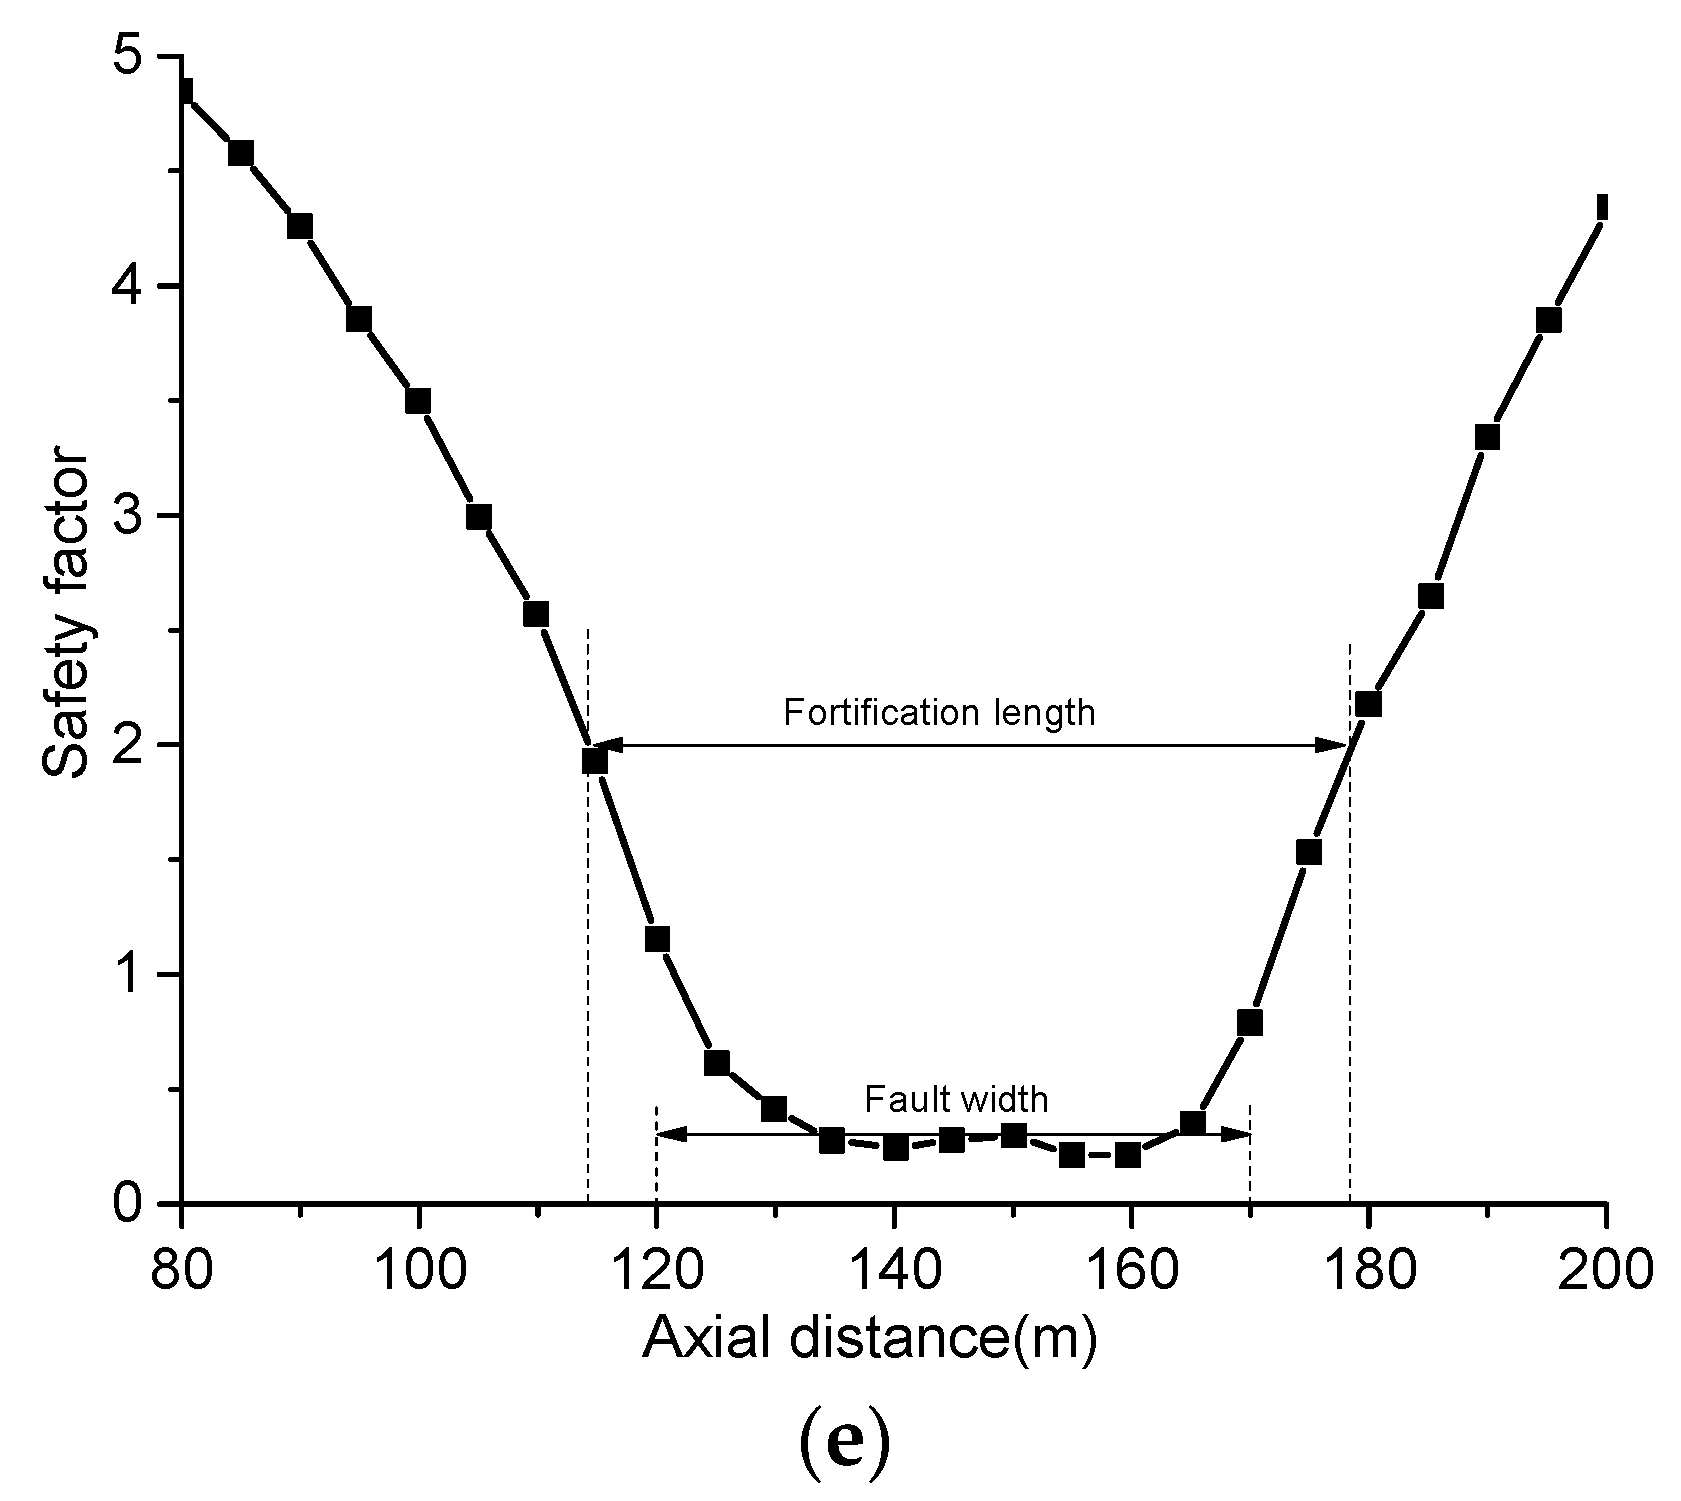

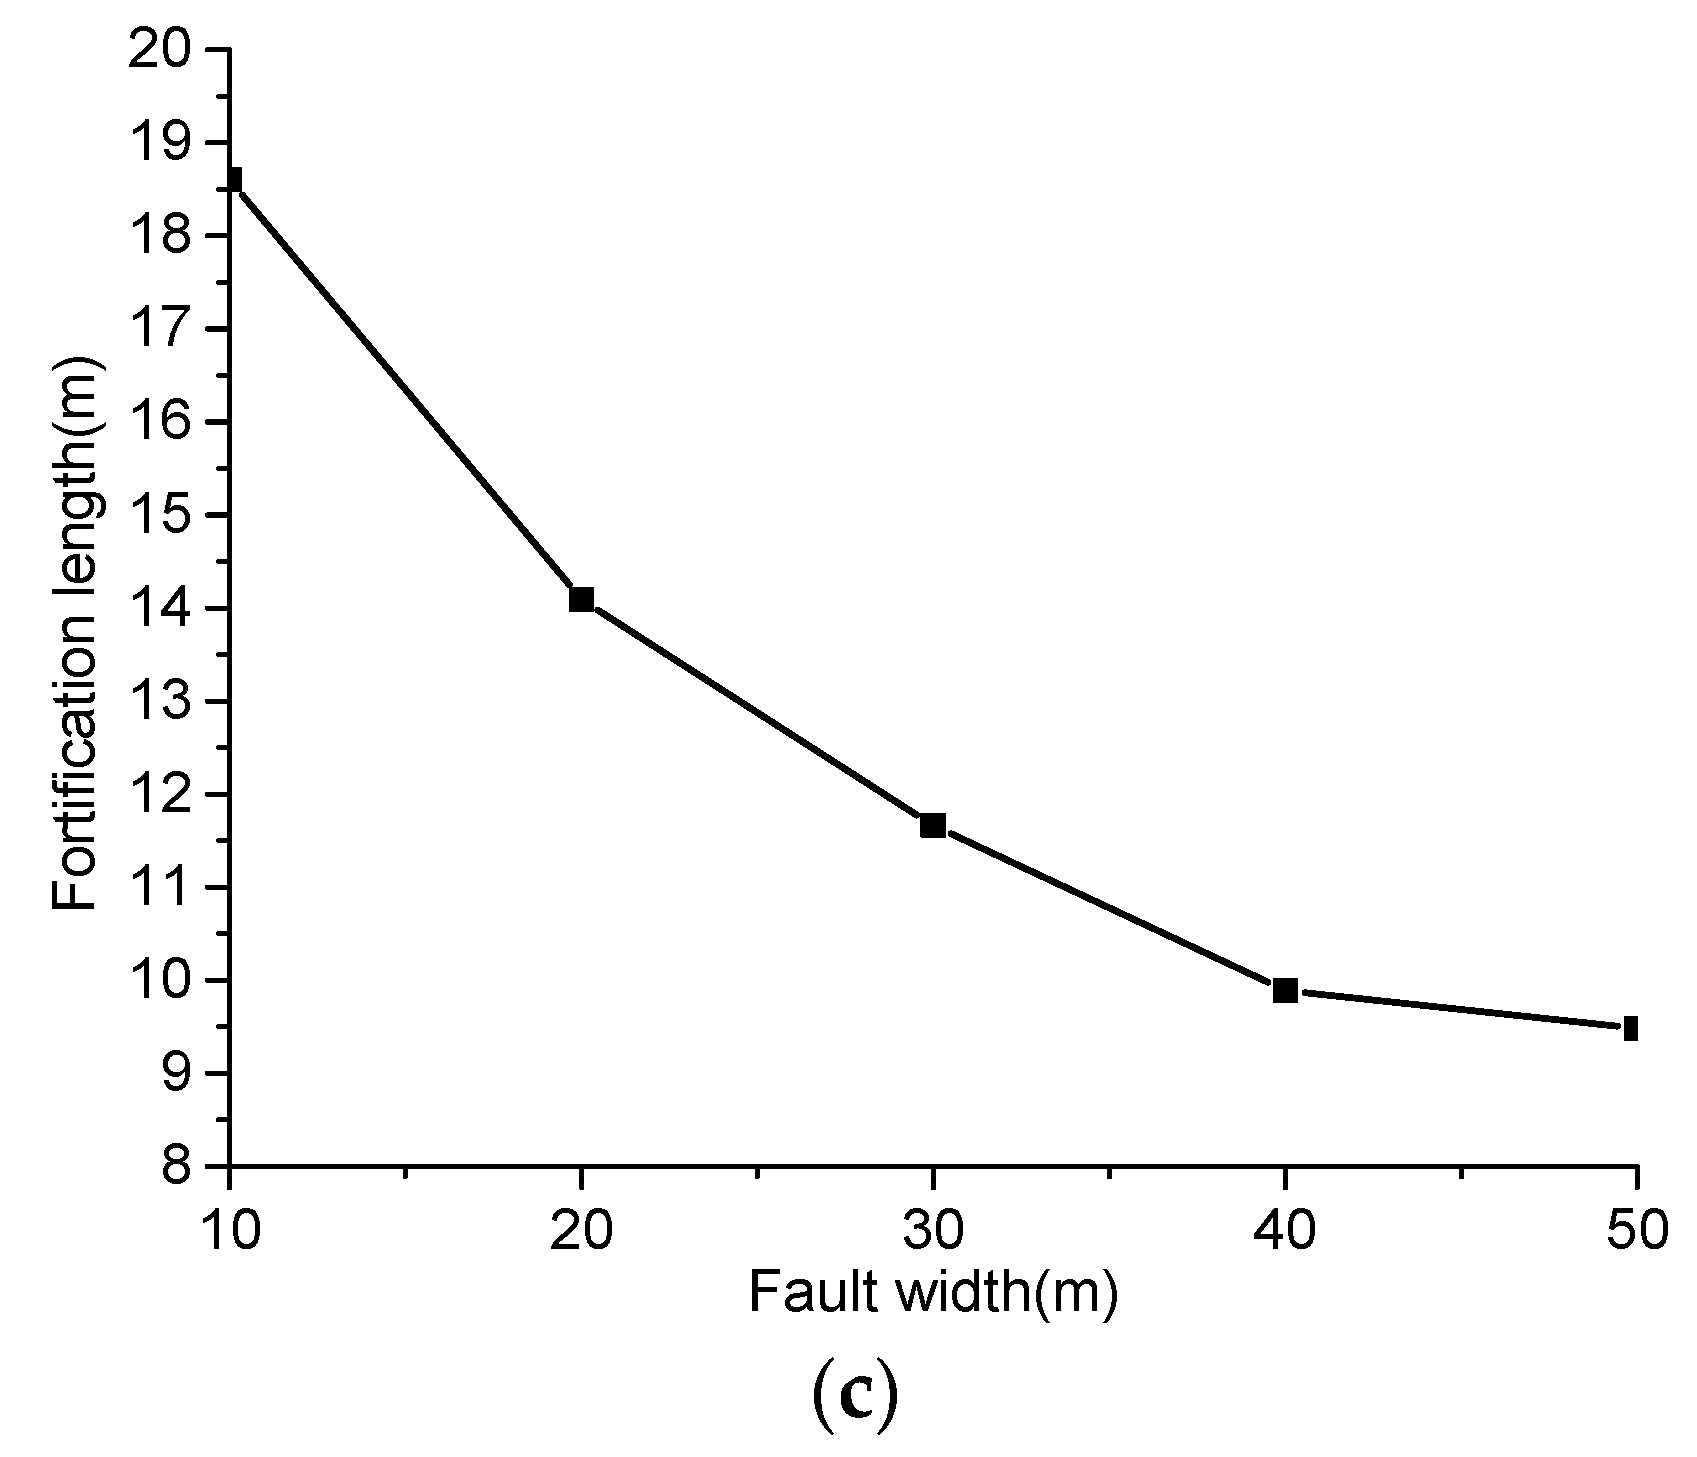
Disclaimer/Publisher’s Note: The statements, opinions and data contained in all publications are solely those of the individual author(s) and contributor(s) and not of MDPI and/or the editor(s). MDPI and/or the editor(s) disclaim responsibility for any injury to people or property resulting from any ideas, methods, instructions or products referred to in the content. |
© 2023 by the authors. Licensee MDPI, Basel, Switzerland. This article is an open access article distributed under the terms and conditions of the Creative Commons Attribution (CC BY) license (https://creativecommons.org/licenses/by/4.0/).