
Simulation of Low Carbon Layout Optimization of Disassembly Line Based on SLP Method

Abstract
:1. Introduction
- Reverse logistics related research
- Logistics operation area layout related research
- Layout method related research
- (1)
- Innovation of research perspective. In the past, few scholars have optimized the layout of reverse logistics processing centers, which are complex, poorly planned and inefficient, and should be taken seriously. This paper studies the reverse logistics processing center to enrich the theoretical study of reverse logistics.
- (2)
- Innovation of analysis method. It is proposed to further divide the functional area through functional positioning of the reverse logistics processing center and operation flow analysis and optimization, and to carry out low-carbon design of the disassembly line layout based on the SLP method on the basis of the research, as well as to further optimize it through simulation analysis to arrive at the optimal solution.
2. Problem Statement
- The operation process is not perfect
- (1)
- Lack of pre-testing and sorting of recyclables.
- (2)
- No cleaning process is set up after the disassembly of parts.
- (3)
- Reasonable transfer planning for recyclable and remanufactured parts is not carried out with unreasonable layout of disassembly line.
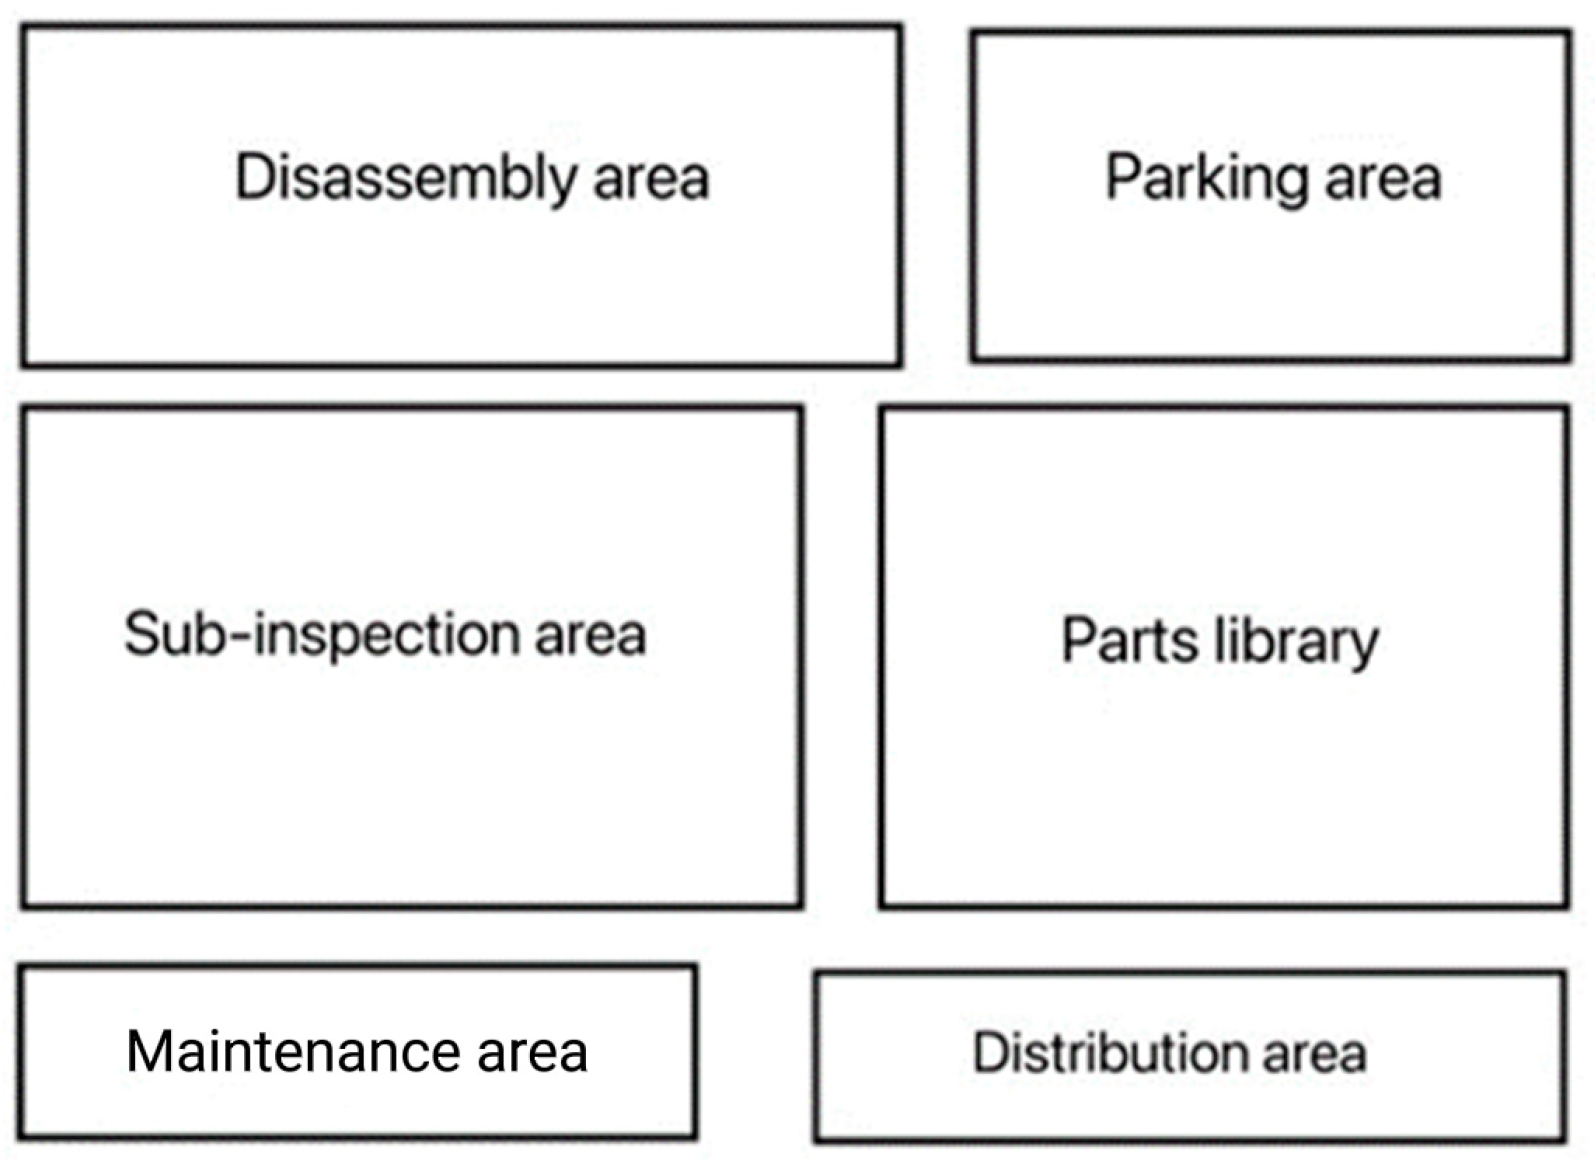
- Unreasonable division of functional areas
- (1)
- Unreasonable planning of sub-inspection area.
- (2)
- No cleaning area is set.
- (3)
- No parts temporary storage area is set.
- (4)
- The area of parts library is unreasonable.
- (5)
- The distribution of each area is not reasonable.
3. Layout Design of Low Carbon Disassembly Line Based on the SLP Method
- (1)
- Shorten the transfer distance. In the operation of the disassembly line in the logistics center, the carbon emissions generated by the forklift during the transfer process account for a large proportion of the total carbon emissions of the disassembly line. Shortening the distance of transfer required in the disassembly line can reduce carbon emissions and costs, as well as improve the efficiency of the disassembly line.
- (2)
- Realize the effective use of the area. The available area of the logistics processing center is limited; reasonable planning of the existing area and the area utilization rate can reduce carbon emissions caused by public utilities and other aspects while reducing certain variable costs.
- (3)
- Reduce pollution. Reducing pollution is the ultimate goal of the reverse logistics center; therefore, the disassembly line in the logistics center should be optimized through professional processing processes and coordination of the corresponding layout to reduce unnecessary pollution generated in the disassembly process, thus reducing the corresponding carbon emissions.
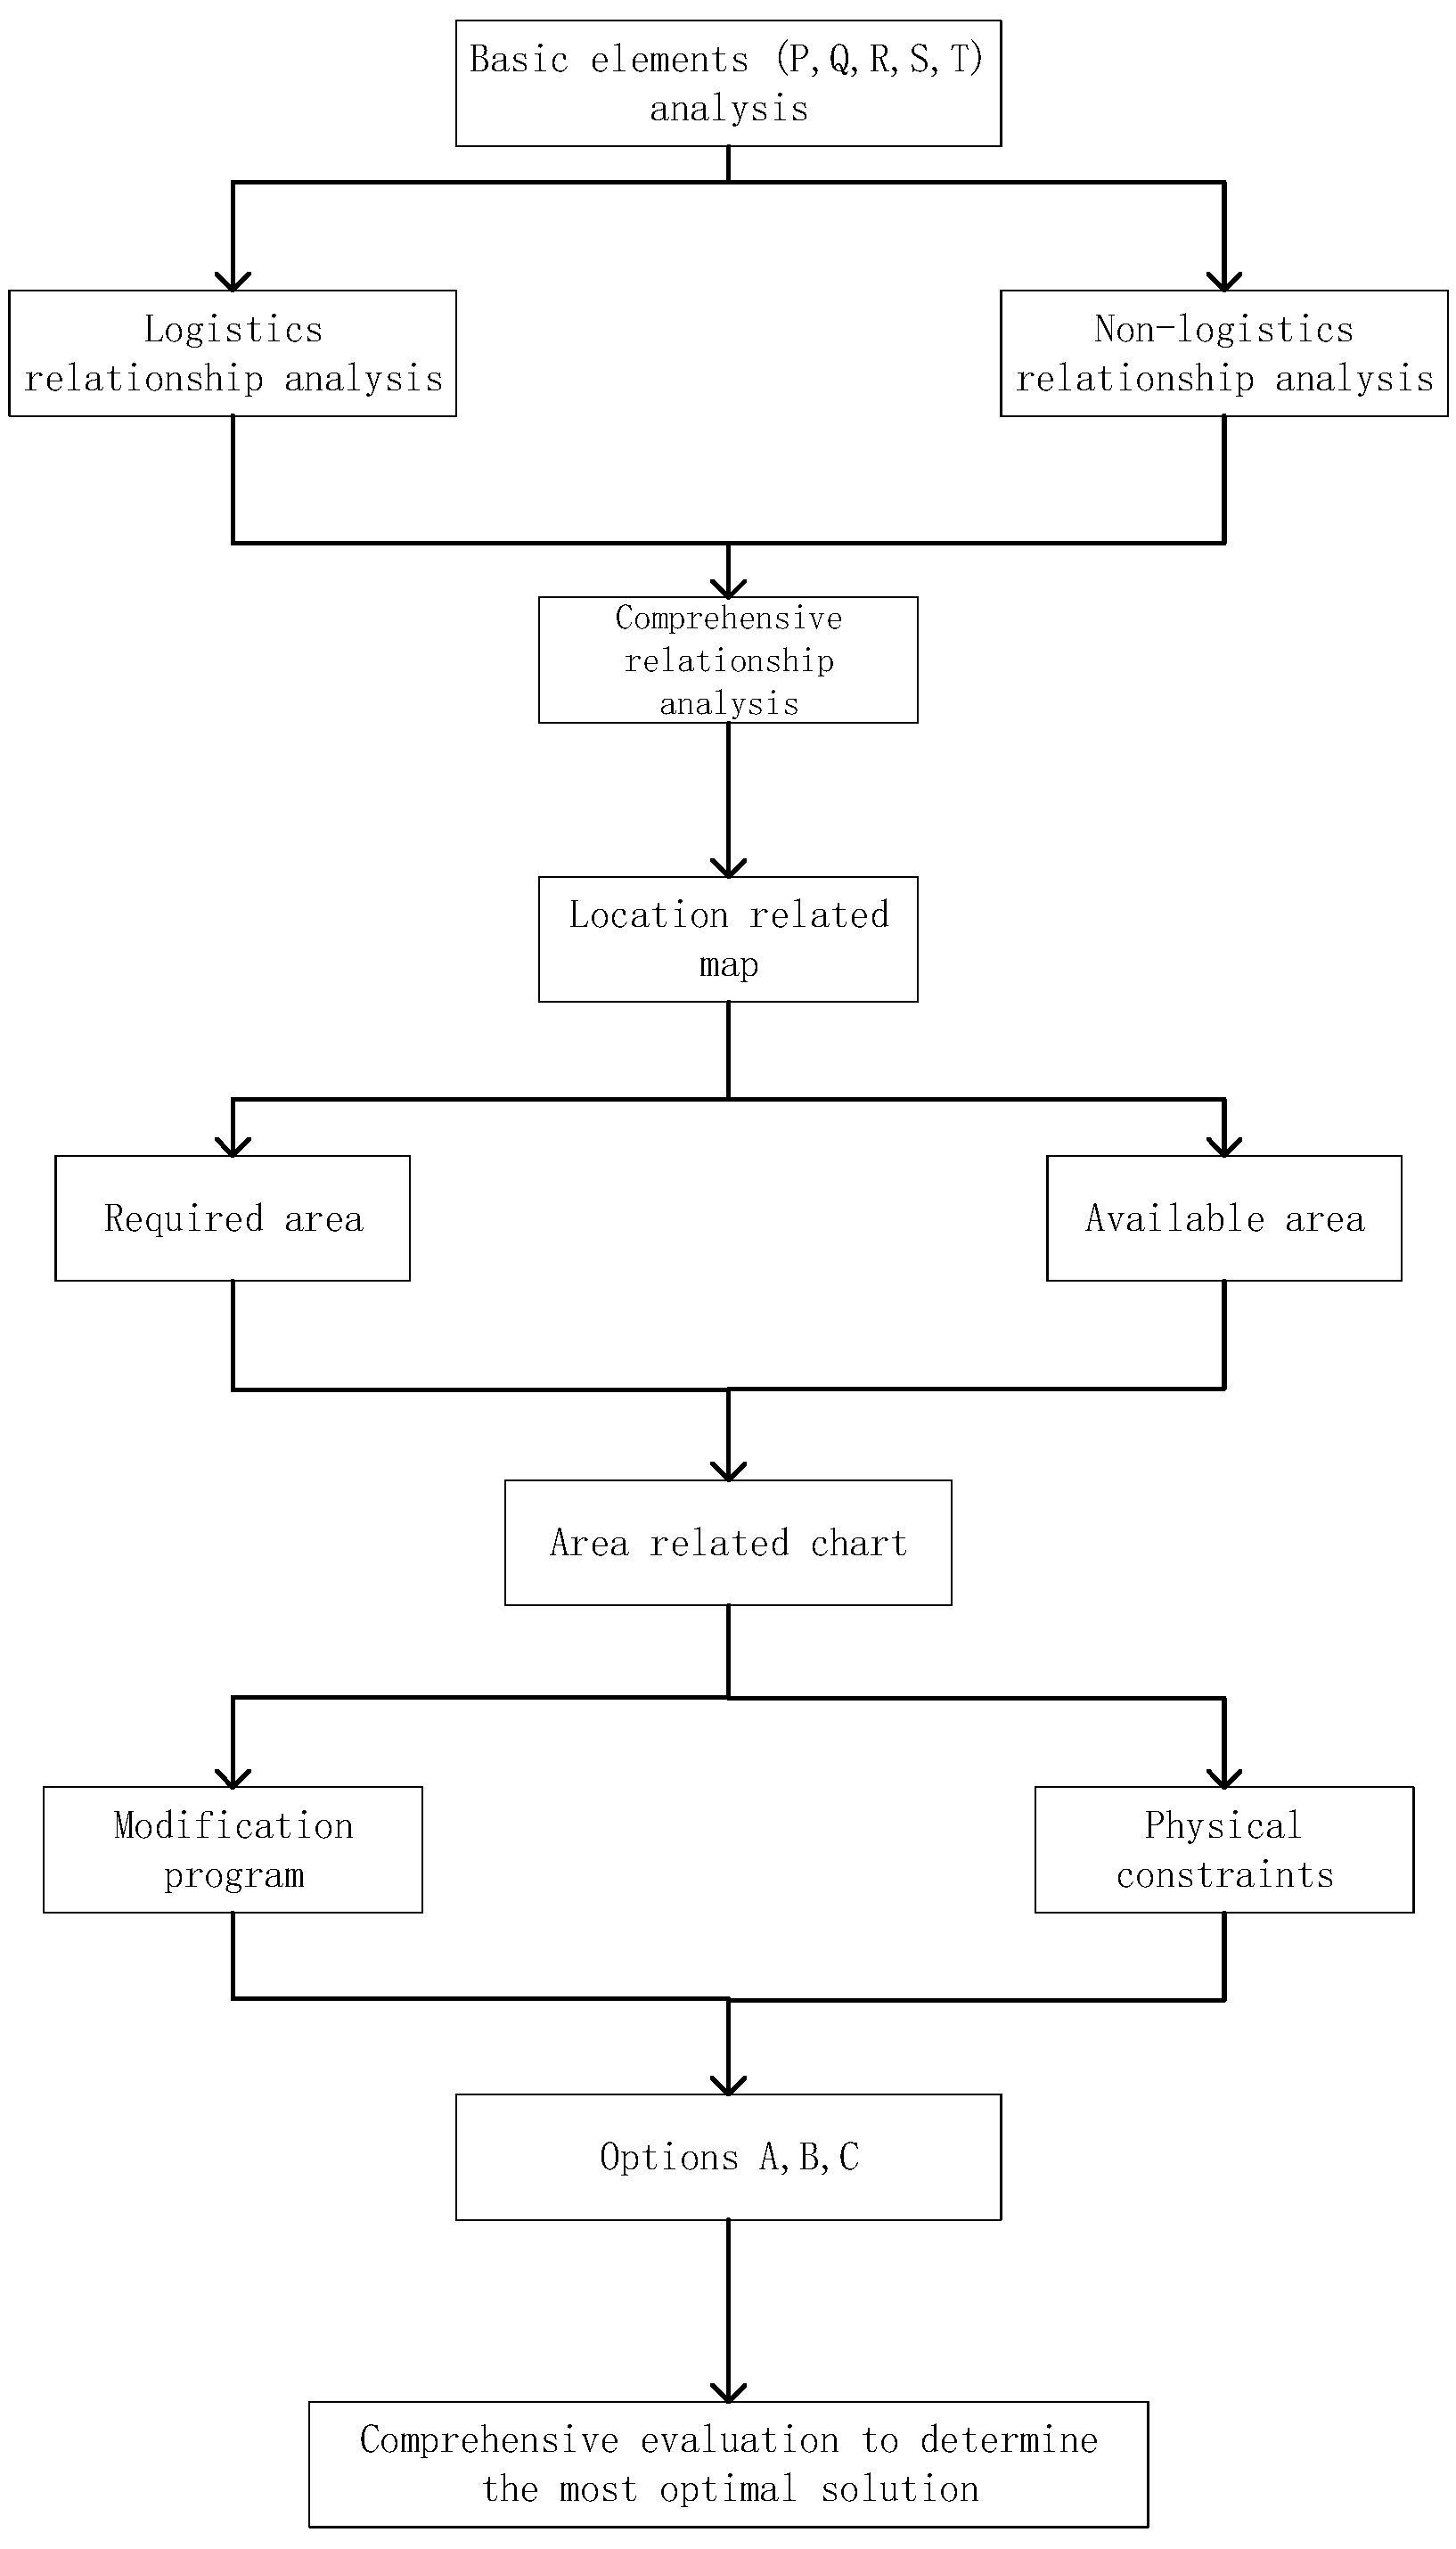
3.1. Analysis of Low Carbon Disassembly Line Layout Elements
- (1)
- P: logistics object analysis. The logistics object will have a large impact on the overall planning of the analyzed layout. Take Company H as an example: at present, recycled scrap goods and parts are the two main logistics objects of the disassembly line. The used goods are mainly recycled goods such as household appliances operated by the company, and the parts are the disassembled parts of the recycled used goods.
- (2)
- Q: refers to the analysis of material flow. The size of logistics operations directly reflects the size of the floor space and the number of related equipment, which determines the cost of storage and handling costs. Through data collection and preliminary research, we obtained the processing volume of recycled waste products from 2017–2021 in the disassembly line of the logistics processing center of Company H, as shown in Table 1, which yielded an average annual processing volume of approximately 260,000 pieces, totaling 26,000 tons.
- (3)
- R: Logistics operation route. It refers to the logistics route of recyclables between the functional areas of the disassembly line. The logistics route of recyclables is mainly determined by the operation flow of the disassembly line.
- (4)
- S: Auxiliary service department. The functional areas that provide auxiliary work for logistics objects other than the disassembly line’s professional workflow activities such as disassembly are collectively referred to as auxiliary service departments. At present, the auxiliary service department in the disassembly line is the parking area.
- (5)
- T: Logistics operation technology. This refers to the specialized equipment needed to perform logistics operations in the disassembly line, such as disassemblers, inspection machines, and forklifts. The combination of professional hardware equipment and software technology can effectively improve operational efficiency and reduce the required cost.
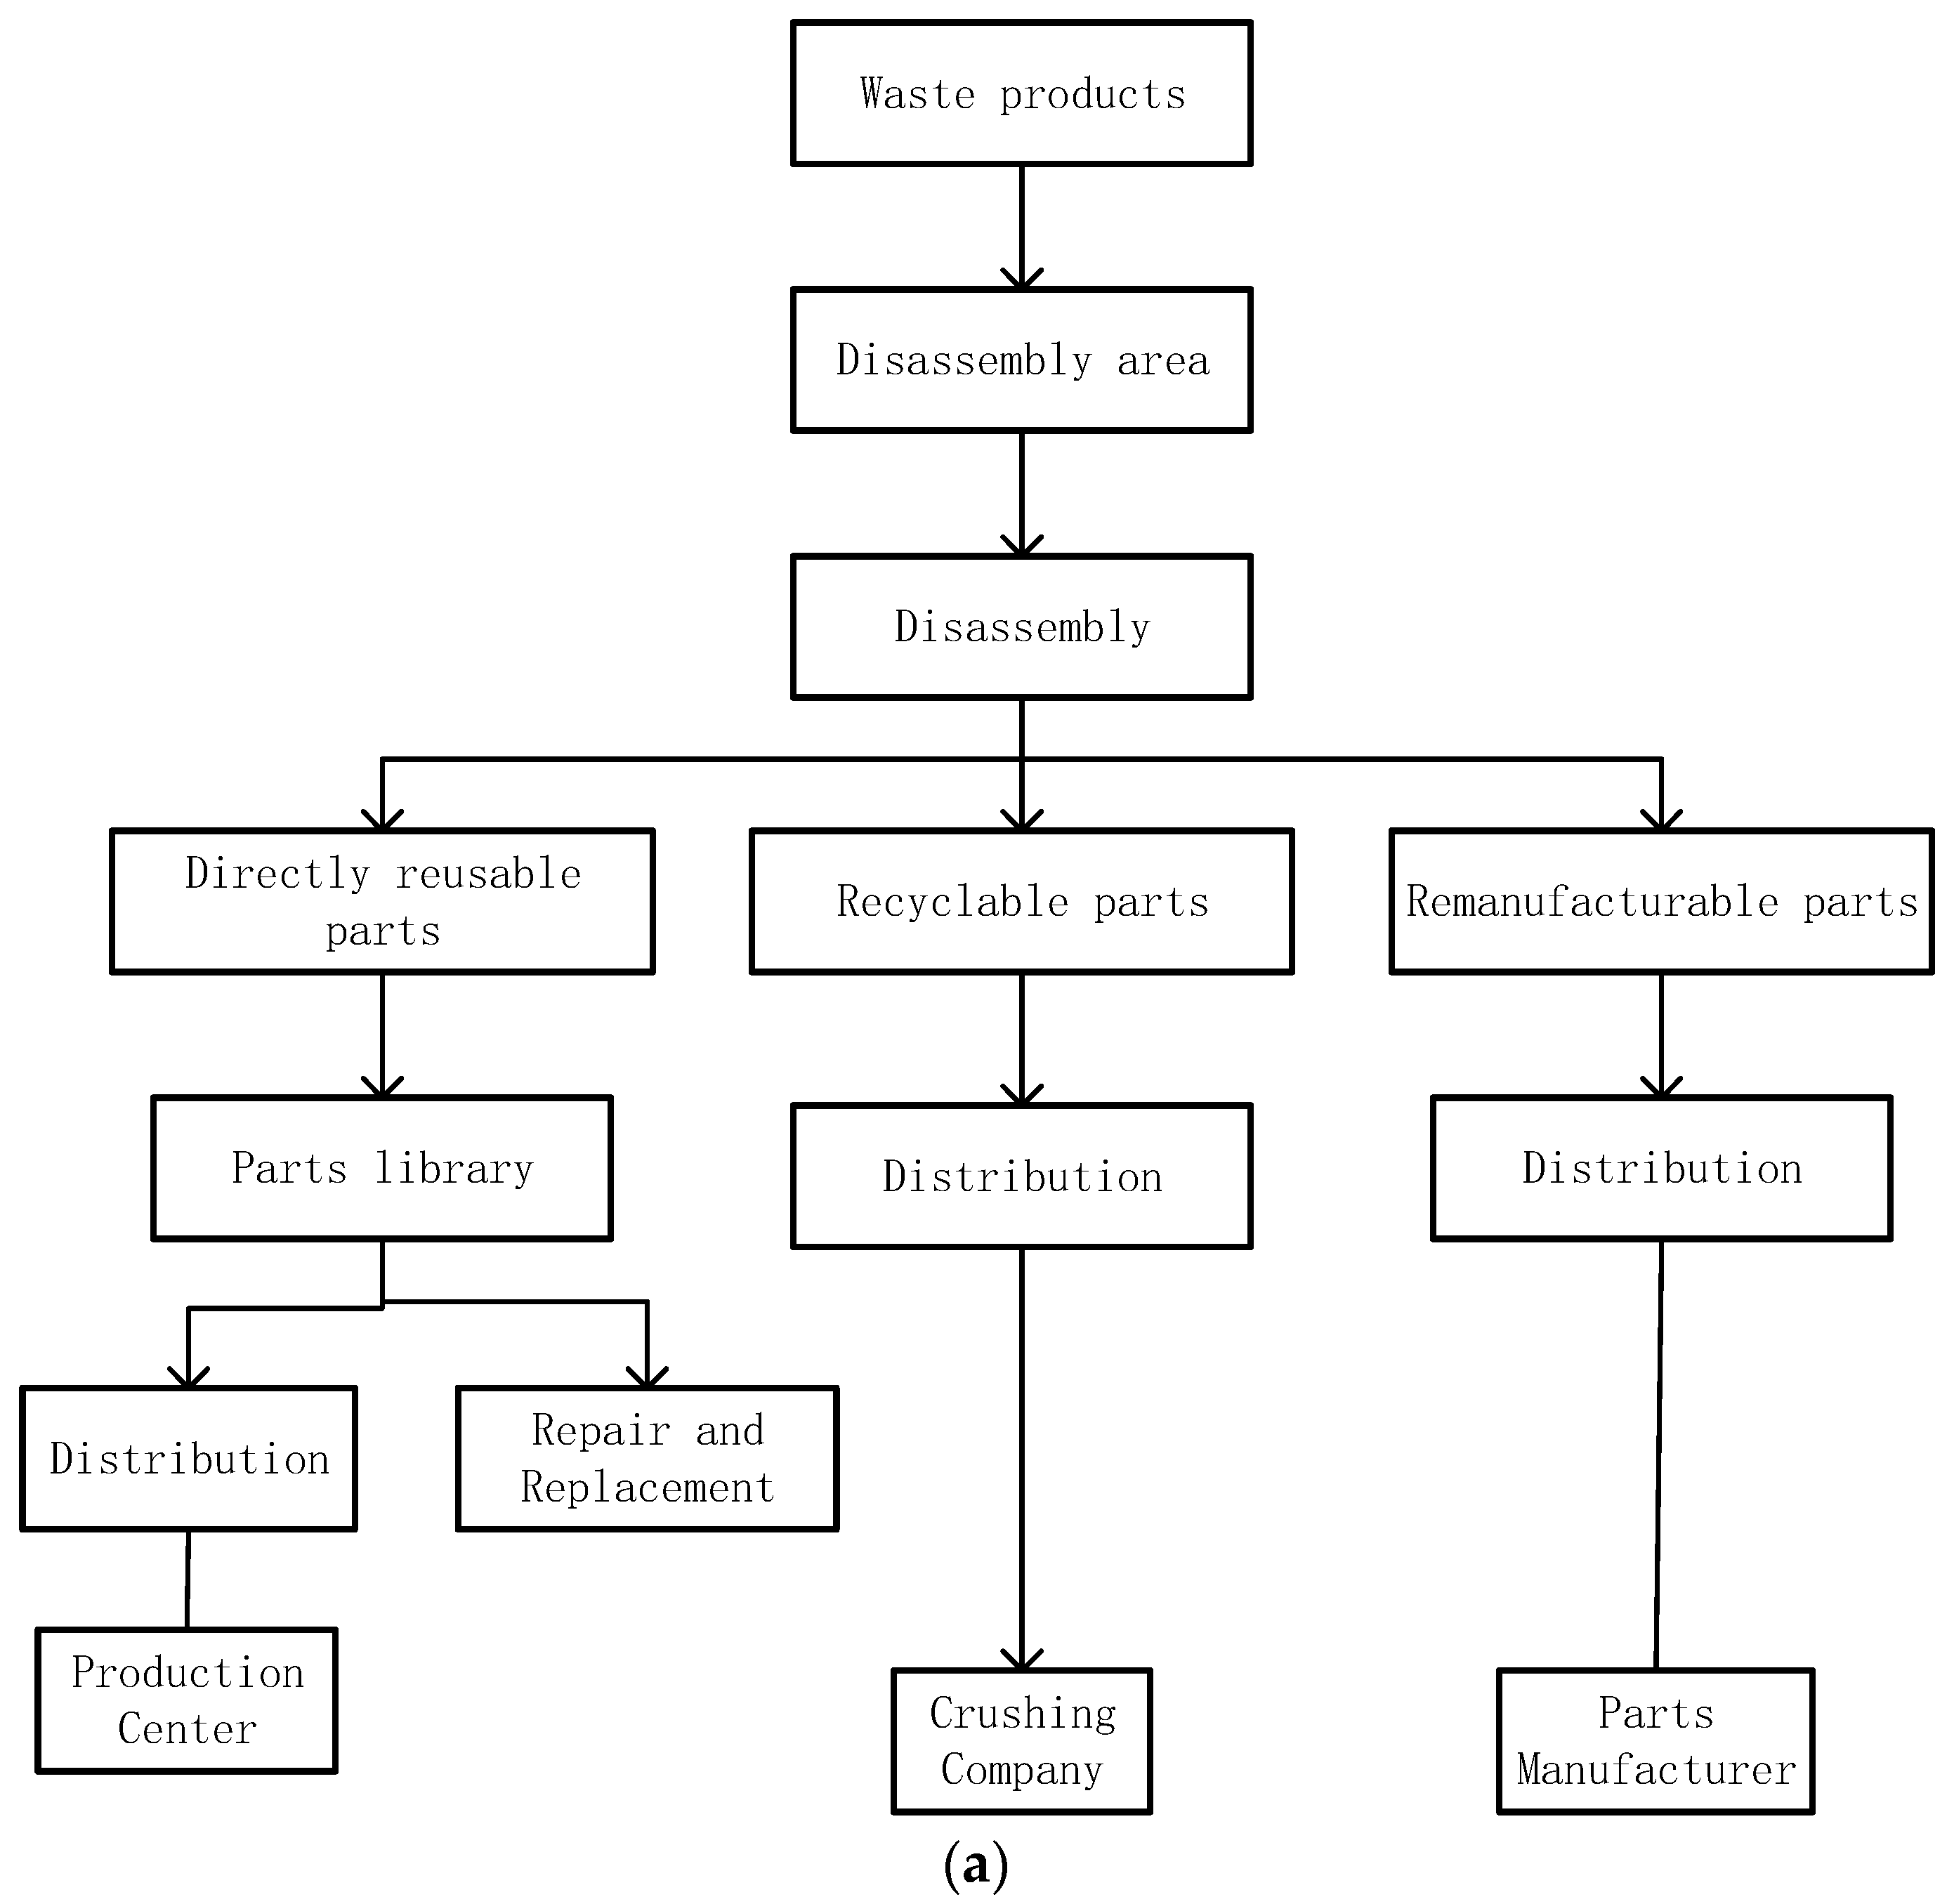
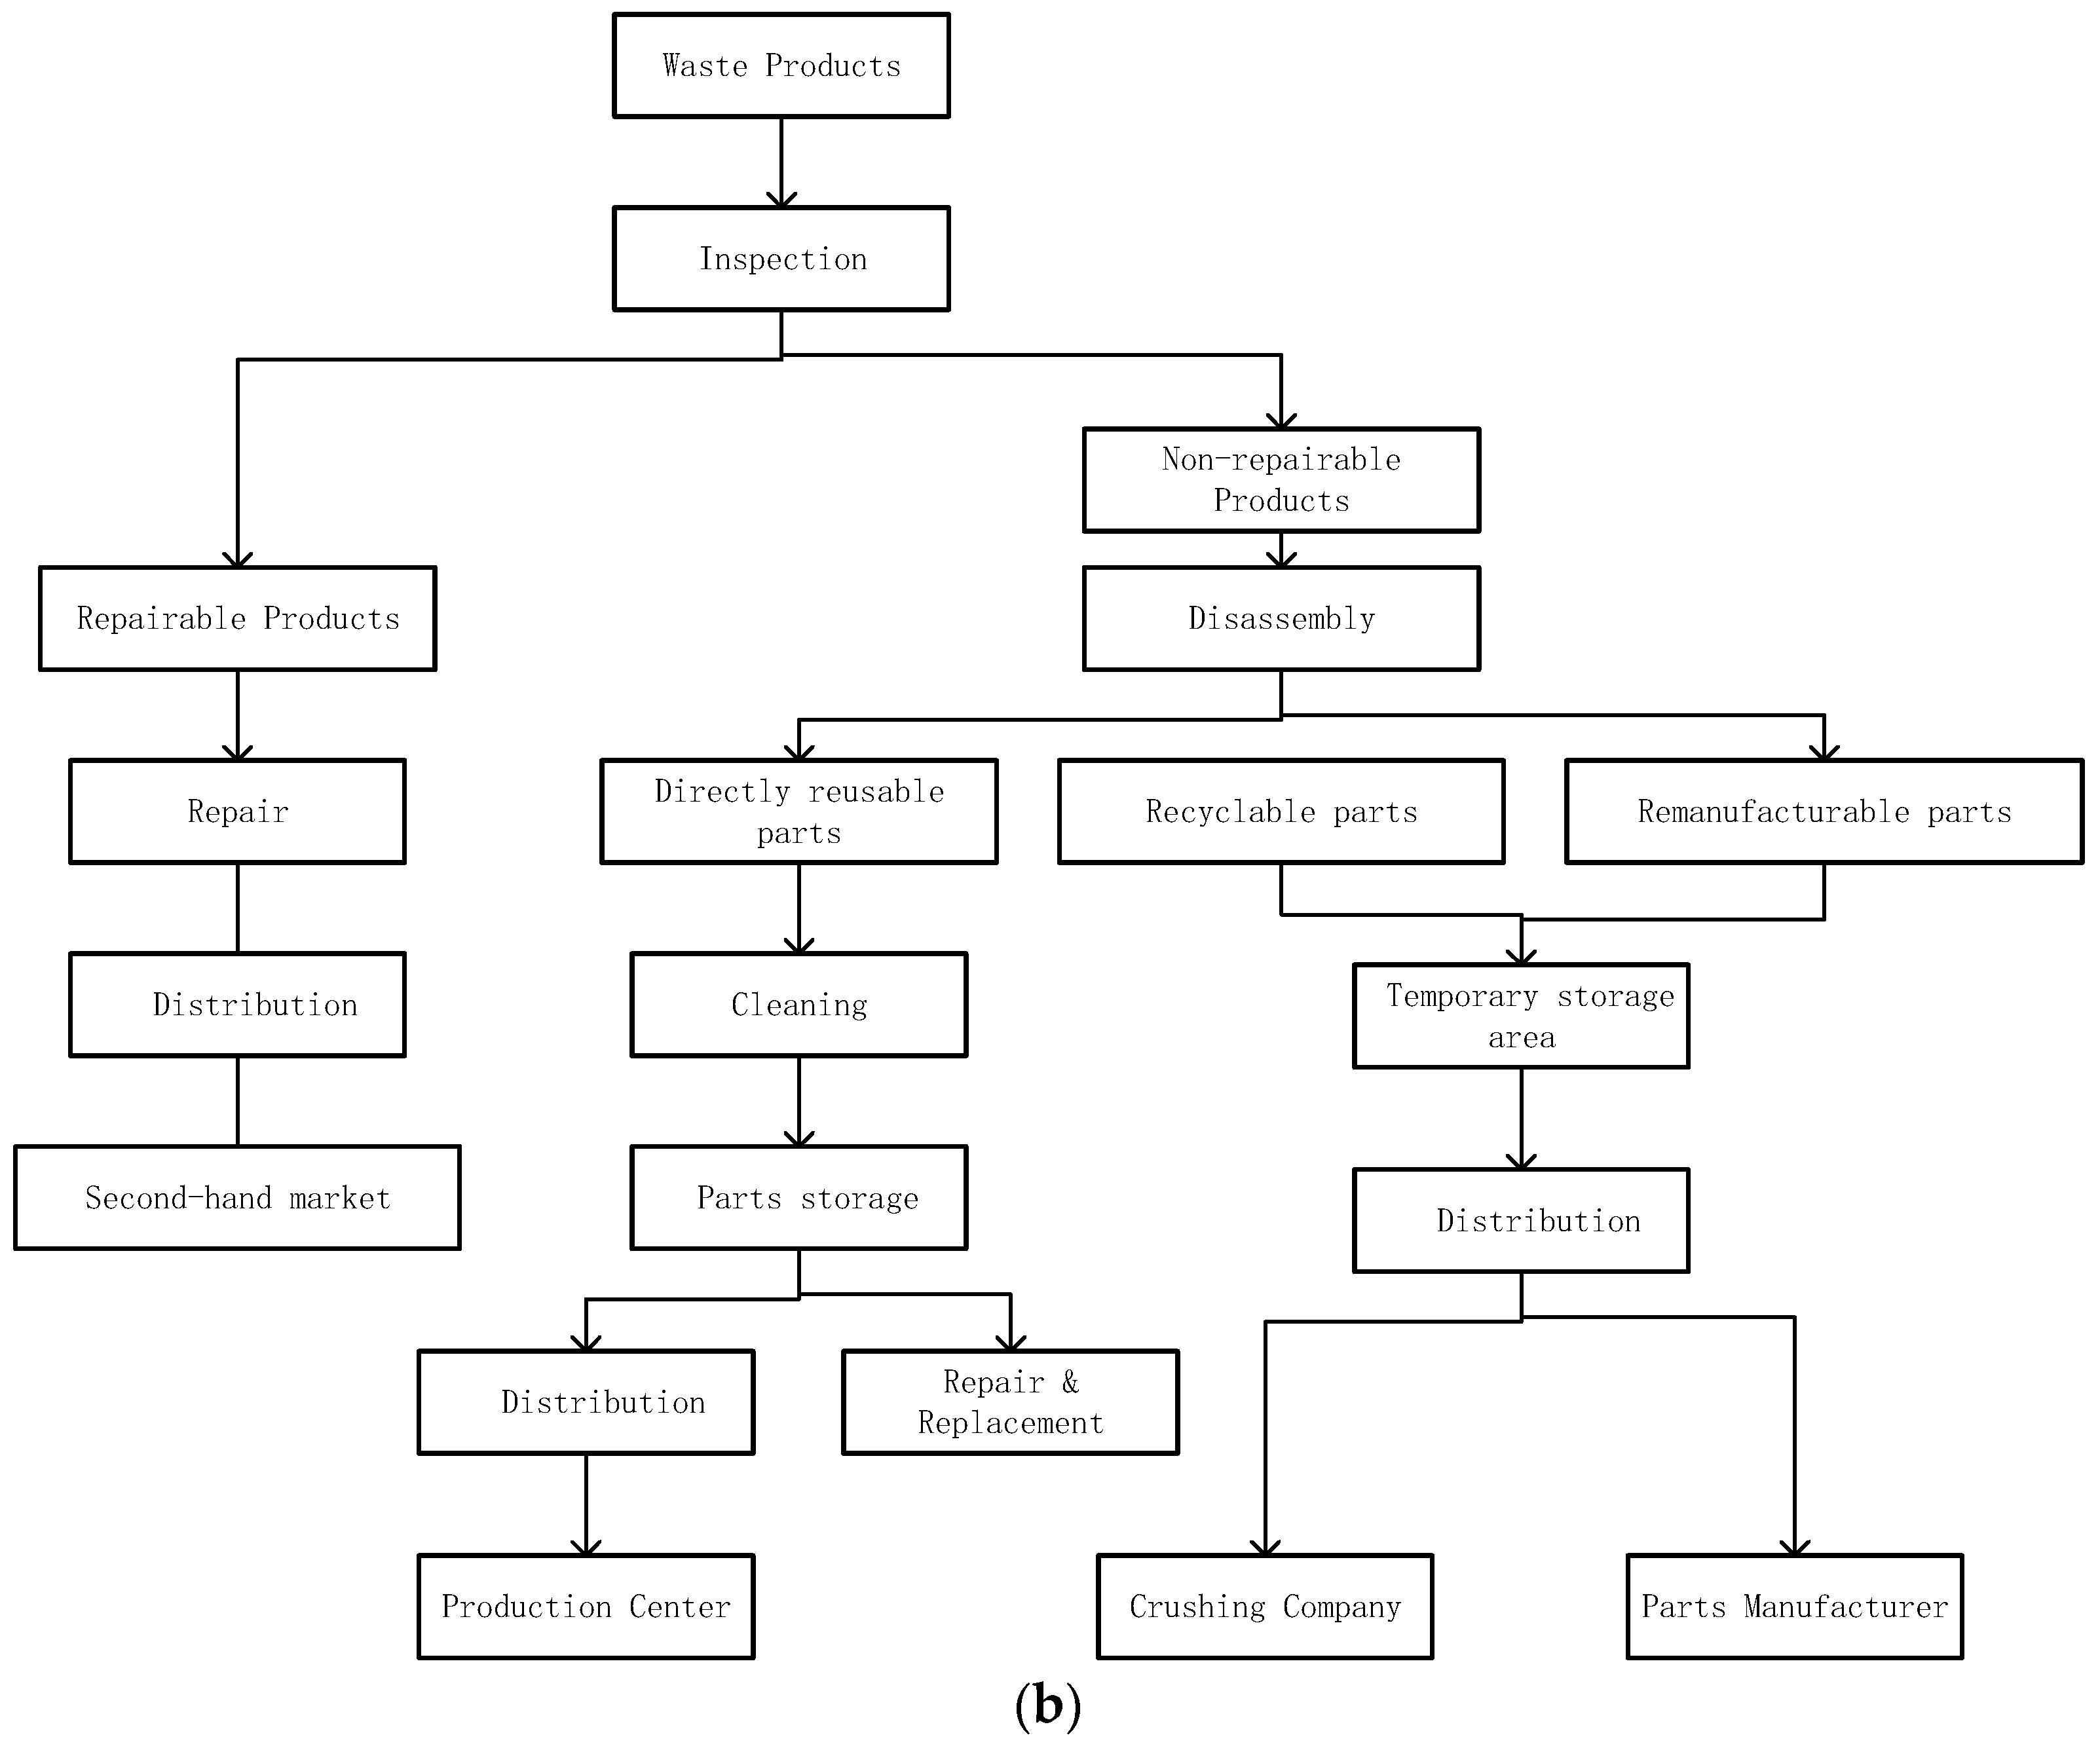
3.2. Disassembly Line Workflow Optimization
- (1)
- Adding a testing link for waste products before disassembly. According to the current process, recyclables are dismantled directly after entering the disassembly line without testing. The disassembly without testing may miss the recyclables that can be repaired without disassembly, which generates unnecessary carbon emissions and increases the workload at a later stage. The waste commodities are further sorted into repairable and non-repairable categories through the testing process, and the non-repairable commodities continue to enter the disassembly area for disassembly, while the repairable items can be directly transported to the maintenance area of the logistics center outside the disassembly line for maintenance cycle.
- (2)
- Increase the cleaning link before storage for the parts that can be directly reused after disassembly. According to the current process, after disassembly the directly reusable parts, they are directly sent to the parts warehouse by forklift and then sorted out and cleaned before use, which increases unnecessary carbon emission and reduces the efficiency of the disassembly line. The optimized cleaning process is set before the disassembly and storage, which improves efficiency and reduces the pollution caused by unclean storage and the carbon emission caused by separate cleaning before use.
- (3)
- To set up a temporary storage area for recyclable and remanufactured parts after disassembly. Currently, recyclable and remanufactured parts are not transferred after disassembly but are directly piled up in the disassembly area waiting for sorting, which causes confusion in the disassembly area and increases the workload of forklift transfer and other links, increasing carbon emissions. After optimization, the recyclable and remanufactured parts are dismantled and stored in the staging area, which can reduce the workload and carbon emissions, and make the operating environment better.
3.3. Disassembly Line Functional Area Location Layout Optimization
- (1)
- Logistics relationship between each zone
- (2)
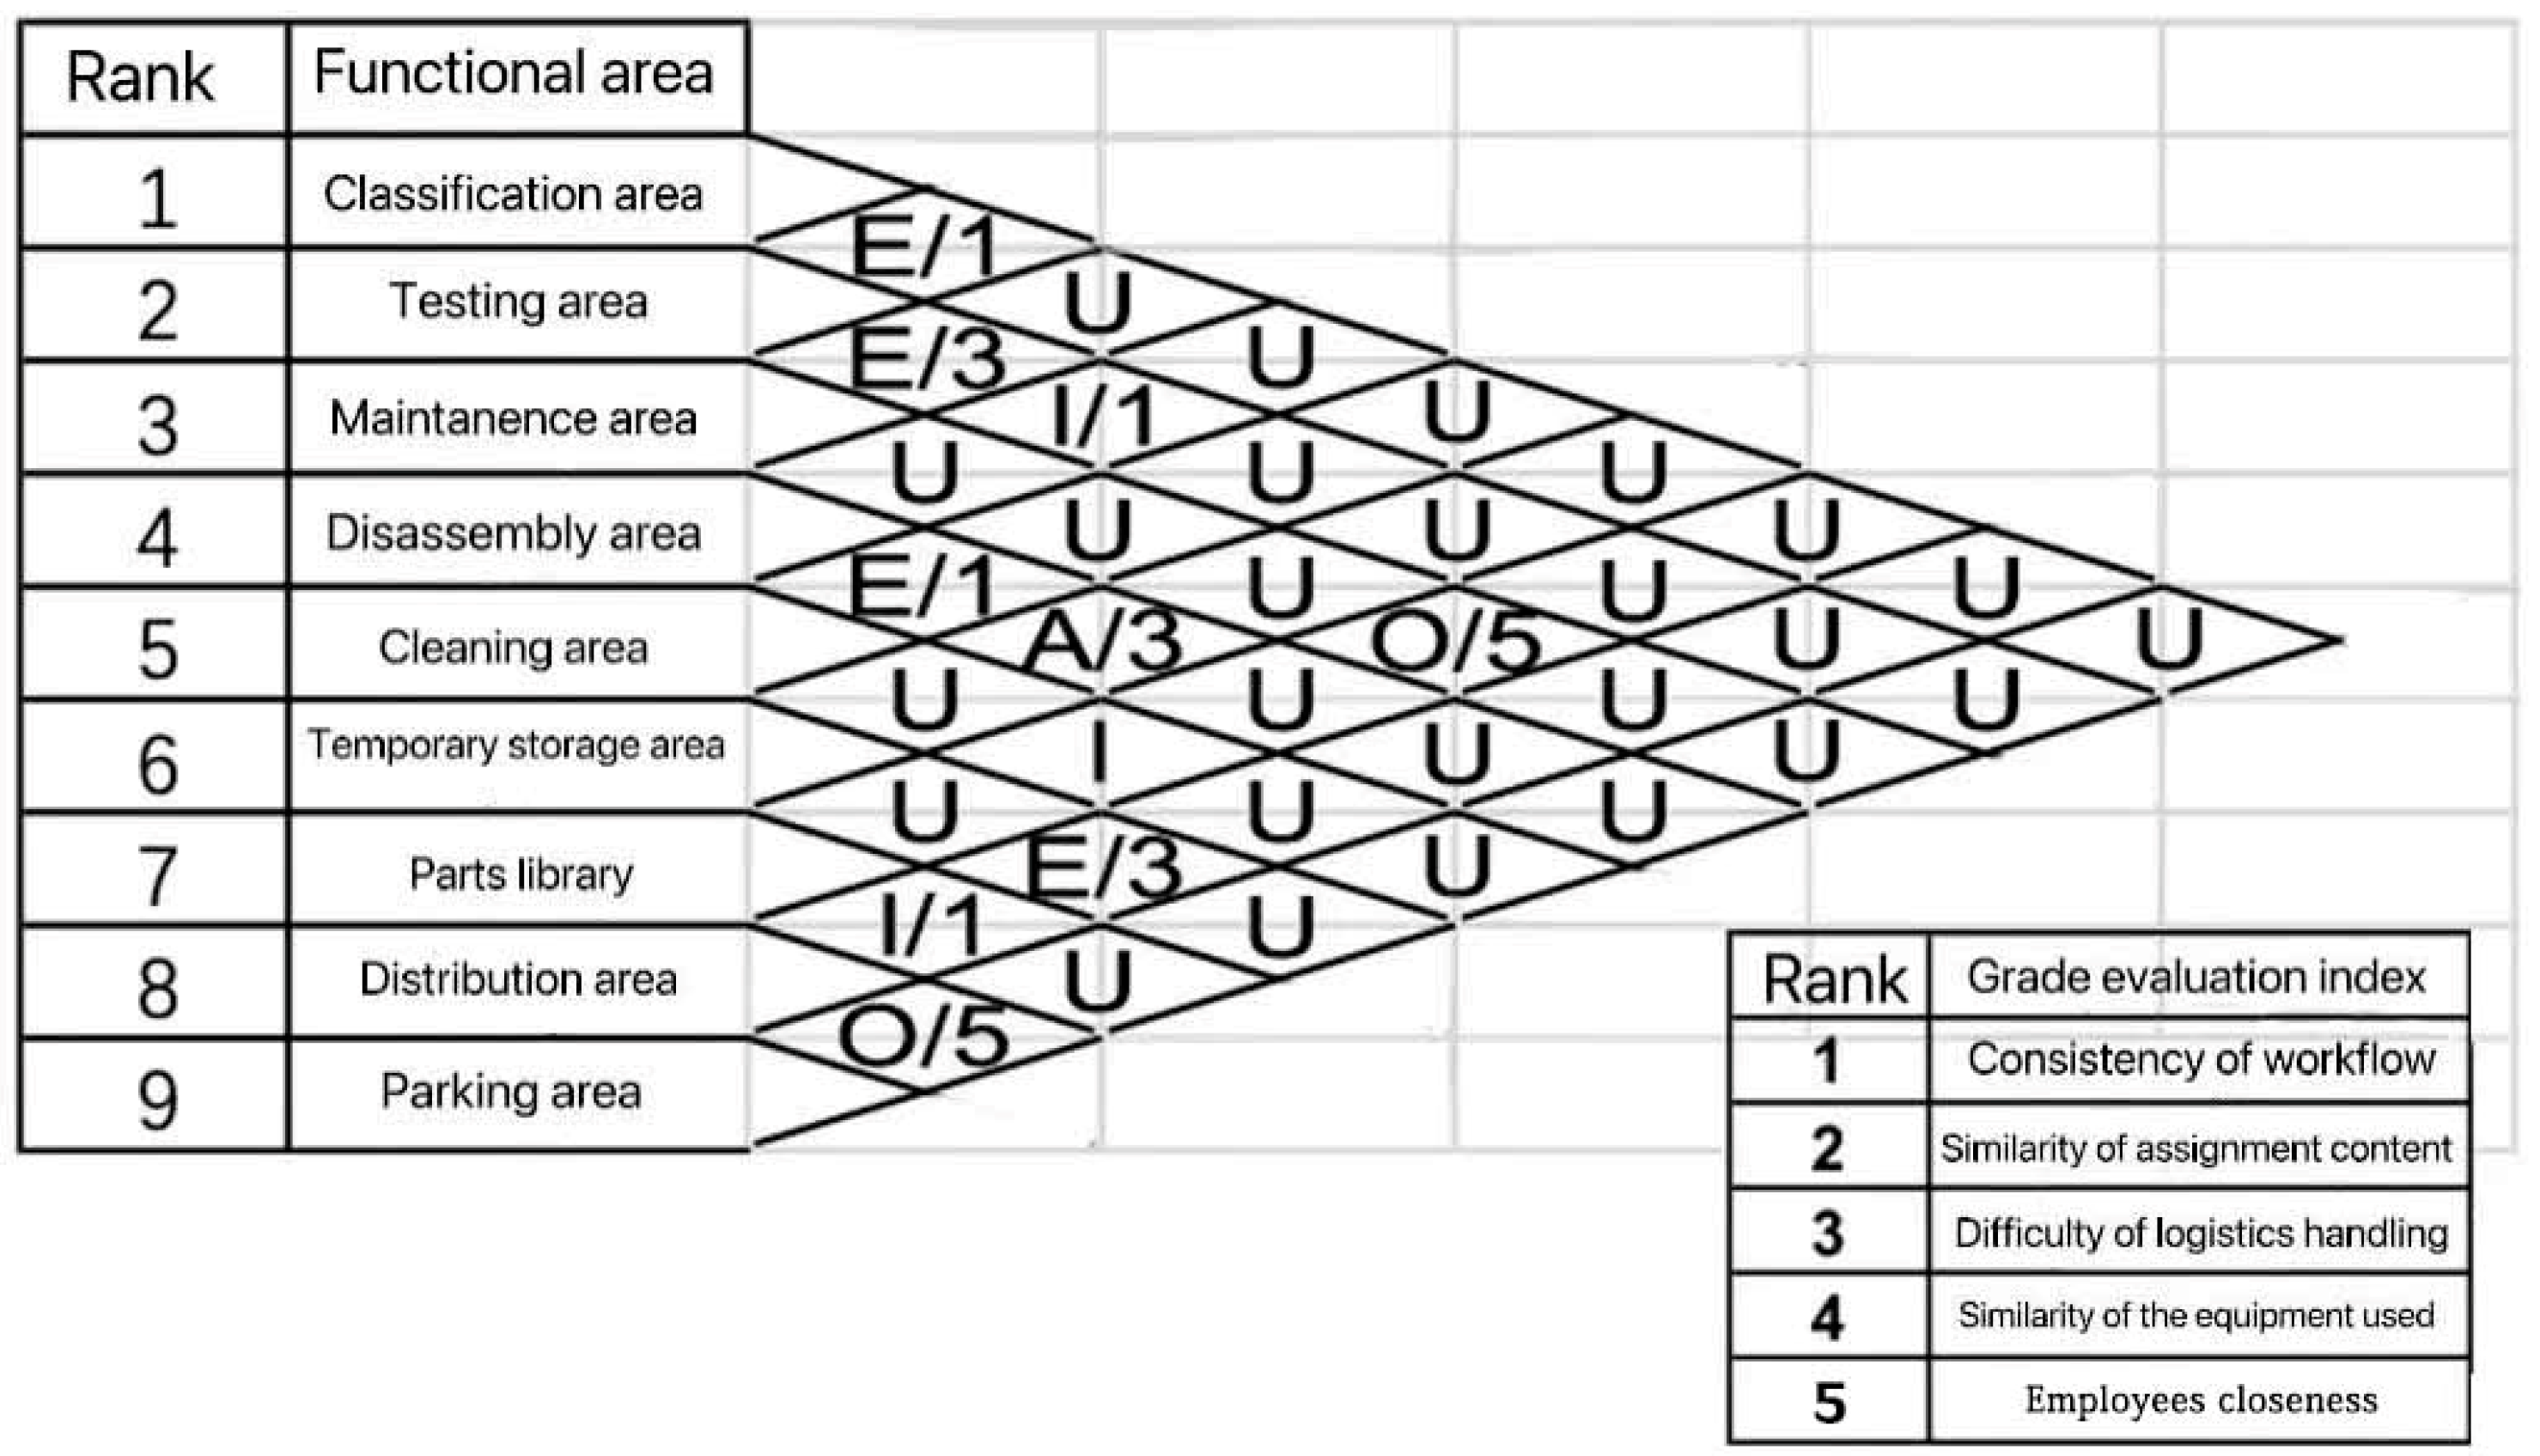
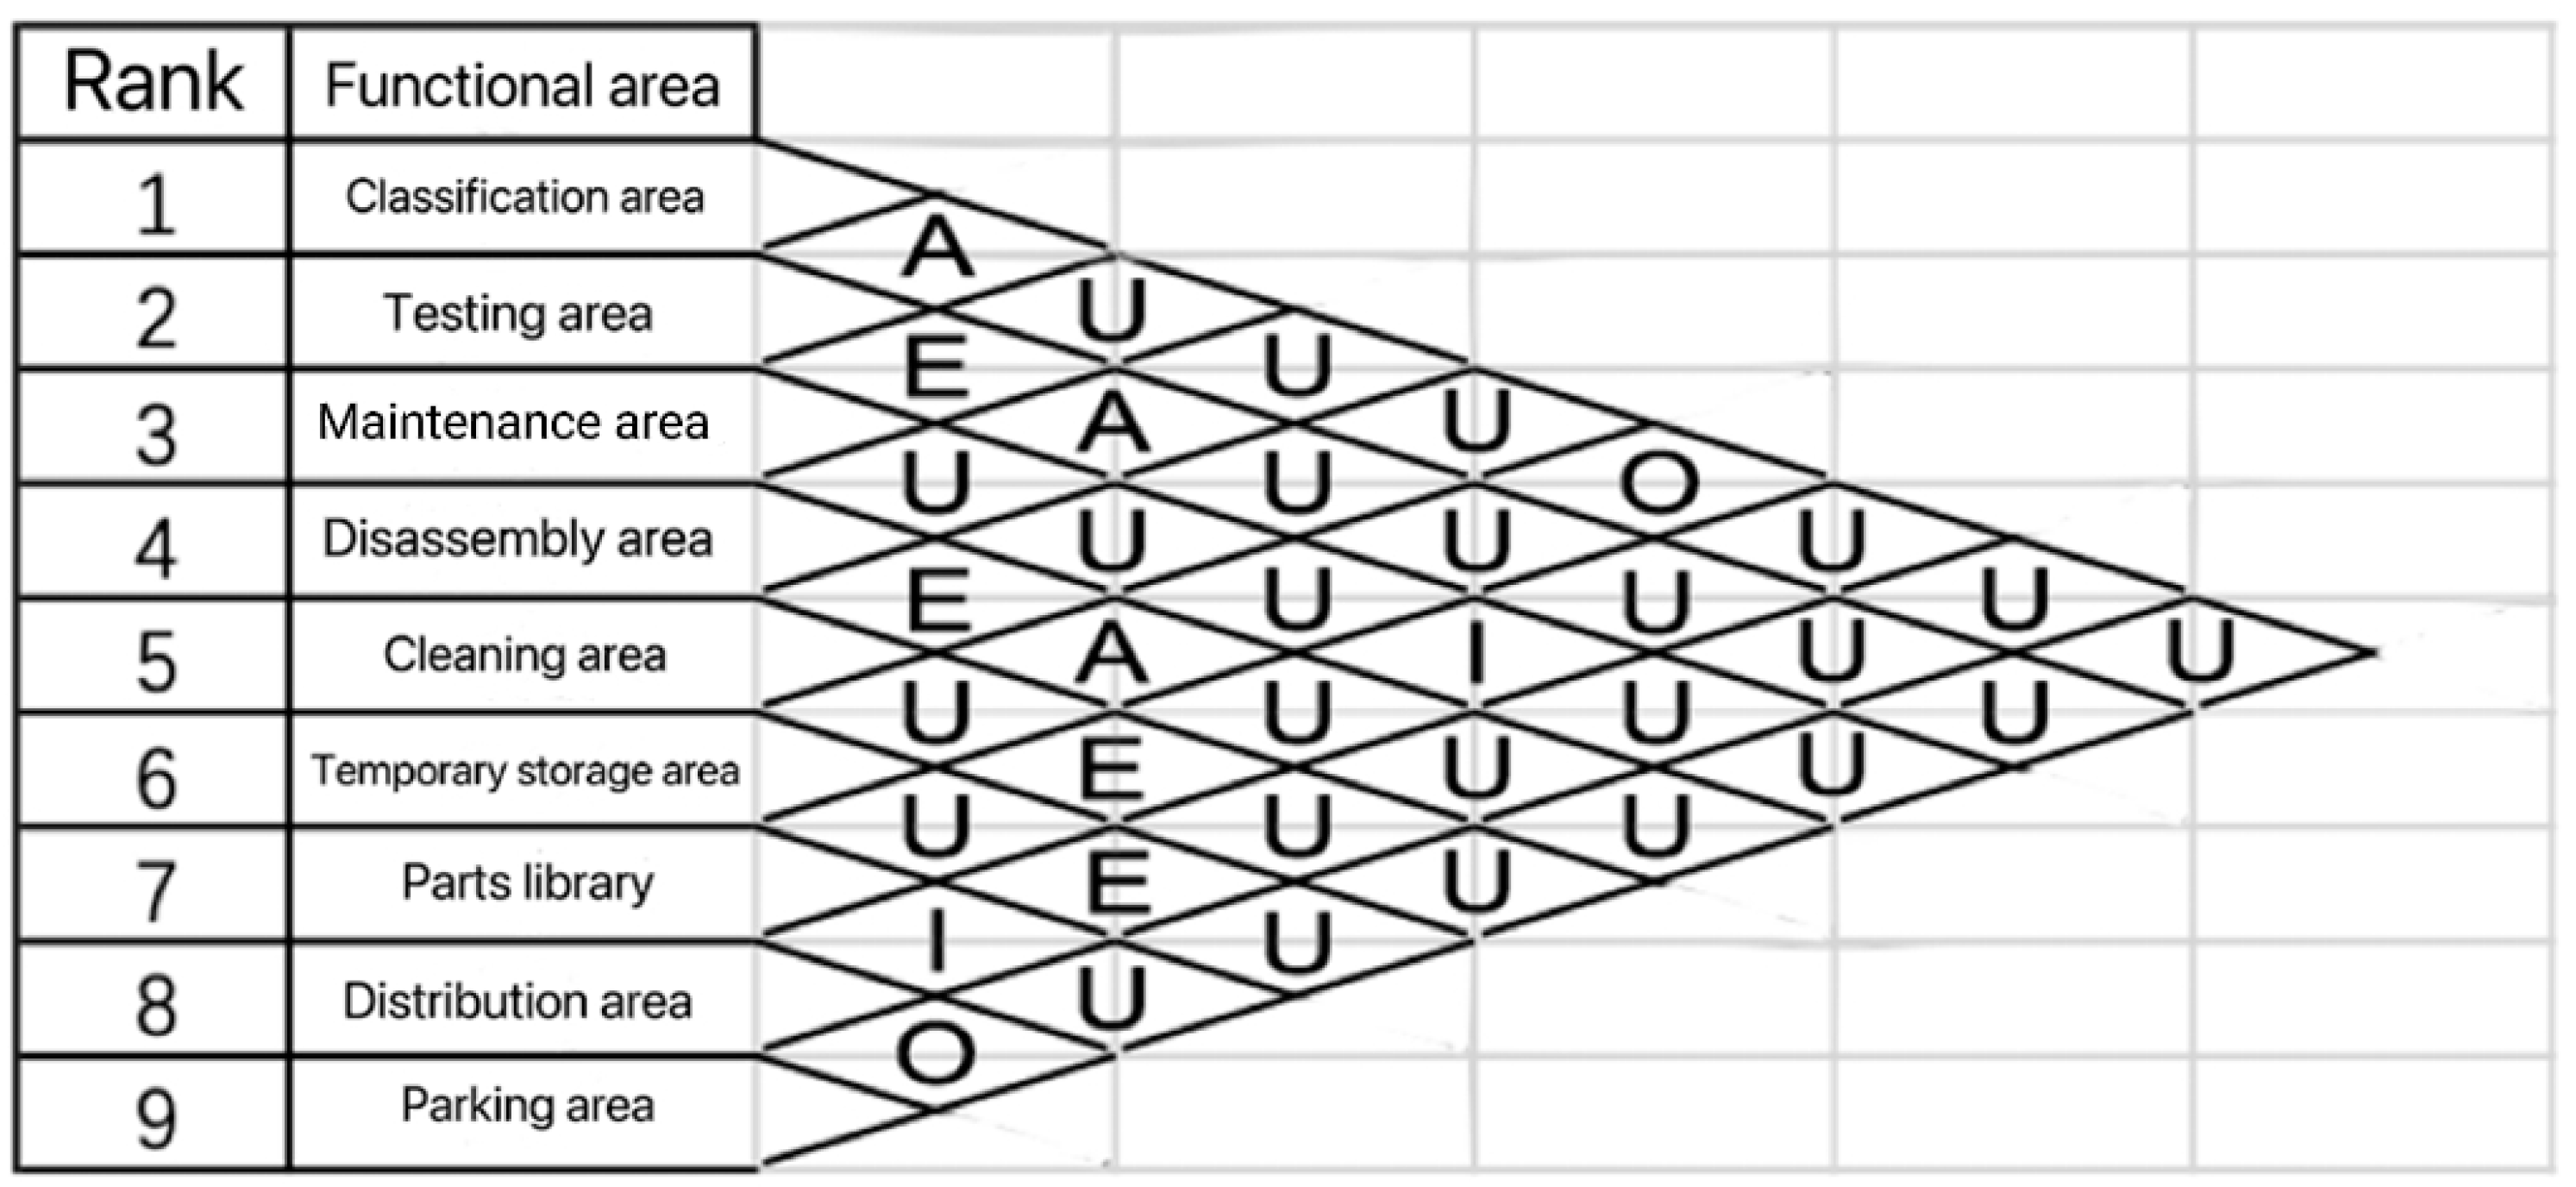
- Comprehensive relationship analysis of each functional area
- (3)
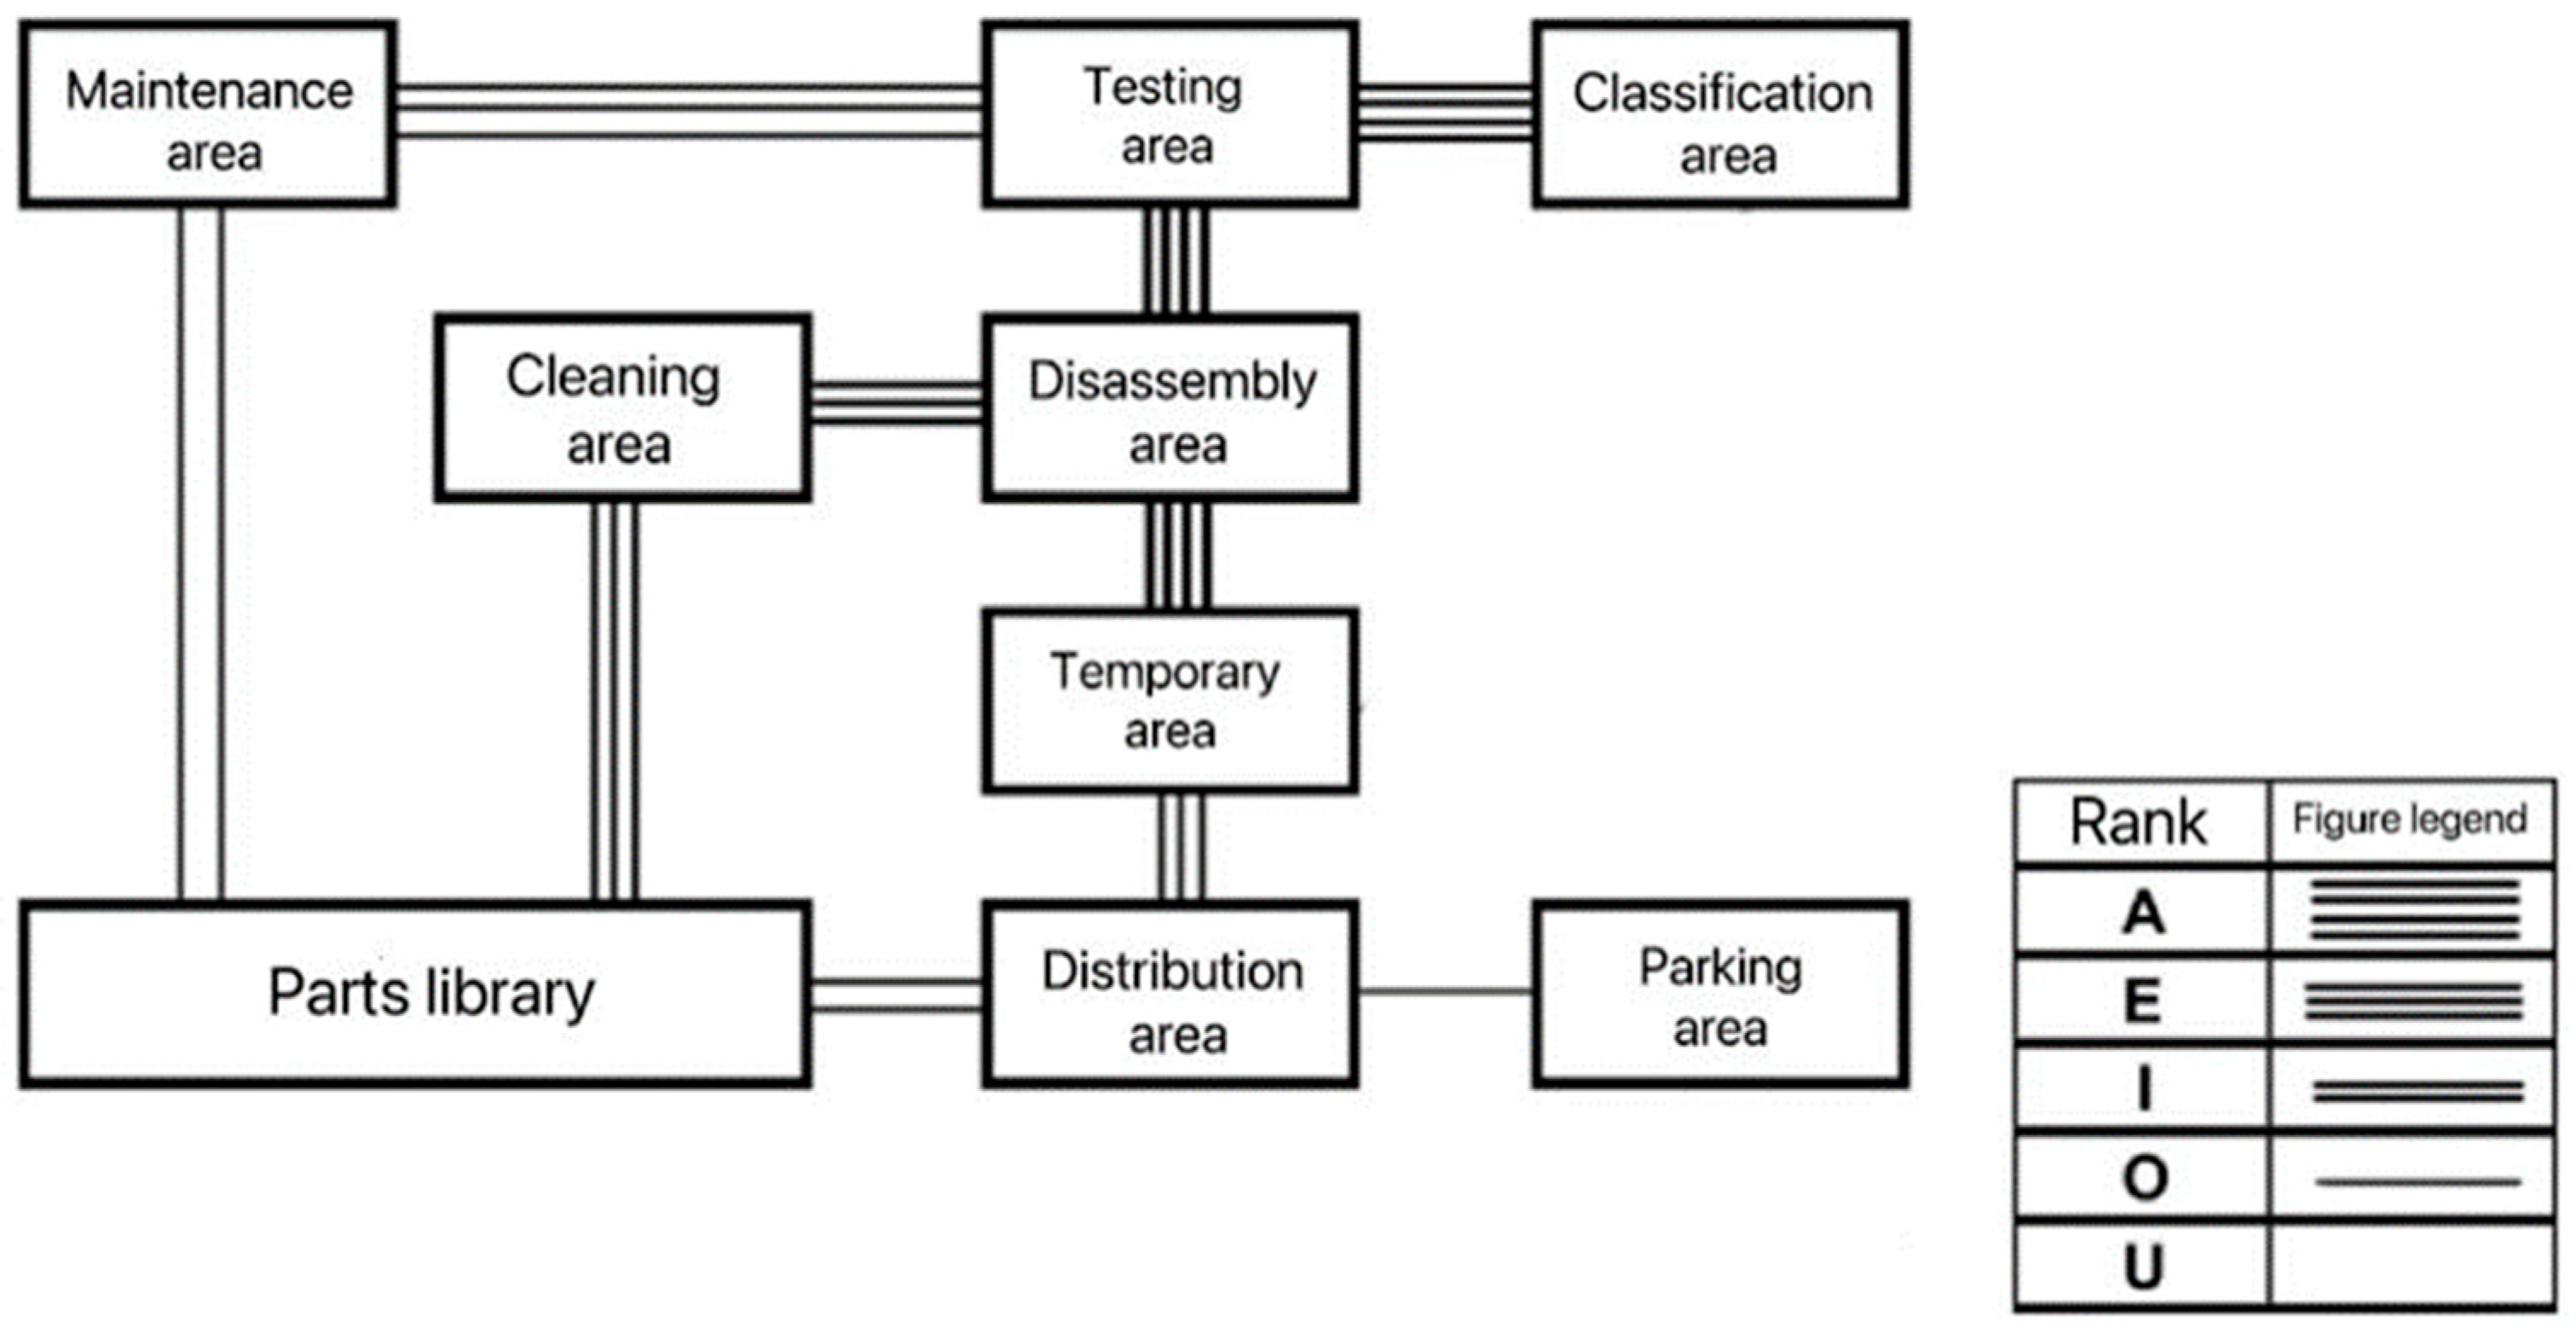
- Location correlation diagram between each functional area
- (4)
- Area of each functional area of the disassembly line
- Area calculation of classification area and distribution area
- Area calculation of temporary storage area and parts area
- Area calculation of parking area
- Area calculation of operation area
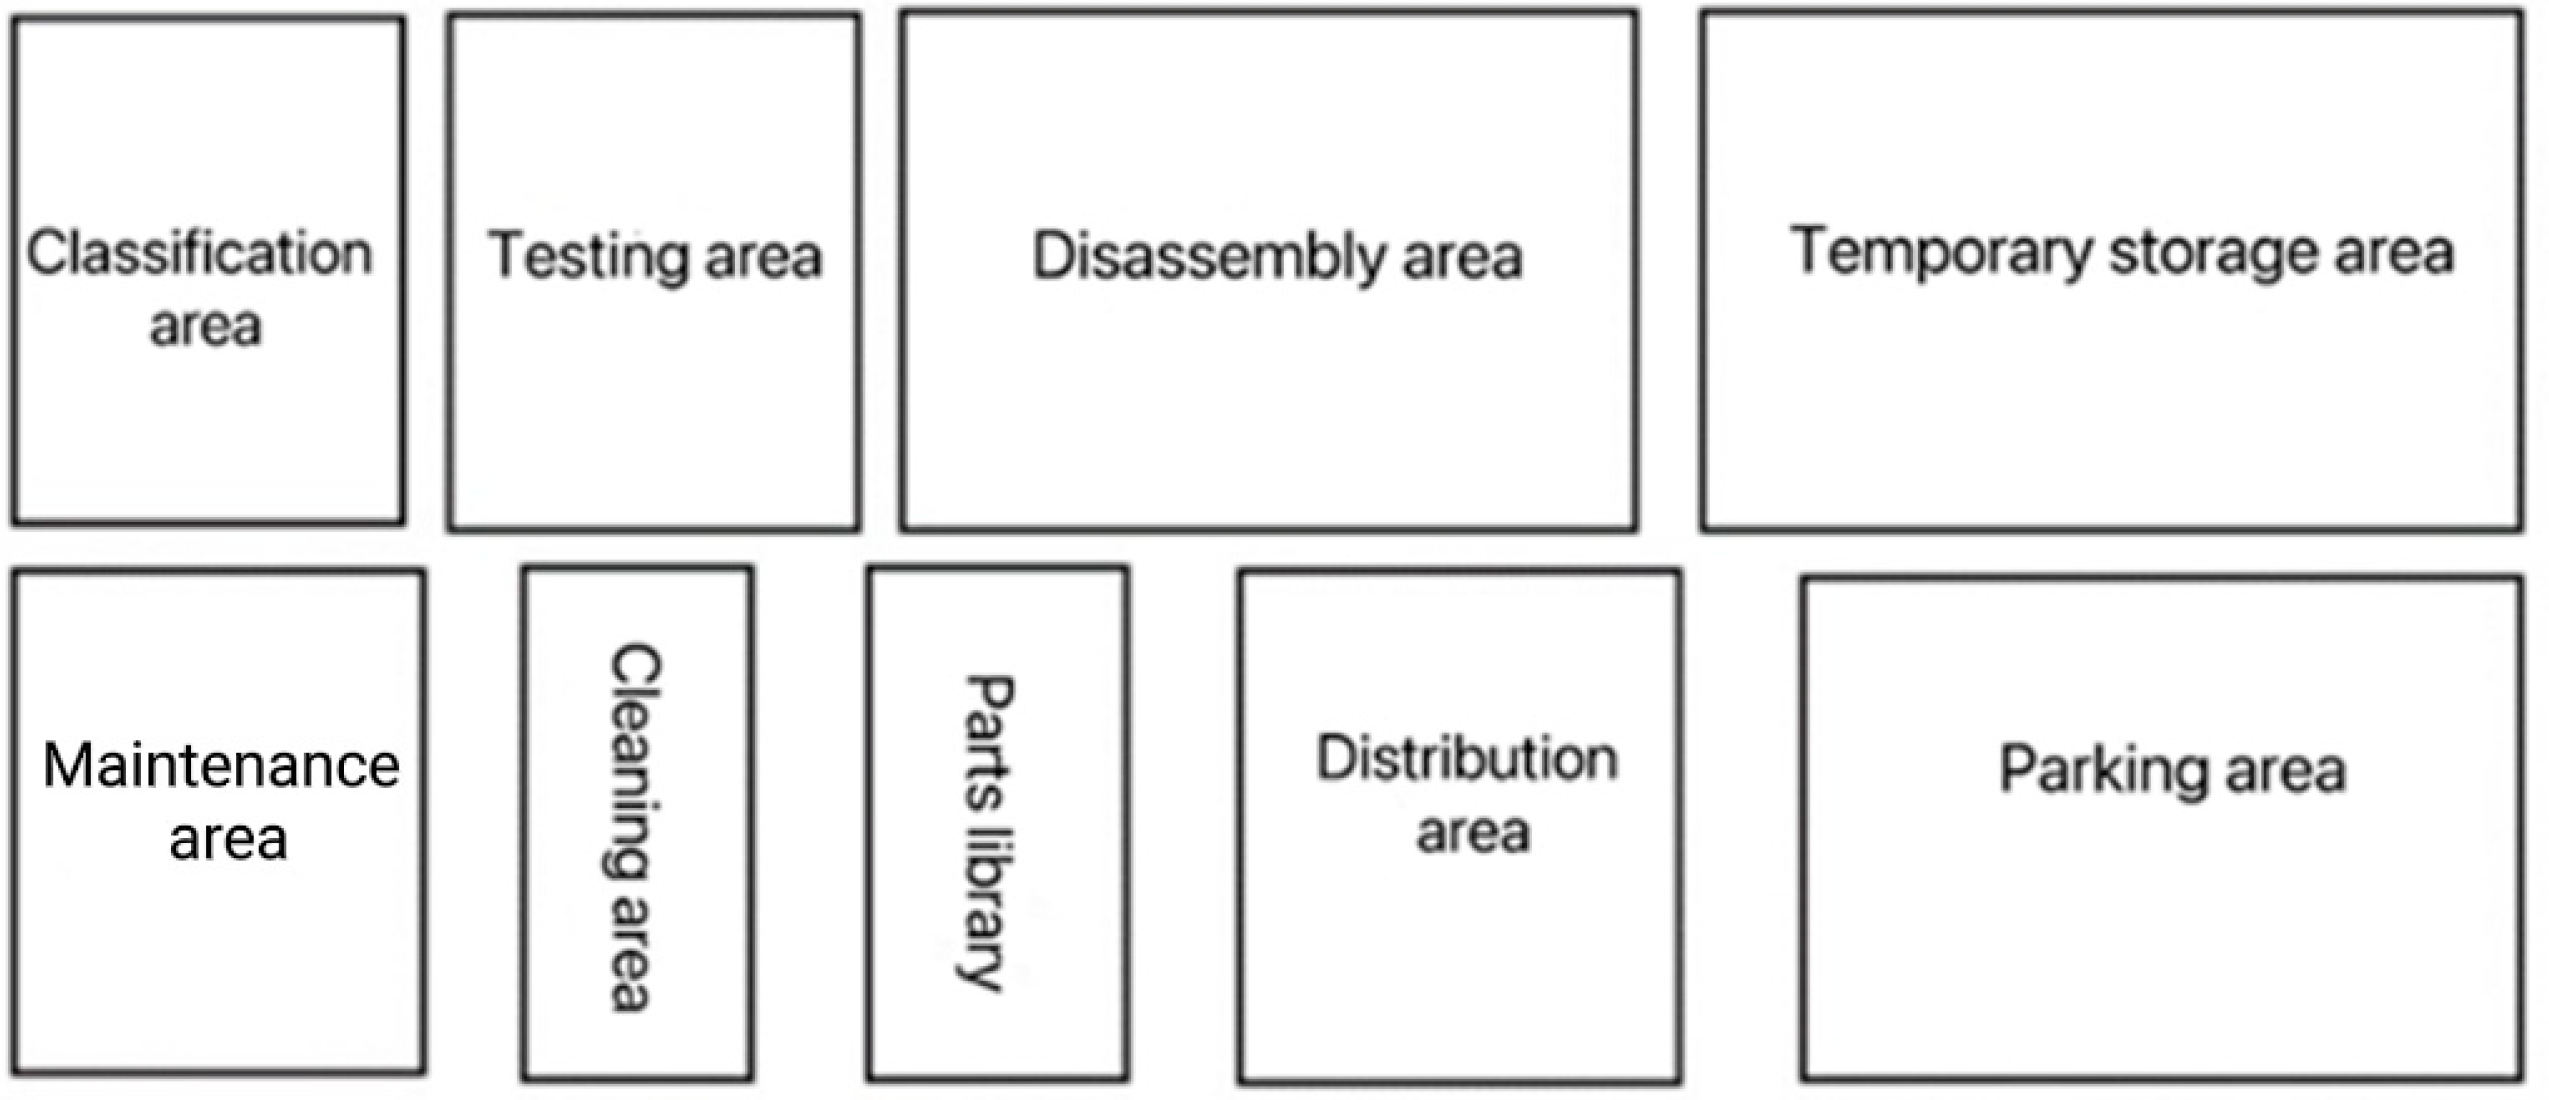
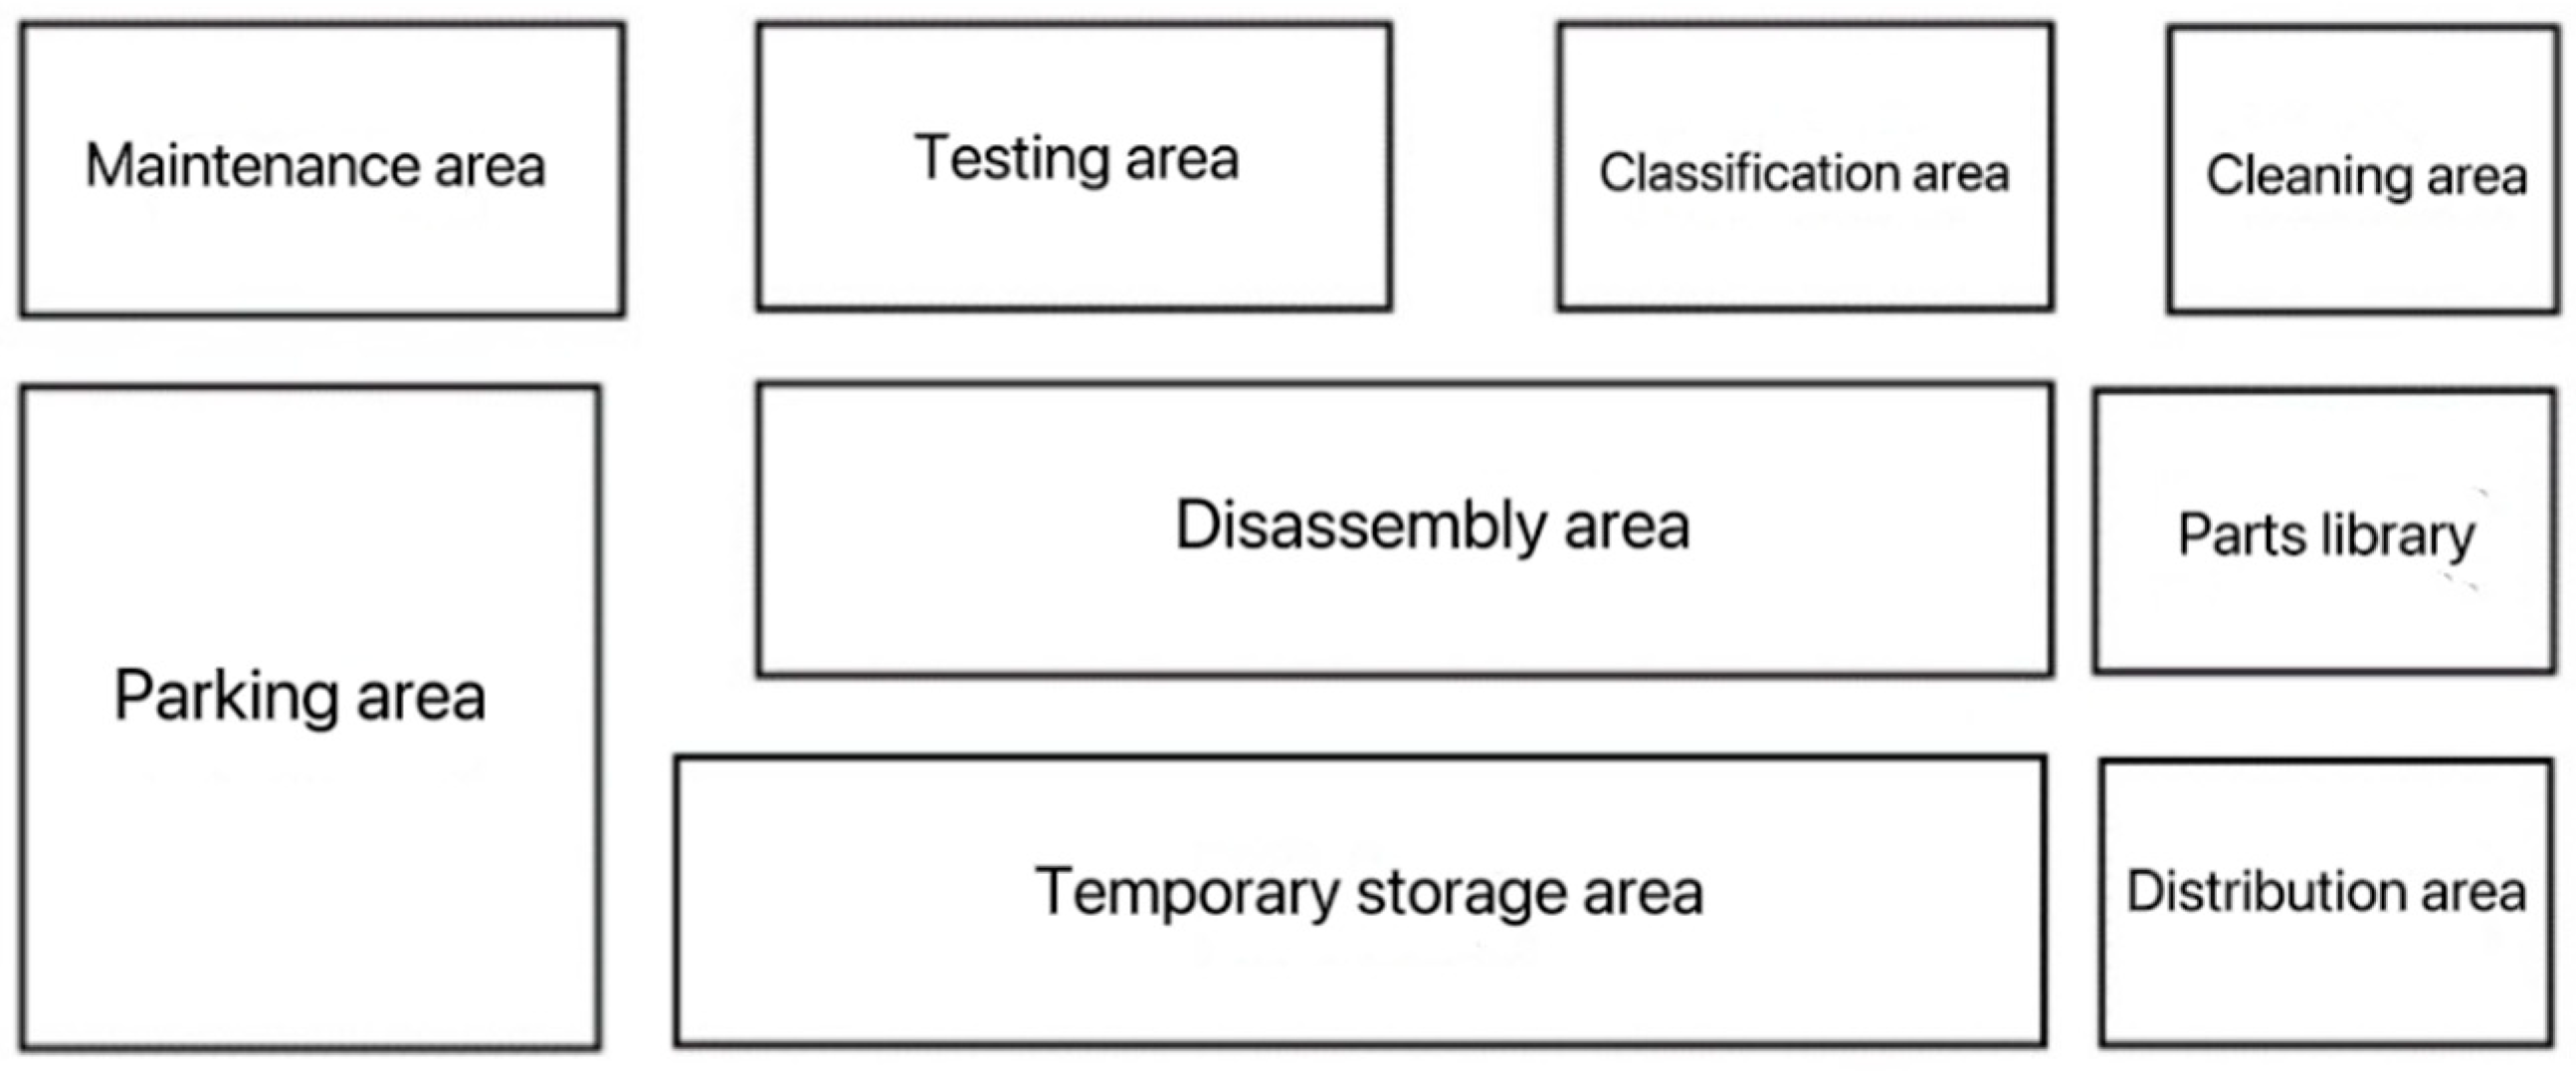
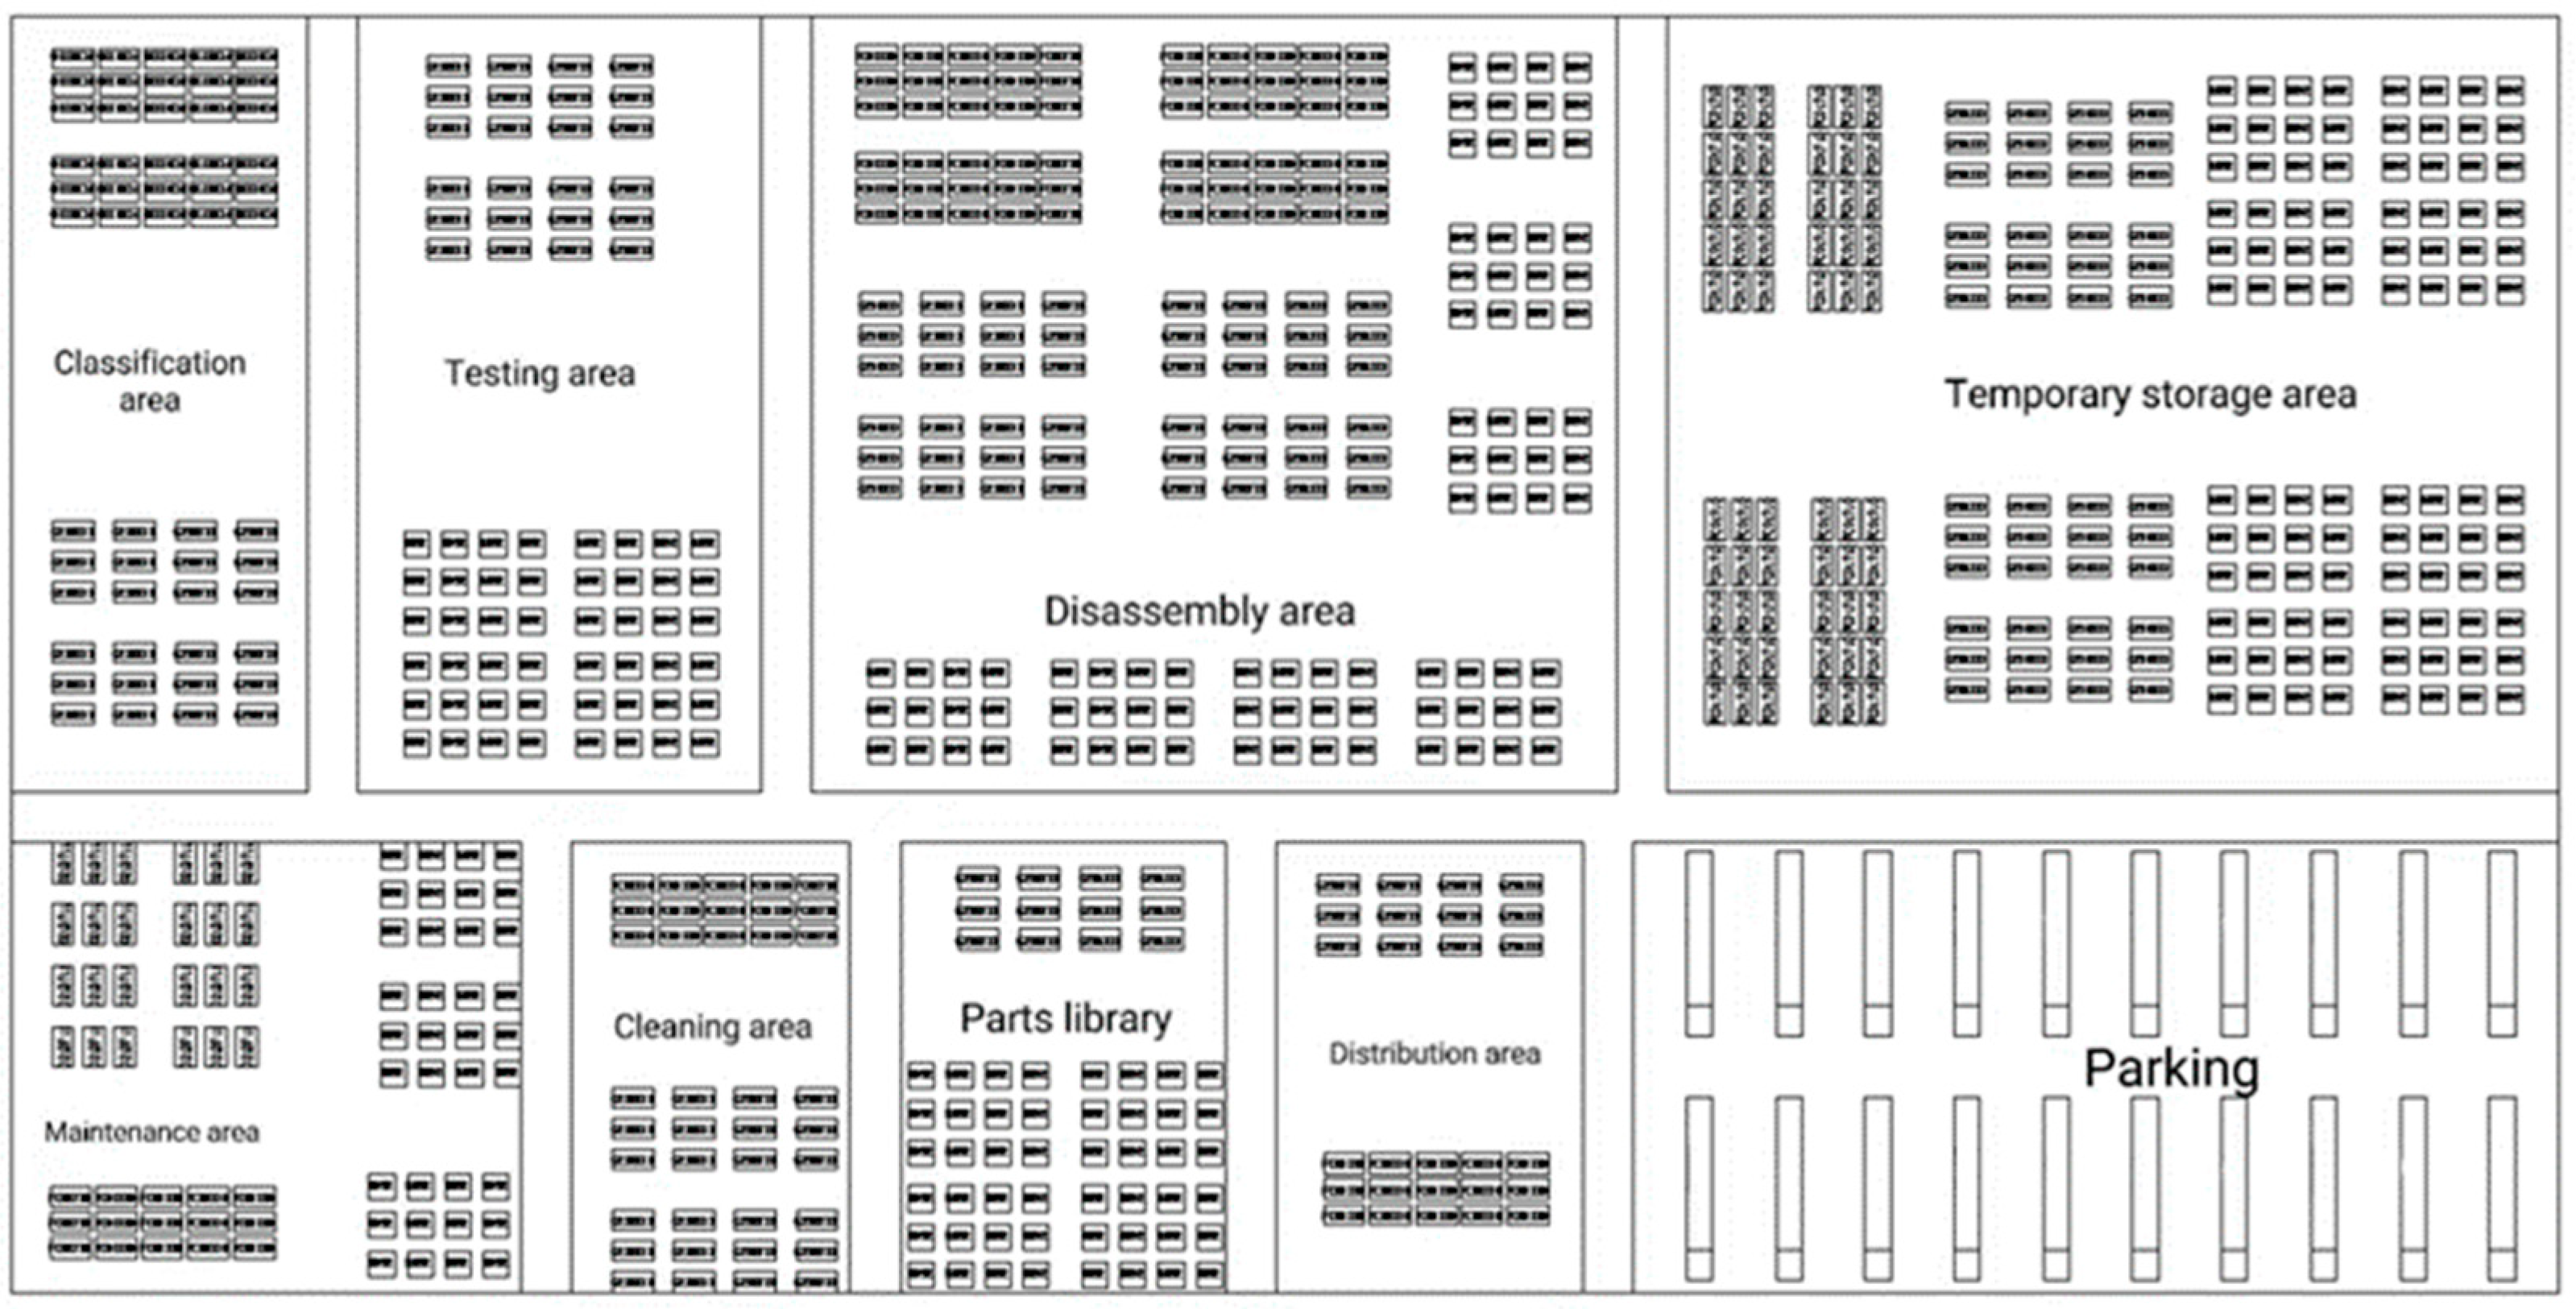
3.4. Initial Layout Scheme of the Disassembly Line
4. Simulation Analysis of Low Carbon Disassembly Line Layout Scheme Based on Flexsim
4.1. Preparation of Flexsim Simulation Data
- (1)
- The disassembly line is equipped with three forklifts and three operators for the simple transfer of goods and the start-up and operation of the equipment. According to the general running speed of forklifts and the moving speed of operators, the maximum running speed of forklifts is 6 m/s and the moving speed of operators is 2 m/s.
- (2)
- A total of two task dispensers for the forklift and operator, respectively, are installed to issue tasks for the operator or forklift.
- (3)
- The generator is set at the beginning of the disassembly line operation process, i.e., the sorting area, as the initial port for the recyclables to arrive at the disassembly line. The time distribution of the arrival of the recyclables at the starting point is set to obey the Poisson distribution Poisson (10.0, 0) [30,31,32,33,34].
- (4)
- The processors are operated by operators, and each processor corresponds to one operator and is set up as one inspection zone, one maintenance zone, and one cleaning zone. The operator presets and processes the recyclables through the processor, and then transports them to the next functional area by forklift after processing. The specific duration and staffing are shown in Table 10.
- (5)
- The decomposer is set in the disassembly area for decomposing the recyclables. The disassembler is operated by two operators at the same time, and the preset time is two. The processing time is randomly distributed in (8, 12). After disassembling, it is then transported to the next functional area by forklift in proportion to the material flow.
- (6)
- The temporary storage area and parts store are simulated as temporary storage areas because they assume temporary storage functions, and the recyclables are transported by forklift from the previous link. The temporary storage area and the parts store are set up for batch operation according to a certain waiting time, as shown in Table 11.
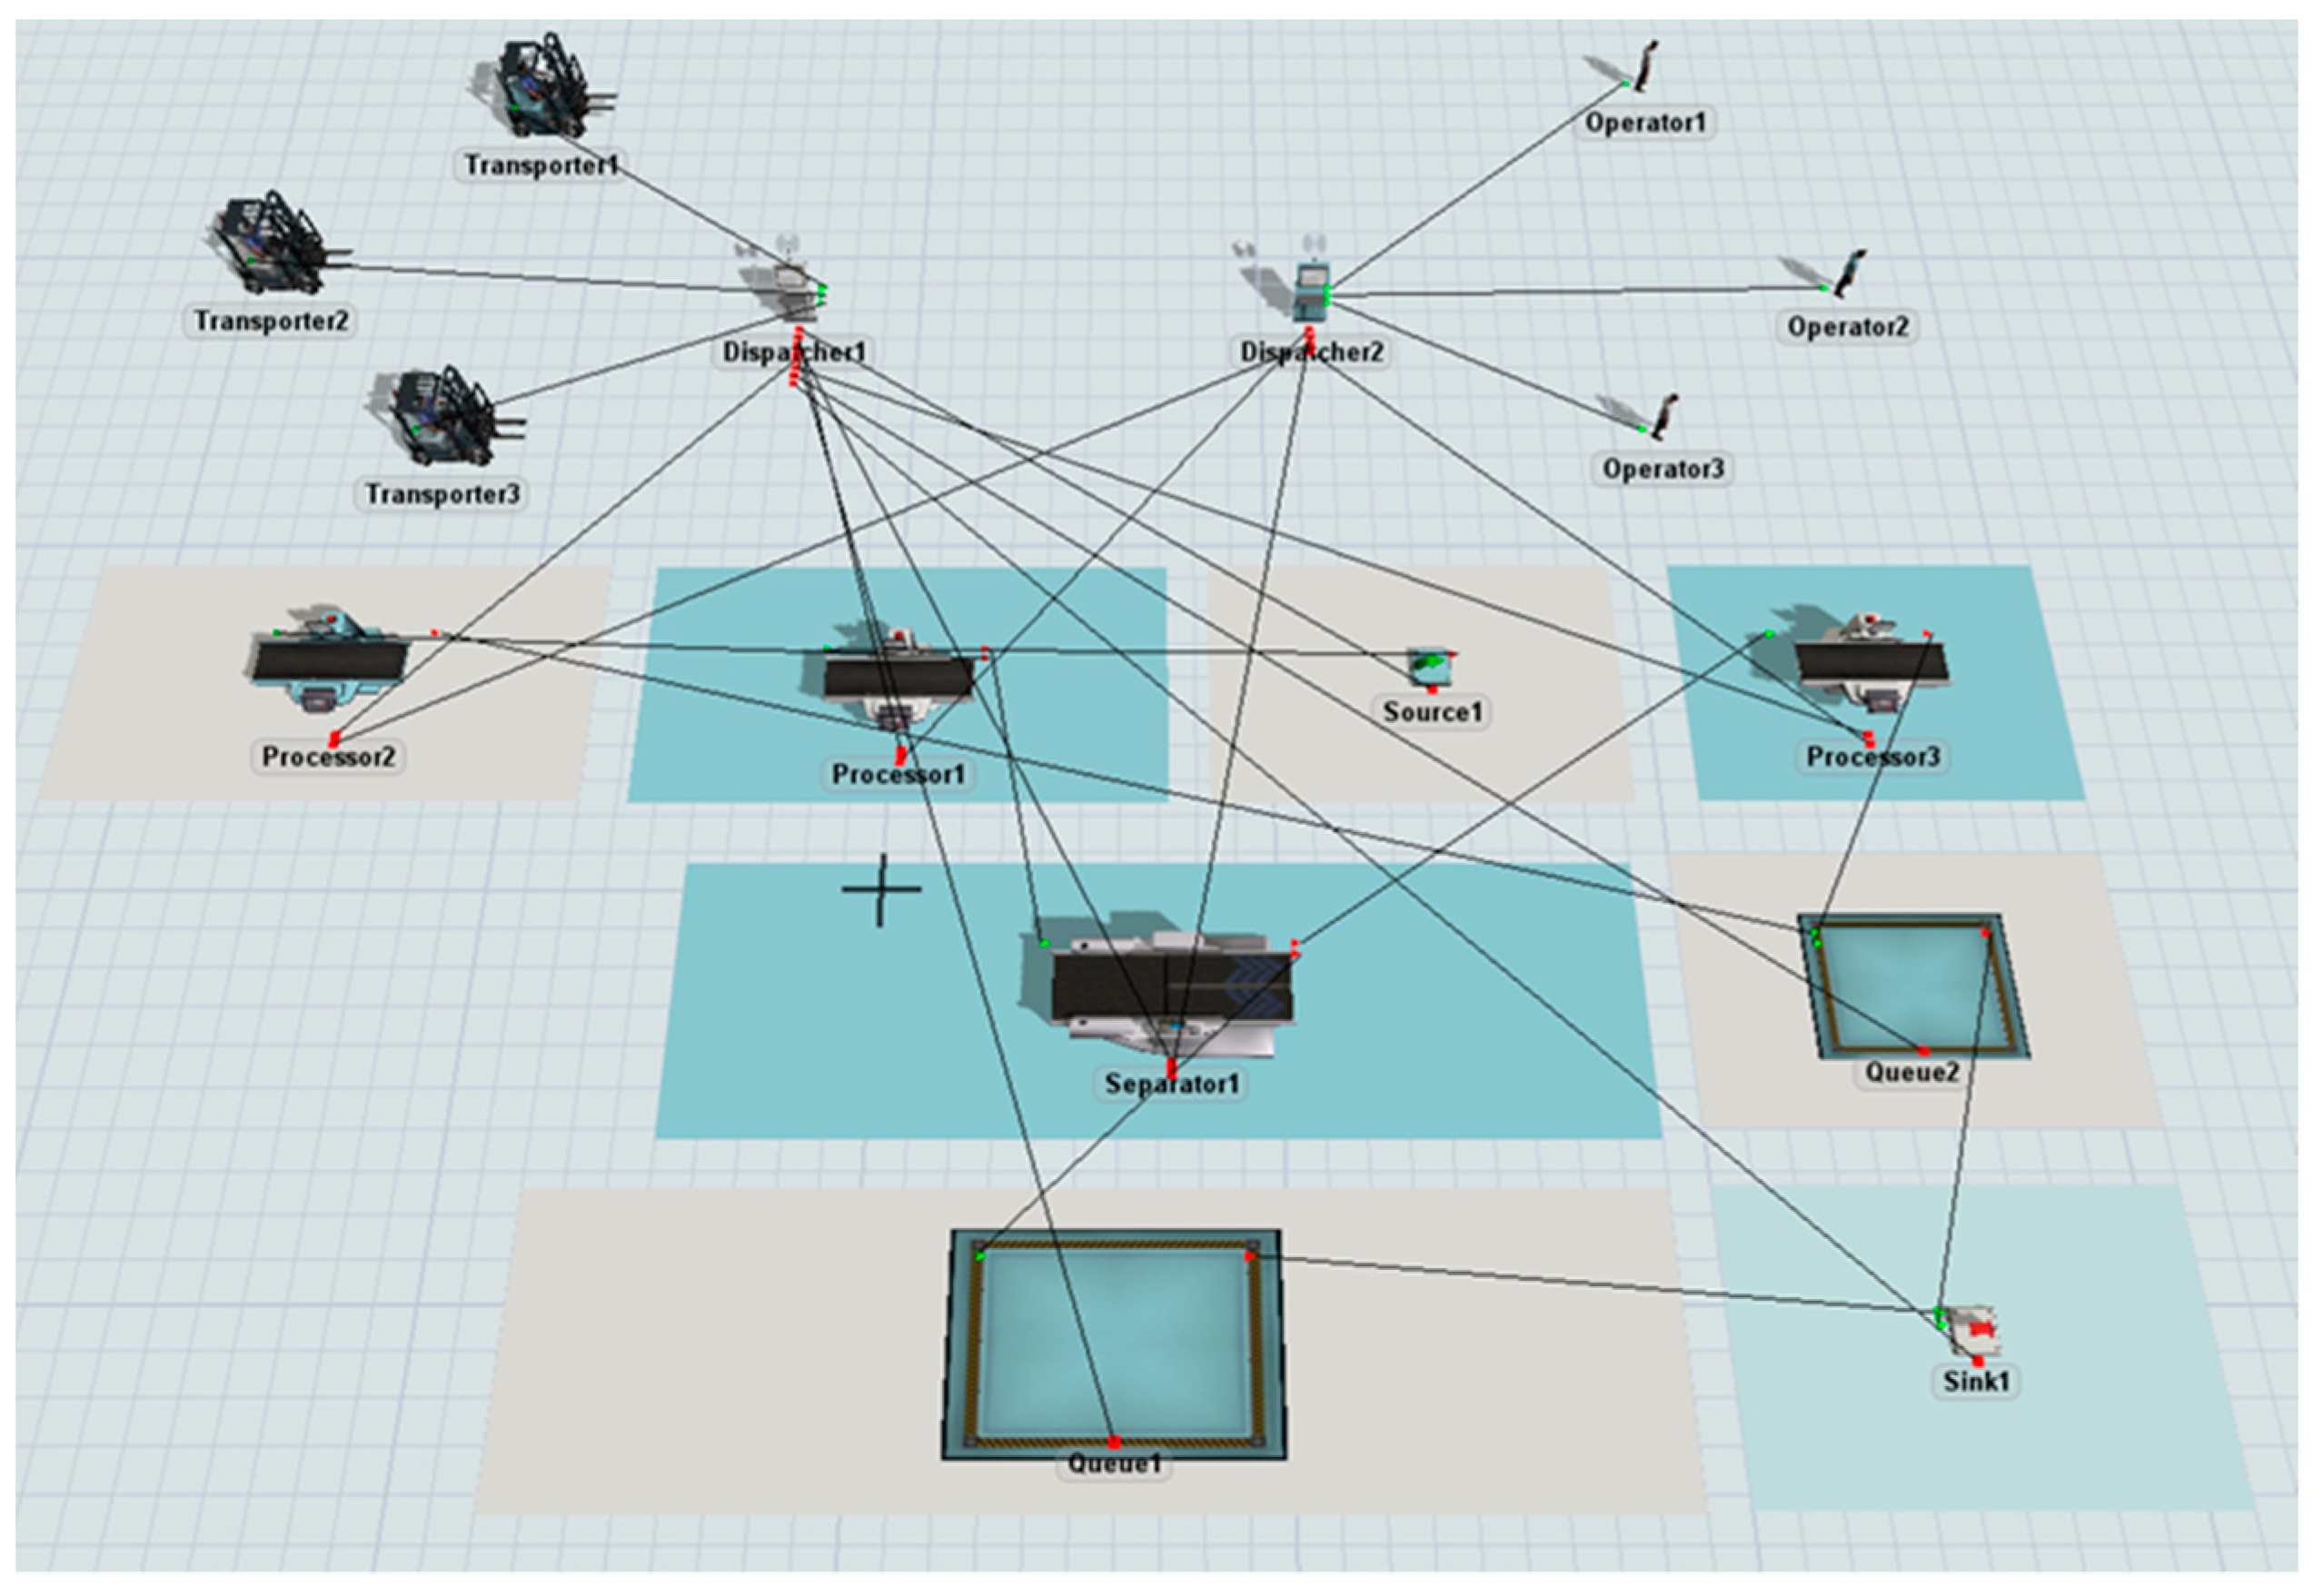
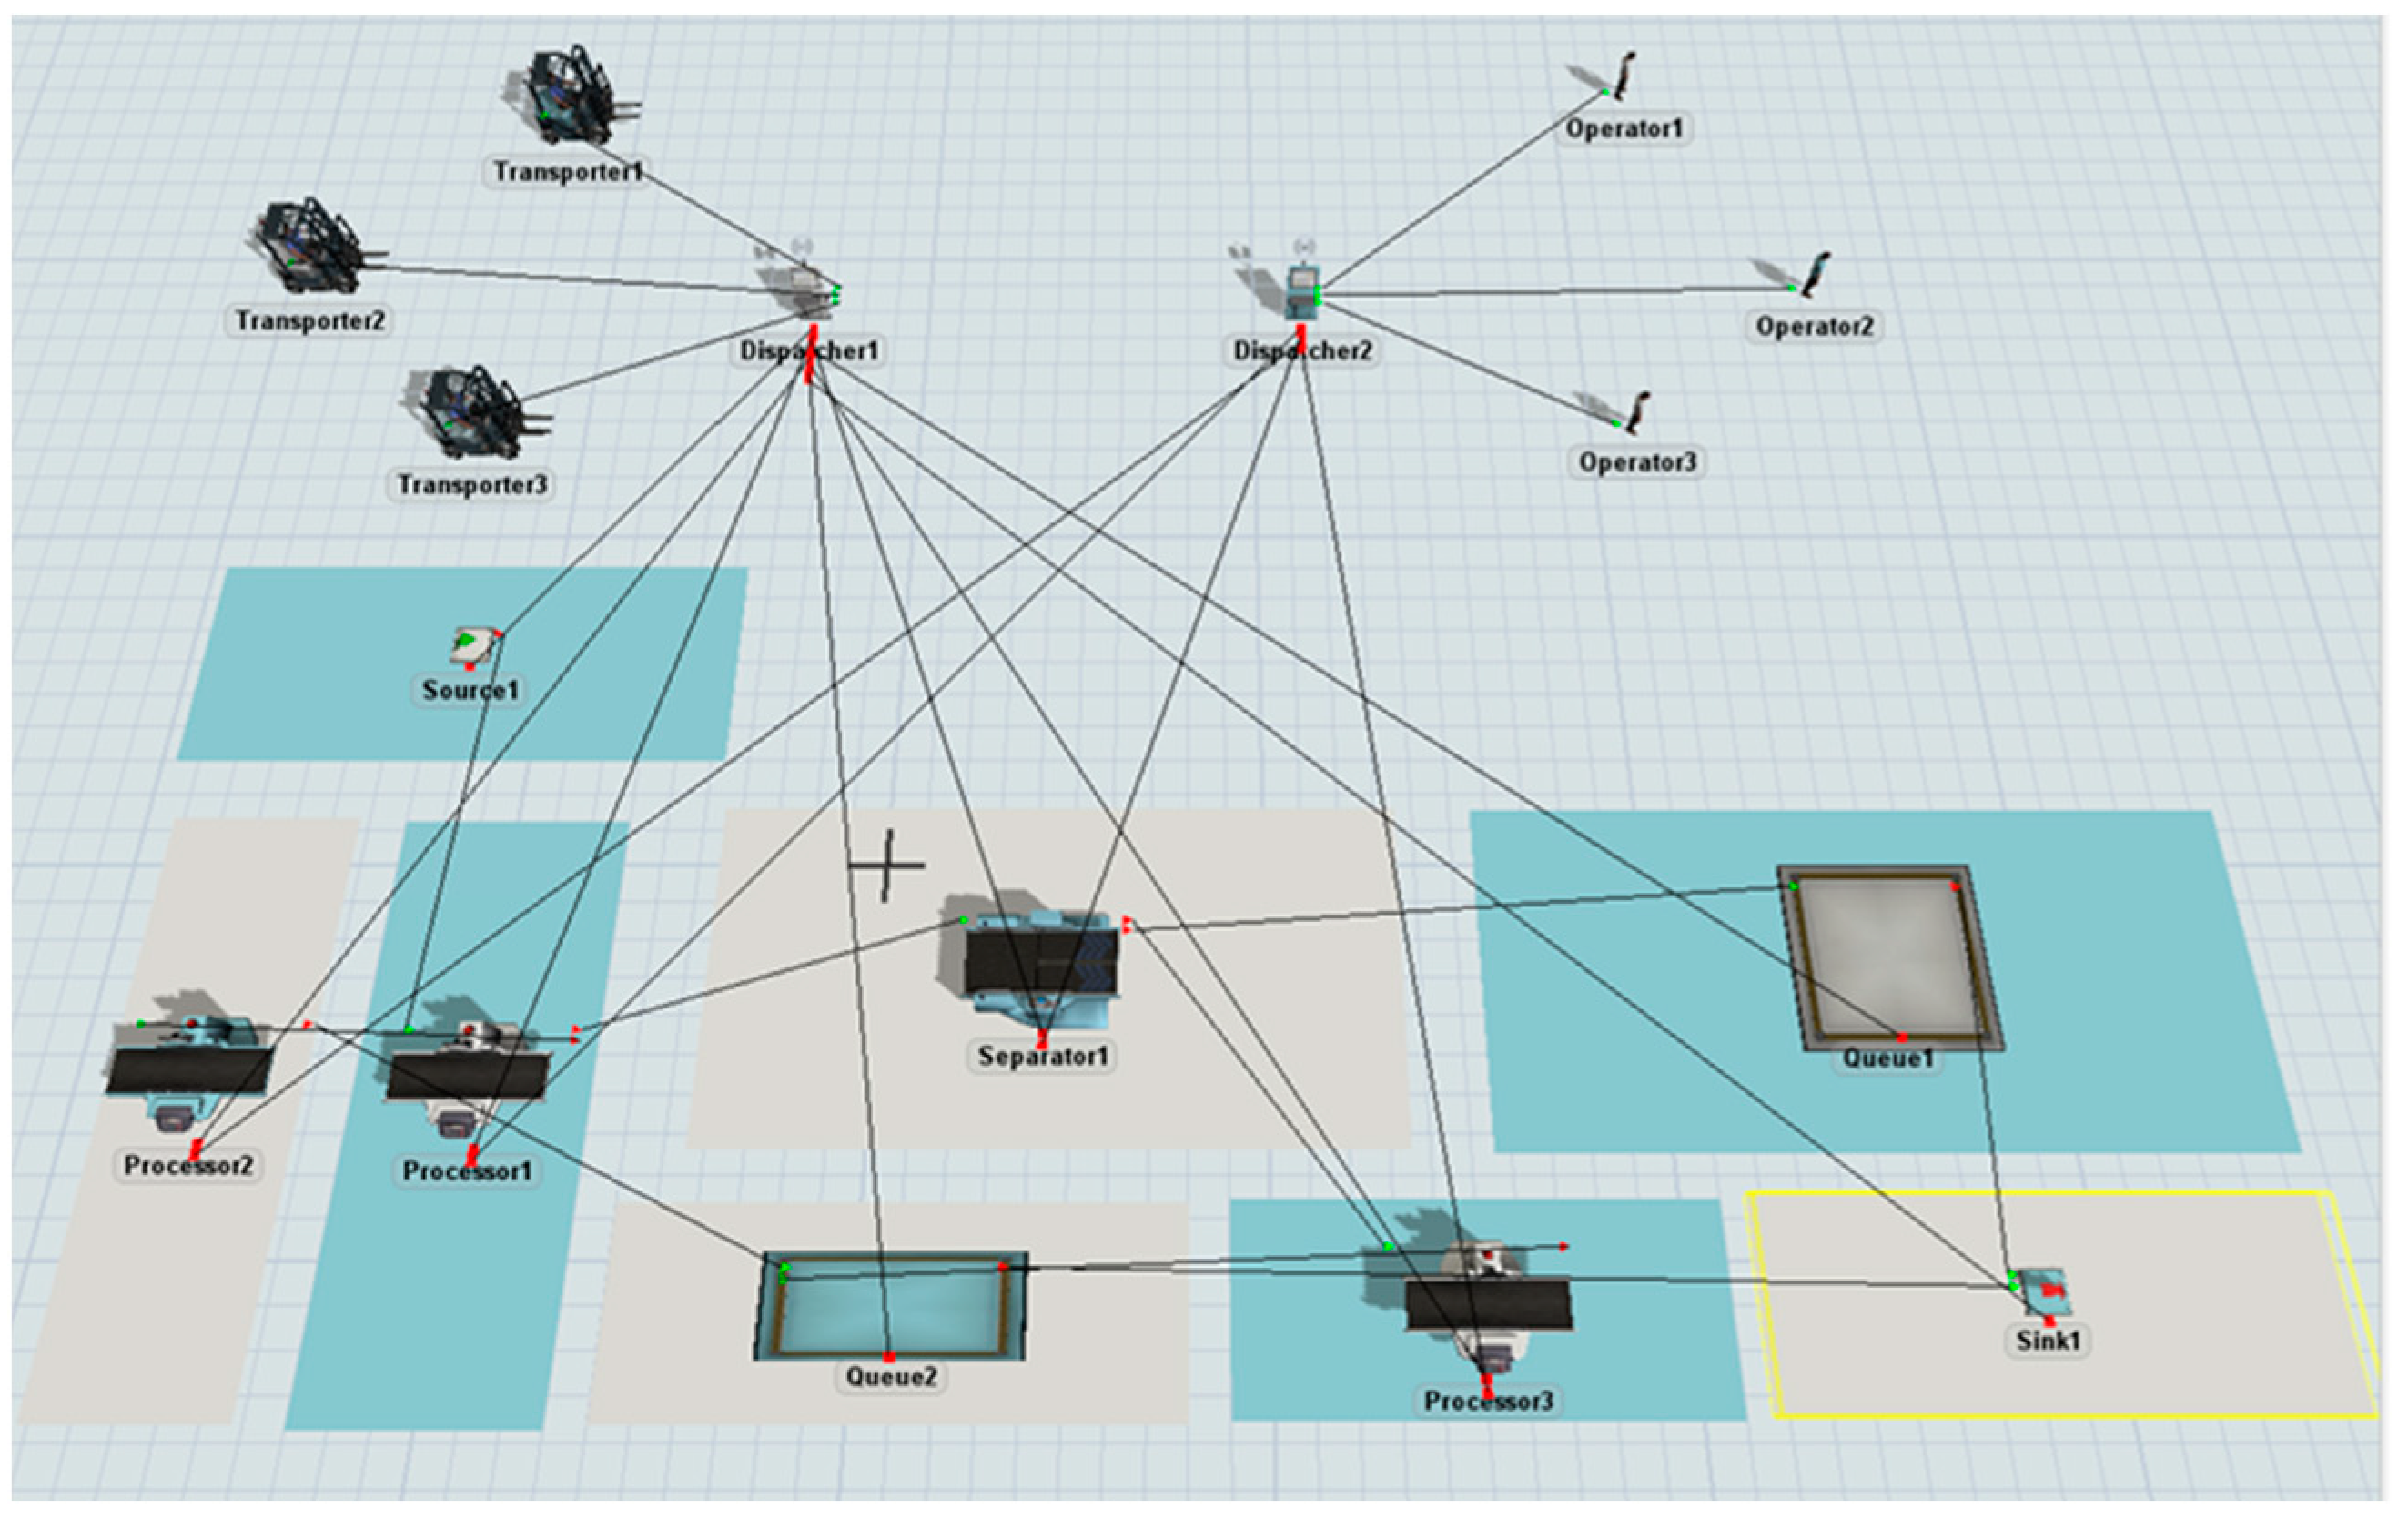
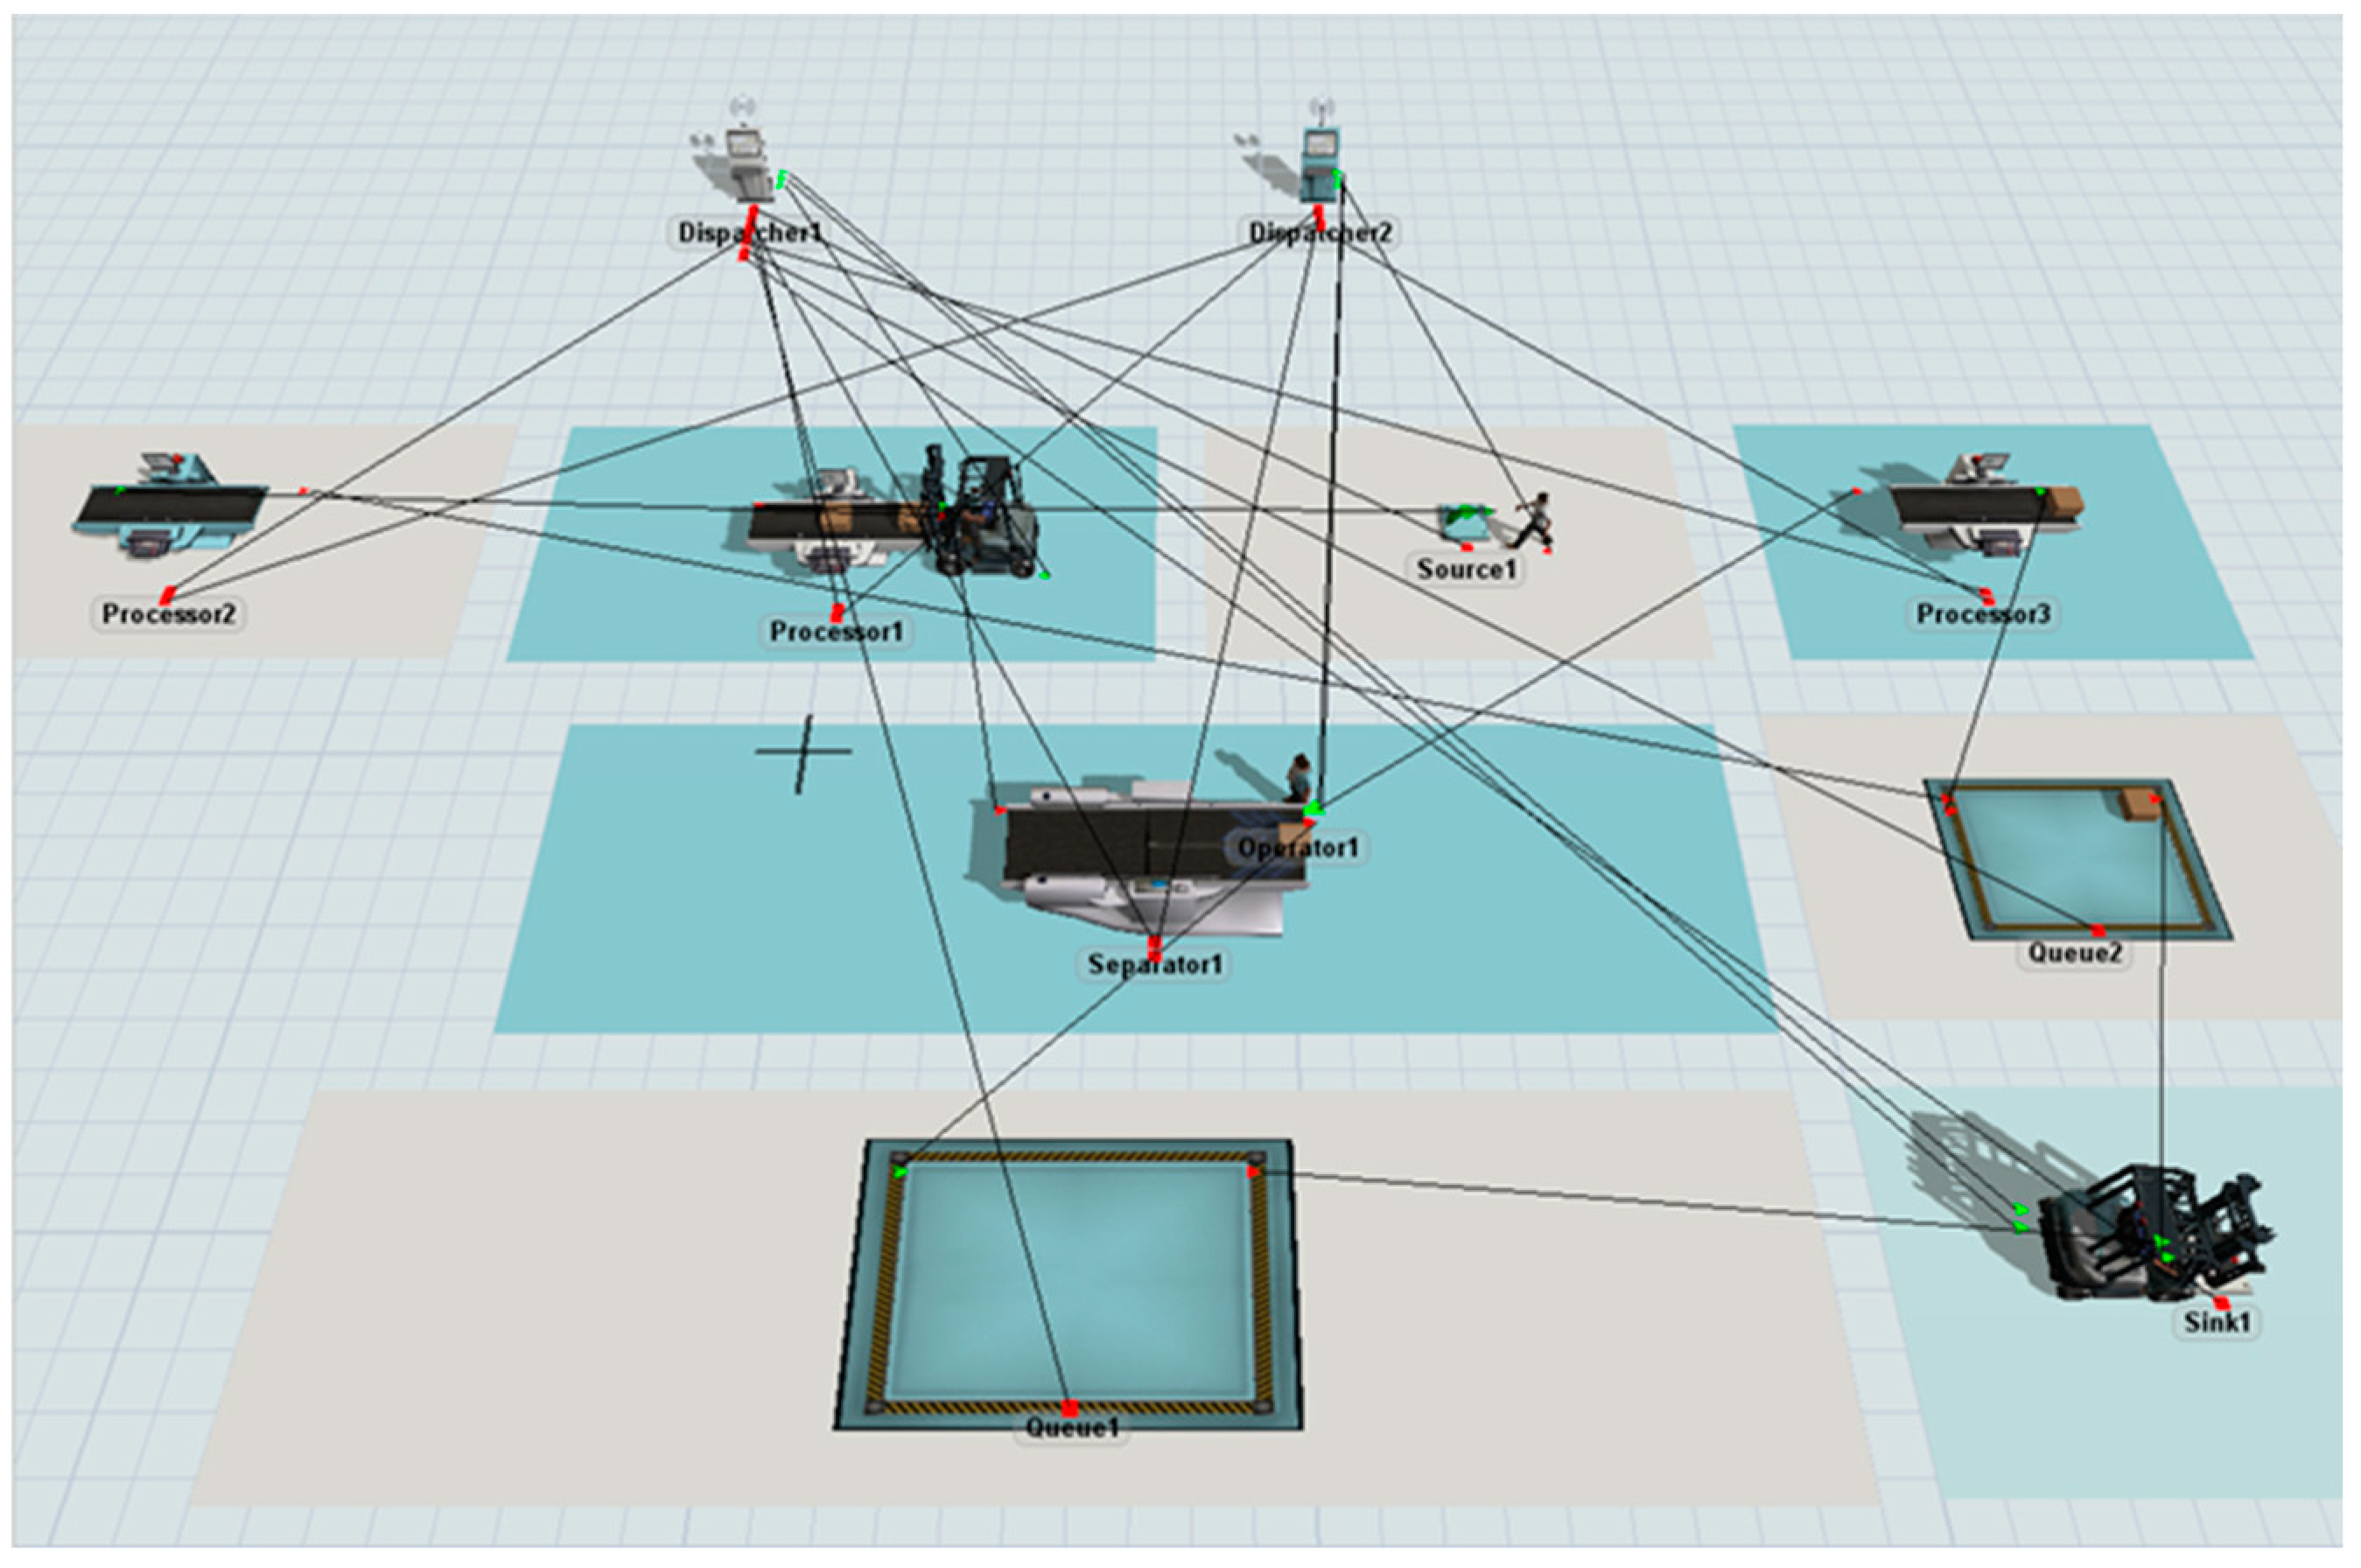
4.2. Initial Layout Scenario Modeling and Operation
4.3. Analysis of Modeling and Simulation Results
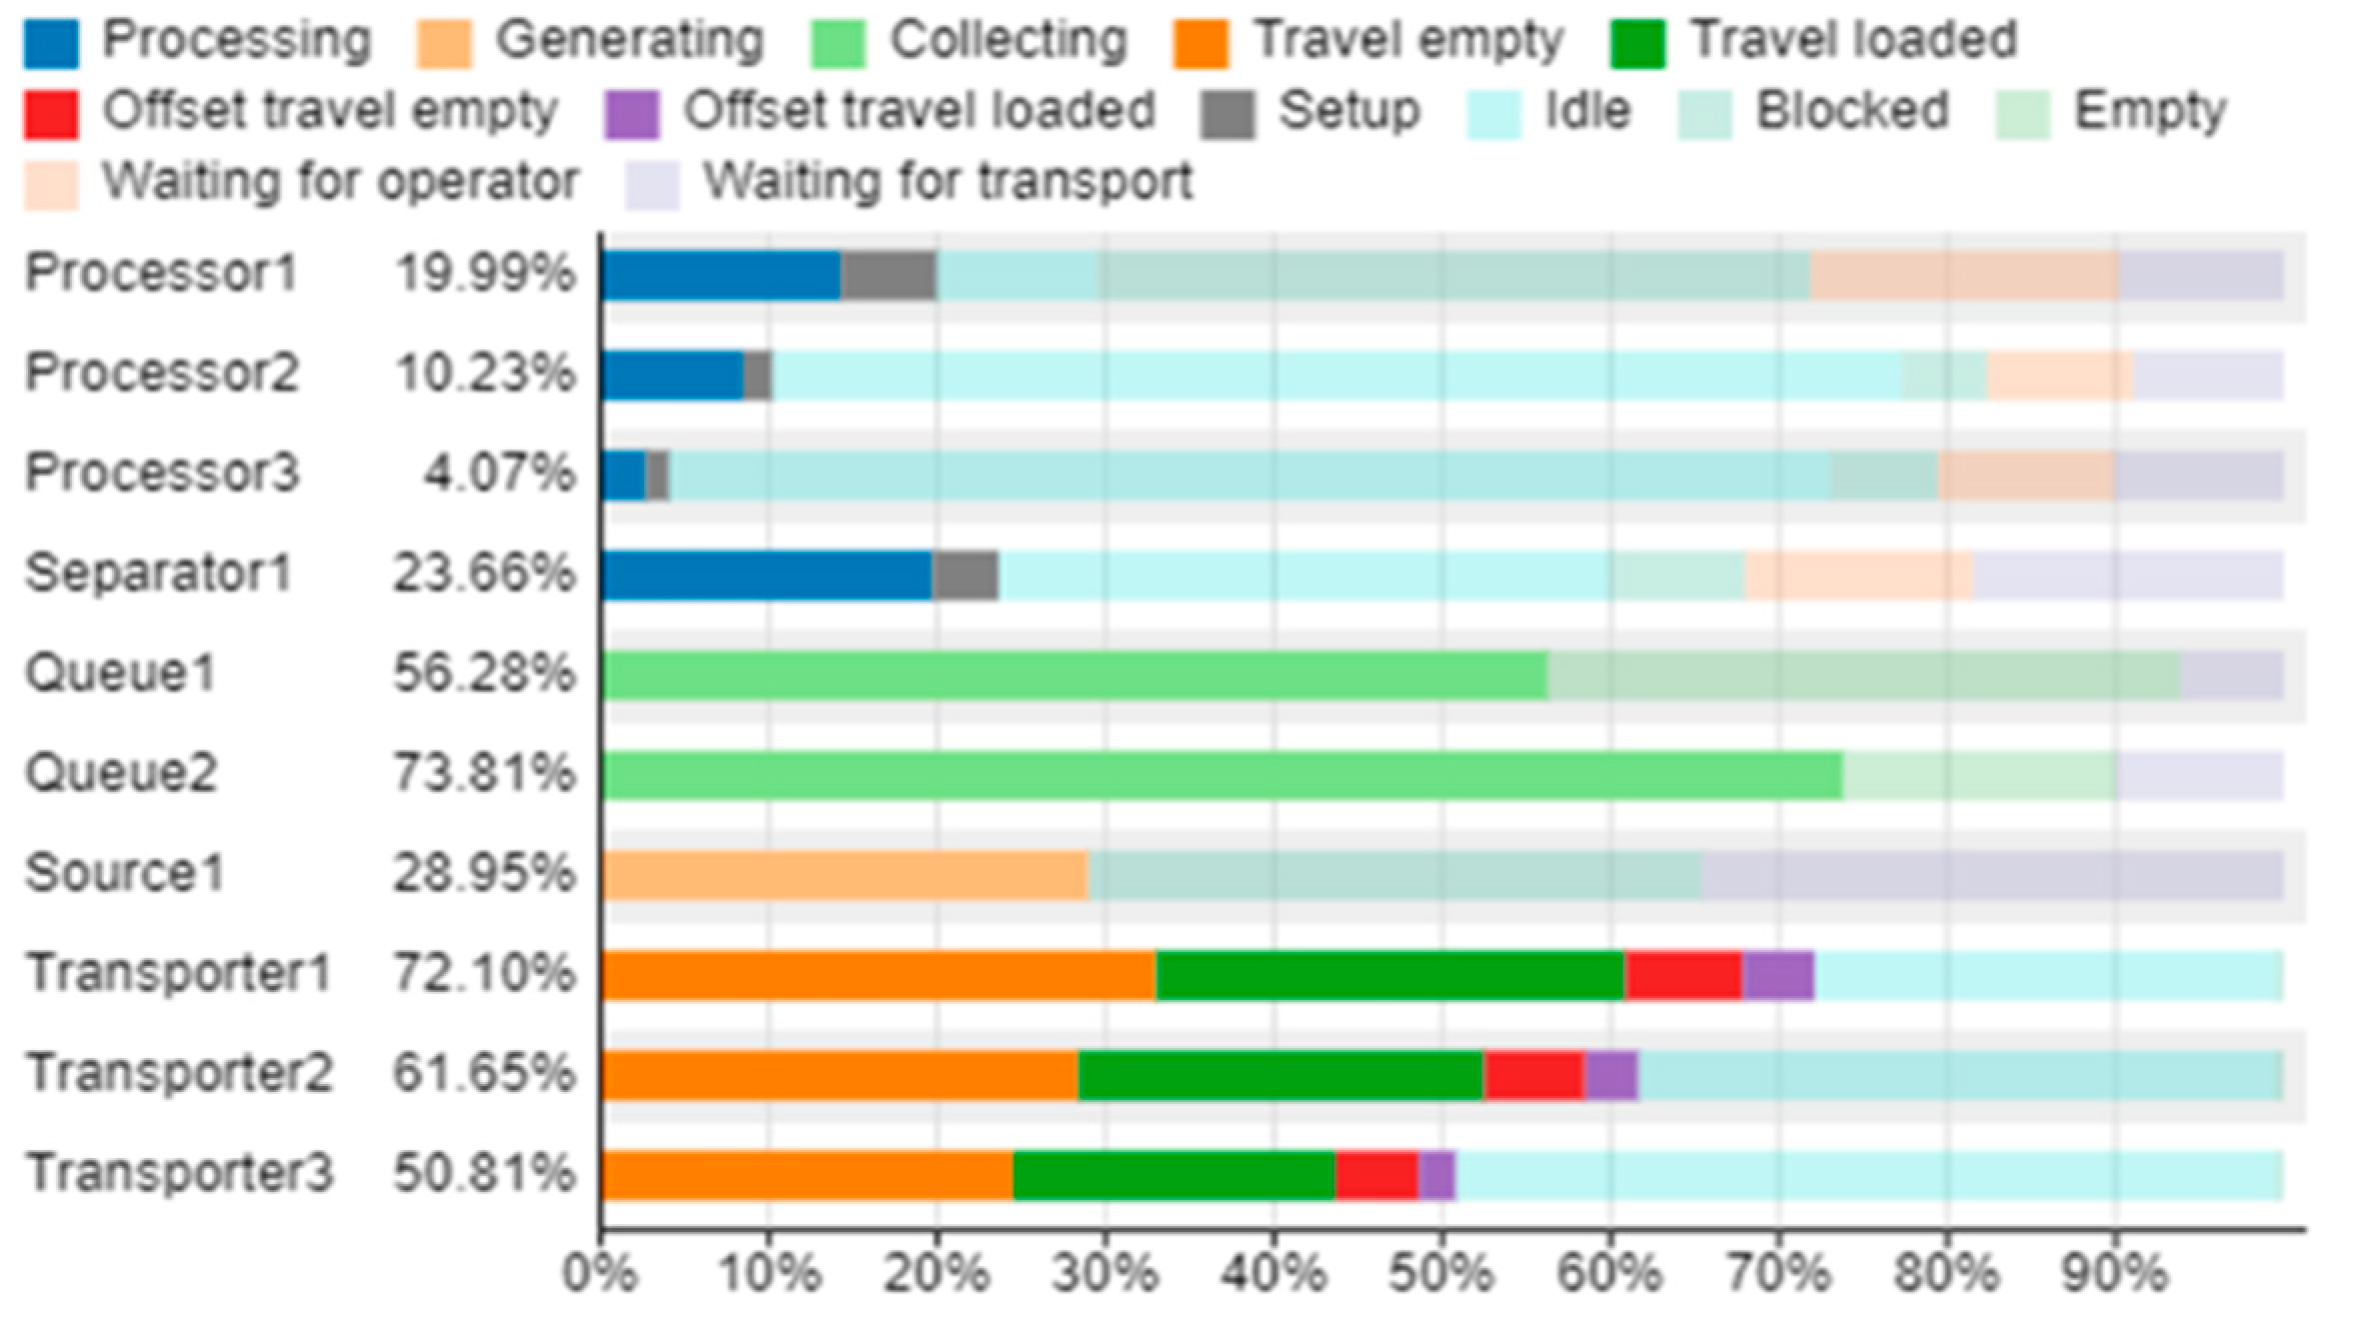
Simulation Data Analysis of Each Scenario
- (1)
- Dwell the time of each piece of equipment
- (2)
- Forklift and operator moving distance
- (3)
- Equipment waiting time (Waiting for Operator/ Transport)
- (4)
- Forklift idling time
- (5)
- Equipment blocking time
5. Carbon Emission Analysis with Low Carbon as the Goal
5.1. Analysis of Variable Carbon Emissions for Each Scenario
5.2. Selection of the Optimal Solution for the Disassembly Line
5.2.1. Low Carbon Disassembly Line Layout Evaluation Index Weights Determination
5.2.2. Evaluation of Weighted Gray Correlation Analysis Method
- (1)
- Determining the reference series and comparison series
- (2)
- Dimensionless processing
- (3)
- Gray correlation coefficient ξ
- (4)
- Finding the correlation degree
- (5)
- Ranking
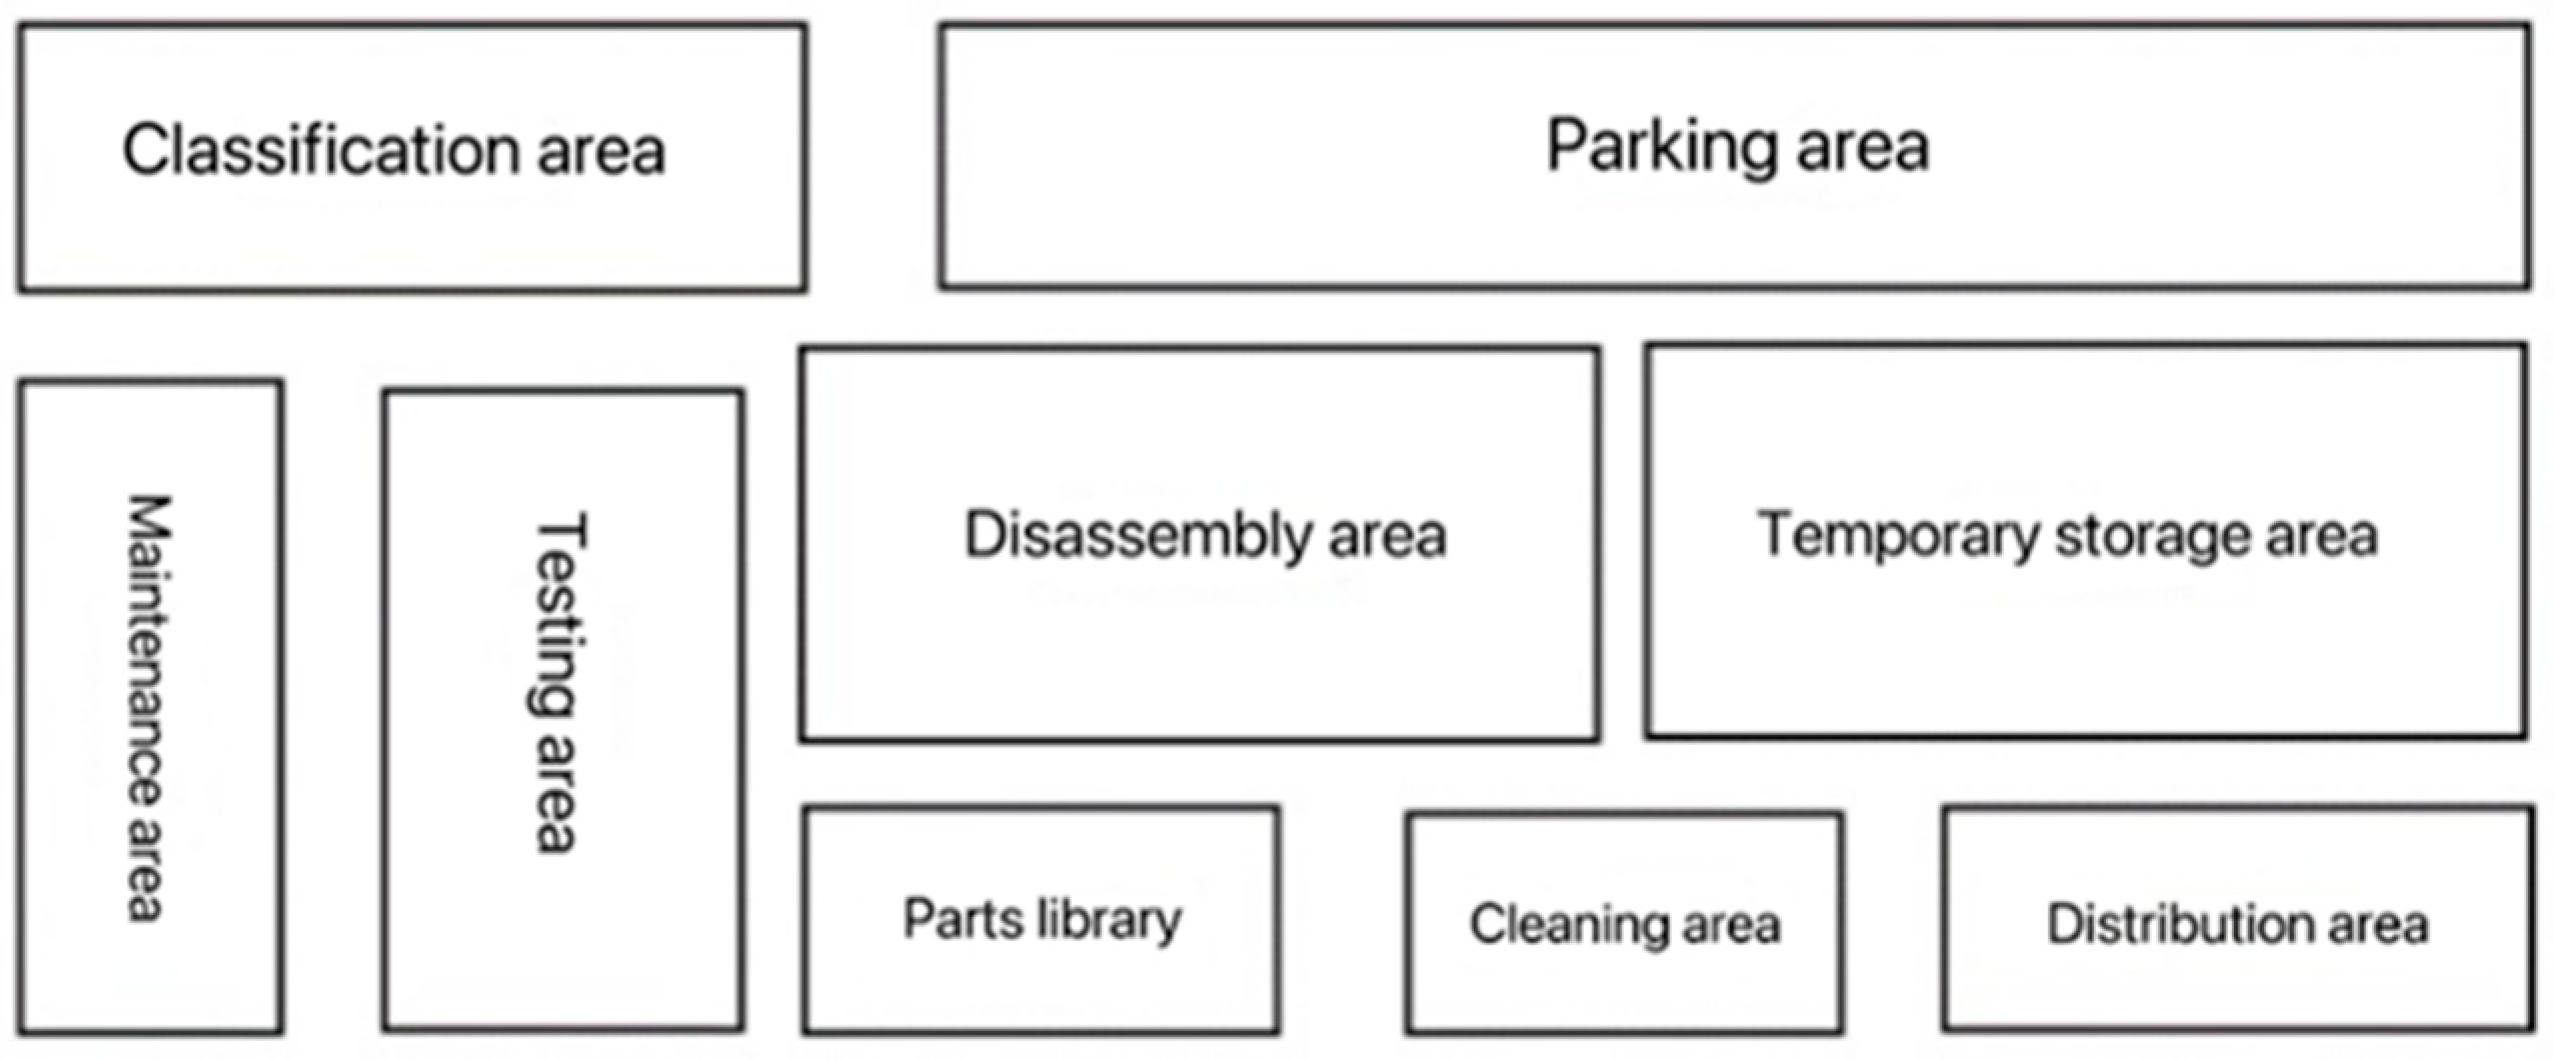
5.3. Analysis of the Optimal Disassembly Line Layout Scheme
5.4. Low-Carbon Disassembly Line Layout Optimization Safeguards
5.4.1. Introduction of Modern New Equipment
5.4.2. Training of Relevant Staff
6. Conclusions
Author Contributions
Funding
Institutional Review Board Statement
Informed Consent Statement
Data Availability Statement
Conflicts of Interest
References
- Zhou, Z.D.; Liu, J.Y.; Pham, D.T.; Xu, W.J.; Ramirez, F.J.; Ji, C.Q.; Liu, Q. Disassembly sequence planning: Recent developments and future trends. Proc. Inst. Mech. Eng. Part B-J. Eng. Manuf. 2019, 233, 1450–1471. [Google Scholar] [CrossRef]
- Malekkhouyan, S.; Aghsami, A.; Rabbani, M. An integrated multi-stage vehicle routing and mixed-model job-shop-type robotic disassembly sequence scheduling problem for e-waste management system. Int. J. Comput. Integr. Manuf. 2021, 34, 1237–1262. [Google Scholar] [CrossRef]
- Kumar, G.A.; Bahubalendruni, M.V.A.R.; Prasad, V.S.S.; Sankaranarayanasamy, K. A multi-layered disassembly sequence planning method to support decision making in de-manufacturing. Sadhana-Acad. Proc. Eng. Sci. 2021, 46, 102. [Google Scholar] [CrossRef]
- Wang, K.P.; Gao, L.; Li, X.Y.; Li, P.G. Energy-efficient robotic parallel disassembly sequence planning for end-of-life products. IEEE Trans. Autom. Sci. Eng. 2022, 19, 1277–1285. [Google Scholar] [CrossRef]
- Xing, Y.F.; Liu, Q. Partial disassembly sequence planning based on Pareto ant colony algorithm. In Proceedings of the 28th Chinese Control and Decision Conference, Yinchuan, China, 28–30 May 2016. [Google Scholar]
- Xiao, Z.D.; Sun, J.N.; Shu, W.J.; Wang, T.W. Location-allocation problem of reverse logistics for end-of-life vehicles based on the measurement of carbon emissions. Comput. Ind. Eng. 2019, 127, 169–181. [Google Scholar] [CrossRef]
- Kilic, H.S.; Cebeci, U.; Ayhan, M.B. Reverse logistics system design for the waste of electrical and electronic equipment (WEEE) in Turkey. Resour. Conserv. Recycl. 2015, 95, 120–132. [Google Scholar] [CrossRef]
- Sangwan, K.S. Key activities, decision variables and performance indicators of reverse logistics. In Proceedings of the 24th CIRP Conference on Life Cycle Engineering (CIRP LCE), Kamakura, Japan, 8–10 March 2017. [Google Scholar]
- Babaeinesami, A.; Ghasemi, P.; Chobar, A.P.; Sasouli, M.R.; Lajevardi, M. A New wooden supply chain model for inventory management considering environmental pollution: A genetic algorithm. Found. Comput. Decis. Sci. 2022, 47, 383–408. [Google Scholar] [CrossRef]
- Ghasemi, P.; Khalili-Damghani, K.; Hafezolkotob, A.; Raissi, S. A decentralized supply chain planning model: A case study of hardboard industry. Int. J. Adv. Manuf. Technol. 2017, 93, 3813–3836. [Google Scholar] [CrossRef]
- Kusakci, A.O.; Ayvaz, B.; Cin, E.; Aydin, N. Optimization of reverse logistics network of end of life vehicles under fuzzy supply: A case study for Istanbul Metropolitan Area. J. Clean. Prod. 2019, 215, 1036–1051. [Google Scholar] [CrossRef]
- Liu, C.M. Clustering techniques for stock location and order-picking in a distribution center. Comput. Oper. Res. 1999, 26, 989–1002. [Google Scholar] [CrossRef]
- Ji, S.W.; Li, X.T.; Wang, Y. The research of order picking optimization based on Jointown Pharmaceutical Logistics Center. Appl. Mech. Mater. 2014, 701–702, 94–97. [Google Scholar] [CrossRef]
- Zhang, Q.; Jiang, C.S.; Zhang, J.; Wei, Y.G. Application of genetic algorithm in functional area layout of railway logistics park. Procedia-Soc. Behav. Sci. 2014, 138, 269–278. [Google Scholar] [CrossRef] [Green Version]
- Chittratanawat, S.; Noble, J.S. An integrated approach for facility layout, P/D location and material handling system design. Int. J. Prod. Res. 1999, 37, 683–706. [Google Scholar] [CrossRef]
- Lee, K.Y.; Han, S.N.; Roh, M.I. An improved genetic algorithm for facility layout problems having inner structure walls and passages. Comput. Oper. Res. 2003, 30, 117–138. [Google Scholar] [CrossRef]
- Liu, Y.; Zhao, Q. Research on logistics center layout based on SLP. Proceedings of China Modern Logistics Engineering; Springer: Berlin/Heidelberg, Germany, 2015; pp. 17–28. [Google Scholar]
- Ayvaz, B.; Bolat, B.; Aydin, N. Stochastic reverse logistics network design for waste of electrical and electronic equipment. Resour. Conserv. Recycl. 2015, 104, 391–404. [Google Scholar] [CrossRef]
- John, S.T.; Sridharan, R.; Kumar, P.N.R.; Krishnamoorthy, M. Multi-period reverse logistics network design for used refrigerators. Appl. Math. Model. 2018, 54, 311–331. [Google Scholar] [CrossRef]
- Kannan, D.; Garg, K.; Jha, P.C.; Diabat, A. Integrating disassembly line balancing in the planning of a reverse logistics network from the perspective of a third party provider. Ann. Oper. Res. 2017, 253, 353–376. [Google Scholar] [CrossRef]
- Zhang, L.; Zhao, X.K.; Ke, Q.D.; Dong, W.F.; Zhong, Y.J. Disassembly line balancing optimization method for high effciency and low carbon emission. Int. J. Precis. Eng. Manuf.-Green Technol. 2019, 8, 233–247. [Google Scholar] [CrossRef]
- Zhang, Z.W.; Guo, X.W.; Zhou, M.C.; Liu, S.X.; Qi, L. Multi-objective discrete grey wolf optimizer for solving stochastic multi-objective disassembly sequencing and line balancing problem. In Proceedings of the IEEE International Conference on Systems, Man, and Cybernetics (SMC), Toronto, ON, Canada, 11–14 October 2020. [Google Scholar]
- Yang, Y.S.; Yuan, G.; Zhuang, Q.W.; Tian, G.D. Multi-objective low-carbon disassembly line balancing for agricultural machinery using Mdfoa and fuzzy. Ahpjournal Clean. Prod. 2019, 233, 1465–1474. [Google Scholar] [CrossRef]
- Viswanathan, S.; Allada, V. A framework for the flexible grouping of products for disassembly. J. Electron. Manuf. 1999, 9, 53–66. [Google Scholar] [CrossRef] [Green Version]
- Zheng, Y.; Zhan, B. SLP-based layout optimization of logistics workshop facilities of Huai’an courier post. In Proceedings of the 3rd Int Conference Transportation Information Safety, Wuhan, China, 25–28 June 2015. [Google Scholar]
- Lan, X.J.; Wang, Y.L.; Shen, M.M. SLP analysis on manufacturing enterprise’s facility layout. In Proceedings of the 5th International Conference on Material Handling, Chongqing, China, 1–3 November 2005. [Google Scholar]
- Tang, H.T.; Lan, X.J.; Chen, Y. Case study: SLP analysis about plant facility layout and its optimization scheme. In Proceedings of the 5th Wuhan International Conference on E-Business, Wuhan, China, 27–28 May 2006. [Google Scholar]
- Zhang, F.; Zhang, J.G.; Bai, J.; Jiang, M.; Xiong, Q.; Zhou, Z.S.; Zhang, X.D. Optimization analysis of eatery facilities layout based on SLP and dynamic simulation. In Proceedings of the 15th International Conference on Industrial Engineering and Engineering Management, Zhengzhou, China, 20–22 September 2008. [Google Scholar]
- Zhang, W.M.; Du, Y.P.; Wang, X.H. Facility layout optimization design of a printing enterprise. In Proceedings of the 4th International Conference on Logistics, Informatics and Service Science (LISS), Beijing, China, 23–26 June 2014. [Google Scholar]
- Xu, M.Z.; Wang, Y.; Yang, H.G.; Wang, L.; Han, L.B.; Yu, H.Y.; Xu, W.T.; Ma, J. Simulation and optimization of intelligent workshop layout and logistics transportation by system layout planning combined with em-plant. In Proceedings of the 10th IEEE International Conference on Software Engineering and Service Science (ICSESS), Beijing, China, 18–20 October 2019. [Google Scholar]
- Zhang, Y.H.; Chau, S.P.; Wang, D. The research on optimization of plant layout of Viet Thinh Garment Company. In Management Engineering and Applications; Aussino Acad Publ Housepo Box 893: Marrickville, NSW, Australia, 2010; pp. 205–211. [Google Scholar]
- Liao, S.C.; He, W.; Zhou, H.L. Study on the layout planning and optimization for an electronic product workshop based on cell manufacturing. In Proceedings of the International Conference on Automation, Mechanical Control and Computational Engineering (AMCCE), Jinan, China, 24–26 April 2015. [Google Scholar]
- Wang, J.; Ke, X.S. Spatial layout optimization of warehouse based on improved SLP. In Proceedings of the 2nd International Conference on Mechanical Engineering, Industrial Materials and Industrial Electronics (MEIMIE), Dalian, China, 29–30 March 2019. [Google Scholar]
- Li, H.L.; Wang, Y.M.; Fan, F.Y.; Yu, H.J.; Chu, J.W. Sustainable plant layout design for end of life vehicle recycling and disassembly industry based on SLP method, a typical case in China. IEEE Access 2021, 9, 81913–81925. [Google Scholar] [CrossRef]
- Nordgren, W.B. Flexsim simulation environment. In Proceedings of the 36th Winter Simulation Conference, New Orleans, LA, USA, 7–10 December 2003. [Google Scholar]
- Zhang, F.; Tian, C. Study on modeling and simulation of logistics sorting system based on Flexsim. In Proceedings of the International Conference on Computer Network, Electronic and Automation (ICCNEA), Xi’an, China, 23–25 September 2017. [Google Scholar]
- Lavery, E.; Nordgren, B.; King, C.; Hullinger, R. Flexsim modeling environment. In Proceedings of the Asia Simulation Conference/6th International Conference on System Simulation and Scientific Computing, Beijing, China, 24–27 October 2005. [Google Scholar]


| Year | 2017 | 2018 | 2019 | 2020 | 2021 | Average Value (Units/Year) | |
|---|---|---|---|---|---|---|---|
| Electrical | |||||||
| Air Conditioner | 49,000 | 60,000 | 82,000 | 100,500 | 96,790 | 77,658 | |
| Refrigerator | 52,500 | 49,000 | 92,800 | 80,400 | 105,300 | 76,000 | |
| Washing machine | 38,450 | 43,200 | 50,225 | 41,250 | 49,000 | 44,425 | |
| Other appliances | 41,500 | 52,650 | 58,095 | 66,750 | 73,500 | 58,499 | |
| Total | 181,450 | 204,850 | 283,120 | 288,900 | 324,590 | 256,582 | |
| Grade | Logistics Intensity | Logistics Route Ratio (%) | The Volume of Goods Undertaken (%) |
|---|---|---|---|
| A | Ultra-high logistic strength | 10 | 40 |
| E | Very high logistic strength | 20 | 30 |
| I | High logistics strength | 30 | 20 |
| O | Normal logistics strength | 40 | 10 |
| U | Negligible logistics intensity | 0 | 0 |
| To | Classification Area | Testing Area | Maintenance Area | Disassembly Area | Cleaning Area | Temporary Storage Area | Parts Library | Distribution Area | Parking Area | |
|---|---|---|---|---|---|---|---|---|---|---|
| From | ||||||||||
| Classification Area | 26 | 0 | 0 | 0 | 0 | 0 | 0 | 0 | ||
| Testing Area | 0 | 7.8 | 18.2 | 0 | 0 | 0 | 0 | 0 | ||
| Maintenance area | 0 | 0 | 0 | 0 | 0 | 0 | 8.0 | 0 | ||
| Disassembly area | 0 | 0 | 0 | 6.1 | 12.1 | 0 | 0 | 0 | ||
| Cleaning area | 0 | 0 | 0 | 0 | 0 | 4.2 | 0 | 0 | ||
| Temporary storage area | 0 | 0 | 0 | 0 | 0 | 0 | 12.1 | 0 | ||
| Parts library | 0 | 0 | 0.2 | 0 | 0 | 0 | 4.0 | 0 | ||
| Distribution area | 0 | 0 | 0 | 0 | 0 | 0 | 0 | 0 | ||
| Parking area | 0 | 0 | 0 | 0 | 0 | 0 | 0 | 0 | ||
| Logistics Route | Material Flow (Kiloton) | Percentage of Material Flow | Grade |
|---|---|---|---|
| Classification area—Testing area | 26 | 28.67% | A |
| Testing area—Maintenance area | 7.8 | 8.60% | E |
| Testing area—Disassembly area | 18.2 | 20.07% | A |
| Disassembly area—Cleaning area | 6.1 | 6.73% | I |
| Disassembly area—Temporary area | 12.1 | 13.34% | E |
| Cleaning area—Parts library | 4.2 | 4.63% | I |
| Temporary area—Distribution area | 12.1 | 13.34% | E |
| Parts library—Maintenance area | 0.2 | 0.22% | O |
| Parts library—Distribution area | 4.0 | 4.41% | I |
| Logistics Route | Grade Evaluation | Integrated Relationships | ||||
|---|---|---|---|---|---|---|
| Logistics Relationships | Non-Logistics Relationships | |||||
| Grade | Quantitative Values | Grade | Quantitative Values | Quantitative Values | Grade | |
| Classification area—Testing area | A | 4 | E | 3 | 11 | A |
| Testing area—Maintenance area | E | 3 | E | 3 | 9 | E |
| Testing area—disassembly area | A | 4 | I | 2 | 10 | A |
| Disassembly area—Cleaning area | I | 2 | E | 3 | 7 | E |
| Disassembly area—Temporary Storage area | E | 3 | A | 4 | 10 | A |
| Cleaning area—Parts library | I | 2 | A | 4 | 8 | E |
| Temporary Storage area—Distribution area | E | 3 | E | 3 | 9 | E |
| Parts library—Maintenance area | O | 1 | O | 1 | 3 | I |
| Parts library—Distribution area | I | 2 | I | 2 | 6 | I |
| Distribution area—Parking area | U | 0 | O | 1 | 1 | O |
| Quantitative Values | Integrated Relationship Level | Number of Logistics Routes | Percentage |
|---|---|---|---|
| 10~11 | A | 3 | 8.33% |
| 7~9 | E | 4 | 11.11% |
| 3~6 | I | 2 | 5.56% |
| 1~2 | O | 1 | 2.78% |
| 0 | U | 26 | 72.22% |
| To | Classification Area | Testing Area | Maintenance area | Disassembly Area | Cleaning Area | Temporary Storage Area | Parts Library | Distribution Area | Parking Area | |
|---|---|---|---|---|---|---|---|---|---|---|
| From | ||||||||||
| Classification Area | A/4 | U/0 | U/0 | U/0 | O/1 | U/0 | U/0 | U/0 | ||
| Testing Area | A/4 | E/3 | A/4 | U/0 | U/0 | U/0 | U/0 | U/0 | ||
| Maintenance area | U/0 | E/3 | U/0 | U/0 | U/0 | I/2 | U/0 | U/0 | ||
| Disassembly area | U/0 | A/4 | U/0 | E/3 | A/4 | U/0 | U/0 | U/0 | ||
| Cleaning area | U/0 | U/0 | U/0 | E/3 | U/0 | E/3 | U/0 | U/0 | ||
| Temporary storage area | U/0 | U/0 | U/0 | A/4 | U/0 | U/0 | E/3 | U/0 | ||
| Parts library | U/0 | U/0 | I/2 | U/0 | E/3 | U/0 | I/2 | U/0 | ||
| Distribution area | U/0 | U/0 | U/0 | U/0 | U/0 | E/3 | I/2 | O/1 | ||
| Parking area | U/0 | U/0 | U/0 | U/0 | U/0 | U/0 | U/0 | O/1 | ||
| Relevance | 4 | 11 | 5 | 11 | 6 | 8 | 7 | 6 | 1 | |
| Sort by | 8 | 1 | 7 | 2 | 5 | 3 | 4 | 6 | 9 | |
| Functional Area | Classification Area | Testing Area | Maintenance area | Disassembly Area | Cleaning Area | Temporary Storage Area | Parts Area | Distribution Area | Parking Area |
|---|---|---|---|---|---|---|---|---|---|
| Area (m2) | 2208 | 3000 | 2200 | 6000 | 1200 | 7800 | 1400 | 1325 | 5000 |
| Forklift | Operators | Task Dispenser | Generator | Processor | Decomposer | Temporary Storage Area | Absorber | |
|---|---|---|---|---|---|---|---|---|
| Quantity (pcs) | 3 | 3 | 2 | 1 | 3 | 1 | 2 | 1 |
| Testing Area | Maintenance Area | Cleaning Area | |
|---|---|---|---|
| Preset time (s) | 2 | 2 | 1 |
| Processing time (s) | 5 | 10 | 2 |
| Number of personnel (s) | 1 | 1 | 1 |
| Temporary Storage Area | Parts Library | |
|---|---|---|
| Target lot (t) | 10 | 5 |
| Waiting time (s) | 200 | 200 |
| Equipment | Program I | Program II | Program III | ||||||
|---|---|---|---|---|---|---|---|---|---|
| Avg | Min | Max | Avg | Min | Max | Avg | Min | Max | |
| Testing machine | 47.83 | 10.59 | 273.64 | 52.77 | 7.25 | 297.56 | 54.83 | 9.89 | 302.08 |
| Maintenance machine | 41.62 | 13.61 | 265.72 | 52.83 | 12.25 | 270.41 | 47.86 | 12.25 | 276.66 |
| Cleaning machine | 22.89 | 9.55 | 267.91 | 34.89 | 6.48 | 271.93 | 31.79 | 6.41 | 253.14 |
| Decomposer | 32.24 | 13.62 | 278.62 | 34.14 | 14.01 | 278.66 | 35.14 | 13.79 | 254.07 |
| Staging area | 159.44 | 5.38 | 235.72 | 158.93 | 2.56 | 234.58 | 165.11 | 13.97 | 247.27 |
| Parts storage | 90.19 | 4.60 | 239.10 | 96.14 | 12.25 | 230.75 | 99.75 | 18.08 | 224.69 |
| Generator | 24.71 | 4.50 | 231.19 | 26.54 | 5.21 | 260.46 | 30.08 | 5.53 | 273.20 |
| Forklift 1 | 6.49 | 2.99 | 19.42 | 6.78 | 3.12 | 21.07 | 7.64 | 3.11 | 14.84 |
| Forklift 2 | 6.34 | 2.99 | 19.08 | 6.74 | 3.12 | 21.61 | 7.51 | 3.11 | 14.84 |
| Forklift 3 | 6.01 | 2.99 | 13.84 | 7.00 | 3.12 | 20.95 | 7.58 | 3.11 | 17.83 |
| Program I | Program II | Program III | ||||
|---|---|---|---|---|---|---|
| Equipment | Forklift | Equipment | Forklift | Equipment | Forklift | |
| AvgStaytime | 418.93 | 18.83 | 456.24 | 20.52 | 464.56 | 22.73 |
| MinStaytime | 61.85 | 8.98 | 60.00 | 9.37 | 79.92 | 9.32 |
| MaxStaytime | 1791.89 | 52.34 | 1844.36 | 63.63 | 1831.12 | 47.52 |
| Number | Program I | Program II | Program III | |||
|---|---|---|---|---|---|---|
| Forklift | Operators | Forklift | Operators | Forklift | Operators | |
| 1 | 98,912.76 | 34,008.11 | 100,353.95 | 42,913.94 | 104,402.11 | 34,852.84 |
| 2 | 84,594.93 | 16,090.13 | 90,765.90 | 15,437.34 | 93,035.78 | 18,116.69 |
| 3 | 69,391.03 | 11,832.29 | 71,017.36 | 14,068.00 | 76,680.84 | 9508.28 |
| Total | 252,898.72 | 61,930.54 | 262,137.21 | 72,419.28 | 274,118.73 | 62,477.82 |
| Equipment | Program I | Program II | Program III | |||
|---|---|---|---|---|---|---|
| Waiting for Operator | Waiting for Forklift | Waiting for Operator | Waiting for Forklift | Waiting for Operator | Waiting for Forklift | |
| Testing machine | 15,840.69 | 8468.26 | 16,979.90 | 8452.46 | 14,284.31 | 9882.18 |
| Repair machine | 7497.17 | 7766.31 | 7884.72 | 8756.54 | 5555.26 | 6768.72 |
| Cleaning machine | 9066.52 | 8714.65 | 13,990.18 | 12,989.24 | 9903.43 | 11,193.49 |
| Decomposer | 11,701.89 | 15,968.57 | 9769.68 | 13,786.21 | 10,615.62 | 15,022.65 |
| Staging area | 0.00 | 5327.53 | 0.00 | 3935.08 | 0.00 | 4824.17 |
| Parts storage | 0.00 | 8641.08 | 0.00 | 8616.37 | 0.00 | 11,559.90 |
| Generator | 0.00 | 29,858.14 | 0.00 | 22,531.19 | 0.00 | 31,258.53 |
| Total | 44,106.28 | 84,744.54 | 48,624.48 | 79,067.08 | 40,358.63 | 90,509.63 |
| Equipment | Program I | Program II | Program III | |||
|---|---|---|---|---|---|---|
| No Load Time | Unladen Rate | No Load Time | Unladen Rate | No Load Time | Unladen Rate | |
| Forklift 1 | 28,510.49 | 33.00% | 28,367.48 | 32.83% | 29,944.79 | 34.66% |
| Forklift 2 | 24,512.06 | 28.37% | 26,055.33 | 30.16% | 27,057.31 | 31.32% |
| Forklift 3 | 21,151.99 | 24.48% | 20,626.64 | 23.87% | 22,935.10 | 26.55% |
| Average | 24,724.85 | 28.62% | 25,016.48 | 28.95% | 26,645.73 | 30.84% |
| Equipment | Program I | Program II | Program III | |||
|---|---|---|---|---|---|---|
| Blocking Time | Blocking Rate | Blocking Time | Blocking Rate | Blocking Time | Blocking Rate | |
| Testing machine | 36,659.40 | 42.43% | 38,263.94 | 44.29% | 39,191.99 | 45.36% |
| Decomposer | 6890.27 | 7.97% | 12,886.84 | 14.92% | 9093.32 | 10.52% |
| Generator | 31,524.86 | 36.49% | 40,190.69 | 46.52% | 33,460.47 | 38.73% |
| Averaging | 25,024.84 | 28.96% | 30,447.16 | 35.24% | 27,248.59 | 31.54% |
| Carbon Emission Mode Category | Carbon Emission Factors | |
|---|---|---|
| Numerical Value | Unit | |
| Electric locomotive transportation | 0.01013 | kgCO2 eq/tkm |
| Northeast Regional Grid | 0.66125 | kgCO2/kWh |
| Forklift | Program I | Program II | Program III | |||
|---|---|---|---|---|---|---|
| Distance Traveled | Carbon Emissions | Distance Traveled | Carbon Emissions | Distance Traveled | Carbon Emissions | |
| 1 | 98,912.76 | 1001.99 | 100,353.95 | 1025.43 | 104,402.11 | 1057.59 |
| 2 | 84,594.93 | 856.95 | 90,765.90 | 919.46 | 93,035.78 | 942.45 |
| 3 | 69,391.03 | 702.93 | 71,017.36 | 719.41 | 76,680.84 | 776.78 |
| Total | 252,898.72 | 2561.86 | 262,137.21 | 2655.45 | 274,118.73 | 2776.82 |
| Equipment | Program I | Program II | Program III | |||
|---|---|---|---|---|---|---|
| Idle Time | Carbon Emissions | Idle Time | Carbon Emissions | Idle Time | Carbon Emissions | |
| Testing machine | 8162.97 | 2998.76 | 6477.32 | 2379.51 | 8130.72 | 2986.91 |
| Maintenance machine | 57,954.24 | 21,290.14 | 54,952.04 | 20,187.24 | 60,006.57 | 22,044.08 |
| Cleaning machine | 59,548.77 | 21,875.90 | 47,677.00 | 17,514.68 | 53,816.64 | 19,770.14 |
| Decomposer | 31,400.07 | 11,535.16 | 30,212.99 | 11,099.08 | 33,723.05 | 12,388.54 |
| Total | 157,066.05 | 57,699.96 | 139,319.34 | 51,180.51 | 155,676.98 | 57,189.67 |
| Evaluation Indicators | Weights | |
|---|---|---|
| Variable Carbon Emissions | Forklift carbon emissions | 0.15 |
| Equipment idling carbon emissions | 0.15 | |
| Equipment dwell time | Average equipment dwell time | 0.02 |
| Minimum equipment dwell time | 0.02 | |
| Longest equipment dwell time | 0.06 | |
| Average forklift dwell time | 0.02 | |
| Forklift minimum dwell time | 0.02 | |
| Forklift longest dwell time | 0.06 | |
| Travel distance | Forklift movement distance | 0.1 |
| Distance of operator’s movement | 0.1 | |
| Waiting time | Waiting time for forklift | 0.08 |
| Waiting time for an operator | 0.1 | |
| Blocking rate | Equipment blockage rate | 0.07 |
| Unload rate | Forklift empty rate | 0.05 |
| Evaluation Indicators | Weights | Reference Series | Compare Series | ||
|---|---|---|---|---|---|
| Program II | Program II | Program III | |||
| Forklift carbon emissions | 0.15 | 2561.86 | 2561.86 | 2655.45 | 2776.82 |
| Equipment idling carbon emissions | 0.15 | 51,180.51 | 57,699.96 | 51,180.51 | 57,189.67 |
| Average equipment dwell time | 0.02 | 418.93 | 418.93 | 456.24 | 464.56 |
| Minimum equipment dwell time | 0.02 | 60.00 | 61.85 | 60 | 79.92 |
| Longest equipment dwell time | 0.06 | 1791.89 | 1791.89 | 1844.36 | 1831.12 |
| Average forklift dwell time | 0.02 | 18.83 | 18.83 | 20.52 | 22.73 |
| Forklift minimum dwell time | 0.02 | 8.98 | 8.98 | 9.37 | 9.32 |
| Forklift longest dwell time | 0.06 | 47.52 | 52.34 | 63.63 | 47.52 |
| Forklift movement distance | 0.10 | 252,898.72 | 252,898.72 | 262,137.21 | 274,118.73 |
| Distance of operator’s movement | 0.10 | 61,930.54 | 61,930.54 | 72,419.28 | 62,477.82 |
| Waiting time for forklift | 0.08 | 79,067.08 | 84,744.54 | 79,067.08 | 90,509.63 |
| Waiting time for an operator | 0.10 | 40,358.63 | 44,106.28 | 48,624.48 | 40,358.63 |
| Equipment blockage rate | 0.07 | 28.96% | 28.96% | 35.24% | 31.54% |
| Forklift empty rate | 0.05 | 28.62% | 28.62% | 28.95% | 30.84% |
Disclaimer/Publisher’s Note: The statements, opinions and data contained in all publications are solely those of the individual author(s) and contributor(s) and not of MDPI and/or the editor(s). MDPI and/or the editor(s) disclaim responsibility for any injury to people or property resulting from any ideas, methods, instructions or products referred to in the content. |
© 2023 by the authors. Licensee MDPI, Basel, Switzerland. This article is an open access article distributed under the terms and conditions of the Creative Commons Attribution (CC BY) license (https://creativecommons.org/licenses/by/4.0/).
Share and Cite
Mao, J.; Cheng, J.; Li, X.; Zhao, H.; Yu, D. Simulation of Low Carbon Layout Optimization of Disassembly Line Based on SLP Method. Sustainability 2023, 15, 5241. https://doi.org/10.3390/su15065241
Mao J, Cheng J, Li X, Zhao H, Yu D. Simulation of Low Carbon Layout Optimization of Disassembly Line Based on SLP Method. Sustainability. 2023; 15(6):5241. https://doi.org/10.3390/su15065241
Chicago/Turabian StyleMao, Jia, Jinyuan Cheng, Xiangyu Li, Honggang Zhao, and Dexin Yu. 2023. "Simulation of Low Carbon Layout Optimization of Disassembly Line Based on SLP Method" Sustainability 15, no. 6: 5241. https://doi.org/10.3390/su15065241