Abstract
New concepts such as low-carbon economy, low-carbon production, low-carbon living and even low-carbon cities have become popular topics in environmental protection. The disassembly line part of reverse logistics is accompanied by high carbon emission, which is contrary to the original intention of sustainable development. In this paper, we design a systematic low-carbon layout for the disassembly line of the logistics processing center to address the problem of high carbon emissions caused by the unreasonable layout of the disassembly line. Taking the disassembly line in the logistics center of Company H as the research object, the process of the disassembly line is analyzed, and the SLP analysis method is applied to analyze the material flow and the material flow intensity level of the disassembly line layout, and three different optimization schemes are derived. Flexsim software was used to model and run the three initial layout schemes of the disassembly line, and the data related to the waiting time operation of each scheme were obtained. Finally, carbon emission and other disassembly-line-related indicators were introduced and weights were set, and the results were subjected to weighted gray correlation analysis to arrive at the optimal disassembly line layout optimization scheme. This study will provide reference for other reverse logistics processing center layout studies.
1. Introduction
As the economy continues to grow, environmental pollution and resource waste are increasing day by day, people are consuming heavily, and irrational economic models are causing people to consume future resources. Governments are forced to take action to re-establish supply chain systems to maintain sustainable development. The reverse logistics processing chain occupies a pivotal position in establishing the supply chain and is the key to the operation of reverse logistics, while the disassembly line is an important part of the reverse logistics chain [1,2,3]. However, there are few professional reverse logistics disassembly lines at present, and most reverse logistics processing disassembly lines are poorly planned and managed, leading to the inability of enterprises to carry out smooth reverse logistics, low efficiency, and poor profitability. It is mainly manifested in the scattered layout of each functional area, high handling cost, low utilization of storage area, low operational efficiency, and especially high carbon emission, which causes a lot of energy consumption. The sustainability process is seriously jeopardized. Recycling aims to prevent the rapid depletion of natural resources while transforming the generated waste into economic value; therefore, it is necessary to optimize the layout of its disassembly line to improve the operational efficiency of the reverse logistics processing center, accelerate the recovery and recycling of the reverse flow materials, save resources, improve the environment, and at the same time bring commercial benefits to the company and improve its corporate image. However, to achieve reverse logistics for the effective use of resources, due to poor planning and other reasons, the disassembly line part of reverse logistics, that is, the disassembly process of the recovered waste goods, is often accompanied by a large amount of pollution, which is contrary to the original intention of developing sustainable development of reverse logistics. To achieve low carbon and efficient reverse logistics processing, it is necessary to carry out systematic low-carbon design and optimization of the layout of the disassembly line [4,5,6].
- Reverse logistics related research
The research on reverse logistics mainly includes network system design, site layout, enterprise profit maximization and supply chain, etc. There are still many uncertainties in the structure of reverse logistics systems, especially from the perspective of process. Kilic et al. designed a reverse logistics system through a mixed integer linear programming model that considers different types of storage locations and recycling facilities that can meet each scenario with minimum recycling rates specified for each product category [7]. Sangwan et al. studied the development of various activities, decision variables and performance indicators based on the four basic activities of reverse logistics, based on the activities and actions between activities to develop performance indicators in order to relate performance indicators to reverse logistics [8]. Ghasemi, P et al. proposed a decentralized/distributed decision making (DDM) supply chain planning model. After that, a wood products supply chain is designed with respect to environmental impact to minimize the cost of a closed-loop supply chain considering the environmental impact [9,10]. Kusakci et al. developed a fuzzy mixed integer location assignment model for a reverse logistics network. The superiority of this mathematical model was demonstrated by an example analysis of the reverse logistics design problem for electric vehicles in urban Istanbul [11].
- Logistics operation area layout related research
Liu studied the distribution center layout and order picking system according to the customer order characteristics and used witness software for simulation, and the comparison concluded that the picking distance of goods was shorter than the old system model after applying the new system model [12]. Ji et al. studied the pharmaceutical logistics distribution center layout, modeled and solved using ant colony algorithm, and obtained optimized path simulation images with example verification analysis [13]. Zhang et al. established a model with the maximum arithmetic product of integrated relationship and adjacency as the objective function, and used a genetic algorithm to solve the functional layout problem of railroad logistics park [14].
- Layout method related research
Chittratanawa proposed and implemented a heuristic algorithm for solving combinatorial problems to solve the problems of equipment layout, pick/place locations and material handling equipment selection, and also minimized the overall facility design cost, allowing designers to explore system design in greater depth [15]. Lee et al. proposed an improved genetic algorithm for solving curved boundary internal structural walls and channels within the effective region, applied the algorithm to the ship cabin layout problem, and compared the computational results with the actual ship cabin layout [16]. Liu and Zhao took a pharmaceutical logistics center as an example, combined the influencing factors of the logistics center layout, used the SLP method to generate a location relationship map based on its logistics correlation and non-logistics relationship, and draw the initial location relationship map, and then further adjust the moving route map, and finally get the optimized layout plan, which provides some theoretical basis and reference for the layout of the service system [17].
For the research on reverse logistics, most of the research scholars study the layout of reverse logistics network, regional network layout, and network site selection, among other issues. As an important link of reverse logistics operation, the reasonable layout of reverse logistics processing center is of great significance to the smooth operation of reverse logistics, cost saving and environmental protection; however, previous studies have involved little in the layout optimization of reverse logistics processing center, especially linked with the goal of carbon emission reduction. Therefore, further in-depth research should be conducted in this area. For the research on the layout of logistics center, scholars devote less attention to the operation process, operation characteristics, and cargo classification. The optimization of operation flow and reasonable division of functional areas are the keys to layout; thus, it is necessary to further explore in this aspect. In the research of layout method, in recent years, scholars have optimized and improved the traditional SLP method; however, because SLP has the shortcomings of relying on experience and too many constraints, this paper combines SLP method and simulation to achieve a complementary effect, which can combine both qualitative and quantitative aspects to create a comprehensive layout. The research on layout method focuses on improving the traditional SLP layout method according to the actual situation and providing reasonable layout results by combining it with modern computer technology.
We found few studies on the design optimization of disassembly line layout in logistics processing centers and on carbon dioxide emissions reduction and resource utilization. Therefore, in this paper, the layout design of low-carbon disassembly line is integrated with the layout design of the reverse logistics processing center and the low-carbon optimization of the disassembly line.
- (1)
- Innovation of research perspective. In the past, few scholars have optimized the layout of reverse logistics processing centers, which are complex, poorly planned and inefficient, and should be taken seriously. This paper studies the reverse logistics processing center to enrich the theoretical study of reverse logistics.
- (2)
- Innovation of analysis method. It is proposed to further divide the functional area through functional positioning of the reverse logistics processing center and operation flow analysis and optimization, and to carry out low-carbon design of the disassembly line layout based on the SLP method on the basis of the research, as well as to further optimize it through simulation analysis to arrive at the optimal solution.
2. Problem Statement
In the environment of green economy and circular economy, the development of reverse logistics is the general trend, which is crucial to realize the recycling of resources and improve empower enterprises. The disassembly line is set up in the reverse logistics center; as a key part of reverse logistics, its low carbon layout design in the logistics center will have a considerable role in the low carbonization of the whole logistics center. In order to analyze the layout optimization of the disassembly line in the reverse logistics center more specifically, this paper selects the disassembly line of H company, a domestic electrical appliance manufacturer, as the object to study its layout optimization, and uses relevant theories and methods to create a standardized, professional, energy-saving and efficient reverse logistics disassembly line, expecting to provide guidance and reference for other enterprises. Company H’s reverse flow products are mainly handled by the company’s reverse logistics center, of which the disassembly line can now be divided into six main areas: disassembly area, sub-inspection area, maintenance area, parts library, distribution area, and parking area, covering an area of approximately 40,000 m2. The current layout of the functional areas of the company’s disassembly line is shown in Figure 1.

Figure 1.
The functional layout of the disassembly line of Company H before the optimization.
Through research and analysis of the current situation of the operation of the disassembly line in the logistics processing center of Company H, the following deficiencies exist in the operation process of the disassembly line in the logistics processing center.
- The operation process is not perfect
- (1)
- Lack of pre-testing and sorting of recyclables.
- (2)
- No cleaning process is set up after the disassembly of parts.
- (3)
- Reasonable transfer planning for recyclable and remanufactured parts is not carried out with unreasonable layout of disassembly line.
- Unreasonable division of functional areas
- (1)
- Unreasonable planning of sub-inspection area.
- (2)
- No cleaning area is set.
- (3)
- No parts temporary storage area is set.
- (4)
- The area of parts library is unreasonable.
- (5)
- The distribution of each area is not reasonable.
Therefore, in view of the problems of the company, a reasonable layout optimization of the low-carbon disassembly line is essential for Company H.
3. Layout Design of Low Carbon Disassembly Line Based on the SLP Method
In the early 1960s, the American scientist Richard Muther proposed the SLP method, which developed the system layout from the qualitative analysis method to the quantitative analysis method. The implementation steps of SLP method are shown in Figure 2.
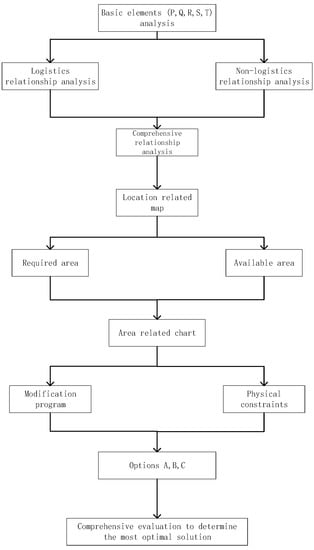
Figure 2.
Implementation steps of SLP method.
To improve the layout of the disassembly line in the logistics center’s achievement of low carbonization, the following specific optimization objectives are proposed after relevant research for the example of the reverse logistics disassembly line of an electrical appliance distribution company H.
- (1)
- Shorten the transfer distance. In the operation of the disassembly line in the logistics center, the carbon emissions generated by the forklift during the transfer process account for a large proportion of the total carbon emissions of the disassembly line. Shortening the distance of transfer required in the disassembly line can reduce carbon emissions and costs, as well as improve the efficiency of the disassembly line.
- (2)
- Realize the effective use of the area. The available area of the logistics processing center is limited; reasonable planning of the existing area and the area utilization rate can reduce carbon emissions caused by public utilities and other aspects while reducing certain variable costs.
- (3)
- Reduce pollution. Reducing pollution is the ultimate goal of the reverse logistics center; therefore, the disassembly line in the logistics center should be optimized through professional processing processes and coordination of the corresponding layout to reduce unnecessary pollution generated in the disassembly process, thus reducing the corresponding carbon emissions.
3.1. Analysis of Low Carbon Disassembly Line Layout Elements
Before using the SLP analysis method for layout, the elements of the disassembly line need to be analyzed, which mainly include (P, Q, R, S, T) five aspects [18,19,20].
- (1)
- P: logistics object analysis. The logistics object will have a large impact on the overall planning of the analyzed layout. Take Company H as an example: at present, recycled scrap goods and parts are the two main logistics objects of the disassembly line. The used goods are mainly recycled goods such as household appliances operated by the company, and the parts are the disassembled parts of the recycled used goods.
- (2)
- Q: refers to the analysis of material flow. The size of logistics operations directly reflects the size of the floor space and the number of related equipment, which determines the cost of storage and handling costs. Through data collection and preliminary research, we obtained the processing volume of recycled waste products from 2017–2021 in the disassembly line of the logistics processing center of Company H, as shown in Table 1, which yielded an average annual processing volume of approximately 260,000 pieces, totaling 26,000 tons.
 Table 1. Company H disassembly line 2017–2021 scrap product processing volume.
 - (3)
- R: Logistics operation route. It refers to the logistics route of recyclables between the functional areas of the disassembly line. The logistics route of recyclables is mainly determined by the operation flow of the disassembly line.
- (4)
- S: Auxiliary service department. The functional areas that provide auxiliary work for logistics objects other than the disassembly line’s professional workflow activities such as disassembly are collectively referred to as auxiliary service departments. At present, the auxiliary service department in the disassembly line is the parking area.
- (5)
- T: Logistics operation technology. This refers to the specialized equipment needed to perform logistics operations in the disassembly line, such as disassemblers, inspection machines, and forklifts. The combination of professional hardware equipment and software technology can effectively improve operational efficiency and reduce the required cost.
3.2. Disassembly Line Workflow Optimization
The operational flow of the disassembly line is the key to achieving good operation of the disassembly line system. The workflow directly determines the logistics operation route in the disassembly line and is a necessary prerequisite for SLP layout analysis [8,21,22]. To achieve the best layout effect and realize the low carbonization of the disassembly line in the logistics processing center, the current problems of the disassembly line operation flow were first optimized. It mainly includes the optimization of the following three aspects.
- (1)
- Adding a testing link for waste products before disassembly. According to the current process, recyclables are dismantled directly after entering the disassembly line without testing. The disassembly without testing may miss the recyclables that can be repaired without disassembly, which generates unnecessary carbon emissions and increases the workload at a later stage. The waste commodities are further sorted into repairable and non-repairable categories through the testing process, and the non-repairable commodities continue to enter the disassembly area for disassembly, while the repairable items can be directly transported to the maintenance area of the logistics center outside the disassembly line for maintenance cycle.
- (2)
- Increase the cleaning link before storage for the parts that can be directly reused after disassembly. According to the current process, after disassembly the directly reusable parts, they are directly sent to the parts warehouse by forklift and then sorted out and cleaned before use, which increases unnecessary carbon emission and reduces the efficiency of the disassembly line. The optimized cleaning process is set before the disassembly and storage, which improves efficiency and reduces the pollution caused by unclean storage and the carbon emission caused by separate cleaning before use.
- (3)
- To set up a temporary storage area for recyclable and remanufactured parts after disassembly. Currently, recyclable and remanufactured parts are not transferred after disassembly but are directly piled up in the disassembly area waiting for sorting, which causes confusion in the disassembly area and increases the workload of forklift transfer and other links, increasing carbon emissions. After optimization, the recyclable and remanufactured parts are dismantled and stored in the staging area, which can reduce the workload and carbon emissions, and make the operating environment better.
In summary, a comparison of the before and after optimization of the disassembly line operation process in the logistics center is shown in Figure 3a,b.
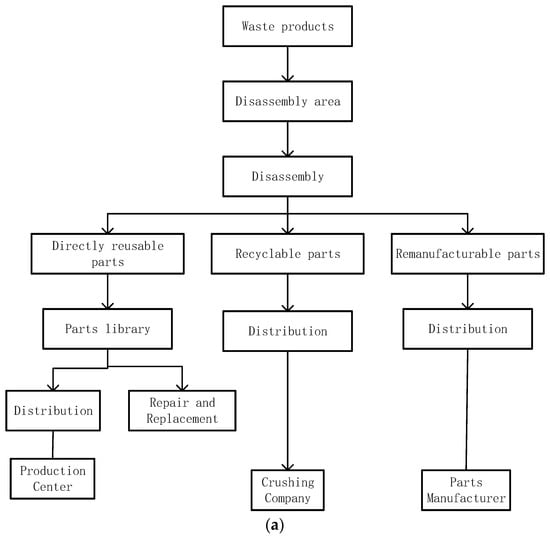

Figure 3.
(a). Disassembly line operation in the logistics center before optimization. (b). Disassembly line operation in the logistics center before optimization.
3.3. Disassembly Line Functional Area Location Layout Optimization
After the optimization of the disassembly line operation process, the layout design and optimization of the location of each area of the disassembly line are carried out according to the optimized process and the additional functional areas in the process by applying the SLP method.
- (1)
- Logistics relationship between each zone
According to the disassembly line operation process, the flow volume and flow frequency of the disassembly line logistics objects, and the logistics relationship between each area of the disassembly line are analyzed. According to the SLP analysis method, as in Table 2, the logistics intensity of the disassembly line is divided into five levels (A, E, I, O, U) [23,24,25,26].
Table 2.
Logistics intensity level classification.
From Table 2, the average annual processing volume of the disassembly line of Company H is approximately 260,000 pieces, totaling 26,000 tons; in addition, according to the research data, the following information related to the material flow is obtained.
The material flow directly from the inspection area to the disassembly area accounts for approximately 70%; the material flow directly to the maintenance area accounts for approximately 30%.
The ratio of the material flow from the parts store to the distribution area, the maintenance area to the distribution area, and the temporary storage area to the distribution area is 1:2:3.
The ratio of material flow from the disassembly area to the cleaning area is 35%, and of the material flow from the disassembly area to the staging area is 65%.
The material flow from the parking area is not considered in the calculation.
Analyzing the relevant information, the disassembly line material flow from—to a table (Table 3) is obtained.
Table 3.
Disassembly line material flow from—to a table (Numerical units. kiloton).
From Table 3, according to the classification method in Table 2, the logistics routes in the functional area of the disassembly line are graded according to the intensity of logistics, as shown in Table 4.
Table 4.
A logistics intensity level of logistics routes in each functional area of the disassembly line.
The route with zero material flow between each functional area is recorded as U. According to Table 3 and Table 4, the logistics relationship analysis diagram of each functional area of the disassembly line is drawn (see Figure 4).
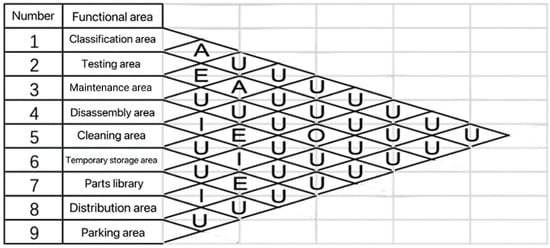
Figure 4.
Non-logistic relationship between zones.
The main factors influencing the non-logistic relationship between each zone of the disassembly line are the coherence of the operation process, the similarity of the operation content, the difficulty of logistics handling, and the similarity of the equipment used. This is used as the relationship level evaluation index to evaluate the degree of non-logistics correlation between each functional area, as shown in Figure 5.

Figure 5.
Analysis of the non-logistic relationship between each zone of the disassembly line.
- (2)
- Comprehensive relationship analysis of each functional area
The comprehensive relationship of functional areas in the disassembly line refers to the quantification of the comprehensive weighted level of logistics and non-logistics relationships according to a certain weighting ratio. The U to A logistics intensity levels of each zone is quantified in natural numbers from 0 to 4, respectively. In the selection of the weight ratio, a comprehensive analysis of the operation flow and operation process of the disassembly line of the logistics center is made, and the weight ratio of the logistics and non-logistics relations of the disassembly line is set to 2:1. The integrated relationship of each functional area of the disassembly line is thus obtained (Table 5).
Table 5.
Level of the integrated relationship between the functional areas of the disassembly line.
From Table 5, the quantified values of the integrated relationship between each functional area range from 1 to 11. The proportion of integrated relationship levels between each functional area in the disassembly line is calculated as in Table 6, and it can be verified that the proportion of each level is within a reasonable range.
Table 6.
Percentage of integrated relationship levels among the functional areas of the disassembly line.
Then, from Table 6, the integrated relationship of each functional area of the disassembly line of the logistics center is obtained, as shown in Figure 6.
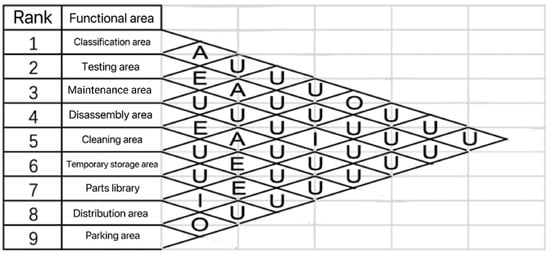
Figure 6.
Comprehensive relationship analysis of each functional area in the disassembly line.
- (3)
- Location correlation diagram between each functional area
From the comprehensive relationship of each functional area in the disassembly line of the logistics center, the degree of comprehensive correlation between each functional area and all other functional areas is calculated by summing and ranking the quantitative values of the intensity level of the relationship between each functional area and all other functional areas, as shown in Table 7. The greater the sum of the quantified values of the intensity levels, the higher the ranking and the degree of association of the functional area with other functional areas; the more important it is, the closer the corresponding layout location should be to the center of the disassembly line; similarly, the lower the ranking of each functional area, the more the layout is toward the edge of the disassembly line.
Table 7.
Ranking of the integrated correlation between the functional areas of the disassembly line.
From Table 7, according to the integrated correlation degree of each functional area of the disassembly line and its ranking, the location correlation map of each area of the disassembly line was obtained (see Figure 7).
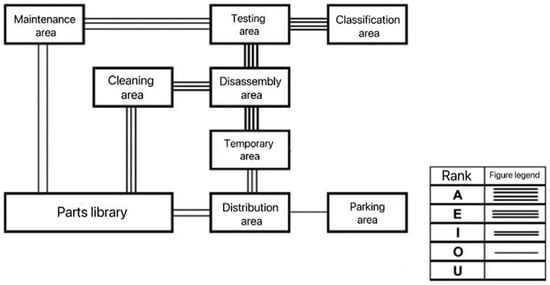
Figure 7.
Correlation diagram of the location of each zone of the disassembly line.
- (4)
- Area of each functional area of the disassembly line
After obtaining the inter-zone location correlation diagram from the disassembly line process, it is necessary to calculate the specific area of each zone for a subsequent layout.
- Area calculation of classification area and distribution area
From the operation content and process, it is known that the main reference object for calculating the area of the sorting area and distribution area is the incoming and outgoing vehicles. The vehicles used in this logistics center are mainly 25-ton trucks (9.6 m long × 2.3 m wide × 2.7 m high). From the analysis of material flow, the maximum daily processing volume of the disassembly line classification area is approximately 260 t, and the maximum number of operating vehicles is approximately 50 vehicles at the same time every day; the maximum daily processing volume of the distribution area is approximately 160 t, and the maximum number of operating vehicles is approximately 30 vehicles at the same time every day. Due to the parking interval between vehicles, the table should be checked in order to obtain the vehicle conversion factor of 2. Then,
where is vehicle conversion factor.
Sp—actual floor space per unit vehicle.
n—maximum number of vehicles operating simultaneously per day.
- Area calculation of temporary storage area and parts area
The area of temporary storage area and parts area is calculated by the main variables of daily storage volume and storage time of goods in the area, respectively. After research, the actual utilization rate of the temporary storage area and parts warehouse area is approximately 0.6 on average, and the utilization rate of the building area is approximately 0.5. Then,
where is daily storage of goods in each area (tons);
is actual floor space per unit of cargo;
is average number of days of storage of goods;
is actual utilization rate of the region;
is regional floor space utilization rate.
- Area calculation of parking area
The parking area is mainly used for parking vehicles in addition to the sorting area and distribution area. Due to the low correlation with the process optimization of the disassembly line, according to the previous demand of the parking lot of the disassembly line, 20 parking spaces for large trucks of 18 2.5 m and 30 parking spaces for small cars of 5 2 m are set, and the total area of the parking lot is estimated to be 5000 m2.
- Area calculation of operation area
The area of the testing area, disassembly area, cleaning area, and maintenance area are mainly based on the area required by the machinery and equipment used in the area, combined with the flow of goods, work efficiency, and the results of the preliminary research to set. The testing area is 3000 m2, disassembly area is 6000 m2, the cleaning area is 1200 m2, and maintenance area is 2200 m2.
In summary, as shown in Table 8, the optimized area division of the disassembly line is obtained.
Table 8.
Optimized area division of disassembly line.
3.4. Initial Layout Scheme of the Disassembly Line
From the optimized disassembly line operation flow, the correlation of each functional area, and the area calculation of the area, three layout design options are initially derived, as shown in Figure 8, Figure 9 and Figure 10.
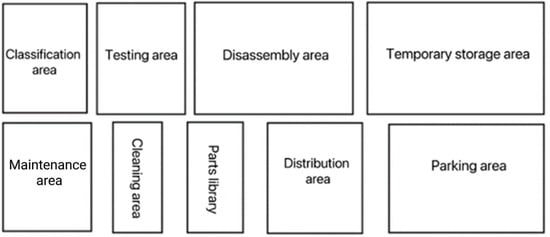
Figure 8.
Disassembly line initial layout option one.
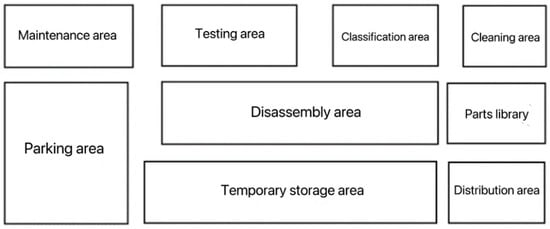
Figure 9.
The initial layout of disassembly line option two.
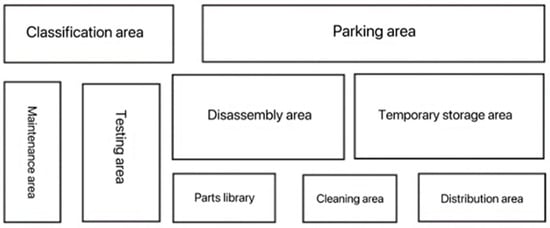
Figure 10.
The initial layout of disassembly line option three.
4. Simulation Analysis of Low Carbon Disassembly Line Layout Scheme Based on Flexsim
4.1. Preparation of Flexsim Simulation Data
Based on the SLP approach, the initial layout design plan of the disassembly line was modeled using Flexsim simulation software. In addition, the parking lot is not modeled in this simulation due to its low relevance to the disassembly line process and layout optimization, and no logistical connection to the overall process of the disassembly line [27,28,29].
The composition of this simulation model is shown in Table 9.
Table 9.
Disassembly line simulation model composition.
- (1)
- The disassembly line is equipped with three forklifts and three operators for the simple transfer of goods and the start-up and operation of the equipment. According to the general running speed of forklifts and the moving speed of operators, the maximum running speed of forklifts is 6 m/s and the moving speed of operators is 2 m/s.
- (2)
- A total of two task dispensers for the forklift and operator, respectively, are installed to issue tasks for the operator or forklift.
- (3)
- The generator is set at the beginning of the disassembly line operation process, i.e., the sorting area, as the initial port for the recyclables to arrive at the disassembly line. The time distribution of the arrival of the recyclables at the starting point is set to obey the Poisson distribution Poisson (10.0, 0) [30,31,32,33,34].
- (4)
- The processors are operated by operators, and each processor corresponds to one operator and is set up as one inspection zone, one maintenance zone, and one cleaning zone. The operator presets and processes the recyclables through the processor, and then transports them to the next functional area by forklift after processing. The specific duration and staffing are shown in Table 10.
Table 10. Processor operating hours to personnel ratio.
- (5)
- The decomposer is set in the disassembly area for decomposing the recyclables. The disassembler is operated by two operators at the same time, and the preset time is two. The processing time is randomly distributed in (8, 12). After disassembling, it is then transported to the next functional area by forklift in proportion to the material flow.
- (6)
- The temporary storage area and parts store are simulated as temporary storage areas because they assume temporary storage functions, and the recyclables are transported by forklift from the previous link. The temporary storage area and the parts store are set up for batch operation according to a certain waiting time, as shown in Table 11.
Table 11. Target lot size and waiting time ratio in the temporary storage area.
4.2. Initial Layout Scenario Modeling and Operation
Based on the three initial layout scenarios and the preliminary data preparation, the simulation model setup was performed using Flexsim. The initial layout scenarios are modeled in the following Figure 11, Figure 12 and Figure 13 [35,36,37].
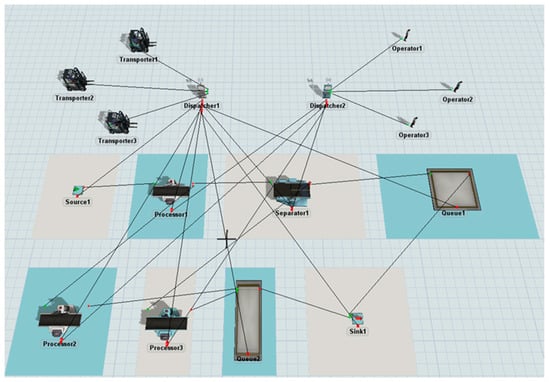
Figure 11.
Model of disassembly line layout option 1.
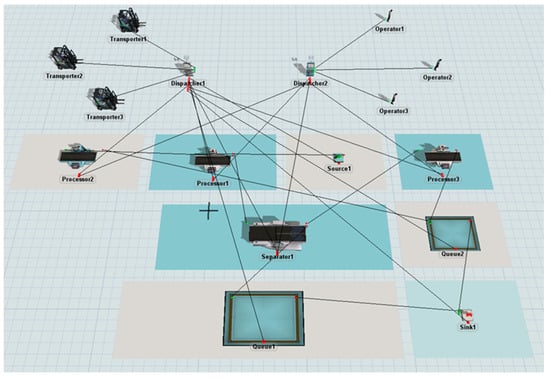
Figure 12.
Model of disassembly line layout scheme II.
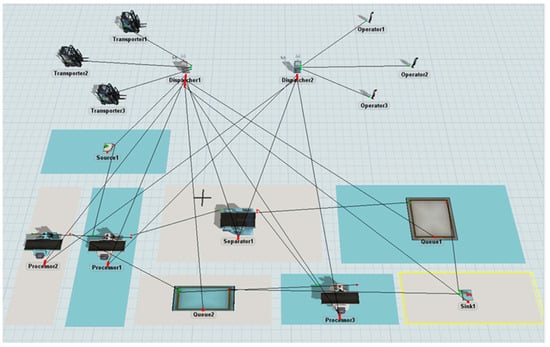
Figure 13.
Model of disassembly line layout scheme III.
After completing the construction of the model corresponding to the initial layout scheme, the model is run on a trial basis, as shown in Figure 14, and adjusted accordingly to eliminate the relevant factors that may cause problems such as model stalling, so that the model runs smoothly.
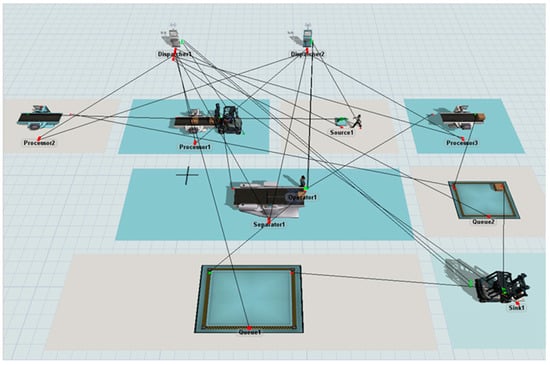
Figure 14.
Flexsim model run of the initial solution of the disassembly line.
4.3. Analysis of Modeling and Simulation Results
Simulation Data Analysis of Each Scenario
After modeling the three scenarios, they were run for 24 h (86,400 s), and the relevant data and model states during the operation were obtained as shown in Figure 15, Figure 16 and Figure 17.
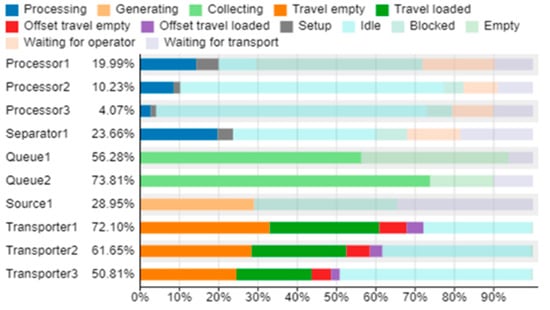
Figure 15.
Model state during disassembly line scenario one run.
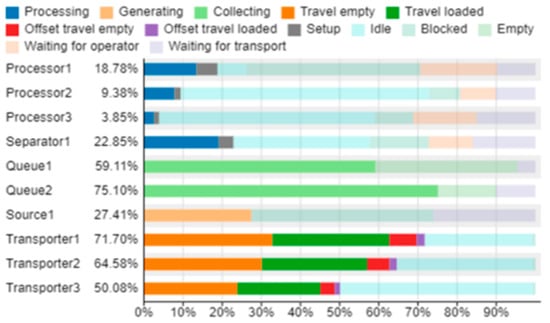
Figure 16.
Model state when disassembly line option 2 is running.
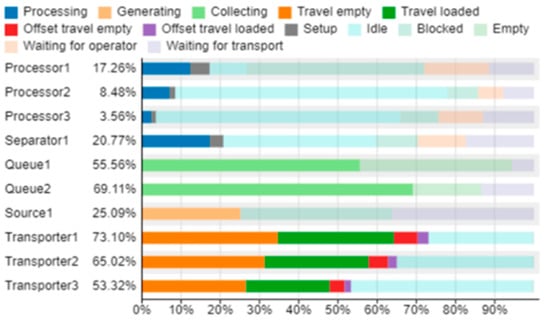
Figure 17.
Model state during disassembly line scenario three-run.
The analysis of the data required for the above graphical export leads to the following information. According to the model set, the following time units are seconds (s) without special descriptions, and the distance units are meters (m).
- (1)
- Dwell the time of each piece of equipment
The dwell time of each piece of equipment and forklift in the simulation is used as a reference. The shorter the dwell time, i.e., the non-working time, the more efficient the equipment and the better the working condition. The working condition and efficiency of the equipment in each functional area of the disassembly line in each scenario are compared and analyzed. The specific data are shown in Table 12.
Table 12.
Dwell a schedule for each piece of equipment.
The collation yields Table 13.
Table 13.
Statistics for each equipment dwell time classification.
From Table 13, the combined dwell time of each piece of equipment in Program I is the shortest and the efficiency is the highest.
- (2)
- Forklift and operator moving distance
Distance traveled includes the total distance traveled by forklifts and the total distance walked by operators in each scheme, as shown in Table 14. The shorter the total distance traveled, the higher the operational efficiency, the lower the carbon emission, and the more reasonable the layout.
Table 14.
Classification statistics of moving distance by program.
From Table 14, option 1 has the shortest total travel distance between forklift and operator, the highest operational efficiency, and the lowest carbon emissions generated during the movement.
- (3)
- Equipment waiting time (Waiting for Operator/ Transport)
Before the operation of each piece of equipment, there is a waiting time for the forklift or operator, called waiting time. The shorter the waiting time, the higher the operational efficiency, and the more reasonable the layout.
From Table 15, option 3 has the shortest waiting time for the operator, and option 2 has the shortest waiting time for the forklift.
Table 15.
Waiting schedule for equipment by program.
- (4)
- Forklift idling time
During operation, forklift trucks sometimes show no-load conditions. If the idle state lasts too long, it will affect the operation efficiency and cause a meaningless increase in carbon emissions. Therefore, forklift idle time and idle rate are introduced into the simulation result analysis, as shown in Table 16. The shorter the idle time, the higher the operation efficiency and the better the layout scheme.
Table 16.
No-load time and no-load rate of forklifts for each scenario.
From Table 16, program I has the shortest idle time and the lowest idle rate.
- (5)
- Equipment blocking time
The equipment blocking situation occurs in the operation of each scheme, and the rationality of the layout affects the blocking rate of the equipment to a certain extent; herefore, the equipment blocking time and blocking rate are introduced to analyze the rationality of the layout, as shown in Table 17. The lower the equipment blocking rate, the more reasonable the layout.
Table 17.
Blocking time and blocking rate of equipment by program.
From Table 17, option 1 has the shortest blockage time and the lowest blockage rate.
5. Carbon Emission Analysis with Low Carbon as the Goal
In this paper, the size of carbon emission is used as an evaluation index to optimize the evaluation and selection of the final layout of the disassembly line. In the calculation of carbon emissions, the energy consumption in the disassembly line operation process is used as the research object to estimate the carbon emissions generated in each area of the disassembly line in the logistics processing center within a certain operation time. This method combines the analysis of carbon emission characteristics, identification of carbon emission factors, and quantification of carbon emission factors.
5.1. Analysis of Variable Carbon Emissions for Each Scenario
In the disassembly line of the logistics processing center, the carbon emissions of each link can be obtained by the product of the unit emission source and carbon emission factor in the operation process. The carbon emission factor can be obtained through table checking, actual measurement, estimation, etc. In this paper, we use a combination of table checking and estimation to calculate the carbon emissions generated by each variable link, taking the hourly electricity consumption in the area and the distance traveled by the transfer forklift as the emission sources. The following carbon emission units are set in grams (g) unless otherwise specified.
In terms of forklift travel, all forklifts used in the logistics processing center of Company H are electric forklifts; therefore, the carbon emission factor generated by electric locomotive transportation is used for calculation. In terms of regional hourly electricity consumption, the company is located in the northeast regional grid of the State Grid; thus, the calculation is made concerning the average carbon emission factor of the northeast region in the 2019 China regional grid. The specific values are shown in Table 18.
Table 18.
Main carbon emission factors in the disassembly line.
From the forklift moving distance statistics in previous simulation results, the carbon emission of forklift operation for 86,400 s for each scenario can be obtained as shown in Table 19.
Table 19.
Carbon emissions from forklifts by scenario.
Meanwhile, since the equipment working time in each scenario is the same, the idle time of the equipment in each scenario is introduced from the model state of 4.3.1 to calculate the difference in carbon emissions generated by the equipment working in each scenario.
According to the survey statistics, the average power of each piece of equipment is 2 kW, and the idle time and carbon emission of each scheme are shown in Table 20.
Table 20.
Equipment idle time and carbon emissions in each scenario.
5.2. Selection of the Optimal Solution for the Disassembly Line
To analyze the simulation data more comprehensively and objectively in order to select the optimal low-carbon disassembly line layout optimization scheme, this paper chooses to further evaluate the data by combining the carbon emission evaluation index with other comprehensive performance indexes with a weighted gray correlation evaluation method.
5.2.1. Low Carbon Disassembly Line Layout Evaluation Index Weights Determination
From 4.3, the relevant data analysis of the simulation results of each program can be obtained, and each relevant data is divided into six primary indicators and fourteen secondary indicators. The weight of each indicator is set according to the research results and relevant literature references. Since this paper focuses on the application of low carbonization in the layout of the disassembly line, the variable carbon emission index takes up more weight; meanwhile, the distance between the operator and the forklift and the dwell time when the equipment is working have a greater impact on the work efficiency; therefore, the weights are also taken into consideration when setting the weights. The specific weight allocation is shown in Table 21.
Table 21.
Disassembly line layout evaluation index weighting table.
5.2.2. Evaluation of Weighted Gray Correlation Analysis Method
- (1)
- Determining the reference series and comparison series
The reference series refers to the series reflecting the characteristics of the system behavior, and the optimal data (i.e., the largest/minimum data among different indicators) derived from the evaluation of each program is taken here to form the reference series
The data of the corresponding indicators of the other programs were taken to form a comparative series, and the relevant series were organized as follows in Table 22.
Table 22.
List of reference columns and comparisons for each program.
Form an addendum matrix A by comparing the reference series with the comparison series.
- (2)
- Dimensionless processing
Each data unit is different, resulting in its dimensionality is not the same. To facilitate comparison, the initial data comparison series is divided by the reference series to obtain the dimensionless matrix E.
- (3)
- Gray correlation coefficient ξ
The gray correlation coefficient ξ between indicator data of indicator i in optimization scheme j and the corresponding indicator data in the reference series.
The correlation matrix M. can be obtained as follows:
- (4)
- Finding the correlation degree
The average of the correlation coefficients of the index data in each scheme is taken to quantify the comparison series and the reference series. Then, let each weight vector be . Then the correlation degree R.
Importing the data from the simulation modeling, we can calculate as follows:
- (5)
- Ranking
The correlation degree of each scheme was ranked. From 0.86475> 0.75694> 0.59682, the correlation degree of option 1 is the largest. In summary, the disassembly line layout scheme is the best.
5.3. Analysis of the Optimal Disassembly Line Layout Scheme
From the SLP analysis, layout simulation modeling run, and decarbonization weighted correlation analysis, we can obtain the disassembly line layout scheme one as the optimal scheme of low carbon disassembly line layout. Based on meeting the efficiency, operating cost, and balance of the disassembly line, this solution has limited and optimized the carbon emission of the system from the operation flow to the partition layout to a great extent. However, the solution has a long waiting time for forklifts and operators, and the staff and forklift configuration of the disassembly line can be further optimized in the subsequent practical application. Overall, this solution improves the efficiency of the disassembly line in the logistics center and reduces the cost of disassembly line operations while reducing the carbon emissions of the existing disassembly line layout. The optimal disassembly line layout scheme is shown in Figure 18.
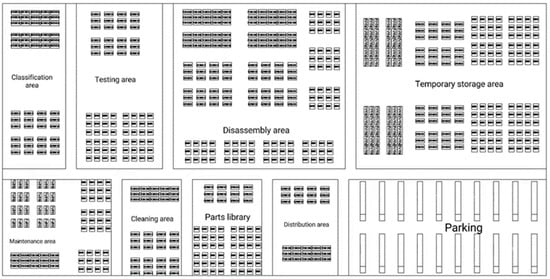
Figure 18.
Optimal disassembly line layout plan.
5.4. Low-Carbon Disassembly Line Layout Optimization Safeguards
The optimization and improvement of the low-carbon disassembly line require not only the optimal design of the layout but also the corresponding logistics center to provide certain safeguards for the optimization of the layout in terms of other infrastructure.
5.4.1. Introduction of Modern New Equipment
In recent years, driverless technology and Internet of Things technology have started being widely tested and applied in the logistics industry, especially in the emerging logistics industrial park. The introduction of new modern technologies has considerable advantages over traditional logistics parks in terms of saving human resources, improving the efficiency and accuracy of disassembly line operations, and reducing the carbon emissions generated by the overall operation of the disassembly line. At the same time, the further use of IoT technology can also improve the relevance of the low-carbon disassembly line to the whole reverse logistics system while enabling the reverse logistics to be traced back to the forward logistics, which is also beneficial to the arrangement and optimization of the disassembly line in a more specific and better suited way.
5.4.2. Training of Relevant Staff
While ensuring that the process layout and hardware facilities are relatively optimal, the training of relevant staff of the disassembly line also needs to be consistently followed up. The logistics center needs to make a corresponding training plan for the teaching of the use of the new modern equipment after the change of the operation process, the professional division of labor and work arrangement of the staff, and the cultivation of green and sustainable thinking of the operators and other staff.
6. Conclusions
At present, compared with the developed countries with better adapted logistics system, the construction of reverse logistics system in China is still in the exploration stage, in which the disassembly line part still has many problems such as non-standardized operation process and unreasonable layout. The significance of reverse logistics is to maximize the recycling of goods and achieve sustainable development; however, the unreasonable layout of the disassembly line may lead to an increase in excess carbon emissions, weakening the green and low-carbon attributes of reverse logistics. In the general environment of green economy and circular economy, the development of reverse logistics is a current trend, which is crucial to realize the recycling of resources and better empower enterprises. In this paper, we take the reverse logistics processing center of Company H in the home appliance industry as the object to study its layout optimization, investigate and understand its layout status and operation process, and analyze the problems of its operation process and layout. With reference to the disassembly line layout and related data of the company’s existing reverse logistics processing center, the objectives of low-carbon disassembly line layout optimization were formulated, the layout elements of the disassembly line were analyzed, and the initial optimization design of the disassembly line process and layout was carried out using the SLP analysis method, and three different optimization schemes were initially derived. After the required relevant data were counted, Flexsim simulation software was applied to model and run the three initial layout scenarios of the assembly line, and the simulation results were synthesized and analyzed. The results were further evaluated and analyzed by introducing carbon emissions and other indicators related to the assembly line. Finally the best layout optimization scheme for the assembly line was derived, aiming to create a standardized, professional, energy-saving and efficient reverse logistics processing center, and expecting to provide guidance and reference for other enterprises.
This paper uses Flexsim simulation modeling to simulate the actual operating conditions; however, due to the limitations of the model itself and the running time, there are inevitable errors between the simulation result data and the actual situation, and the modeling may not be able to fully consider the details of the real operation and the possible emergencies. The index weights of the data analysis are subjective, which may lead to a tendency of the result situation. For the abovementioned possible problems, further in-depth research can be conducted in the future.
Author Contributions
Conceptualization, J.M. and J.C.; methodology, J.C.; software, J.C.; validation, X.L. and H.Z.; formal analysis, J.C. and D.Y.; investigation, J.M.; resources, X.L.; data curation, J.C.; writing—original draft preparation, J.C.; writing—review and editing, H.Z.; visualization, D.Y. and X.L.; supervision, D.Y. and H.Z.; project administration, H.Z. and D.Y. All authors have read and agreed to the published version of the manuscript.
Funding
This research received no external funding.
Institutional Review Board Statement
Not applicable.
Informed Consent Statement
Not applicable.
Data Availability Statement
Not applicable.
Conflicts of Interest
The authors declare no conflict of interest.
References
- Zhou, Z.D.; Liu, J.Y.; Pham, D.T.; Xu, W.J.; Ramirez, F.J.; Ji, C.Q.; Liu, Q. Disassembly sequence planning: Recent developments and future trends. Proc. Inst. Mech. Eng. Part B-J. Eng. Manuf. 2019, 233, 1450–1471. [Google Scholar] [CrossRef]
- Malekkhouyan, S.; Aghsami, A.; Rabbani, M. An integrated multi-stage vehicle routing and mixed-model job-shop-type robotic disassembly sequence scheduling problem for e-waste management system. Int. J. Comput. Integr. Manuf. 2021, 34, 1237–1262. [Google Scholar] [CrossRef]
- Kumar, G.A.; Bahubalendruni, M.V.A.R.; Prasad, V.S.S.; Sankaranarayanasamy, K. A multi-layered disassembly sequence planning method to support decision making in de-manufacturing. Sadhana-Acad. Proc. Eng. Sci. 2021, 46, 102. [Google Scholar] [CrossRef]
- Wang, K.P.; Gao, L.; Li, X.Y.; Li, P.G. Energy-efficient robotic parallel disassembly sequence planning for end-of-life products. IEEE Trans. Autom. Sci. Eng. 2022, 19, 1277–1285. [Google Scholar] [CrossRef]
- Xing, Y.F.; Liu, Q. Partial disassembly sequence planning based on Pareto ant colony algorithm. In Proceedings of the 28th Chinese Control and Decision Conference, Yinchuan, China, 28–30 May 2016. [Google Scholar]
- Xiao, Z.D.; Sun, J.N.; Shu, W.J.; Wang, T.W. Location-allocation problem of reverse logistics for end-of-life vehicles based on the measurement of carbon emissions. Comput. Ind. Eng. 2019, 127, 169–181. [Google Scholar] [CrossRef]
- Kilic, H.S.; Cebeci, U.; Ayhan, M.B. Reverse logistics system design for the waste of electrical and electronic equipment (WEEE) in Turkey. Resour. Conserv. Recycl. 2015, 95, 120–132. [Google Scholar] [CrossRef]
- Sangwan, K.S. Key activities, decision variables and performance indicators of reverse logistics. In Proceedings of the 24th CIRP Conference on Life Cycle Engineering (CIRP LCE), Kamakura, Japan, 8–10 March 2017. [Google Scholar]
- Babaeinesami, A.; Ghasemi, P.; Chobar, A.P.; Sasouli, M.R.; Lajevardi, M. A New wooden supply chain model for inventory management considering environmental pollution: A genetic algorithm. Found. Comput. Decis. Sci. 2022, 47, 383–408. [Google Scholar] [CrossRef]
- Ghasemi, P.; Khalili-Damghani, K.; Hafezolkotob, A.; Raissi, S. A decentralized supply chain planning model: A case study of hardboard industry. Int. J. Adv. Manuf. Technol. 2017, 93, 3813–3836. [Google Scholar] [CrossRef]
- Kusakci, A.O.; Ayvaz, B.; Cin, E.; Aydin, N. Optimization of reverse logistics network of end of life vehicles under fuzzy supply: A case study for Istanbul Metropolitan Area. J. Clean. Prod. 2019, 215, 1036–1051. [Google Scholar] [CrossRef]
- Liu, C.M. Clustering techniques for stock location and order-picking in a distribution center. Comput. Oper. Res. 1999, 26, 989–1002. [Google Scholar] [CrossRef]
- Ji, S.W.; Li, X.T.; Wang, Y. The research of order picking optimization based on Jointown Pharmaceutical Logistics Center. Appl. Mech. Mater. 2014, 701–702, 94–97. [Google Scholar] [CrossRef]
- Zhang, Q.; Jiang, C.S.; Zhang, J.; Wei, Y.G. Application of genetic algorithm in functional area layout of railway logistics park. Procedia-Soc. Behav. Sci. 2014, 138, 269–278. [Google Scholar] [CrossRef]
- Chittratanawat, S.; Noble, J.S. An integrated approach for facility layout, P/D location and material handling system design. Int. J. Prod. Res. 1999, 37, 683–706. [Google Scholar] [CrossRef]
- Lee, K.Y.; Han, S.N.; Roh, M.I. An improved genetic algorithm for facility layout problems having inner structure walls and passages. Comput. Oper. Res. 2003, 30, 117–138. [Google Scholar] [CrossRef]
- Liu, Y.; Zhao, Q. Research on logistics center layout based on SLP. Proceedings of China Modern Logistics Engineering; Springer: Berlin/Heidelberg, Germany, 2015; pp. 17–28. [Google Scholar]
- Ayvaz, B.; Bolat, B.; Aydin, N. Stochastic reverse logistics network design for waste of electrical and electronic equipment. Resour. Conserv. Recycl. 2015, 104, 391–404. [Google Scholar] [CrossRef]
- John, S.T.; Sridharan, R.; Kumar, P.N.R.; Krishnamoorthy, M. Multi-period reverse logistics network design for used refrigerators. Appl. Math. Model. 2018, 54, 311–331. [Google Scholar] [CrossRef]
- Kannan, D.; Garg, K.; Jha, P.C.; Diabat, A. Integrating disassembly line balancing in the planning of a reverse logistics network from the perspective of a third party provider. Ann. Oper. Res. 2017, 253, 353–376. [Google Scholar] [CrossRef]
- Zhang, L.; Zhao, X.K.; Ke, Q.D.; Dong, W.F.; Zhong, Y.J. Disassembly line balancing optimization method for high effciency and low carbon emission. Int. J. Precis. Eng. Manuf.-Green Technol. 2019, 8, 233–247. [Google Scholar] [CrossRef]
- Zhang, Z.W.; Guo, X.W.; Zhou, M.C.; Liu, S.X.; Qi, L. Multi-objective discrete grey wolf optimizer for solving stochastic multi-objective disassembly sequencing and line balancing problem. In Proceedings of the IEEE International Conference on Systems, Man, and Cybernetics (SMC), Toronto, ON, Canada, 11–14 October 2020. [Google Scholar]
- Yang, Y.S.; Yuan, G.; Zhuang, Q.W.; Tian, G.D. Multi-objective low-carbon disassembly line balancing for agricultural machinery using Mdfoa and fuzzy. Ahpjournal Clean. Prod. 2019, 233, 1465–1474. [Google Scholar] [CrossRef]
- Viswanathan, S.; Allada, V. A framework for the flexible grouping of products for disassembly. J. Electron. Manuf. 1999, 9, 53–66. [Google Scholar] [CrossRef]
- Zheng, Y.; Zhan, B. SLP-based layout optimization of logistics workshop facilities of Huai’an courier post. In Proceedings of the 3rd Int Conference Transportation Information Safety, Wuhan, China, 25–28 June 2015. [Google Scholar]
- Lan, X.J.; Wang, Y.L.; Shen, M.M. SLP analysis on manufacturing enterprise’s facility layout. In Proceedings of the 5th International Conference on Material Handling, Chongqing, China, 1–3 November 2005. [Google Scholar]
- Tang, H.T.; Lan, X.J.; Chen, Y. Case study: SLP analysis about plant facility layout and its optimization scheme. In Proceedings of the 5th Wuhan International Conference on E-Business, Wuhan, China, 27–28 May 2006. [Google Scholar]
- Zhang, F.; Zhang, J.G.; Bai, J.; Jiang, M.; Xiong, Q.; Zhou, Z.S.; Zhang, X.D. Optimization analysis of eatery facilities layout based on SLP and dynamic simulation. In Proceedings of the 15th International Conference on Industrial Engineering and Engineering Management, Zhengzhou, China, 20–22 September 2008. [Google Scholar]
- Zhang, W.M.; Du, Y.P.; Wang, X.H. Facility layout optimization design of a printing enterprise. In Proceedings of the 4th International Conference on Logistics, Informatics and Service Science (LISS), Beijing, China, 23–26 June 2014. [Google Scholar]
- Xu, M.Z.; Wang, Y.; Yang, H.G.; Wang, L.; Han, L.B.; Yu, H.Y.; Xu, W.T.; Ma, J. Simulation and optimization of intelligent workshop layout and logistics transportation by system layout planning combined with em-plant. In Proceedings of the 10th IEEE International Conference on Software Engineering and Service Science (ICSESS), Beijing, China, 18–20 October 2019. [Google Scholar]
- Zhang, Y.H.; Chau, S.P.; Wang, D. The research on optimization of plant layout of Viet Thinh Garment Company. In Management Engineering and Applications; Aussino Acad Publ Housepo Box 893: Marrickville, NSW, Australia, 2010; pp. 205–211. [Google Scholar]
- Liao, S.C.; He, W.; Zhou, H.L. Study on the layout planning and optimization for an electronic product workshop based on cell manufacturing. In Proceedings of the International Conference on Automation, Mechanical Control and Computational Engineering (AMCCE), Jinan, China, 24–26 April 2015. [Google Scholar]
- Wang, J.; Ke, X.S. Spatial layout optimization of warehouse based on improved SLP. In Proceedings of the 2nd International Conference on Mechanical Engineering, Industrial Materials and Industrial Electronics (MEIMIE), Dalian, China, 29–30 March 2019. [Google Scholar]
- Li, H.L.; Wang, Y.M.; Fan, F.Y.; Yu, H.J.; Chu, J.W. Sustainable plant layout design for end of life vehicle recycling and disassembly industry based on SLP method, a typical case in China. IEEE Access 2021, 9, 81913–81925. [Google Scholar] [CrossRef]
- Nordgren, W.B. Flexsim simulation environment. In Proceedings of the 36th Winter Simulation Conference, New Orleans, LA, USA, 7–10 December 2003. [Google Scholar]
- Zhang, F.; Tian, C. Study on modeling and simulation of logistics sorting system based on Flexsim. In Proceedings of the International Conference on Computer Network, Electronic and Automation (ICCNEA), Xi’an, China, 23–25 September 2017. [Google Scholar]
- Lavery, E.; Nordgren, B.; King, C.; Hullinger, R. Flexsim modeling environment. In Proceedings of the Asia Simulation Conference/6th International Conference on System Simulation and Scientific Computing, Beijing, China, 24–27 October 2005. [Google Scholar]


Disclaimer/Publisher’s Note: The statements, opinions and data contained in all publications are solely those of the individual author(s) and contributor(s) and not of MDPI and/or the editor(s). MDPI and/or the editor(s) disclaim responsibility for any injury to people or property resulting from any ideas, methods, instructions or products referred to in the content. |
© 2023 by the authors. Licensee MDPI, Basel, Switzerland. This article is an open access article distributed under the terms and conditions of the Creative Commons Attribution (CC BY) license (https://creativecommons.org/licenses/by/4.0/).