Abstract
In fracture zones, tunneling with a double-shield Tunnel Boring Machine (TBM) presents significant challenges, including deformation overrun of the surrounding rock, TBM jamming, and excavation face collapse. To assure the tunnel construction safety and efficiency, it is necessary and crucial to conduct a stability analysis of the tunnel surrounding rock when a TBM passes through the fracture zones. The tunnels from Jiadingshan Road Station to Anshan Road Station in Qingdao Metro Line 8 are constructed by double-shield TBMs. It inevitably passes through fracture zones with different deterioration levels and dip angles. In this study, based on this construction section, numerical models of fracture zones with different deterioration levels and dip angles were developed to analyze the displacements of tunnel vaults, inverts, and haunches. In addition, the maximum shear stresses of the surrounding rock were analyzed. Finally, the displacement and shear stress variation patterns of the surrounding rock with different deterioration levels and dip angles were obtained. The findings reveal the stability behavior of tunnels under various fracture zones. They can serve as a valuable reference and theoretical foundation for future tunnel construction projects utilizing double-shield TBMs in areas with fracture zones.
1. Introduction
China’s escalating urbanization has led to a surge in demand for underground infrastructure, driving the construction of urban subway tunnels. The high level of automation and safety offered by Tunnel Boring Machines (TBMs) has facilitated widespread adoption in this field. In September 2009, Qingdao Metro evaluated the suitability of different TBMs and found that the double-shield TBM method is more suitable for Qingdao’s predominantly hard-rock strata. Therefore, the double-shield TBMs have been used to construct tunnels for Qingdao Metro lines 1, 4, 6, and 8. However, as double-shield TBMs are boring through a considerable distance, it is unavoidable to cross adverse geological sections, such as fracture zones. The varying width and dip of the fracture zones and the rock masses’ physical and mechanical properties influence tunnel surrounding rock stability. It presents several potential construction challenges, including excavation surface instability, ground settlement overrun, TBM jams, tunnel collapse, and other engineering accidents. Therefore, to assure the tunnel construction safety and efficiency, it is necessary and crucial to conduct stability analysis of the tunnel surrounding rock when a TBM passes through fracture zones.
There have been many studies about the construction risk evaluation of TBM tunneling through fracture zones and technical measures to mitigate risks. Peng et al. [1] and Xue et al. [2] established the cloud models to assess water inrush risk in tunnels using geological analysis and risk assessment indicators. Both models have been verified and applied under the actual tunnel excavation conditions, which improve the accuracy of the risk assessment of water inrush in the tunnel through water-rich faults. Newman et al. [3] monitored the operating parameters, such as cutter head torque, thrust, and injection of spoil-conditioning additives. The monitoring information can be used to validate the pre-construction geological model and provide valuable assurances for the predicted ground ahead of tunneling operations. Liu et al. [4] and Li et al. [5] suggested a comprehensive prospecting method to ensure safe TBM tunneling to identify adverse geological bodies, including fractured zones and water-bearing structures. In addition, some other practical experiences and techniques, such as consolidation grouting, which have been used to overcome the challenges of TBM tunneling in fracture zones, were investigated [6,7,8]. However, although there have been considerable advancements in risk assessment and control for TBMs crossing through fracture zones, the existing methods still have some limitations: (1) These methods can only provide qualitative or semi-quantitative information, often lack the quantitative analysis and accurate results. In this case, they can only offer general guidelines for tunnel constructions in such conditions; (2) These methods frequently failed to consider the complex geological conditions and variations in tunnel design, resulting in a lack of adaptability. Therefore, further study is required to understand the influence of fracture zones on tunnel displacement and the surrounding rock’s plastic zone.
For the complex geological conditions and changeable surrounding rock behaviors of tunnel construction through fracture zones, the numerical approach is a feasible method to study the influence of fracture zones on tunnel displacement and stress variations. Huang et al. [9] investigated the deformation and failure of the surrounding rock mass triggered by sudden changes in rock quality encountered during tunnel excavation, using the Daliang Tunnel on the Lanzhou-Urumqi railway as a case study. The study combined in situ measurement, theoretical research, and numerical simulation to explore the deformation of the surrounding rock mass in and around fracture zones. The results indicate that the increasing misalignment distance of fracture zones increases the stress level on the tunnel lining. Xie et al. [10] developed a 3D coupled computational fluid dynamics-discrete element method model for fluid–solid interaction systems and successfully simulated the water and mud inrush process in a water-rich fault tunnel. The results revealed the evolution process of water and mud inrush and the formation of an ellipsoidal collapse area inside the fracture zone. Zaheri et al. [11] investigated the impact of strike-slip fault movement on the segmental linings using three-dimensional numerical modeling. The results suggest that the fault dip angle significantly affects the separation of lining segments and denser soils experience more significant tunnel displacement after faulting. The other researchers have also carried out experimental, analytical, numerical, and in situ research for different fracture strata under various conditions, thus explaining the patterns and mechanisms of TBM tunneling in fracture zones [12,13,14,15,16,17,18,19,20,21,22]. However, these studies primarily focused on TBM tunneling through the high in situ stress, deeply buried mountain or hydro tunnels. By contrast, the time of application of double-shield TBMs in urban subway construction is still short. Urban subway tunnels are generally constructed at relatively shallow depths and under complex geological conditions. More specifically, the deformation and stress mechanisms of the tunnel surrounding rock when a TBM tunnels through fracture zones with different characteristics (e.g., different deterioration levels and dip angles) remain immature.
This study addresses this gap by analyzing the fracture zone between Jiading Mountain Station and Anshan Road Station of Qingdao Metro Line 8. Flac3D was employed to establish numerical models of the tunnels, followed by a comprehensive analysis of their stability under different simulation conditions. The study revealed the displacement patterns at critical points of the tunnel, including the vault, invert, and haunch. Additionally, the analysis results illustrate the variation characteristics of shear stress in the surrounding rock under different fracture zone conditions. The findings in this study can provide valuable guidelines for designing and constructing subway tunnels with enhanced safety and efficiency, particularly in areas with intricate geological conditions.
2. Engineering Survey
Qingdao Metro Line 8’s tunnel alignment between Jiading Shan Road Station and Anshan Road Station extends over 2459.559 m. It starts at K55 + 102.735 and ends at K57 + 562.294. The tunnel is constructed using parallel boring, with a spacing of approximately 6–10 m between them. The geology of this section is characterized by the presence of plain fill, strongly weathered granite, medium weathered granite, and slightly weathered granite strata. Groundwater is abundant and unevenly distributed, primarily consisting of pore water and fourth-system bedrock fracture water. The Cangkou fault, marked by a strike of 40°, an inclination of 310°, and dips ranging from 50 to 86°, significantly impact this section. The central section of the fault is the widest, reaching a width of 100 m. It is characterized by the development of cataclastic rocks, silty rocks, and mylonite. Multiple fracture zones, influenced by the Cangkou fault, are present in this area, as depicted in Figure 1. The section is excavated using a CSIC φ7032 double-shield TBM, which has a maximum total thrust of 19,396 kN, a maximum speed of 8.2 rpm, a maximum torque of 3947 kN·m, and a stripping torque of 6600 kN·m. The TBM cutter has 25 face cutters of 4830 mm diameter, 8 centrals, and 10 gauge cutters.
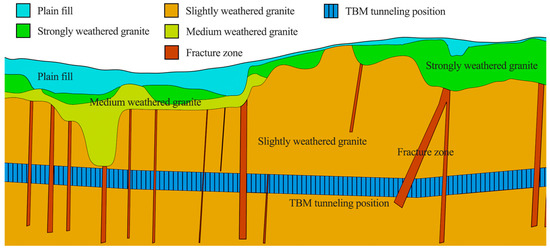
Figure 1.
Geological profile of Jiading Mountain Road Station–Anshan Road Station.
3. Numerical Modeling
3.1. Determination of Models
This study investigated the effects of different deterioration levels and fracture zone dip angles on the tunnel’s stability. Several assumptions were made, and critical factors were focused on simplifying the numerical modeling. It is assumed that the tunnel structure and surrounding rock are isotropic, homogeneous, and exhibit exemplary elastic-plastic behavior. In the numerical model, the initial ground-stress field was determined by considering only the self-weight of the rock. This approach does not account for the potential influence of groundwater conditions on the ground-stress field.
Based on the geological profile of the Jiadingshan Road–Anshan Road section, numerical models of the section containing the fracture zone were established. The models in this study were composed of layers of plain fill, strongly weathered granite, medium weathered granite, and slightly weathered granite. These models were simplified using a half-tunnel model to take advantage of symmetry. The total width of the model along X direction was set to be three to five times the tunnel diameter according to St. Venant’s principle to prevent boundary effects, resulting in a final width of 40 m. Similarly, the model’s height along the Z-direction was 60 m, with 30 m each from the tunnel axis to its top and bottom. The length of the model along Y-direction was 120 m. The diameter of the TBM excavated tunnel was 6.3 m. In addition, to make the simulation more representative of the boring process, a TBM shell unit and a liner tube sheet unit were incorporated to simulate the effects of the TBM on the tunnel. The thickness of the shield shell unit was set as 60 mm, and the thickness of the liner unit was set as 300 mm. The model’s normal displacement was limited by normal constraints around and at its bottom, with no constraint on its top. The numerical model geometry is illustrated in Figure 2.
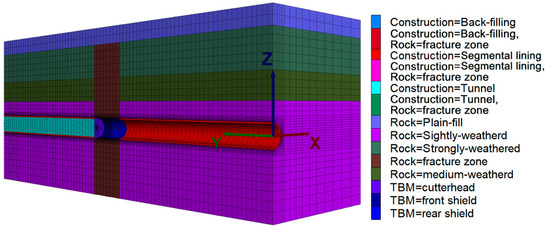
Figure 2.
Numerical model geometry.
3.2. Mechanical Parameters of Materials and Boring Steps
The geotechnical deformation in this numerical model follows the Mohr–Coulomb strength criterion. Elastic deformation assumptions were adopted for the liner and grouting, while the TBM cutter and shield body were regarded as rigid materials. Based on the detailed stratigraphic survey report and TBM equipment parameters from Jiading Shan Road Station to Anshan Road Station, Table 1 displays each unit’s physical and mechanical parameters. In addition, the parameters after solidification were utilized for the grouting units to simplify the calculation.

Table 1.
Physical and mechanical parameters of stratigraphic and TBM equipment units.
In order to better simulate the double-shield TBM boring process, a normal surface stress of 5 × 10⁵ Pa at the excavation face was set to simulate the stress acting on the face by the double-shield TBM. The TBM cutter and shield body moved forward by 1.5 m during each excavation cycle, removing the tunnel, liner, and grouting unit. Subsequently, material parameters were assigned to the grouting unit and liner unit to represent the assembly of the end grouting and tube sheet of the TBM shield. Following these steps, the excavation process was carried out in a cycle until the end of the model excavation.
4. Influence Pattern of the Fracture Zone’s Deterioration Levels on the Tunnel Stability
4.1. Scheme Design for Models under Different Deterioration Levels
A fracture zone’s width and degree of fragmentation are crucial indicators of its deterioration. In order to examine the impact of deterioration on tunnel stability, twelve sets of models incorporating fracture zones were developed. These models simulated changes in deterioration by using fracture zones with varying widths and degrees of fragmentation (elastic modulus and cohesion). The angle between the fracture zone and the tunnel axis, denoted as θ, was a constant value of 90° in this model. Figure 3 illustrates a schematic representation of the numerical model that considers various levels of deterioration of the fracture zone. Table 2 presents the simulation schemes for different levels of deterioration of the fracture zone.
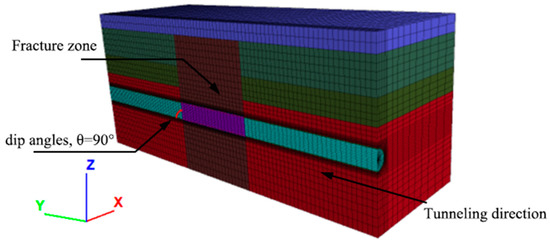
Figure 3.
Numerical model considering different deterioration levels of the fracture zone.
Table 2.
Simulation scheme sets for different levels of deterioration of the fracture zone.
4.2. Displacement Patterns in the Tunnel under Different Levels of Fracture Zone Deterioration
After conducting numerical simulations of twelve scheme sets with varying levels of deterioration, the maximum displacements and their corresponding locations at the vault, invert, and haunch were determined accordingly. Table 3 presents the numerically obtained results under various levels of deterioration of the fracture zone.
Table 3.
Maximum displacement of tunnel under different levels of deterioration of the fracture zone.
Table 3 illustrates that the maximum displacement in the tunnel occurs within a range of 60 to 65 m when a double-shielded TBM tunnels through a fracture zone. This displacement occurs regardless of the tunnel vault, invert, or haunch. It implies that the maximum area of tunnel deformation occurs within the fracture zone. This observation is consistent with previous studies, which showed that the stability of tunnels in fractured zones is significantly affected by the degree of fragmentation. In addition, it is reported that the occurrence of the largest displacement is located at the TBM’s arrival in the middle of fracture zone [23,24].
The results also indicate that the width of the fracture zone has a limited impact on tunnel displacement. Specifically, it has been demonstrated that when the degree of fragmentation in the fracture zone remains constant, the maximum displacement values at the tunnel vault, invert, and haunch are virtually invariable. Even though the width of the fracture zone may vary, the effects are insignificant. However, with an increase in fragmentation, which is represented by a decrease in the elastic modulus and cohesive stress of the fracture zone rock, the location of the maximum tunnel displacement changes significantly. It is evidenced by the fact that as the degree of fragmentation increases, the maximum displacement values at the tunnel vault, invert, and haunch increase significantly. Furthermore, for a large degree of fragmentation, the maximum displacement of the tunnel surrounding rock increases with the increase in the tunnel width but with a lesser increase in extent.
To further investigate the influence of a fracture zone’s width on the stability of tunnels, numerical models with an elastic modulus of 400 MPa and cohesion of 0.55 MPa were screened. The models were utilized to statistic the maximum displacements at the tunnel vault, invert, and haunch of double-shield TBMs traversing fracture zones of varying widths. The results are shown in Figure 4.
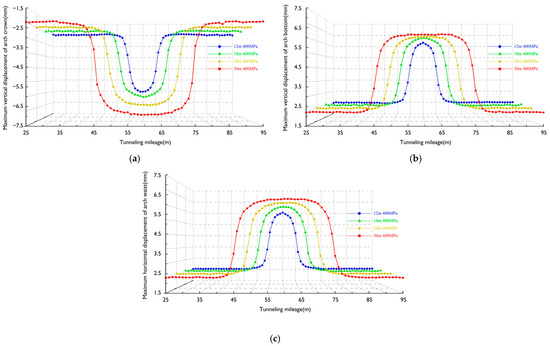
Figure 4.
Results of tunnel surrounding rock displacement analysis under different fracture zone widths. (a) Maximum vertical displacement of tunnel vault. (b) Maximum vertical displacement of tunnel invert. (c) Maximum horizontal displacement of tunnel haunch.
Figure 4 illustrates that the vertical displacement value at the tunnel vault is relatively small, approximately 2.20 mm, before the double-shield TBM crosses through the fracture zone. The tunnel invert’s heave and the tunnel haunch’s horizontal displacement are also relatively minimal. Upon the double-shield TBM’s entry into the fracture zone, the displacement at the tunnel vault experienced a significant increase. At the same time, the heave at the tunnel invert and the horizontal displacement at the tunnel haunch also increase rapidly. Once the double-shield TBM has passed through the fracture zone, the displacement at the tunnel vault, invert, and haunch returns to the level before crossing the fracture zone.
According to Figure 4a, the maximum vertical displacement at the tunnel vault increases with an increase in the width of the fracture zone, but the increase is moderate. Meanwhile, the deformation trough of the vault settlement curve also becomes wider, thereby impacting settlement in the non-fracture zone on both sides of the fracture zone. Similar tendencies are also observed from the variation profiles of the heave displacement in Figure 4b and the horizontal displacement in Figure 4c.
Three sets of models were set up with a fracture zone width of 18 m to investigate the influence of the degree of fragmentation on the stability of the tunnel under constant fracture zone width. Similarly, the maximum displacements at the tunnel vault, invert, and haunch were analyzed under different fragmentation, as depicted in Figure 5.
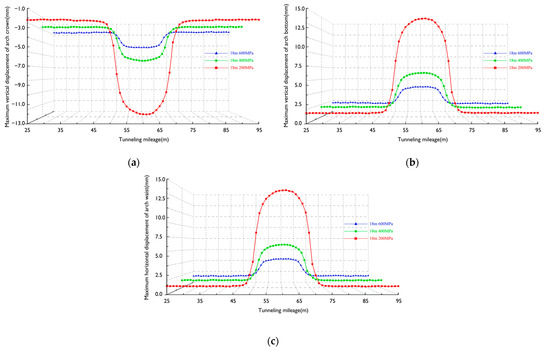
Figure 5.
Results of tunnel displacement analysis under different degrees of fracture zone fragmentation. (a) Maximum vertical displacement of tunnel vault. (b) Maximum vertical displacement of tunnel invert. (c) Maximum horizontal displacement of tunnel haunch.
Figure 5 illustrates that the maximum displacements at the tunnel vault, invert, and haunch in the fracture zone area are significantly larger than in the non-fracture zone area. This is consistent with what was previously demonstrated. When the width of the fracture zone remains constant, an increase in the degree of fragmentation, represented by a decrease in the elastic modulus and cohesion of the fracture zone rock, results in a significant increase in the maximum displacement at the tunnel vault, invert, and haunch. As illustrated, the vertical displacement at the tunnel vault increases from 4.29 to 12.03 mm, the vertical heave of the tunnel invert increases from 4.49 to 12.33 mm, and the horizontal displacement of the tunnel haunch increases from 4.43 to 12.84 mm. Instead of impacting the width of the deformation trough, the increase in fragmentation primarily affects tunnel displacement.
In summary, the deterioration of the fracture zone, in terms of width and degree of fragmentation, significantly impacts the tunnel’s stability. An increase in the fracture zone’s width expands the tunnel deformation range. The degree of fragmentation increases as its relevant mechanical parameters, i.e., the elastic modulus and cohesion, decrease in the fracture zone, leading to a significant increase in the tunnel’s deformation displacement value. The maximum displacement value of the tunnel also increases with the increase in the fracture zone width, although the increase is relatively small.
4.3. Shear Stress Patterns in the Surrounding Rock under Different Levels of Fracture Zone Deterioration
Under three-dimensional stress states, shear failure is the most prevalent failure mode for geotechnical structures. Consequently, further analysis of maximum shear stress in the surrounding rock of a double-shield TBM tunnel was conducted. It aims to reveal the effects of various levels of fracture zone deterioration on the shear stress pattern in surrounding rock. The results of this analysis are presented in Figure 6 and Figure 7. Figure 6 illustrates the variations of the maximum shear stress patterns in the surrounding rock with different fracture zone’s widths under constant fragmentation degree. By contrast, Figure 7 illustrates the variations of the maximum shear stress patterns in the surrounding rock with different degrees of fracture zone fragmentation under constant fracture zone width.
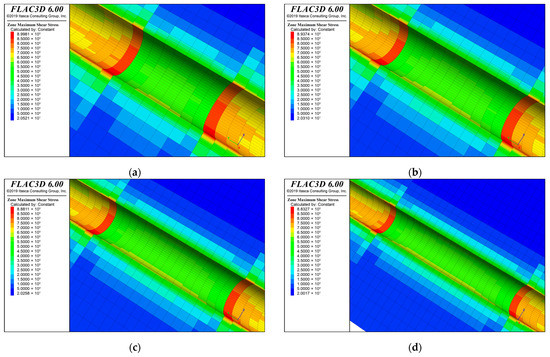
Figure 6.
Maximum shear stress patterns in the surrounding rock with different fracture zone widths under constant fragmentation degree (elastic modulus of 600 MPa). (a) Width 12 m. (b) Width 18 m. (c) Width 24 m. (d) Width 30 m.


Figure 7.
Maximum shear stress patterns in the surrounding rock with different degrees of fracture zone fragmentation under constant fracture zone width (width of 18 m). (a) Elastic modulus 600 MPa. (b) Elastic modulus 400 MPa. (c) Elastic modulus 200 MPa.
As shown in Figure 6, the magnitude of the maximum shear stress in the surrounding rock does not exhibit a significant change with the increase in the fracture zone width under a constant fragmentation degree, reaching a value of approximately 9.89 × 10⁵ Pa. It implies that the fracture zone width minimally influences the maximum shear stress in the surrounding rock. By contrast, as shown in Figure 7, the magnitude of the maximum shear stress in the surrounding rock increases significantly from 9.00 × 10⁵ to 1.17 × 10⁶ Pa with the increase in the degree of fragmentation under constant fracture zone width. This is consistent with the previous study, which also found that the degree of fragmentation of the fracture zone significantly impacts the mechanical behavior of tunnels crossing the fracture zone [25]. The numerical results indicate that various factors, including the degree of fragmentation and fracture width, affect the mechanical characteristics of the tunnel structure. However, the effect of the degree of fragmentation on the shear stress in the surrounding rock is more significant than that of the fracture zone width. The degree of fracture zone deterioration mainly depends on the degree of fracture zone fragmentation, represented by the mechanical properties of the geotechnical body of the fracture zone. Figure 6 and Figure 7 show that the surrounding rock’s maximal shear stress occurs near the tunnel invert at both ends. The results reveal that shear failure is most likely to occur at the tunnel invert at both ends of the zone regardless of the fracture width or degree of fragmentation.
5. Influence Pattern of the Fracture Zone’s Dip Angles on the Tunnel Stability
5.1. Scheme Design for Models under Different Dip Angles
The stability of a tunnel is also affected by the dip angles of the fracture zone. Numerical models were established considering different dip angles of the fracture zone to investigate the effect of the dip angles on the stability of the surrounding rock. To achieve good control effect, the fracture zone width was kept at 18 m, the deterioration levels of the fracture zone were maintained at 400 MPa in elastic modulus, the Poisson ratio was 0.35, and the cohesion was 0.5 MPa. The schematic representation of the numerical model considering varying dip angles is illustrated in Figure 8. The angle θ between the fracture zone and the tunnel axis ranges from 45° to 135°. Table 4 lists the simulation schemes for seven different fracture zone dip angles.

Figure 8.
Numerical model considering different dip angles of fracture zone.
Table 4.
Simulation schemes for different dip angles of the fracture zone.
5.2. Displacement Pattern in Tunnels under Different Dip Angles of Fracture Zone
The maximum displacement and corresponding locations at the tunnel vault, invert, and haunch were obtained by conducting numerical simulations under seven different dip angles of the fracture zones (as listed in Table 4). The numerical results are summarized in Table 5. Same as above (see Section 3.2), to evaluate the surrounding rock deformation within the fracture zone, the variation profiles of the maximum displacement of the tunnel within the fracture zones and adjacent regions are shown in Figure 9.
Table 5.
Maximum displacement of tunnel under different dip angles of fracture zone.
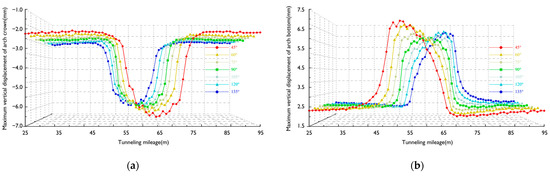
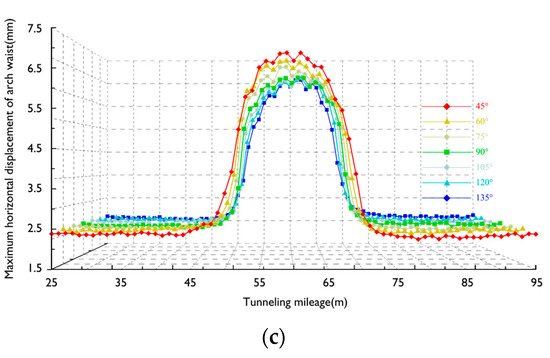
Figure 9.
Results of tunnel surrounding rock displacement analysis under different dip angles of fracture zone. (a) Maximum vertical displacement of tunnel vault. (b) Maximum vertical displacement of tunnel invert. (c) Maximum horizontal displacement of tunnel haunch.
In comparison with the effect of the deterioration levels of the fracture zone (Table 3, Figure 4 and Figure 5), the dip angles of the fracture zone do not significantly affect the surrounding rock displacement at the tunnel vault, invert, and haunch (Table 5 and Figure 9). However, the variation tendencies are still obvious. Table 5 shows that as the dip angle gradually increase from 45° to 135°, a foregoing decrease and subsequent increase in deformation displacements are observed at the tunnel vault, invert, and haunch. The deformation displacements are minimal when the dip angle of the fracture zone is 90°, the minimum of which are 6.25 mm, 6.73 mm, and 6.54 mm for the tunnel vault, invert, and haunch, respectively. Unlike the variation profiles observed in varying deterioration levels of the fracture zone (Figure 4 and Figure 5), the locations of the maximum vertical displacements at the tunnel vault and invert change with dip angles of fracture zone. However, the maximum horizontal displacement of the tunnel haunch is consistently located at Y = 59 m.
As shown in Figure 9, the magnitudes of displacements at the tunnel vault, invert, and haunch in fracture zones are notably higher than those in non-fracture zones. The tunnel vault’s settlement and the tunnel invert’s heave are closely related to the dip angle of the fracture zone. Surrounding rock deformation occurs preferentially when the excavation surface initially enters the fracture zone (vault or invert). The maximum displacement first decreases and then increases with the increase in the dip angle of the fracture zone. The effect of the dip angle of the fracture zone is more pronounced when the dip angle is acute than obtuse. In addition, it should be noted that the dip angle of the fracture zone does not affect the deformation of tunnel haunch.
5.3. Variation Patterns of the Maximum Shear Stress in the Tunnel Surrounding Rock with Different Dip Angles
In order to analyze the effect of dip angles on the tunnel surrounding rock of a double-shield TBM, seven simulation schemes with different dip angles were conducted (listed in Table 5). The numerical results are shown in Figure 10, which displays the variation patterns of the maximum shear stress in the surrounding rock under different dip angles of fracture zone.

Figure 10.
Maximum shear stress patterns in the surrounding rock with different dip angles of fracture zone. (a) dip angle 45°. (b) dip angle 135°. (c) dip angle 60°. (d) dip angle 120°. (e) dip angle 75°. (f) dip angle 105°. (g) dip angle 90°.
As shown in Figure 10, the locations of the maximum shear stress in the surrounding rock are all located at the tunnel invert on the edge of the fracture zone, regardless of the dip angle of the fracture zone. This suggests that the edge of the fracture zone is the most critical area for potential damage to the tunnel lining. In addition, it is observed that the magnitudes of shear stresses are higher under obtuse dip angles than that under acute angles. The corresponding magnitudes of the maximum shear stresses were 1.34 MPa and 1.36 MPa, 1.09 MPa, 1.05 MPa, 1.10 MPa, 1.43 MPa, and 1.37 MPa, respectively. This reveals that the maximum shear stress first decreases and then increases with the increase in the dip angle of the fracture zone. The magnitude of the maximum shear stress of the tunnel surrounding rock is the minimum when the dip angle of the fracture zone is 90°. This implies that tunnels crossing through fracture zones with obtuse dip angles are more vulnerable to shear stress failure than those with acute dip angles [26].
6. Discussion on Simplifying Assumptions for the Numerical Simulations
Based on actual engineering project, this study employs numerical simulations to investigate the deformation and stress variation patterns of tunnel surrounding rock and offers theoretical guidance for designing and constructing tunnels when double-shield TBM tunneling through fracture zone. It should be noted that the modeling process involves certain basic assumptions and simplifications, which may influence the research results:
- (1)
- The initial stress field is assumed to be only affected by the weight of the surrounding rock itself. However, in actual situation, the stress field of underground rocks is affected by various factors, such as tectonic movement, geological history, and seismic activity. This assumption did not consider the influence of other factors and ignored factors such as rock displacement and groundwater level changes. In future research, a more realistic initial stress field model will be established based on actual observation data to improve the accuracy of the simulation results.
- (2)
- The parameters of the grouting unit are based on the assumption that the grout has solidified. This assumption overlooks the grout’s rheological properties and duration, which may not fully reflect the actual behavior of the material. In the future, more data on the grouting parameters will be obtained through laboratory experiments or field tests to better describe the grouting process.
- (3)
- In this study, the Mohr–Coulomb strength criterion was used to describe rock and soil deformation. However, although this model has been widely used in many practical situations and proven effective in previous studies, its assumption cannot sufficiently reflect the complex behavior of rock and its variations in the deformation parameters, which is an aspect we need to improve further. Therefore, our future study will rely on obtaining more realistic material strength data through laboratory experiments and field tests. Additionally, new mechanical models will be developed to describe different types of rocks and strain conditions in more detail and accuracy.
7. Conclusions
In this paper, based on the urban subway construction section between Jiadingshan Road Station and Anshan Road Station of the Qingdao Metro Line 8, we employed numerical modeling to study tunnel surrounding rock’s deformation and stress variations when TBMs tunnel through fracture zones. A comprehensive stability analysis was conducted to investigate the variation patterns of the deformation displacements and the maximum shear stresses in the tunnel surrounding rock of a double-shield TBM under different deterioration levels and dip angles of the fracture zone. Overall, in terms of the deterioration level in the fracture zone, the degree of fragmentation significantly impacts the stability of a double-shield TBM tunnel. The other indicator, the width, has less of an impact on it. The fracture zone’s dip significantly affects specific sections of the tunnel. The detailed conclusions are as follows:
- (1)
- The deterioration level of fracture zone significantly influences the stability of a double-shield TBM tunnel. With the increase in the degree of the fracture zone fragmentation, the magnitudes of the maximum displacements at the tunnel vault, invert, and haunch increase significantly. Under constant deterioration level, as the fracture zone width increases, the deformation displacements of the surrounding rock at the tunnel vault, invert, and haunch increase slightly, and the scope of the influence of the fracture zone deformation increases.
- (2)
- It is observed that the locations of the maximum shear stress in the surrounding rock are all located at the tunnel invert when the double-shield TBM tunnels through the fracture zone. Furthermore, it is found that the fracture zone width has a minimal impact on the maximum shear stress in the tunnel surrounding rock. As the degree of fragmentation increases, the maximum shear stress of the surrounding rock increases.
- (3)
- The numerical results reveal that the maximum vertical displacements at the tunnel vault and invert exhibit a foregoing decrease and subsequent increase as the dip angle of the fracture zone increases. However, the dip angle of the fracture zone has little influence on the horizontal displacement at the tunnel haunch.
- (4)
- The maximum shear stress in the surrounding rock exhibits a foregoing decrease and subsequent increase as the dip angle of the fracture zone increases. The shear stress is minimal when the dip angle of the fracture zone is 90°. In addition, it is observed that the magnitudes of shear stresses under obtuse dip angles are higher than that under acute angles.
Based on actual engineering project, this study employs numerical simulations to investigate the deformation and stress variation patterns of tunnel surrounding rock and offers theoretical guidance for designing and constructing tunnels when double-shield TBMs tunnel through fracture zone. It should be noted that the modeling process involves certain basic assumptions and simplifications, which may influence the research results. Furthermore, the analysis of stress and deformation in the surrounding rock did not consider the influence of groundwater on the fracture zone. Therefore, a coupled flow-solid analysis of the fracture zone will be conducted in future research works.
Author Contributions
Conceptualization, M.J., M.L. and X.W.; methodology, M.J. and M.L.; field test, M.J. and H.T.; data curation, M.J. and H.T; data analysis, M.J. and H.T.; writing—original draft preparation, M.J. and M.L.; writing—review and editing, X.W., M.D. and D.W.; supervision, X.W. and D.W.; project administration, M.J., X.W., D.W. and M.D.; funding acquisition, M.J., X.W., D.W. and M.D. All authors have read and agreed to the published version of the manuscript.
Funding
This research was financially supported by the National Natural Science Foundation of China (grant no.: 52108371 and grant no.: 52204115), and the Shield/TBM Construction Risk Consultation Project in Qingdao Metro Line 8.
Institutional Review Board Statement
Not applicable.
Informed Consent Statement
Not applicable.
Data Availability Statement
All data included in this study are available upon request by contact with the corresponding author.
Acknowledgments
Thanks are due to Guangzhao Zhang (Qingdao University of Technology, Qingdao, China) for assistance with the numerical simulation, and Zelin Lu (Qingdao University of Technology, Qingdao, China) for valuable advice.
Conflicts of Interest
The authors declare that there is no conflict of interest.
References
- Peng, Y.; Wu, L.; Zuo, Q.; Chen, C.; Hao, Y. Risk Assessment of Water Inrush in Tunnel through Water-Rich Fault Based on AHP-Cloud Model. Geomat. Nat. Hazards. Risk 2020, 11, 301–317. [Google Scholar] [CrossRef]
- Xue, Y.; Li, Z.; Li, S.; Qiu, D.; Su, M.; Xu, Z.; Zhou, B.; Tao, Y. Water Inrush Risk Assessment for an Undersea Tunnel Crossing a Fault: An Analytical Model. Mar. Georesour. Geotechnol. 2019, 37, 816–827. [Google Scholar] [CrossRef]
- Newman, T.; Hueso, O.; Martinez Goirigolzarri, M. Effects of Changing Geology on the Performance of a Thames Tideway Tunnel Boring Machine. Proc. Inst. Civ. Eng.-Geotech. Eng. 2022, 1–14. [Google Scholar] [CrossRef]
- Liu, B.; Guo, Q.; Liu, Z.; Wang, C.; Nie, L.; Xu, X.; Chen, L. Comprehensive Ahead Prospecting for Hard Rock TBM Tunneling in Complex Limestone Geology: A Case Study in Jilin, China. Tunn. Undergr. Space Technol. 2019, 93, 103045. [Google Scholar] [CrossRef]
- Li, S.; Nie, L.; Liu, B. The Practice of Forward Prospecting of Adverse Geology Applied to Hard Rock TBM Tunnel Construction: The Case of the Songhua River Water Conveyance Project in the Middle of Jilin Province. Engineering 2018, 4, 131–137. [Google Scholar] [CrossRef]
- Bayati, M.; Hamidi, J.K. A Case Study on TBM Tunnelling in Fault Zones and Lessons Learned from Ground Improvement. Tunn. Undergr. Space Technol. 2017, 63, 162–170. [Google Scholar] [CrossRef]
- Lin, P.; Yu, T.; Xu, Z.; Shao, R.; Wang, W. Geochemical, Mineralogical, and Microstructural Characteristics of Fault Rocks and Their Impact on TBM Jamming: A Case Study. Bull. Eng. Geol. Environ. 2022, 81, 64. [Google Scholar] [CrossRef]
- Park, J.; Ryu, J.; Choi, H.; Lee, I.-M. Risky Ground Prediction Ahead of Mechanized Tunnel Face Using Electrical Methods: Laboratory Tests. Ksce, J. Civ. Eng. 2018, 22, 3663–3675. [Google Scholar] [CrossRef]
- Huang, J.; Wei, X.; Luo, Y.; Gong, H.; Liu, T.; Li, X. Analysis of the Deformation Characteristics of the Surrounding Rock Mass of a Deep Tunnel During Excavation Through a Fracture Zone. Rock Mech. Rock Eng. 2022, 55, 7817–7835. [Google Scholar] [CrossRef]
- Xie, Q.; Cao, Z.; Sun, W.; Fumagalli, A.; Fu, X.; Wu, Z.; Wu, K. Numerical Simulation of the Fluid-Solid Coupling Mechanism of Water and Mud Inrush in a Water-Rich Fault Tunnel. Tunn. Undergr. Space Technol. 2023, 131, 104796. [Google Scholar] [CrossRef]
- Zaheri, M.; Ranjbarnia, M.; Dias, D.; Oreste, P. Performance of Segmental and Shotcrete Linings in Shallow Tunnels Crossing a Transverse Strike-Slip Faulting. Transp. Geotech. 2020, 23, 100333. [Google Scholar] [CrossRef]
- Do, N.-A.; Dias, D.; Oreste, P.; Djeran-Maigre, I. Behaviour of Segmental Tunnel Linings under Seismic Loads Studied with the Hyperstatic Reaction Method. Soil Dyn. Earthq. Eng. 2015, 79, 108–117. [Google Scholar] [CrossRef]
- Zhou, Z.; Chen, Z.; Wang, B.; Jiang, C.; Li, T.; Meng, W. Study on the Applicability of Various In-Situ Stress Inversion Methods and Their Application on Sinistral Strike-Slip Faults. Rock Mech. Rock Eng. 2023. [Google Scholar] [CrossRef]
- Han, K.; Wang, L.; Su, D.; Hong, C.; Chen, X.; Lin, X.-T. An Analytical Model for Face Stability of Tunnels Traversing the Fault Fracture Zone with High Hydraulic Pressure. Comput. Geotech. 2021, 140, 104467. [Google Scholar] [CrossRef]
- Li, L.; Han, Y.; Wang, J.; Jin, Q.; Xiong, Y.; Chong, J.; Ba, X.; Fang, Z.; Wang, K. Study on Critical Safety Distance Between the Shield Tunnel and Front Fault Fracture Zone in Urban Metro. Geotech. Geol. Eng. 2022, 40, 5667–5683. [Google Scholar] [CrossRef]
- Wang, S.; Li, C.; Li, D.; Zhang, Y.; Hagan, P. Skewed pressure characteristics induced by step-by-step excavation of a double-arch tunnel based on infrared thermography. Tech. Vjesn. 2016, 23, 827–833. [Google Scholar] [CrossRef]
- Wang, S.; Li, D.; Li, C.; Zhang, C.; Zhang, Y. Thermal Radiation Characteristics of Stress Evolution of a Circular Tunnel Excavation under Different Confining Pressures. Tunn. Undergr. Space Technol. 2018, 78, 76–83. [Google Scholar] [CrossRef]
- Fan, H.; Li, L.; Chen, G.; Liu, H.; Gao, J.; Li, C.; Peng, X.; Zhou, S. Analysis Method of the Water Inrush and Collapse in Jointed Rock Mass Tunnels: A Case Study. Eng. Anal. Bound. Elem. 2023, 146, 838–850. [Google Scholar] [CrossRef]
- Bao, X.; Xia, Z.; Ye, G.; Fu, Y.; Su, D. Numerical Analysis on the Seismic Behavior of a Large Metro Subway Tunnel in Liquefiable Ground. Tunn. Undergr. Space Technol. 2017, 66, 91–106. [Google Scholar] [CrossRef]
- Anato, N.J.; Assogba, O.C.; Tang, A.; Youssouf, D. Numerical Investigation of Seismic Isolation Layer Performance for Tunnel Lining in Shanghai Soft Ground. Arab. J. Sci. Eng. 2021, 46, 11355–11372. [Google Scholar] [CrossRef]
- Chen, J.; Liu, L.; Zeng, B.; Tao, K.; Zhang, C.; Zhao, H.; Li, D.; Zhang, J. A Constitutive Model to Reveal the Anchorage Mechanism of Fully Bonded Bolts. Rock Mech. Rock Eng. 2023, 56, 1739–1757. [Google Scholar] [CrossRef]
- Luo, T.; Wang, S.; Zhang, C.; Liu, X. Parameters Deterioration Rules of Surrounding Rock for Deep Tunnel Excavation Based on Unloading Effect. Dyna 2017, 92, 648–654. [Google Scholar] [CrossRef]
- Wang, L.; Hong, K.; Quan, Y.; Zhao, H.; Zhao, X.; Yang, Z.; Zhou, Z. Model Test of TBM Tunnel Crossing Large Dip Angle Fault Zone under High In Situ Stress. Geofluids 2022, 2022, 9735532. [Google Scholar] [CrossRef]
- Abdollahi, M.S.; Najafi, M.; Bafghi, A.Y.; Marji, M.F. A 3D Numerical Model to Determine Suitable Reinforcement Strategies for Passing TBM through a Fault Zone, a Case Study: Safaroud Water Transmission Tunnel, Iran. Tunn. Undergr. Space Technol. 2019, 88, 186–199. [Google Scholar] [CrossRef]
- Li, H.; Li, X.; Yang, Y.; Liu, Y.; Ma, M. Structural Stress Characteristics and Joint Deformation of Shield Tunnels Crossing Active Faults. Appl. Sci. 2022, 12, 3229. [Google Scholar] [CrossRef]
- Zheng, Y.; Wu, K.; Jiang, Y.; Chen, R.; Duan, J. Optimization and Design of Pre-Reinforcement for a Subsea Tunnel Crossing a Fault Fracture Zone. Mar. Georesour. Geotechnol. 2023, 41, 36–53. [Google Scholar] [CrossRef]


Disclaimer/Publisher’s Note: The statements, opinions and data contained in all publications are solely those of the individual author(s) and contributor(s) and not of MDPI and/or the editor(s). MDPI and/or the editor(s) disclaim responsibility for any injury to people or property resulting from any ideas, methods, instructions or products referred to in the content. |
© 2023 by the authors. Licensee MDPI, Basel, Switzerland. This article is an open access article distributed under the terms and conditions of the Creative Commons Attribution (CC BY) license (https://creativecommons.org/licenses/by/4.0/).