Article

An Information System for Comprehensive Evaluation of Natural Resources and Ecosystem Services Value: Design and Case Application

1
Institute of Geographic Sciences and Natural Resources Research, Chinese Academy of Sciences, Beijing 100101, China
2
School of Geography and Information Engineering, China University of Geosciences, Wuhan 430074, China
3
China-Pakistan Joint Research Center on Earth Sciences, CAS-HEC, Islamabad 45320, Pakistan
4
College of Resources and Environment, University of Chinese Academy of Sciences, Beijing 100049, China
5
Key Laboratory of Carrying Capacity Assessment for Resource and Environment, Ministry of Natural Resources, Beijing 101149, China
*
Author to whom correspondence should be addressed.
Sustainability 2023, 15(6), 5247; https://doi.org/10.3390/su15065247
Submission received: 19 January 2023 / Revised: 11 March 2023 / Accepted: 14 March 2023 / Published: 15 March 2023
(This article belongs to the Special Issue Environmental Economics and Sustainability Policy)

Abstract

:
The study of natural resources and ecosystem service value assessments is crucial for understanding the direct economic benefits and potential ecological, environmental, and social benefits of these resources. Existing research lacks a comprehensive information management framework design and application exploration for the practice process, and a unified and standardized technical framework has not been established, which makes it difficult to expand the functions in the future. This study uses data from various aspects such as statistical yearbooks, remote sensing satellites, and field studies, and adopts the market value method and alternative cost method to construct a natural resources and ecosystem service value indicator system and a comprehensive evaluation information system, taking Shaanxi Province as an example. The total value of natural resources and ecosystem services in Shaanxi Province is CNY 107.67 trillion, of which the value of natural resources is CNY 105.11 trillion and the value of ecosystem services is CNY 2.56 trillion. This study makes up for the deficiencies in the realization path of the existing natural resources and ecosystem service value accounting studies, solves the problems of a large number of data collection sources, integration of accession criteria, integrated assessment methods, and synchronized assessment updates in natural resources management in Shaanxi Province, and realizes the visualization and information management of natural resources and ecosystem service value accounting.

1. Introduction

Natural resources are the aggregate of natural materials and natural energy available for human use, such as land resources, water resources, forest resources, grassland resources, mineral resources, energy resources, etc. Natural resources are distinguished by their finiteness, regionality, completeness, and versatility [1,2,3]. Ecosystem services are life support products and services obtained directly or indirectly through the structure, processes, and functions of ecosystems, including direct economic values (such as ecological product supply services) and environmental and social values that indirectly generate welfare utility, such as regulating services and cultural services [4,5,6]. Therefore, ecosystem service valuation partially compensates for the shortcomings of conventional natural resources value assessment, which emphasizes economic value while ignoring environmental and social values.
The 2022 UN e-Government Survey Report [7], published in September 2022, examined international e-Government development practices and summarized international e-Government development trends from a global perspective and global worldview. The report’s theme was the future of digital government and focused on using e-Government to help achieve the 17 Sustainable Development Goals by 2030 [8,9]. Governments have increasingly turned to natural resources information building in order to combat climate change, increase the efficacy of natural resources management and environmental protection, and accomplish unified management [10,11,12]. For instance, in 2001, Carvalho applied natural resources data to data models and visualization models in order to advance the science of natural resources management and predict or simulate the real world [13]. Twery introduced a decision support system for integrated forest ecosystem management in 2005 with the goal of providing natural resources managers with valuable and scientifically sound information for treating forest health and simulating forest growth [14]. In 2018, Wang utilized MySQL to construct a big data platform, visualized current data using Echarts, and proposed a multifaceted water resources information management system in the grassland basin based on big data, in response to the water shortage and inefficient water resources management in the Xilin River basin [15]. Baroni presented the active role of irrigation scheduling systems used in the German irrigation sector in supporting adaptation to rapid changes in agricultural environmental conditions in 2019 to resolve seasonal irrigation differences [16].
As a consequence of the widespread adoption and rapid development of next-generation information technology, China’s natural resources informatization is confronted with new circumstances and requirements. The Chinese Ministry of Natural Resources issued a document titled “General Program of Informatization Construction of Ministry of Natural Resources” on 1 November 2019 in an effort to promote the construction of natural resources informatization and substantially increase the level of natural resources intelligence and modernization [17,18]. The Ministry of Natural Resources (MORN) has proposed constructing “one network,” “one map,” and “one platform” for natural resources, as well as an application system for natural resources investigation, monitoring, and evaluation, and an application system for natural resources supervision and decision making. In addition to “one network,” “one map,” and “one platform” for natural resources, it is proposed to construct an application system for “Internet Plus government services for natural resources.”
Deng used Fujian Province as an example and constructed a natural resources assessment simulation system based on the “General Program of Information Construction of Ministry of Natural Resources” [19]. This system provides comprehensive information on the spatial distribution status and change trends of various types of resources, effectively assists the province in conducting the third national land survey, addresses the issue of inconsistent standards for various types of natural resources surveys, and contributes to the establishment of a unified survey and evaluation of all times, all areas, and all elements. Xue established a natural resources assessment simulation system to construct a “one map” of national land resources, which provides services for comprehensive supervision and business topics of national land and better realizes national land spatial planning through the deep integration of big data and planning [20]. The integration of enormous data and infrastructure was discussed as an example in a county in Zhejiang Province. Lin Shuzhe used Guangdong Province as an example to examine the enhancement of statistical indicators of natural resources assets based on natural resources data such as land, minerals, marine, and forests [21]. They also constructed a natural resources assessment simulation system and implemented real-time calculations with the updating statistical indicators, which spatially spanned the administrative divisions of provinces, municipalities, and counties and temporally included natural resources assets accounting results from multiple years. This contributed to the transition of natural resources management in Guangdong Province, where empirical decision making has been replaced by data-driven decision making.
In general, China’s natural resources informatization is still in the exploratory stage. Existing studies have been made on the theoretical basis of natural resources and ecosystem services value assessment, such as selecting indicators and methods, setting assumptions and parameters, the key subjects and elements and their systematic relationships, and so on. These progresses have provided many references for policy goals and governance, but there is still a lack of integrated information management framework design and application exploration for the practice process. Natural resources are plentiful in both quantity and variety. As the reform of the administration of natural resources assets progresses, the creation of an information support system is imminent. Therefore, this study identifies the needs of Chinese management practice, identifies relevant management obstacles and technical problems, and explores the design and application of a unified, complete, standardized, and scalable comprehensive evaluation indicator system. This study is an innovation of integrated management of natural resources and ecosystem services information for policy practice needs and improving government governance.

2. Requirements Analysis

2.1. Unified Technical Framework

There are substantial disparities in the processing standards and construction mechanisms of structured data and spatial data across departments, as well as the contradictions and conflicts between data. In light of the fact that natural resources and ecosystem service value accounting domestically and internationally is gradually shifting from theoretical method discussion to field case studies, but has not yet been extended to form a comprehensive assessment method of natural resources and ecosystem service values applicable to China’s national conditions, the system needs to establish a unified, standardized, and comprehensive assessment method applicable to China’s national conditions.

2.2. Data Update

During the construction process, the system established a unified indicator system, assessment methods, etc., in response to existing issues such as a low degree of database interconnection and information sharing among various departments and insufficient data correlation among internal business systems. Using the unified technical framework, each natural resources department in the province of Shaanxi assumes distinct data updating responsibilities. Data collection, data pre-processing, data storage, and data updating are primarily the responsibility of the natural resources bureaus in each city, district, and county. Distribution of data collection tasks, evaluation and storage of updated data, etc., are primarily the province’s Department of Natural Resources’ responsibility.

2.3. Visualization of Assessment Results

Under the premise of fully considering the data characteristics of natural resources and ecosystem service values, the system selects data visualization methods that are conducive to showing data characteristics, and displays the results through line graphs, maps, pie charts, radar charts, bar charts, and other styles, and provides graphic display modules, time and date modules, graphic download modules, data view modules, data reset modules, and so on. Through the assessment results displayed, each natural resources department has a general understanding of the province’s natural resources and ecosystem service values. The assessment results exhibit provides decision support for each department of natural resources, simplifies managers’ access to natural resources-related information services, and enhances the quality of information services.

3. System Design

3.1. System Design Rules

The server of the system is located within the provincial department of natural resources and is linked to provincial, municipal, and county entities [22]. The natural characteristics of ecosystems, the optimal allocation of natural resources, the efficiency of natural resources, and the value of ecological products are unified and combined with the requirements of natural resources and ecological environment in the construction of the indicator system, which is based on the rule of comprehensive value assessment and adheres to the principle of “physical quantity before value quantity, stock before flow, and classification before synthesis”. We propose a framework and indicator system for evaluating the value of natural resources and ecosystem services, both of which are based on the existing ecosystem services value accounting system [23,24,25,26]. At the data level, the system is unified at the prefecture-level municipal scale. Each urban natural resources bureau collects and pre-processes pertinent data in a systematic manner. They are then saved on the unit’s database server. The district natural resources bureau submits them to the municipal natural resources bureau, which then submits them to the provincial natural resources department via the government intranet. The front-end utilizes the Vue framework and front-end engineering principles, focusing primarily on the View and ViewModel layers. The back-end uses the Express framework, which predominantly manages the Model layer.

3.2. System Technical Route

This system primarily utilizes HTML technology, CSS technology, Sass pre-processor [27,28], JavaScript technology, Vue framework, Echarts technology, etc., on the front-end, and MySQL technology, Node.js technology, and Express framework, etc., on the back-end. Vue is a JavaScript framework for creating user interfaces. It is based on HTML, CSS, and JavaScript standards and provides a declarative and component-based programming model that can facilitate the efficient development of user interfaces [29,30]. ECharts is a JavaScript-implemented open-source visualization library that covers a variety of industry charts to meet a variety of requirements [31,32]. The underlying reliance on the lightweight Canvas library ZRender provides ECharts with intuition. MySQL is a free and open-source small- and medium-sized database that supports a variety of data types (integer, character, string date, timestamp, JSON, XML, and text) to facilitate the storage and processing of data in various formats [33]. Express is built on the Node.js platform, which is a lightweight, open, and rapid Web development framework [34,35].

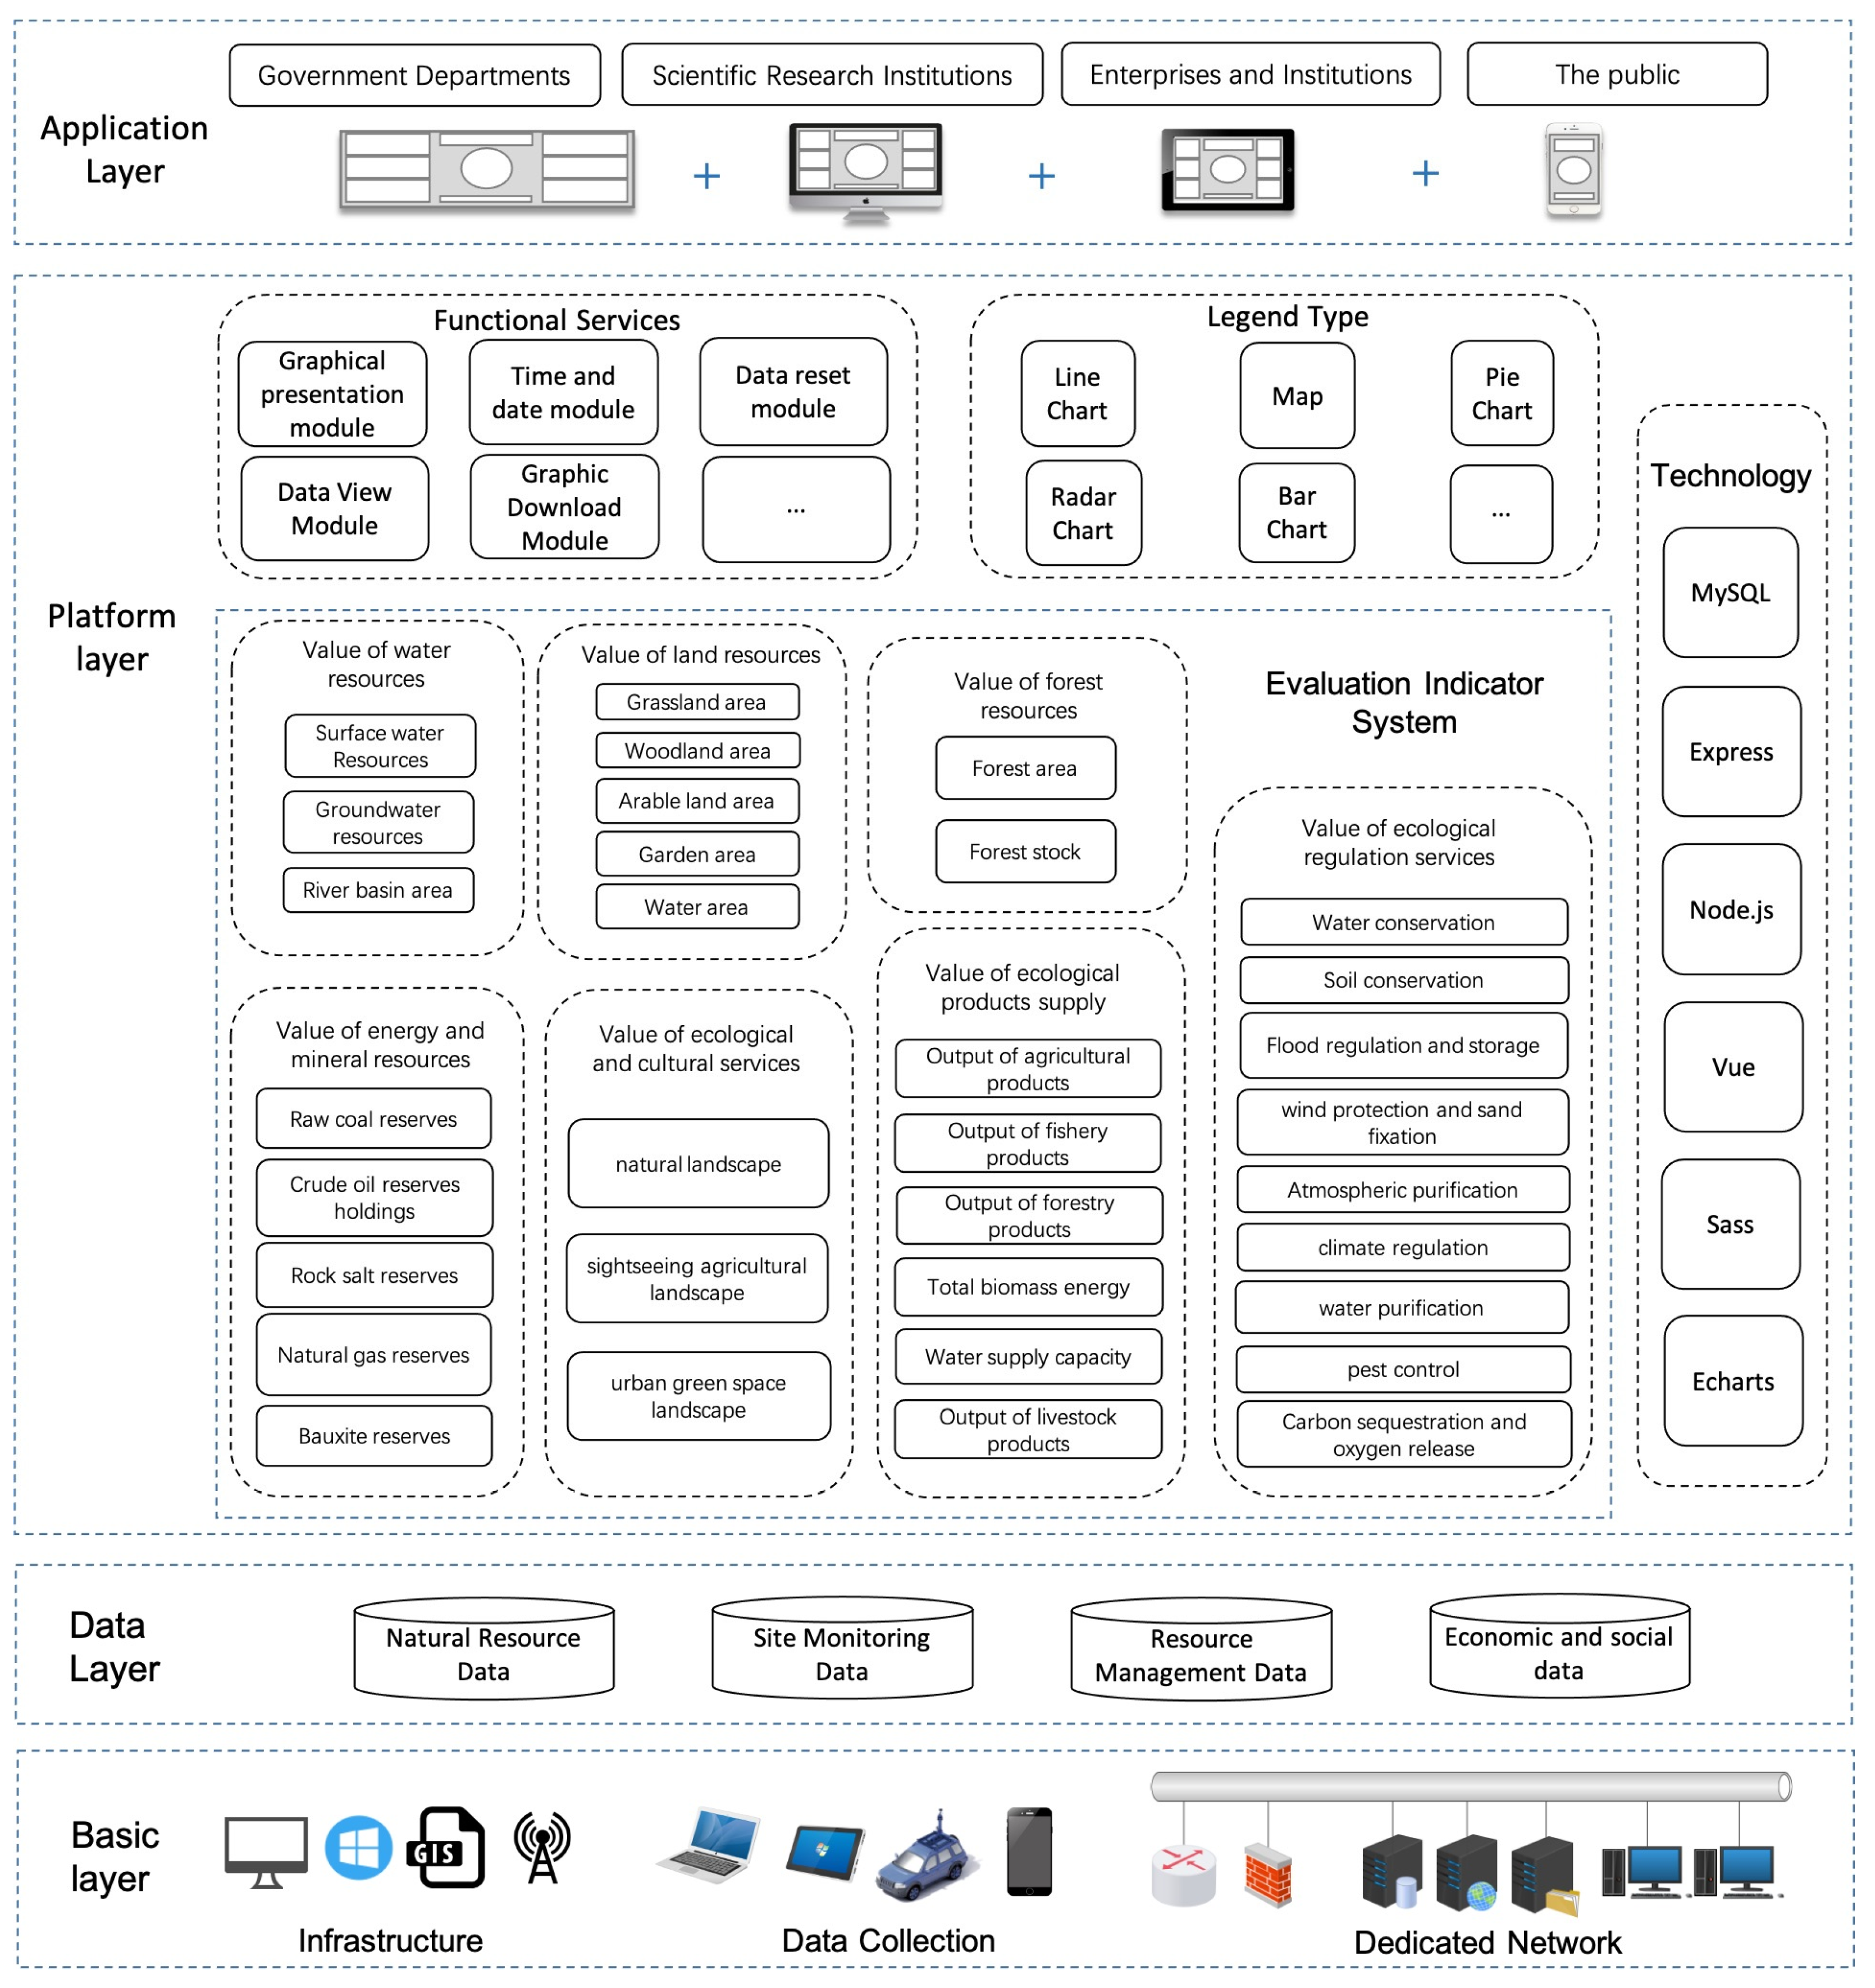
3.3. System Framework Design

The system uses a “four horizontal and two vertical” framework. The “four horizontal” layers are the foundation layer, data layer, platform layer, and application layer. The “two vertical” are the management system and the security system. Figure 1 depicts the intricacies.
The basic layer provides the most fundamental facilities for the overall construction of the product display system. This includes infrastructures such as computers, operating systems, GIS software, database systems, networks, and servers, as well as data collection facilities such as laptops, tablets, cell phones, and collection vehicles.
The data layer is primarily concerned with data construction. Natural resources data, economic and social data based on statistics and field surveys, site monitoring data based on rainfall and wind speed data, and resource management data based on raster data are all included. Following the establishment of various assessment indicator system, natural resources data, site monitoring data, resource management data, and economic and social data are pre-processed and stored in the MySQL database.
The platform layer is primarily responsible for implementing various service functions of the application system in order to provide technical support tools. It primarily consists of the assessment indicator system and accounting technical framework, as well as functional services, graphical types, and technologies. It extends and integrates the technical framework of natural resources and ecosystem services value accounting, using Node.js (Express framework) to create an internal data processing module to complete the sub-calculation of the value of water resources, land resources, forest resources, energy and mineral resources, ecological products supply, ecological regulation services, and ecological and social services indicators for each prefecture-level city in Shaanxi Province. The calculation is carried out with the help of the Vue progressive JavaScript framework. To visualize the accounting results, the Vue progressive JavaScript framework, Sass (CSS pre-processor), and ECharts plug-in (data visualization chart library) are used, along with rich and diverse charts and basic functions such as graph display, graph download, data view, and data reset.
The application layer faces the end-users directly, primarily through the multi-device end, including large-screen monitors, computers, tablets and cell phones, etc. It has an impact on the public, businesses, scientific research institutions, and government departments.

3.4. Integrated Assessment Indicator System

The natural resources and ecosystem services value indicator system incorporates the value of water resources, land resources, forest resources, energy and mineral resources, and ecosystem services function. This system considers not only the direct economic benefits of natural resources and ecosystems, but also the potential ecological, environmental, and social benefits [36,37,38].
The complete assessment indicator system consists of 7 tier 1 indications and 22 tier 2 indicators (Table 1). In addition, only one value indicator and no secondary accounting items are established under tier 1 indicators of natural resources, as some physical indicators need to be integrated with other physical indicators and apply related procedures to compute the value of natural resources [39,40,41]. There are six, nine, and three secondary accounting items under the tier 1 indicators of ecosystem supply services, regulating services, and cultural services [42,43,44]. Several methodologies are employed to monetize the social, environmental, and economic advantages of ecosystem services, allowing for the comparability of the values of various ecosystem services.

3.5. Database Design

This system combines traditional structured data such as statistical yearbooks and resource census with big data derived from satellite images, remote sensing monitoring, and ground station sensor monitoring of natural resources.
Due to the uniformity of the assessment results’ data types, the prefecture-level city scale (key-value type) is chosen for system development and implementation. This is chosen in comparison with the natural resources big data, which consist primarily of vector and raster data, and traditional structured data, which consist primarily of city scales at the prefecture level.
The system employs the MySQL database because the data are of the key-value type and lack spatial information such as vector data and raster data. The database contains tables such as “tier 1 indicators,” “tier 2 indicators,” “physical indicators,” “unit value,” “provincial-city correspondence,” “tier 1 indicators-tier 2 indicators correspondence,” “tier 2 indicators-unit value correspondence,” “tier 2 indicators-physical indicators correspondence,” etc. Figure 2 depicts the physical design of the database’s physical structure.

3.6. Deployment Architecture Design

According to the organizational structure of each urban natural resources bureau, the system is implemented in the Shaanxi Province Department of Natural Resources with a centralized architecture (Figure 3). The district natural resources bureau transmits pertinent information to the city natural resources bureau via the government intranet, and the city natural resources bureau transmits pertinent information to the provincial natural resources department via the government intranet (Figure 4). Each urban natural resources bureau then systematically collects and pre-processes the pertinent data (Figure 4).

4. System Implementation

4.1. Data Integration and Accessioning

Natural resources big data are collected from satellite photos, remote sensing monitoring, and sensor monitoring from ground stations, and traditional structured data are derived from resource censuses and statistical yearbooks. All data are standardized to unify the accounting scope, statistical units, etc., because the data come from many sources and are spatially scaled differently (Table 2). The statistical unit of value accounting in this system is set to the prefecture-level city size because remote sensing images are raster-scale data and the prefecture-level city is the smallest statistical unit of traditional statistics such as energy, mineral, and water resource reserves. The GIS spatial statistics approach is used to compute the total ecosystem services value of the raster unit within the associated prefecture-level city for the raster-scale ecosystem services value acquired from remote sensing pictures.
In order to maintain the greatest possible data quality, the Urban Natural Resources Bureau executes necessary data pre-processing and assures data integrity, consistency, accuracy, and completeness throughout data entry. If the data being unified are statistical data, data comparison and screening are required; GIS kriging interpolation is required to process vector data if the data are vectors; GIS spatial statistics are used to weight the total value of the raster cell; and raster data cropping is performed if the data are raster data. If none of the aforementioned data kinds are accessible, the data are returned to the respective departments. After the data types have been standardized, they are examined for completeness, consistency, accuracy, and integrity. If all of these conditions are met, the data are imported into the proper database tables depending on the data’s information content (Figure 5).

4.2. Integrated Assessment Methodology

The integrated evaluation procedure is established at the system’s back end. The study of theoretical methods and models of natural resources value assessment at home and abroad is based on theoretical models in resource environment and economics, such as resource environment externality, resource environment accounting, comprehensive environmental-economic accounting, net present value theory, rent theory, marginal cost theory, etc. The details of the accounting technical framework are shown in Table 3.

5. Results and Discussion

This study is an innovation of integrated management of natural resources and ecological services information for policy practice needs and to improve government governance.
Forestry data [45], automotive exhaust data [46], chart sales data [47], water resources data [48], instructional data [49], geographic information data [50], and other facets of the application have all been used as the foundation for prior research in the assessment systems. The bulk of studies merely offer and analyze data such as real-time data or statistical data and have not yet accounted for environmental elements such as market value, policy incentives, and limits, making it difficult to meet the ever-increasingly complicated management requirements. To address these problems, the proposed information system uploads and saves the physical quantity data of natural resources and ecosystem services indicators and completes the display of natural resources and ecosystem services value assessment results in various forms, such as graphs, tables, and maps.
A case application of this information system has shown practicability and robustness in Shaanxi, China. As is shown in Figure 6, users can access the platform through appropriate servers, upload natural resources and ecosystem raw data, examine the relevant physical quantity and value quantity data of natural resources and ecosystem services, and construct a business system of natural resources and ecosystem data collecting, processing, assessment, updating, and sharing linked by province and urban areas, which provides a real-time and searchable information channel for natural resources and ecosystem management. The processing results could be timely presented in the graphical user interface, serving as the knowledge foundation for resource management policy-making procedure. For example, in the case of Shaanxi province, the value of natural resources and ecosystem services was visualized at the spatial scale of each prefectural city. It could be seen that the total value of natural resources and ecosystem services is CNY 107.67 trillion, of which the value of natural resources is CNY 105.11 trillion and the value of ecosystem services is CNY 2.56 trillion. Prefectural cities of Yulin and Yanan in northern Shaanxi have relatively higher natural resources values compared with prefectural cities in southern Shaanxi, which could be attributed to the abundance of fossil energy resources. However, the ecosystem in northern Shaanxi is vulnerable and provides lower ecosystem values due to the semi-arid climate conditions, thus the resource management in northern Shaanxi should be more focused on ecological protection during resource utilization. Generally, this system improves the level of informatization of natural resources and ecosystem management in each prefectural city of the province, offers a timely, scientific, and correct basis for natural ecology development and protection, provides an information guarantee for the business management of various departments, and realizes the transformation from rough to fine, from relying on experience and fuzzy management to relying on enormous data and accurate analysis.
The system’s application innovation primarily consists of the following elements:
(1)
A unified technical framework. The system unifies the natural attributes of ecosystems, the optimal allocation of natural resources, the efficiency of natural resources, and the value of ecological products, and combines the requirements of natural resources and ecological environment refinement management with the principle “physical quantity before value quantity, stock before flow, and classification before synthesis.” Based on the existing ecosystem service value assessment system, the system integrates and sorts all indicators of natural resources and ecosystem service values to form a set of technical frameworks covering governance and supervision, thereby resolving the issue of inconsistent data collection, processing, and assessment standards.
(2)
Improving monitoring and supervision. The system uses modern data gathering technologies such as collection vehicles, drones, satellite remote sensing, and observation stations, integrates monitoring data from multiple natural resources departments, and creates an integrated operating environment for provinces, cities, and counties. The system accelerates the rapid aggregation of natural resources business data in the province and realizes the monitoring and supervision of natural resources and ecosystem services work in the province. The system also provides a single and standardized technological framework for cities, counties, and districts, and aids natural resources departments in Shaanxi Province in the remittance of various inventory and accounting results, thereby lowering the cost issue associated with updating and exchanging information in the databases of various natural resources departments.
(3)
Supporting decision making. There is a combination of assessment results and features such as line graph visualization, pie chart visualization, scatter chart visualization, radar chart visualization, bar graph visualization, geospatial visualization, etc. Moreover, the multi-directional integrated display and the provision of graphic download, data view, data reset, and other functions provide a timely, scientific, and accurate basis for natural resources supervision, which realize the change of natural resources and ecosystem management from local experience-based and fuzzy presumption to massive data-based and accurate analysis. And thus, the reliability of decision making has been improved with the higher level of informatization of natural resources and ecosystem management.

6. Conclusions

This study extends and integrates the value indicator system for natural resources and ecosystem services, unifies the accounting technical framework, and merges several advanced open-source architectures. This integrated natural resources and ecosystem value assessment information system is implemented in Shaanxi Province, taking into consideration environmental aspects such as market value, regulatory incentives, and limits. The system improves the accuracy of natural resources and ecosystem services value assessment, facilitates the transition of natural resources management from empirical decision making to data decision making, and actively promotes the development of natural resources informatization and ecological civilization. It also resolves the issues of enormous data collection sources, integrated inclusion criteria, comprehensive assessment techniques, and synchronized assessment updates in Shaanxi Province’s natural resources management. The system also accomplishes the standardization, visualization, and information management of natural resources and ecosystem service value evaluation.
Future research work:
(1)
Several of the indicator items of ecosystem service value in the indicator system are exploratory and contentious and can be upgraded in the future based on relevant research results and China’s national circumstances.
(2)
The system is based on the natural resources department of Shaanxi Province, and in the future, it will vertically connect the natural resources departments at provincial, municipal, and district and county levels into four natural resources departments at the ministry, provincial, municipal, and district and county levels, and will horizontally connect to agricultural and rural departments, ecological and environmental departments, water conservancy departments, etc., to further improve the level of data interconnection.
(3)
With reform, China’s departments of natural resources are assuming new functions and businesses. The business coverage of the current system is insufficient; therefore, it is necessary to expand the business coverage of natural resources informatization, continue to establish a unified natural resources database, enhance the efficiency of natural resources management, and strive to integrate natural resources government services.

Author Contributions

Conceptualization, Y.S. and S.Z.; methodology, Y.S. and L.A.; software, Y.S.; formal analysis, Y.S. and S.Z.; resources, L.S. and S.Z.; data curation, L.A.; writing—original draft preparation, Y.S.; writing—review and editing, S.Z. and D.L.; visualization, Y.S.; supervision, S.Z. and L.S.; project administration, S.Z.; funding acquisition, L.S. and S.Z. All authors have read and agreed to the published version of the manuscript.

Funding

This research was funded by the Third Xinjiang Scientific Expedition, Grant No. 2022xjkk0803; 2022xjkk0804, the National Natural Science Foundation of China, Grant No. 42071281, Key program of International Cooperation, Bureau of International Cooperation, Chinese Academy of Sciences, Grant No. 131551KYSB20210030 and Project of China Geological Survey, Grant No. DD20221828.

Institutional Review Board Statement

Not applicable.

Informed Consent Statement

Not applicable.

Data Availability Statement

Not applicable.

Acknowledgments

A special acknowledgement should be expressed to the China-Pakistan Joint Research Center on Earth Sciences that supported the implementation of this study.

Conflicts of Interest

The authors declare no conflict of interest.

References

  1. Shen, L.; Zhang, H.; Zhong, S.; Hu, S. Strategic thinking on China’s natural resource security in the new era. J. Nat. Resour. 2018, 33, 721–734. [Google Scholar]
  2. Shen, L.; Zhong, S.; Hu, S. Opportunities and Challenges of Natural Resources Research in China in the New Era. J. Nat. Resour. 2020, 35, 1773–1788. [Google Scholar]
  3. Shogren, J.F. Encyclopedia of Energy, Natural Resource, and Environmental Economics; Elsevier Inc.: Amsterdam, The Netherlands, 2014; Volume 51, p. 51. [Google Scholar]
  4. Costanza, R.; D’Arge, R.; de Groot, R.; Farber, S.; Grasso, M.; Hannon, B.; Limburg, K.; Naeem, S.; O’Neill, R.V.; Paruelo, J.; et al. The value of the world’s ecosystem services and natural capital. Ecol. Econ. 1998, 25, 3–15. [Google Scholar] [CrossRef]
  5. de Groot, R.; Brander, L.; van der Ploeg, S.; Costanza, R.; Bernard, F.; Braat, L.; Christie, M.; Crossman, N.; Ghermandi, A.; Hein, L.; et al. Global estimates of the value of ecosystems and their services in monetary units. Ecosyst. Serv. 2012, 1, 50–61. [Google Scholar] [CrossRef]
  6. Corvalán, C.; Hales, S.; McMichael, A.J.; World, H.O.; Millennium, E.A.P. Ecosystems and Human Well-Being: Health Synthesis; World Health Organization: Geneva, Switzerland, 2005; p. 137. [Google Scholar]
  7. E-Government Survey. 2022. Available online: https://publicadministration.un.org/egovkb/en-us/ (accessed on 20 November 2022).
  8. Leiva-Brondo, M.; Lajara-Camilleri, N.; Vidal-Meló, A.; Atarés, A.; Lull, C. Spanish University Students’ Awareness and Perception of Sustainable Development Goals and Sustainability Literacy. Sustainability 2022, 14, 4552. [Google Scholar] [CrossRef]
  9. Sustainable Development Goals: 17 Goals to Transform Our World. Available online: https://www.un.org/zh/documents/treaty/A-RES-70-1 (accessed on 10 November 2022).
  10. Shen, L.; Zheng, X.Q.; Tao, J.G. Application Technology Framework and Disciplinary Frontier Progress of Natural Resources Big Data. J. Geo-Inf. Sci. 2021, 23, 1351–1361. [Google Scholar]
  11. Chen, B.; Cui, B.; Ding, X. Integration of natural resources government service system and data fusion construction: Taking Nanjing as an example. Bull. Surv. Mapp. 2020, 12, 75–78. [Google Scholar]
  12. Yang, J.Y.; Fan, D.; Huang, G.P. Construction of spatio-temporal big data platform in natural resource management. Bull. Surv. Mapp. 2020, 1, 124–127. [Google Scholar]
  13. Carvalho, E.S.; Teixeira, J.C. An Application Model for Visualization of Natural Resources Management; UNION Agency: New York, NY, USA, 2001; pp. 1–8. [Google Scholar]
  14. Twery, M.J.; Knopp, P.D.; Thomasma, S.A.; Rauscher, H.M.; Nute, D.E.; Potter, W.D.; Maier, F.; Wang, J.; Dass, M.; Uchiyama, H.; et al. NED-2: A decision support system for integrated forest ecosystem management. Comput. Electron. Agric. 2005, 49, 24–43. [Google Scholar] [CrossRef] [Green Version]
  15. Wang, S.Y.; Xue, H.R.; Jiang, X.H.; Zhou, Y.Q.; Duan, X.D.; Bai, M.Y. Construction of Information Management System of Steppe-watershed Multiple Water Resources Based on Big Data; Association for Computing Machinery: New York, NY, USA, 2018; pp. 78–81. [Google Scholar]
  16. Baroni, G.; Drastig, K.; Lichtenfeld, A.U.; Jost, L.; Claas, P. Assessment of Irrigation Scheduling Systems in Germany: Survey of the Users and Comparative Study. Irrig. Drain. 2019, 68, 520–530. [Google Scholar] [CrossRef]
  17. Jiang, W.B. In-depth study of General Secretary Xi Jinping’s important ideas on network strength and comprehensive implementation of the Ministry of Natural Resources’ overall program of information construction. Land Resour. Inf. 2020, 2020, 3–6. [Google Scholar]
  18. General Program of Informatization Construction of Ministry of Natural Resources. Available online: http://www.gov.cn/zhengce/zhengceku/2019-11/22/content_5454560.htm (accessed on 16 November 2022).
  19. Deng, X.L.; Yu, Y.J.; Mao, J.Y.; Wei, D.W. Study on the Application of Big Data Technology for the Exit Audit of Natural Resources Assets of Leading Cadres. Audit. Res. 2020, 2020, 19–29. [Google Scholar]
  20. Xue, X.J.; Li, Y.C.; Wang, E.Q.; Si, J.Z.; Zhao, L.X. The construction of “one map” of national land resources in the era of big data. Beijing Mapp. 2019, 33, 1297–1301. [Google Scholar]
  21. Lin, S.Z.; Liang, M.F.; Xie, P.; Ren, Y. Design and Implementation of Natural Resource Asset Management Information System. Land Resour. Inf. 2021, 2020, 43–48. [Google Scholar]
  22. Zhou, G.X.; Wan, B.L. Tri-level research of natural resources data. Bull. Surv. Mapp. 2019, 2020, 114–117. [Google Scholar]
  23. Yuan, Z.; Wan, R. A review on the methods of ecosystem service assessment. Ecol. Sci. 2019, 38, 210–219. [Google Scholar]
  24. Li, L.; Wang, X.; Luo, L.; Ji, X.; Zhao, Y.; Zhao, Y.; Nabil, B. A systematic review on the methods of ecosystem services value assessment. Chin. J. Ecol. 2018, 37, 1233–1245. [Google Scholar]
  25. Deng, C.; Liu, J.; Li, Z.; Xiao, H.; Nie, X.; Zhang, Y.; Zhou, M. Review and Analysis of Ecosystem Services Research between Domestic and Foreign in Recent 20 Years. Ecol. Environ. Sci. 2019, 28, 2119–2128. [Google Scholar]
  26. Guo, C.; Xu, X.; Shu, Q. A review on the assessment methods of supply and demand of ecosystem services. Chin. J. Ecol. 2020, 39, 2086–2096. [Google Scholar]
  27. O’Donnell, J. SASS (Syntactically Awesome Style Sheets). J. Comput. Sci. Coll. 2019, 34, 101–102. [Google Scholar]
  28. Sass: CSS with Superpowers. Available online: https://sass-lang.com/ (accessed on 29 November 2022).
  29. Amo, D.; Cea, S.; Jimenez, N.M.; Gómez, P.; Fonseca, D. A Privacy-Oriented Local Web Learning Analytics JavaScript Library with a Configurable Schema to Analyze Any Edtech Log: Moodle’s Case Study. Sustainability 2021, 13, 5085. [Google Scholar] [CrossRef]
  30. Vue: The Progressive JavaScript Framework. Available online: https://vuejs.org/ (accessed on 29 November 2022).
  31. Li, D.; Mei, H.; Shen, Y.; Su, S.; Zhang, W.; Wang, J.; Zu, M.; Chen, W. ECharts: A declarative framework for rapid construction of web-based visualization. Vis Inf. 2018, 2, 136–146. [Google Scholar] [CrossRef]
  32. Apache ECharts: An Open-Source JavaScript Visualization Library. Available online: https://echarts.apache.org/en/index.html (accessed on 29 November 2022).
  33. MySQL HeatWave—One MySQL Database Service for OLTP, OLAP, and ML. Available online: https://www.mysql.com/ (accessed on 29 November 2022).
  34. Express: Fast, Unopinionated, Minimalist Web Framework for Node.js. Available online: http://expressjs.com/ (accessed on 29 November 2022).
  35. Tilkov, S.; Vinoski, S. Node.js: Using JavaScript to Build High-Performance Network Programs. IEEE Internet Comput. 2010, 14, 80–83. [Google Scholar] [CrossRef]
  36. Peng, Z.; Wu, H.; Ding, M.; Li, M.; Huang, X.; Zheng, R.; Xu, L. Ecological Compensation Standard of a Water-Receiving Area in an Inter-Basin Water Diversion Based on Ecosystem Service Value and Public Willingness: A Case Study of Beijing. Sustainability 2021, 13, 5236. [Google Scholar] [CrossRef]
  37. Xiong, H.H.; Li, Y.; He, J.L. Construction and Application of the Evaluation System of Natural Resources Asset Accountability Audit of Officials: A Case Study of Jiangxi, China. Sustainability 2022, 14, 528. [Google Scholar] [CrossRef]
  38. Kong, H.X.; Shen, L.; Zhong, S.; Cao, Z. Research Progress and Controversial Issues on Natural Resource Accounting. J. Nat. Resour. 2016, 31, 363–376. [Google Scholar]
  39. Li, Y. The Road to China’s Dual Economic Transformation; Renmin University of China Press: Beijing, China, 2013; p. 329. [Google Scholar]
  40. Li, J. Resource Accounting Theory; Ocean Press: Beijing, China, 1991; p. 328. [Google Scholar]
  41. Peng, W. Research on Environmental Value Accounting Methods and Applications; Zhejiang University of Commerce and Industry: Zhejiang, China, 2013. [Google Scholar]
  42. Dang, A.N.; Jackson, B.M.; Benavidez, R.; Tomscha, S.A. Review of ecosystem service assessments: Pathways for policy integration in Southeast Asia. Ecosyst. Serv. 2021, 49, 101266. [Google Scholar] [CrossRef]
  43. Ouyang, Z.; Zhu, C.; Yang, G.; Xu, W.; Zheng, H.; Zhang, Y.; Xiao, Y. Accounting for Gross Ecosystem Product: Concepts, Accounting Methods and Case Studies. J. Ecol. 2013, 33, 6747–6761. [Google Scholar]
  44. Xie, G.; Zhang, C.; Zhang, L.M.; Chen, W.; Li, S. Metodologi yang lebih baik untuk valorisasi jasa ekosistem berdasarkan faktor ekuivalensi nilai unit area. J. Sumber Daya Alam 2015, 30, 1243–1254. [Google Scholar]
  45. Cheng, Z.; Wang, Z.; Ding, H. Design and Implementation of Chinese Forestry Statistical Data Visualization System. World For. Res. 2019, 32, 85–90. [Google Scholar]
  46. Liu, W.; Cheng, G.; Li, P.; Yu, X. Construction and application analysis of visualization monitoring platform for exhaust emission data based on PyEcharts. Mod. Manuf. Eng. 2021, 2021, 46–50. [Google Scholar]
  47. Wang, H.P.; Wang, C. Design and implementation of a real-time monitoring system for chart sales based on data visualization. Navig. Us 2021, 2021, 55–57. [Google Scholar]
  48. Ciolofan, S.N.; Mocanu, M.; Ionita, A. Cyberinfrastructure architecture to support decision taking in natural resources management. In Proceedings of the 19th International Conference on Control Systems and Computer Science (CSCS 2013), Bucharest, Romania, 29–31 May 2013; pp. 617–623. [Google Scholar]
  49. Qiang, J.; Dai, S. Data Visualization and Interactive System Facing Educational Practice. J. Syst. Simul. 2016, 28, 2101–2108. [Google Scholar]
  50. Zhang, W.; Bian, C.; Li, H.; Li, F. Visual analysis framework design of geographical event based on JavaScript. Eng. Surv. Mapp. 2016, 25, 41–45. [Google Scholar]
Figure 1. System architecture diagram.
Sustainability 15 05247 g001
Figure 2. Database EER diagram.
Sustainability 15 05247 g002
Figure 3. Provincial system network topology diagram.
Sustainability 15 05247 g003
Figure 4. Deployment architecture of provincial–municipal–county linkage.
Sustainability 15 05247 g004
Figure 5. Flow chart of data entry.
Sustainability 15 05247 g005
Figure 6. Integrated Assessment Information System interface.
Sustainability 15 05247 g006
Table 1. Indicator system table.
Tier 1 IndicatorsTier 2 Indicators
Value of water resourcesValue of water resources assets
Value of land resourcesValue of land resource assets
Value of forest resourcesValue of forest resources assets
Value of energy and mineral resourcesValue of energy and mineral resources assets
Value of ecological products supplyValue of agricultural products supply
Value of forestry products supply
Value of livestock products supply
Value of fishery products supply
Value of biomass energy supply
Value of water supply
Value of ecological regulation servicesWater conservation value
Soil conservation value
Flood regulation and storage value
Value of wind protection and sand fixation
Carbon sequestration and oxygen release value
Atmospheric purification value
Value of water purification
Value of climate regulation
Value of pest control
Value of ecological and cultural servicesValue of natural landscape
Value of sightseeing agricultural landscape
Value of urban green space landscape
Table 2. Data sources and pre-processing methods.
Data NameData TypeData SourceData Pre-Processing Method
Mineral resources reserve dataStatistical dataStatistical Yearbook of Shaanxi Province, Statistical Yearbook of cities at Prefecture level and Local Natural Resources BureauData comparison and screening
Forest area and forest coverage dataStatistical dataThe Ninth National Forest Resources inventory and Statistical Yearbook of cities at all prefecture levelsData comparison and screening
Water resources reserve dataStatistical dataStatistical Yearbook of Shaanxi Province, Statistical Yearbook of cities at Prefecture level and Local Natural Resources BureauData comparison and screening
Ecological product output dataStatistical dataStatistical Yearbook of Shaanxi ProvinceCalculation of potential biomass energy
Net income data of natural resources development and utilization industryStatistical dataStatistical Yearbook of Shaanxi Province and input–output Table of Shaanxi ProvinceThe added value of each industry is determined according to the statistical yearbook data, and the proportion of net income in the added value is determined based on the input–output table, so as to calculate the net income of natural resources development and utilization industry.
Land use and ecosystem type dataRaster dataResource and Environmental Science and data Center: remote Sensing Monitoring data of Land use in ChinaUse GIS to vectorize raster data and determine ecosystem types according to land use types.
Rainfall dataVector dataNational Meteorological Science data CenterThe GIS kriging interpolation tool is used to interpolate according to the data of meteorological stations to form spatially continuous rainfall raster data of Shaanxi Province.
Wind speed dataVector dataNational Meteorological Science data CenterThe GIS kriging interpolation tool is used to interpolate according to the data of meteorological stations to form spatially continuous rainfall raster data of Shaanxi Province.
Evapotranspiration dataRaster dataMODIS MOD16 evapotranspiration dataThe 8-day evapotranspiration data are summed up by GIS, and the annual evapotranspiration data are obtained.
Normalized vegetation index dataRaster dataResource and Environmental Science and data Center: spatial Distribution data set of Annual 1 km vegetation Index (NDVI) in ChinaRaster data clipping;
Calculation of vegetation cover factor
Soil texture dataRaster dataNational Qinghai–Tibet Plateau Science data Center: Chinese soil data set based on World soil Database (HWSD) (v1.1)Raster data clipping;
Calculation of soil erodibility factor
Data on net primary productivity of plantsRaster dataResource and Environmental Science and data Center: NPP data set of Plant net Primary ProductivityRaster data clipping
Elevation dataRaster dataSpace shuttle Endeavour Radar Topographic Mapping (SRTM) dataRaster data clipping;
Calculation of slope length and slope factor
Table 3. Accounting technical framework.
Accounting ItemsPhysical IndicatorsValue IndicatorsMethod of Value Accounting
Value of water resources assetsRiver Basin AreaValue of water assetsIncome reduction method
Surface Water Resources
Groundwater Resources
Value of land resource assetsArable land areaValue of land assetsIncome reduction method
Garden area
Woodland area
Grassland area
Water area
Urban, village, industrial, and mining land
Land area for transportation
Other land area
Value of forest resources assetsForest areaValue of forest assetsMarket value method and income reduction method
Forest stock
Value of energy and mineral resources assetsRaw coal reservesValue of energy and mineral assetsMarket value method
Crude oil reserves holdings
Natural gas reserves
Rock salt reserves
Bauxite reserves
Value of agricultural products supplyOutput of agricultural productsOutput value of agricultural productsMarket value method
Value of forestry products supplyOutput of forestry productsOutput value of forestry products
Value of livestock products supplyOutput of livestock productsOutput value of livestock products
Value of fishery products supplyOutput of fishery productsOutput value of fishery products
Value of biomass energy supplyTotal biomass energyOutput value of biomass energy
Value of water supplyWater supply capacityOutput value of water supply
Water conservation valueWater conservation capacityWater conservation valueShadow engineering method (construction cost of water conservancy project),
market value method (market water price)
Soil conservation valueSoil conservation capacityReduce silt deposition valueAlternative cost method
Reduce the value of non-point source pollution
Flood regulation and storage valueLake: adjustable water storageFlood regulation and storage valueShadow engineering method (construction cost of water conservancy project)
Reservoir: flood control capacity
Swamp: stagnant water
Value of wind protection and sand fixationSand fixation capacitySand fixation valueAlternative cost method (sand fixation cost method)
Carbon sequestration and oxygen release valueFixed amount of carbon dioxideValue of annual fixed carbon dioxideAlternative cost method (afforestation cost, industrial emission reduction cost), market value method (carbon market price)
Oxygen productionOxygen generation valueAlternative cost method (afforestation cost), market value method (price of industrial oxygen production)
Atmospheric purification valueAmount of purified sulfur dioxideValue of purified sulfur dioxideAlternative cost method (sulfur dioxide treatment cost)
Amount of purified nitrogen oxidesValue of purified nitrogen oxidesAlternative cost method (nitrogen oxide treatment cost)
Amount of purified dustValue of purified dustAlternative cost method (dust treatment cost)
Value of water purificationTotal amount of purified CODValue of purified CODAlternative cost method (COD treatment cost)
Total amount of purified nitrogenTotal value of purified nitrogenAlternative cost method (total nitrogen treatment cost)
Total amount of purified phosphorusTotal value of purified phosphorusAlternative cost method (total phosphorus treatment cost)
Value of climate regulationEnergy consumed by plant transpirationValue of plant transpiration consumptionAlternative cost method (artificial dehumidification and humidification cost)
Energy consumed by water surface evaporationValue of water surface evaporation consumption
Value of pest controlArea of pests and diseasesValue of pest controlProtection cost method (Labor prevention cost)
Value of natural landscapeTotal number of touristsEcotourism ValueTravel cost method, conditional value method
Value of sightseeing agricultural landscapeNumber of resident populationsAgro-tourism valueWillingness to pay method
Value of urban green space landscapeNumber of resident populationsGreen space landscape valueWillingness to pay method
Disclaimer/Publisher’s Note: The statements, opinions and data contained in all publications are solely those of the individual author(s) and contributor(s) and not of MDPI and/or the editor(s). MDPI and/or the editor(s) disclaim responsibility for any injury to people or property resulting from any ideas, methods, instructions or products referred to in the content.

