Article

Assessing the Ecosystem Health of Large Drinking-Water Reservoirs Based on the Phytoplankton Index of Biotic Integrity (P-IBI): A Case Study of Danjiangkou Reservoir

1
International Joint Laboratory of Watershed Ecological Security and Collaborative Innovation Center of Water Security for Water Source Region of Middle Route Project of South-North Water Diversion in Henan Province, College of Water Resource and Environment Engineering, Nanyang Normal University, Nanyang 473061, China
2
College of Water Resources, North China University of Water Resources and Electric Power, Zhengzhou 450046, China
3
Faculty of Biology, Adam Mickiewicz University in Poznan, Uniwersytetu Poznanskiego 6, 61-614 Poznań, Poland
4
Department of Botany and Plant Sciences, University of California, Riverside, CA 92521, USA
*
Author to whom correspondence should be addressed.
Sustainability 2023, 15(6), 5282; https://doi.org/10.3390/su15065282
Submission received: 12 February 2023 / Revised: 8 March 2023 / Accepted: 8 March 2023 / Published: 16 March 2023

Abstract

:
As an important component of reservoir ecosystems, phytoplankton is often used as an indicator to assess the health of water ecosystems such as lakes and reservoirs. The exploration the phytoplankton index of biotic integrity (P-IBI) has been proposed to assess the ecological health of the large drinking-water reservoirs. This study investigated phytoplankton communities and environmental variables at 19 sampling sites in the Danjiangkou Reservoir from October 2019 to July 2021. Results showed that 170 species of phytoplankton from 9 phyla were detected in Danjiangkou Reservoir, and the total density varied from 0.61 × 10⁵ to 36.64 × 10⁵ cells/L, with the mean value of 8.83 × 10⁵ cells/L. The P-IBI values were higher in winter and lower in spring in terms of time, and the spatial trend of P-IBI values from high to low was outlet of the reservoir > entrance of Dan Reservoir > entrance of Han Reservoir > Han Reservoir > Dan Reservoir. Linear regression analysis showed that the evaluation results of P-IBI and the comprehensive trophic level index (TLI) evaluation were generally consistent. Redundancy analysis (RDA) showed significant correlations between P-IBI and candidate indicators and major environmental factors with significant differences between seasons. The P-IBI is an effective tool to evaluate the ecological health of large drinking-water reservoirs and could provide some scientific reference for the ecological health assessment of large drinking-water reservoirs.

1. Introduction

Due to climate change and human activities, water bodies have faced environmental problems such as different degrees of water pollution and biodiversity decline [1]. The enrichment of endogenous and exogenous nutrients aggravated the eutrophication of water. Eutrophication can threaten water quality, especially drinking water sources, and may lead to Cyanobacteria blooms [2,3,4]. With the development of industry and agriculture, a large number of man-made and natural pollution sources enter lakes and reservoirs [5]. Therefore, it is essential to assess water quality for the protection and restoration of aquatic ecosystems, the provision of drinking water, and socio-economic development. The Index of Biological Integrity (IBI) was proposed by Karr [6] in 1981 to quantitatively describe the relationship between environmental changes after anthropogenic disturbances and changes in biological communities under stress, indirectly reflecting the degree of influence of the external environment on aquatic ecosystems [7]. Compared with the evaluation of a single index, the construction of the IBI by combining all parameters of biological status can more accurately and completely reflect the health of water ecosystem and the intensity of disturbance [8]. Currently, the evaluation system has been widely used for benthic macroinvertebrates [9,10], plankton [11], and periphyton [12]. Therefore, the Phytoplanktonic Index of Biotic Integrity (P-IBI) plays a crucial role in global water resource management.
Phytoplankton are the main producers of aquatic ecosystems and can respond to environmental changes in a short period of time and are better indicators of environmental changes [13]. Excessive phytoplankton reproduction and the outbreak of water bloom caused by eutrophication in lakes and reservoirs have always been major water environmental problems [14]. Therefore, it is of great scientific and practical significance to develop ecological integrity evaluation around phytoplankton. At present, the P-IBI has been widely used in ecosystem health assessment of water bodies. Al-Janabi et al. [15] developed a P-IBI to evaluate the biological integrity of the Tigris River, and the results showed that the P-IBI is an effective indicator for evaluating the health of river ecosystems. Lacouture et al. [16] established a P-IBI based on 18 years of water quality monitoring data from the Chesapeake Bay, which correctly classified 70.0–84.4% of impaired and minimally impaired samples in a calibrated data set and is a management tool to assess the status of the phytoplankton community. Zhu et al. [17] established a P-IBI in Lake Gehu in the Yangtze River Delta during the dry and abundant water periods and found that there were temporal variations in the P-IBI during the hydrological seasons. The stability of the P-IBI evaluation system was significantly better in the dry period than in the wet period. The P-IBI has become one of the indices commonly used in studies to evaluate the health of water ecosystems, and is generally applicable to the evaluation of freshwater ecosystem health, which can well reflect the relationship between human disturbance and biological characteristics and is an important tool for evaluating the health of water ecology.
The South-to-North Water Diversion Project is a national strategic water conservancy project to achieve optimal allocation of water resources in China and to protect and improve people’s livelihoods and is the largest inter-basin water diversion project in the world [18]. As the water source of the middle route of the South-to-North Water Diversion Project, Danjiangkou Reservoir meets the water supply needs of 150 million people in more than 40 cities along the route, which has supplied 53.541 billion cubic meters of water up to now. Therefore, as a source of drinking water, the water quality and water ecological safety of Danjiangkou Reservoir is even more important. Moreover, the establishment of effective water quality and water ecological health evaluation methods for reservoirs has become a focus of attention for reservoir ecological protection [19,20]. With the continuous increase of population and the rapid development of economy, the water ecological security risk of Danjiangkou Reservoir still exists due to various natural and human factors [21]. At present, studies of water quality monitoring and health evaluation in Danjiangkou Reservoir are mainly based on physical and chemical factors (such as single factor and eutrophication index) and diversity indices of aquatic organisms [22,23,24], while a multi-index of biological integrity is rarely considered. Therefore, it is necessary to develop the P-IBI to assess the ecological health of Danjiangkou Reservoir.
In this study, in order to construct a P-IBI ecological health evaluation index that was suitable for large drinking-water reservoirs, the following scientific questions were raised, with Danjiangkou Reservoir as the research object: (1) What are the spatial and temporal variation patterns of P-IBI? (2) What are the key factors affecting P-IBI? (3) Is it feasible to construct a P-IBI ecological health evaluation of large drinking-water reservoirs? In addition, to test the validity of the P-IBI, we hypothesized that the P-IBI could effectively represent the water quality conditions of large reservoirs and would be consistent with the performance of the trophic level index (TLI). Therefore, we compared the assessment results of the P-IBI with those of the TLI to provide technical and data support for ecological health.

2. Materials and Methods

2.1. Study Area

The Danjiangkou Reservoir (32°56′~32°82′ N, 111°39′~111°61′ E) is located in central China belonging to Danjiangkou City and Xichuan County, which is one of the largest artificial freshwater lake in Asia. The main functions of the Danjiangkou Reservoir are water supply, flood control, power generation, and irrigation [25]. The Danjiangkou Reservoir is V-shaped and consists of the Han Reservoir and Dan Reservoir, which are located in Hubei and Henan provinces, respectively. The control basin area is 9.5 × 10⁴ km2, the normal water level is 170 m, the total storage capacity is 290.5 × 10⁸ m3, and the reservoir area is 1050 km2.
According to the geographical characteristics of Danjiangkou Reservoir and the influence degree of human activities, sampling was conducted at 19 sites in Danjiangkou Reservoir (Figure 1). The Dan Reservoir includes: Dashiqiao (DSQ), Zhangying (ZY), Caowan (CW), Guojiashan (GJS), Baxiandong (BXD), Taibaitan (TBT), Heijizui (HJZ), Shiqiao (SQ), Lijiagou (LJG), Songgang (SG), Kuxin (KX), Taizishan (TZS), and Qushou (QS) among which DSQ and ZY are the entrance of Dan Reservoir, and QS is near the water inlet to the Middle Route of the South-to-North Water Diversion Project. The Han Reservoir includes Bashang (BS), Langhekou (LHK), Tianjialing (TJL), Magou village (MGC) and Gongjia village (GJC), of which LHK and MGC are the entrance of the Han Reservoir. In addition, one sampling site (BX) was set 100 m downstream of Danjiangkou Dam, which is the outlet of Han Reservoir.

2.2. Sample Collection and Determination

Water and phytoplankton samples were collected from October 2019 to July 2021, in autumn (October), winter (January), spring (May), and summer (July). According to the standard method [26], 2 L of 0–50 cm surface water samples were collected using a column water collector, stored at low temperature, and protected from light for water quality index determination; 2 L of surface water was collected and fixed by adding 30 mL of Lugol’s iodine solution. In the laboratory, a liquid separation funnel was used to settle the sample for 48 h, the supernatant was aspirated, and 30–50 mL of concentrated sample was retained for quantitative analysis of phytoplankton community composition.
The cell density of phytoplankton was determined by a hemocytometer [27] (Thorma, Hirschmann, Germany); 0.1 mL was taken from the well-shaken sample and placed on the hemocytometer. The species of phytoplankton were identified and counted using an inverted microscope (CKX41, Olympus, Japan) [28,29].
Water temperature (WT), pH, electrical conductivity (Cond), oxidation–reduction potential (ORP), and dissolved oxygen (DO) were determined on-site by a portable multi-parameter water quality tester (YSI Inc., Yellow Springs, OH, USA). The water transparency (SD) was measured by the Secchi disk method.
The concentration of total phosphorus (TP) in water was determined by ammonium molybdate spectrophotometry [30]. Total nitrogen (TN) concentration was determined by potassium persulfate oxidation spectrophotometry [31]. Ammonium nitrogen (NH4+-N) was determined by Nessler’s reagent spectrophotometry [32]. Nitrate nitrogen (NO3-N) was determined by ultraviolet spectrophotometry [33]. Potassium permanganate index (CODMn) was determined by potassium permanganate digestion titration [34]. Chemical oxygen demand (COD) was measured by potassium dichromate reflux method [35]. Chlorophyll a (Chl a) concentration was determined by spectrophotometry after 90% acetone extraction [36]. Referring to the environmental protection standard Determination of Water Quality of Total Organic Carbon Combustion Oxidation—Non-dispersive Infrared Absorption Method (HJ501-2009) [37], total organic carbon (TOC) was determined by a total organic carbon analyzer (Multi N/C 3100, Analytik Jena Ltd., Jena, Germany).

2.3. Data Collation and Analysis

2.3.1. Dominance and Diversity Index

Phytoplankton dominance was calculated using the McNaughton’s Dominance Index [38], and the species was defined as dominant when y > 0.02.
The Shannon–Wiener Diversity Index (H’) [39], Margalef Richness Index (D), and Pielou Evenness Index(J) [25] were used to characterize the phytoplankton diversity indices, respectively. Each index was calculated as follows.
McNaughton’s Dominance Index formula:
y = n i / N   f i
Shannon–Weiner Diversity Index (H′) formula:
H = i = 1 s P i lnP i
Margalef Richness Index (D):
D = S 1 / lnN
Pielou Evenness Index (J):
J = H / lnS
where n i is the total number of individuals of the ith species; N is the number of individuals of all species; f i is the frequency of occurrence of the ith species at each point; P i is the ratio of the number of individuals of the ith species to the total number of all individuals; S is the total number of phytoplankton species in the sample.

2.3.2. Comprehensive Trophic Status Evaluation of Water Quality

Comprehensive trophic level index (TLI) was used to evaluate the trophic status of water bodies in Danjiangkou Reservoir [40], which was based on Chl.a, TP, TN, SD and CODMn as evaluation factors and calculated as
T L I = j 1 m W j T L I j
In Equation (5), Wj is the correlation weight of trophic level index of the jth parameter, TLI(j) is the trophic status index of parameter j. When TLI < 30, the water body is in a state of oligotrophy; when 30 ≤ TLI ≤ 50, the water body is in a mesotrophic state; when TLI > 50, the water body is in a eutrophic state; when 50 < TLI ≤ 60, the water body is in lightly eutrophic status; when 60 < TLI ≤ 70, the water body is in moderately eutrophic status; and when TLI > 70, the water body is in severely eutrophic status [41].

2.3.3. P-IBI Establishment in Danjiangkou Reservoir

Based on the literature [42], the following criteria were used to screen the reference points based on the water environment quality condition and phytoplankton survey results in Danjiangkou Reservoir: (1) less influenced by human activities and hydraulic engineering; (2) TLI less than 35; (3) condition of the phytoplankton diversity was better, and the density of algal cells was less than 1 million cells /L.
Concerning domestic and international examples of P-IBI studies [16,43] and combined with the results of phytoplankton monitoring in this study, twenty-six widely used indicators with high inclusion rates were selected as the marquee biological indicators (Supplemental Table S1). The indicators for the development of the P-IBI were selected by the following stepwise screening procedure: (1) The distribution range of each indicator parameter was analyzed, and indicators with too narrow distribution range or predictable environmental variability, zero values at more than 95% of sample sites, and non-monotonic variation in disturbance intensity were excluded. (2) The discriminant analysis was performed by Mann–Whitney non-parametric test, calculating that only candidate factors that showed significant differences (p < 0.05) between the reference and affected sites were accepted for the next level of screening [44]. (3) Pearson correlation analysis was performed for the remaining indicators, and only one of two metrics with strong correlations (|r| ≥ 0.75) were retained.
When the candidate metrics decrease with the interference, the assigned scores were 1,2, 3, 4, and 5 for the <25th, 25–50th, 50–75th, 75–90th, and >90th percentiles, respectively. If the value of the selected indicator rises with the interference, then the weighted mean <25th, 25th–50th, 50th–75th, 75th–90th, and >90th percentile, the 90th percentile score distribution is 5, 4, 3, 2, and 1. The P-IBI scores, which were calculated as the mean values of selected metrics, were used to classify aquatic ecosystem health into 5 levels: 0–1 (bad), 1–2 (poor), 2–3 (fair), 3–4 (good), and 4–5 (excellent) [45].

2.3.4. Statistical Analysis

All relevant data were processed in Excel 2019 (Microsoft Corporation, Redmond, WA, USA). The spatial distribution of the samples was plotted using ArcGIS10.7 (ESRI, Redlands, CA, USA). Significant differences in environmental factors were compared using one-way analysis of variance (ANOVA) in SPSS19.0 (IBM SPSS Inc., Chicago, IL, USA) at the seasonal scales. Mann–Whitney non-parametric tests were used to screen P-IBI candidate parameters with SPSS 19.0. The significance level was set at p < 0.05. Origin2018 (Origin Lab, Northampton, MA, USA) software was used to make a histogram comparison of phytoplankton communities.
The candidate parameters of P-IBI were screened by Pearson correlation analysis. The spatial and temporal variation of P-IBI is described by boxplot. Redundancy analysis (RDA) was performed on P-IBI and environmental factors, and the correlation between P-IBI and TLI was analyzed by linear regression. The above analyses were made using ggcor [46], ggplot2 [47], vegan [48], and ggplot2 packages, respectively, under R (version 3.6.3) software (The R Programming Language, The University of Auckland, New Zealand) environment.

3. Results

3.1. Environmental Characteristics

During the survey, the WT of Danjiangkou Reservoir ranged from 4.5 to 32 °C, pH from 7.93 to 9.4, DO from 5.3 to 13.52 mg/L, Cond from 83.27 to 613 μS/cm, ORP from 64.97 to 296.5 mV, TP from 0. 01 to 0.08 mg/L, TOC from 0.29 to 7.1 mg/L, and CODMn from 1.09 to 5.94 mg/L during the survey period. WT was higher in summer (p < 0.05) (Table 1) and significantly lower in winter (p < 0.05) than in other seasons. PH was significantly higher in spring (p < 0.05) and lower in autumn (p < 0.05) than in other seasons. DO was significantly higher in summer than in autumn and winter (p < 0.05) and significantly lower in autumn (p < 0.05) than in the other seasons (p < 0.05). Cond was significantly lower than other seasons in autumn (p < 0.05). ORP was higher than other seasons in autumn and the difference was significant (p < 0.05). TP concentration was significantly higher in summer than spring, autumn, and winter (p < 0.05). The concentration of CODMn was higher in autumn than in other seasons. The concentration of TOC was lower in winter than in other seasons, and the difference was significant (p < 0.05). Other indicators were not significantly different in all seasons.

3.2. Characteristics of Phytoplankton Community Structure in Danjiangkou Reservoir

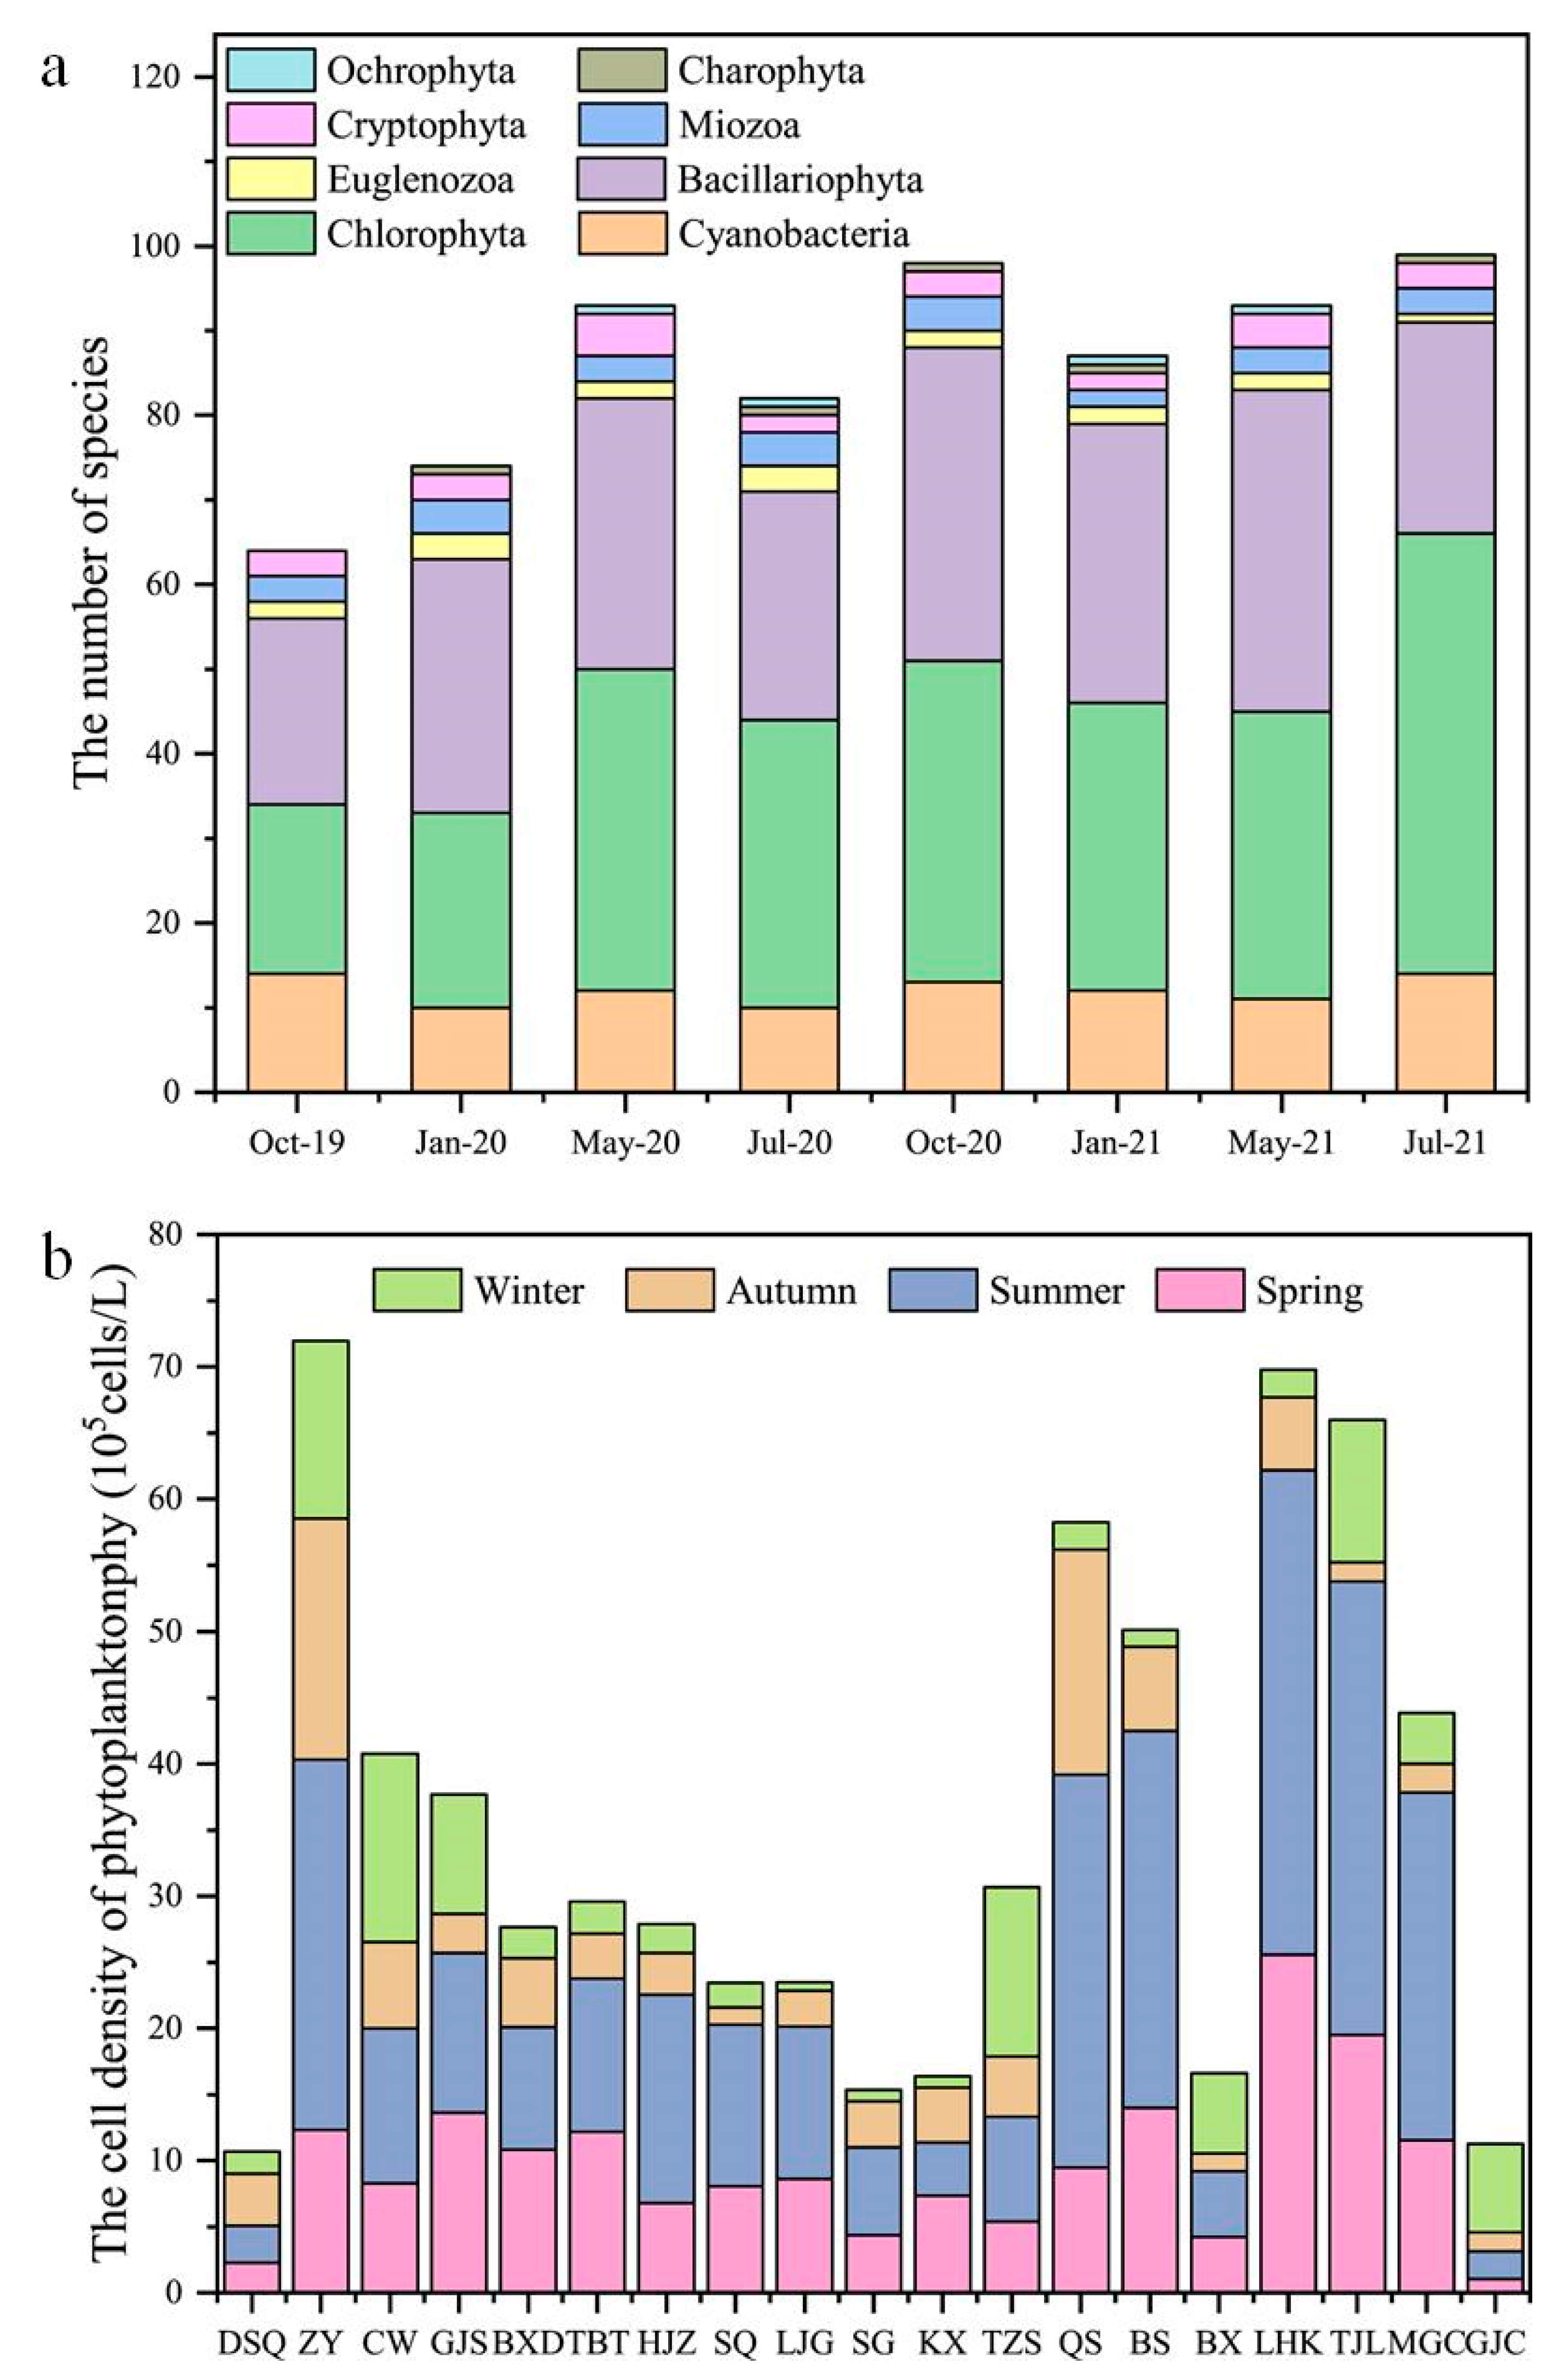
A total of 170 phytoplankton species (including varieties) were identified belonging to 9 phyla, 46 families, and 95 genera in samples from Danjiangkou Reservoir during the survey. The species composition is dominated by Chlorophyta, Bacillariophyta, and Cyanobacteria, and the number of species ranked as Chlorophyta > Bacillariophyta > Cyanobacteria (Figure 2a). There was a gradual shift from a Bacillariophyta/Chlorophyta pattern in winter and spring to a Chlorophyta/Bacillariophyta pattern in summer and autumn. The highest number of species was found in October 2020 and the lowest number in October 2019.
The cell density of phytoplankton abundance in Danjiangkou Reservoir from October 2019 to July 2021 (Figure 2b) ranged from 0.61 × 10⁵ to 36.64 × 10⁵ cells/L, with a mean value of 8.83 × 10⁵ cells/L. The highest value occurred at LHK, reaching 36.64 × 10⁵ cells/L, and the lowest value at LJG was 0.61 × 10⁵ cells/L. Spatially, the cell density of phytoplankton from high to low in space were entrance of Han Reservoir, Han Reservoir, entrance of Dan Reservoir, Dan Reservoir, and outlet of the reservoir. On the time scale, the average phytoplankton abundance was 8.45 × 10⁵ cells/L in spring, 15.58 × 10⁵ cells/L in summer, 4.99 × 10⁵ cells/L in autumn, and 5.01 × 10⁵ cells/L in winter. Phytoplankton abundance in Danjiangkou Reservoir was highest in summer and lowest in autumn.

3.3. Establishment of P-IBI in Danjiangkou Reservoir

The determination of reference points and damage points is the basis of biological integrity evaluation, and the results directly affect the core biological parameters included in the biological integrity index and the evaluation results. Reference points for spring in Danjiangkou Reservoir are KX, LJG, SQ, and TBT in 2021. Reference points for summer are GJS in 2020, KX, SQ and TBT in 2021. Reference points for autumn are KX, BS, TJL, and LHK in 2019 and KX, LHK, LJG, and SQ in 2020. Reference points for winter are KX in 2020 and BS, HK, KX, LJG, and SQ in 2021.
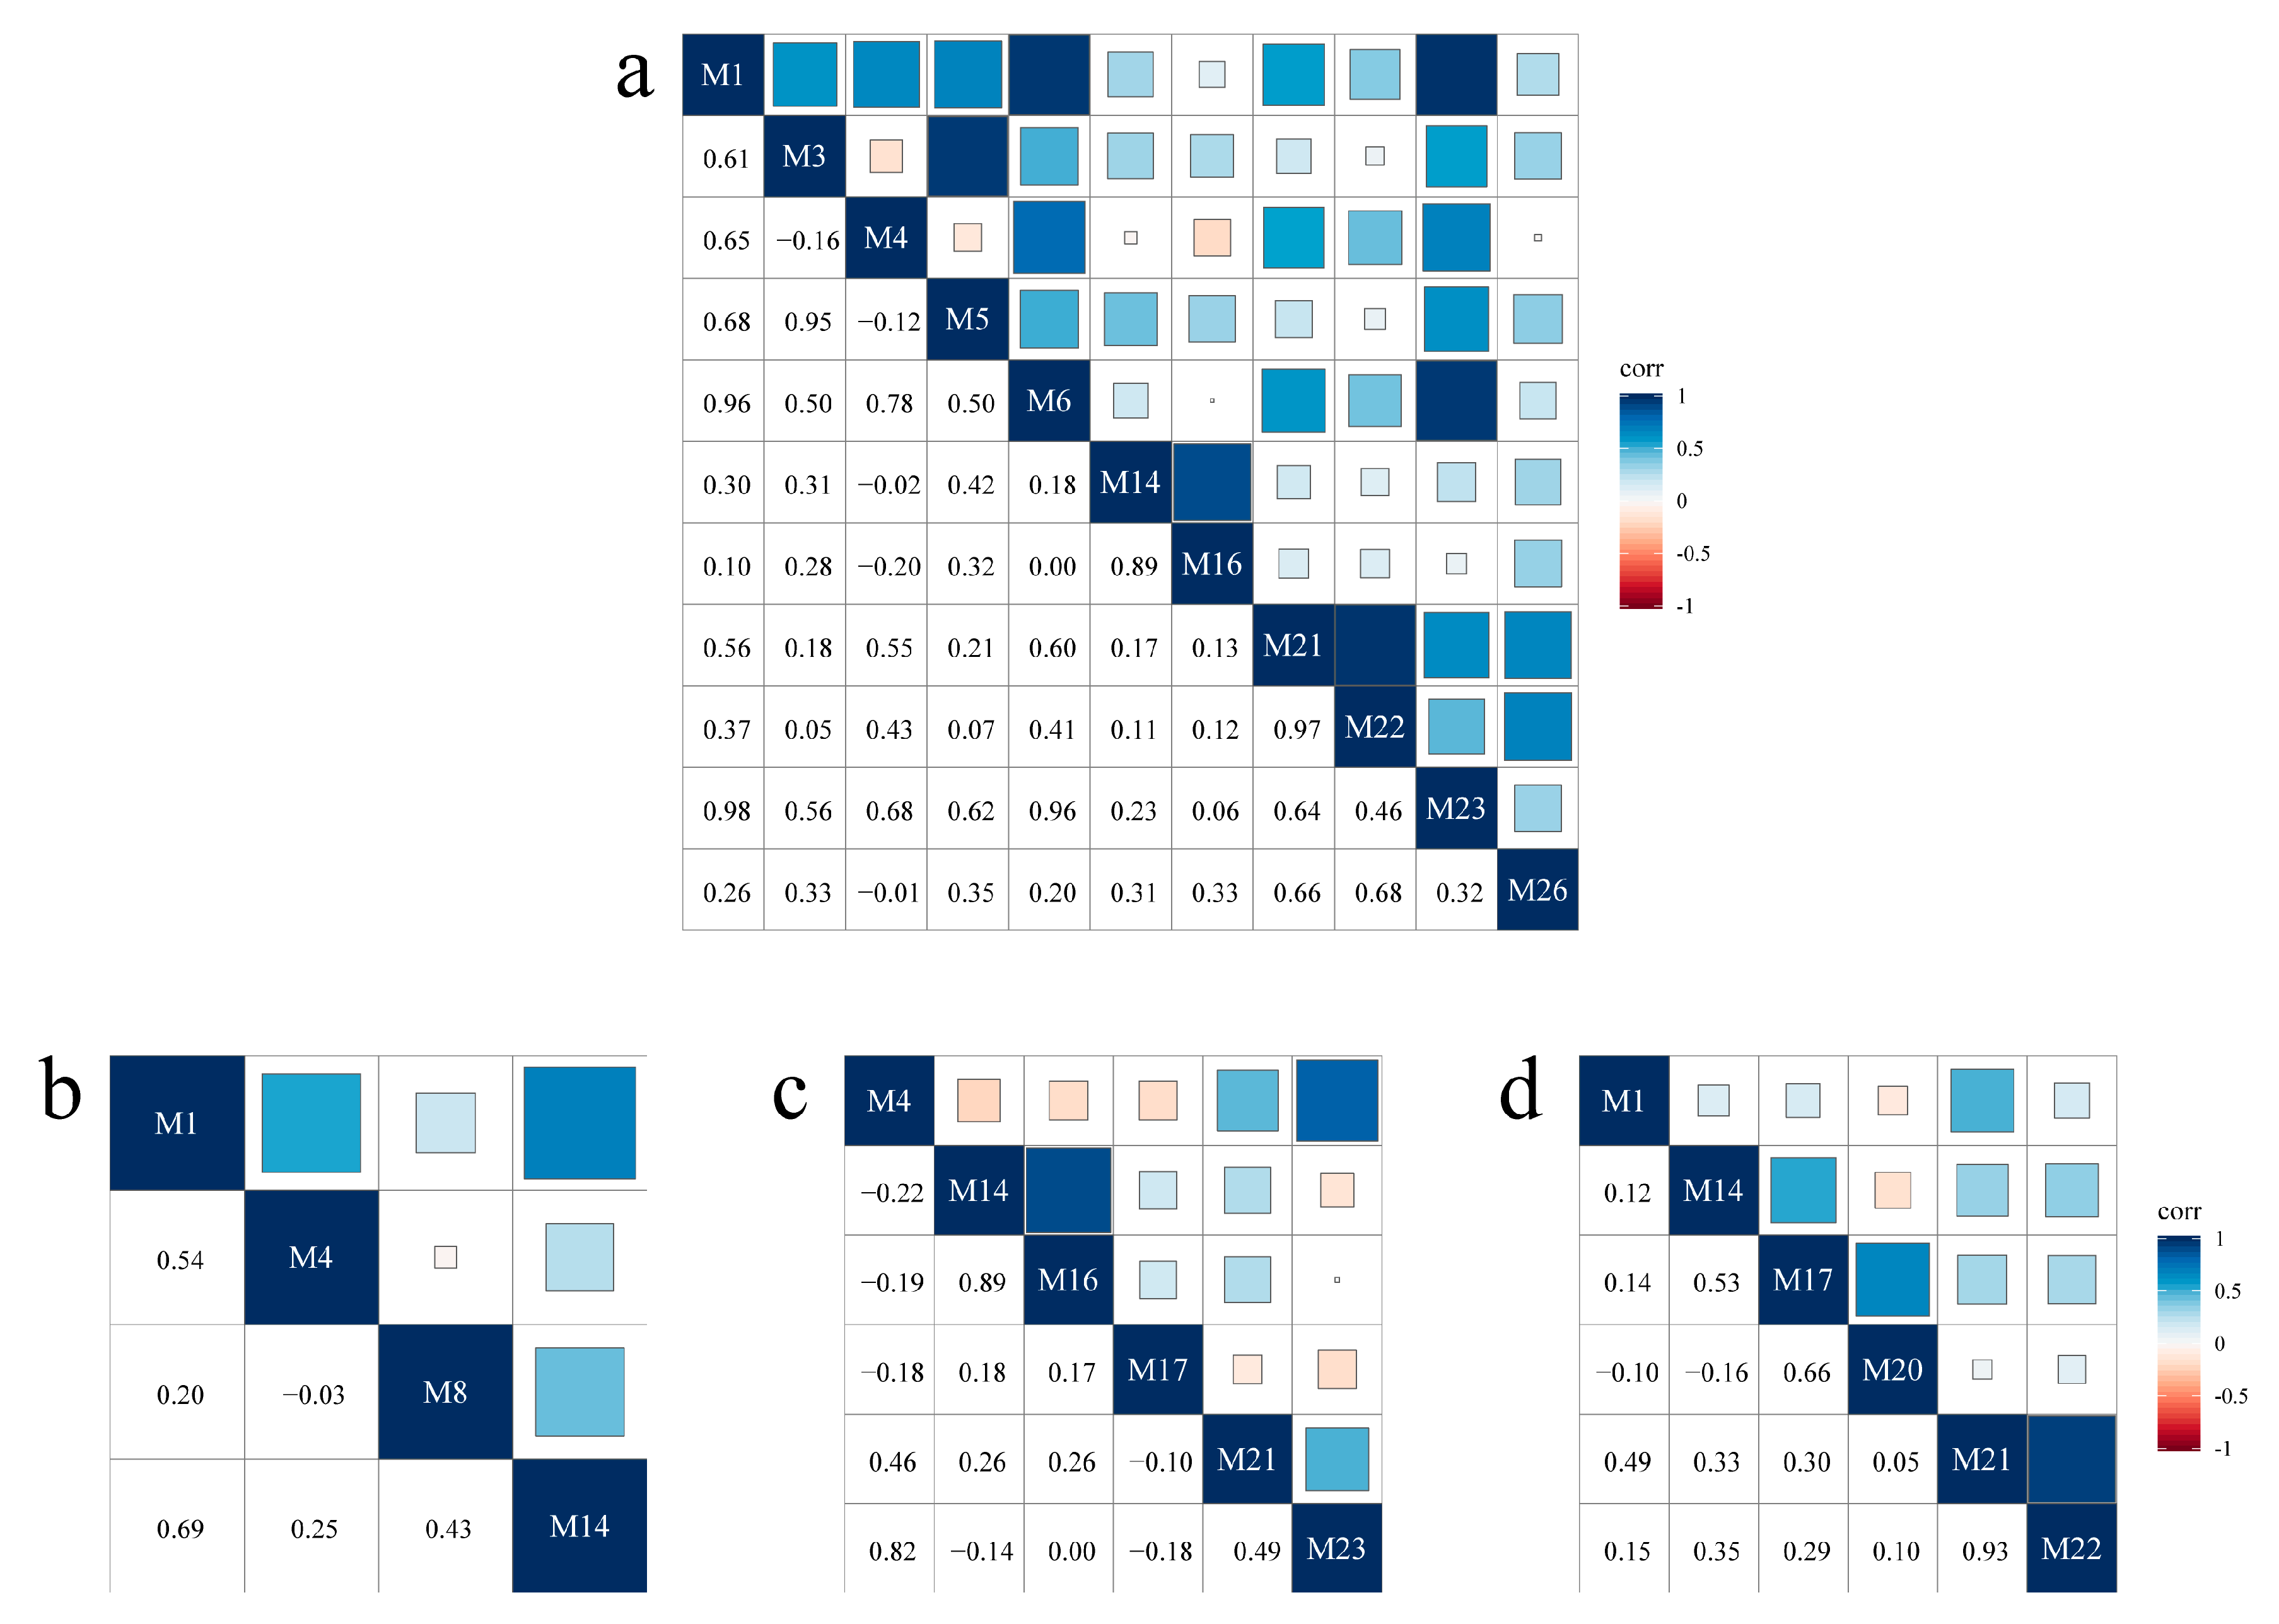
By calculating and analyzing the distribution characteristics of each parameter value in the sample points, M15 and M18 were deleted due to their own small values. The Mann–Whitney non-parametric test was used to discriminant analysis of candidate parameters, and the results showed that eleven, four, six, and six parameters were significantly different between the reference and impaired points in spring, summer, autumn, and winter, respectively (p < 0.05, Supplemental Table S2), which could proceed to the next screening step. Pearson correlation analysis was performed on the candidate parameters obtained from the discriminant analysis to test the independence of the information reflected by each index. The correlation coefficient |r| ≥ 0.75 between the two indices indicates a high correlation between the two indices, and for the highly correlated indices, one of them is taken. Pearson correlation analysis of the candidate parameters obtained from the discriminant analysis showed that the parameters used for the spring P-IBI index assessment were M3, M4, M14, M21, M23, and M26 (Figure 3a). The parameters used for summer P-IBI index evaluation included M1, M4, M8, and M14 (Figure 3b). M14, M17, M21, and M23 were used as parameters for fall P-IBI index evaluation (Figure 3c). The parameters used for winter P-IBI index evaluation were M14, M17, M20, M21, and M24 (Figure 3d). Seasonal differences exist in the number of parameters that can be used for P-IBI evaluation due to differences in the results of nonparametric tests and correlation analyses of candidate parameters in different seasons in Danjiangkou Reservoir.
The final P-IBI scores (Table 2) were calculated in spring based on six indicators (M3, M4, M14, M21, M23, and M26). The values of these indicators M3, M4, M21, and M23 decreased with disturbance and were assigned 1, 2, 3, 4, and 5 based on the <25, 25–50, 50–75, 75–90, and >90th percentile of the weighted mean values, respectively. On the contrary, the M14 and M26 values of these indicators increase with disturbance and therefore scores are assigned as 5, 4, 3, 2, and 1. P-IBI scores for summer, autumn and winter were calculated in the same way.
The final P-IBI scores were calculated in summer based on four indicators (M1, M4, M8, and M14), with the values of M1 and M4 decreasing with disturbance, and the values of M8 and M14 increasing with disturbance. In autumn, the final P-IBI scores were calculated based on four indicators (M14, M17, M21, and M23), with the values of M21 and M23 decreasing with disturbance and the values of M14 and M17 increasing with disturbance. In winter, the final P-IBI scores were calculated based on five indicators (M14, M17, M20, M21, and M24), with the value of the M21 indicator decreasing with interference and the values of the M14, M17, M20, and M24 indicators increasing with interference.

3.4. Water Quality Condition Based on P-IBI

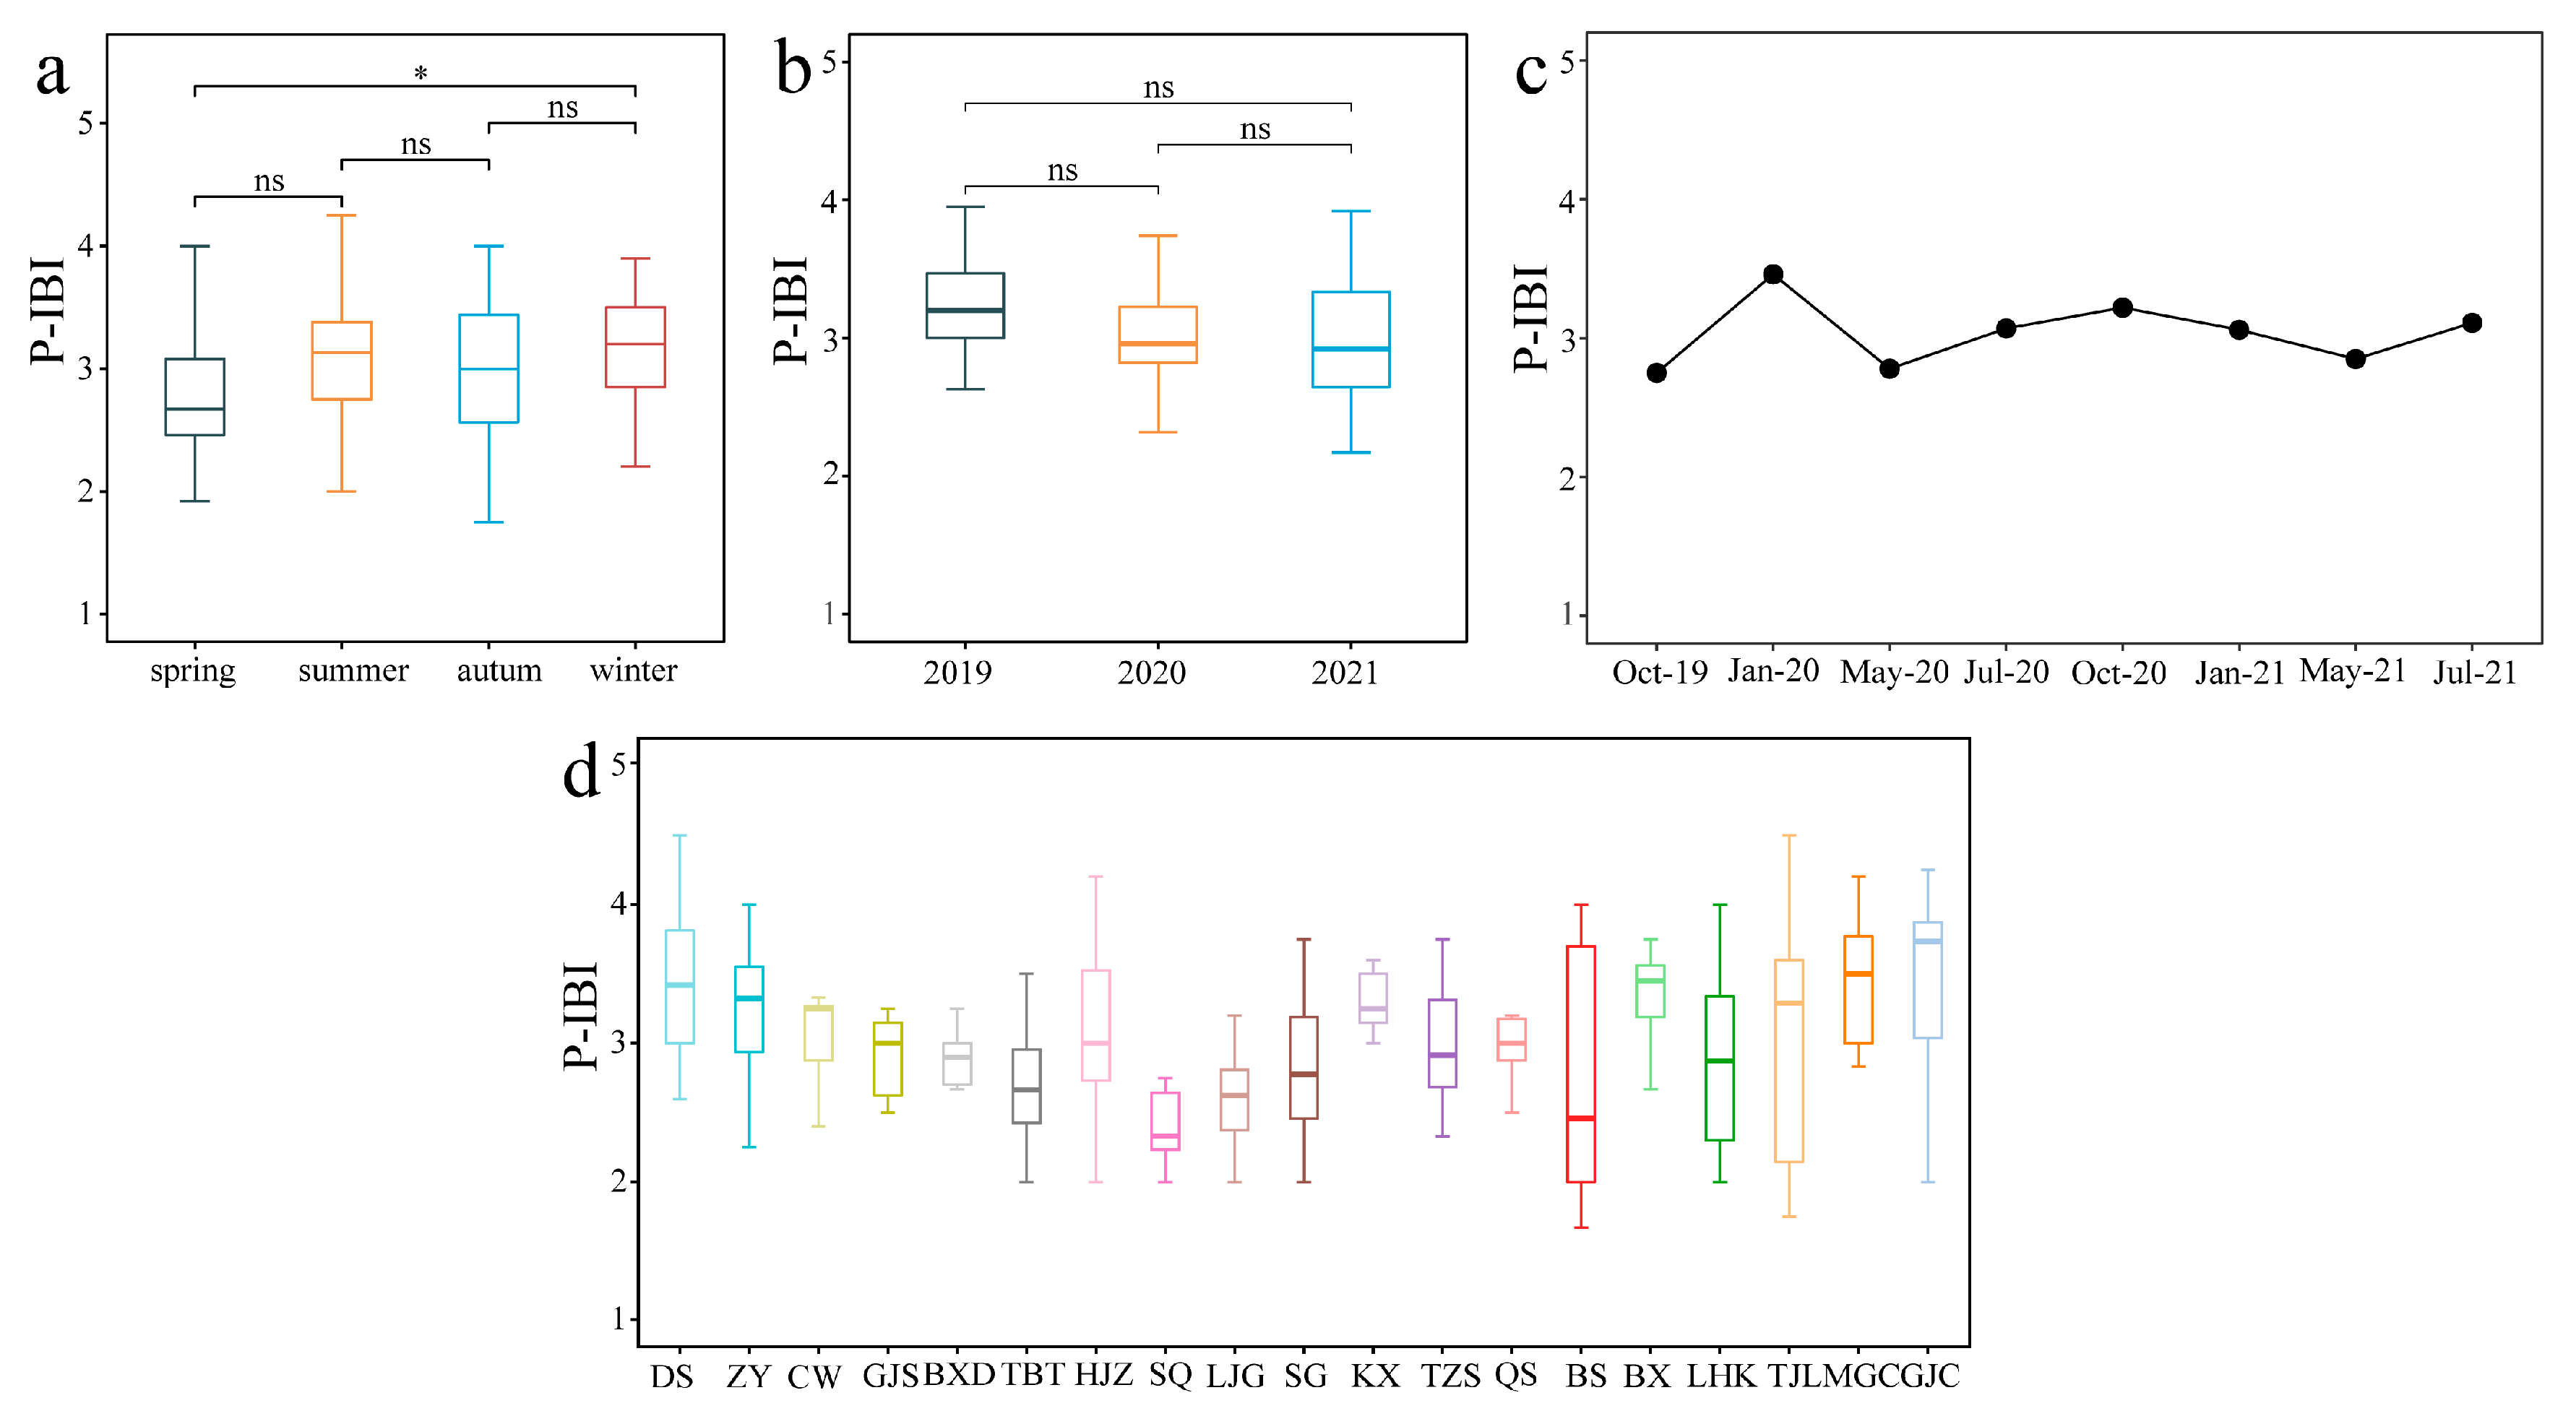
The P-IBI scores of Danjiangkou Reservoir ranged from 1.67 to 4.5. The mean P-IBI was 3.17 (winter) > 3.09 (summer) > 2.99 (autumn) > 2.82 (spring). The statistical results showed that on the time scale, P-IBI was significantly lower in spring than in winter (p < 0.05), while there was no significant difference in other seasons (Figure 4a). In addition, there was no significant difference in P-IBI from 2019–2021 between years, and P-IBI scores showed a decreasing trend from year to year (Figure 4b). The lowest P-IBI value occurred in October 2019, and the highest value occurred in winter 2020 (Figure 4c).
The mean P-IBI value of all sampling sites was 3.03 (Figure 4d), and the mean P-IBI value at the spatial scale was outlet of the reservoir > entrance of Dan Reservoir > entrance of Han Reservoir > Han Reservoir > Dan Reservoir, with the highest value at BX of outlet of the reservoir, the highest mean value at GJC, and the lowest mean value at SQ. The P-IBI values of BS and TJL of the Han Reservoir varied significantly in seasons, and the P-IBI values of SQ were <3 in all seasons.
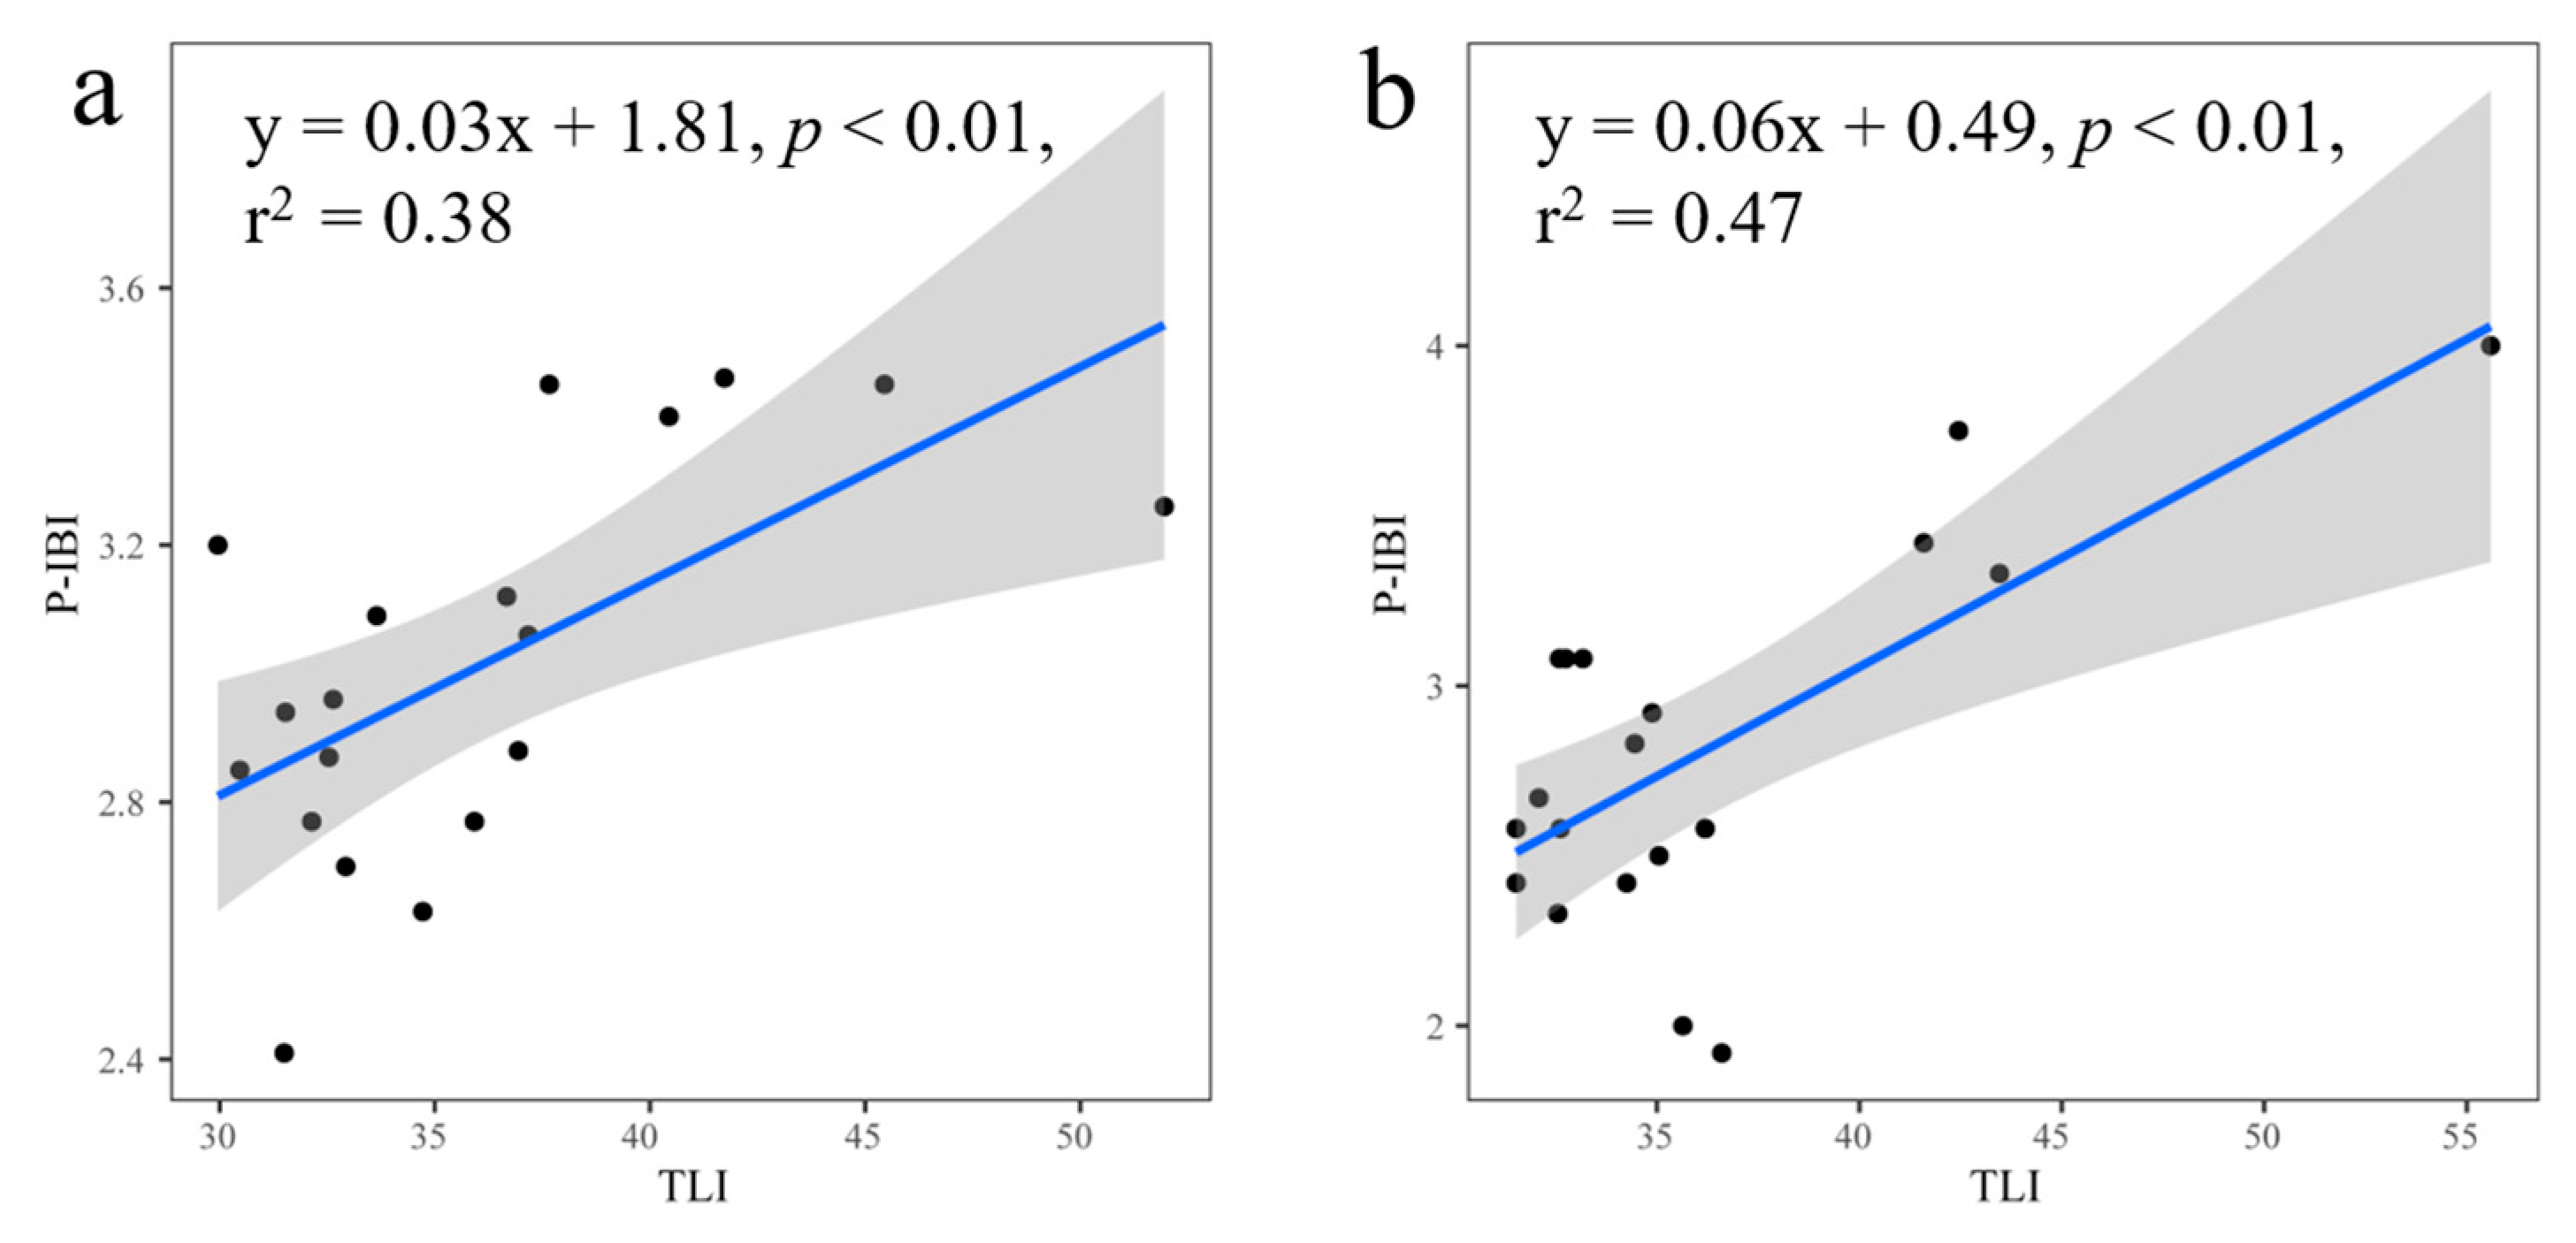
A comparative analysis of P-IBI with TLI using linear regression showed that P-IBI values were positively correlated with TLI values at 19 sites from the seasonal average data (Figure 5a). Moreover, values of r2 and p were 0.38 and <0.01, respectively. Further analysis showed that P-IBI values for spring were also significantly positively correlated with TLI values (r2 = 0.47 and p < 0.01) (Figure 5b). There was no correlation between P-IBI values and TLI values in other seasons.

3.5. Relationship between P-IBI and Environmental Factors

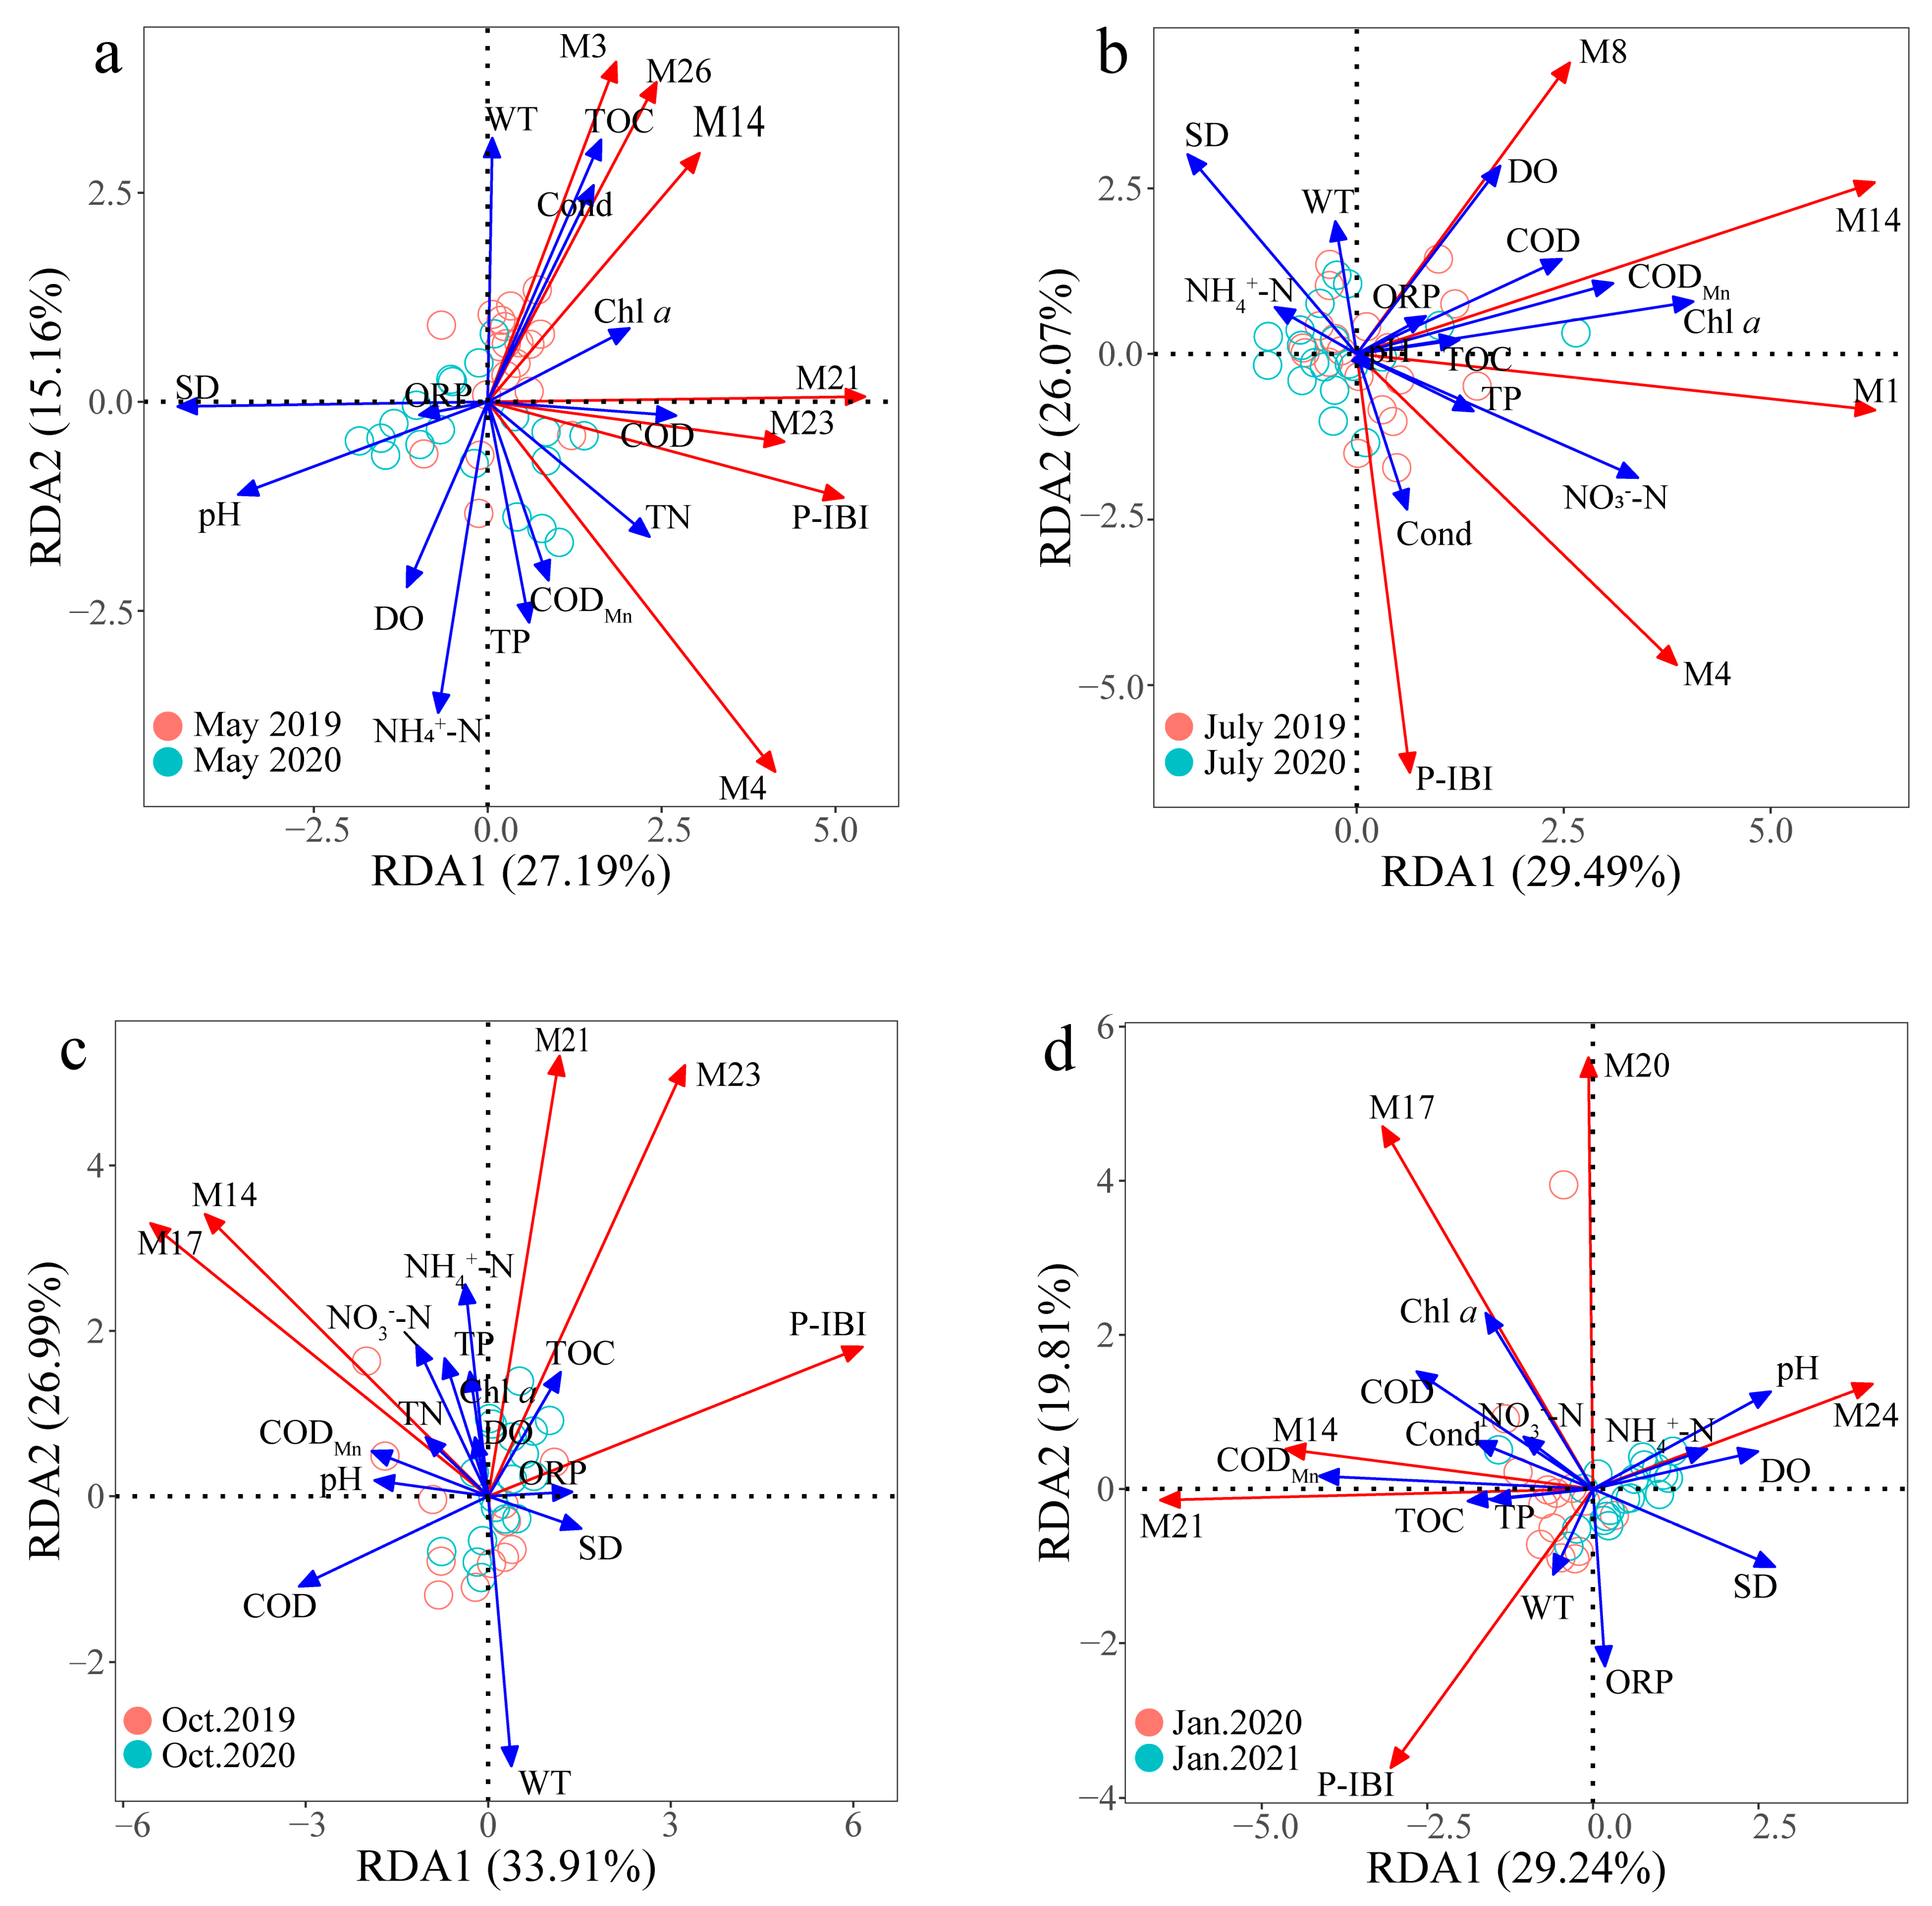
The relationships between P-IBI scores and its constituent parameters and individual water quality environmental factors in different seasons were analyzed using redundancy analysis (Figure 6). The cumulative contribution of the first two axes in spring (Figure 6a) was 42.35%, and P-IBI scores were significantly and positively correlated with TOC (F = 7.67, p < 0.01), TP (F = 5.17, p < 0.05), COD (F = 2.61, p < 0.05), TN (F = 6.55, p < 0.01)), Cond (F = 5.43, p < 0.01), and NH4+-N (F = 7.23, p < 0.001). P-IBI scores were significantly and negatively correlated with DO (F = 2.16, p < 0.05), SD (F = 5.01, p < 0.001), WT (F = 4.02, p < 0.01), and pH (F = 6.24, p < 0.001). The cumulative contribution of the first two axes in summer (Figure 6b) was 55.56%, and the P-IBI scores were negatively correlated with DO (F = 2.18, p < 0.01), CODMn (F = 3.85, p < 0.05), COD (F = 3.48, p < 0.05), and SD (F = 4.04, p < 0.01). P-IBI scores were positively correlated with Cond (F = 5.43, p < 0.05), NO3-N (F = 3.15, p < 0.01), and Chl.a (F = 4.25, p < 0.001). The results for autumn (Figure 6c) showed a cumulative contribution of 60.9% for the first two axes. P-IBI scores were significantly and negatively correlated with COD (F = 3.70, p <0.001) and WT (F = 4.40, p < 0.01). The results in winter (Figure 6d) showed a cumulative contribution of 49.05% for the first two axes. P-IBI scores were negatively correlated with pH (F = 1.43, p < 0.01), DO (F = 3.91, p < 0.05), SD (F = 3.81, p < 0.01), and COD (F = 2.54, p < 0.01) and positively correlated with CODMn (F = 5.10, p < 0.001).

4. Discussion

4.1. Community Structure of Phytoplankton

The phytoplankton community in Danjiangkou Reservoir has obvious seasonal variation. Appropriate temperature can improve photosynthesis of phytoplankton, accelerate cell metabolism and promote their growth and reproduction [49]. During the study period, chlorophytes and diatoms dominated in spring. In summer, the numbers of chlorophytes and Cyanobacteria increased, while the numbers of diatoms decreased. The growth of different phytoplankton has different requirements for water temperature [50]. With higher water temperature and stronger light in spring and summer, Chlorophyta have competitive advantages [51]. The number of Cyanobacteria rises in autumn. Cyanobacteria prefer high-temperature environment, so summer and early autumn are suitable for their growth. In winter, the diatoms were more prevalent, and the number of Cyanobacteria decreased. Diatoms like low-temperature environment, and they generally predominate in autumn and winter. Wang et al. [52] found that diatoms were the dominant taxa in Danjiangkou Reservoir in both spring and winter from 2014 to 2015, while Chlorophyta were dominant in summer. The famous PEG (planktonecology group) model proposed by Sommer et al. [53] suggested that the phytoplankton community was dominated by cryptophytes and diatoms in winter and spring, and Chlorophyta in summer. The phytoplankton community is dominated by cryptophytes and diatoms in winter and spring, Chlorophyta in summer, Cyanobacteria in late summer and early autumn, and diatom populations rise again in autumn. The results of this survey were more or less the same as those of previous studies.
In this study, the cell density of phytoplankton in the Han Reservoir area was greater than that in the Dan Reservoir area, which may be due to the fact that the Han Reservoir has many tributaries and is still a river-type water body, making the diversity of water habitats higher and thus causing an increase in phytoplankton diversity. In the phytoplankton survey of Danjiangkou Reservoir in 2007–2008, Shen et al. [54] pointed out that the density of phytoplankton in the Han Reservoir area was higher than that in the Dan Reservoir area.

4.2. P-IBI Spatial and Temporal Variation

Wu et al. [8] evaluated the Kielstu watershed in Germany using a P-IBI and the results showed that the ecological condition of the rivers in the study area has seasonal variation. The P-IBI in Danjiangkou Reservoir also had seasonal variation. With the increase in temperature, a large number of phytoplankton begin to multiply rapidly in Danjiangkou Reservoir each spring [55]. The P-IBI values were lowest in spring and highest in winter, and the reason for this phenomenon may be that the average phytoplankton biomass in Danjiangkou Reservoir was highest in spring and lowest in winter. This is confirmed by the results of Kane et al. [56], who studied the plankton integrity index in Lake Erie and showed a negative correlation between biomass and P-IBI. The stability of the P-IBI evaluation system was significantly better in the dry period than in the rich period for Lake Gehu in the Yangtze River Delta [17]. Maulood et al. [57] conducted seasonal P-IBI evaluations of different sites in the southern Iraqi marsh from 2005 to 2007, and the results also indicated that the values were usually higher in winter. The above results are similar to Danjiangkou Reservoir. The difference is that the P-IBI values in Danjiangkou Reservoir are lower in autumn than in summer, which may indicate that the phytoplankton diversity is lower due to the disturbance of high flow rate at the transfer outlet in autumn when the water level rises [58].
The lower P-IBI results at the inlet than at the outlet may be due to the fact that the inlet is located in a human-inhabited environment with high anthropogenic disturbance and higher nutrient concentration, indicating the importance of source pollution source control and monitoring for the management of Danjiangkou Reservoir [21]. The P-IBI values of MGC at the entrance of Han Reservoir, ZY and DSQ at the entrance of Dan Reservoir, and GJC at the Han Reservoir were higher than those of the Dan Reservoir, probably because the number of species and the complex and reasonable community structure of the sample sites made the P-IBI composition parameters such as the number of species and diversity index of the sites in this region were in a healthier state [42]. The lower P-IBI values of SQ and SG in Dan Reservoir may be due to the fact that they are located at the docks and are subject to greater human influence. The lower P-IBI value of BS in Han Reservoir may be due to the low flow velocity and nutrients retention at Han Reservoir dam.
P-IBI was applied to water quality evaluation of drinking reservoirs such as Baihua Reservoir in Guizhou plateau [59] and Nanwan Reservoir in Huaihe River Basin [60], and the results showed that it is feasible to evaluate the water ecological health level of reservoirs based on the P-IBI, and the index evaluation method applied to reservoir water ecology has a certain extension value to provide relevant scientific information for improving the current water environment. In this study, the P-IBI evaluation results of Danjiangkou Reservoir are good, which is consistent with previous evaluation results [61]. The P-IBI evaluation results show that the ecological condition of Danjiangkou Reservoir is better in winter and worse in spring, which is consistent with the TLI evaluation results. On the spatial scale, it is different from the previous results [62,63,64]. In this study, the P-IBI value of Dan Reservoir was lower than that of other regions, while the previous water quality evaluation results of Dan Reservoir were the best. The reasons for this result may be as follows: P-IBI is significantly positively correlated with TLI, and the value of P-IBI increases as the trophic state of the water body increases, while P-IBI decreases as the trophic state of the water body increases after TLI increases to a certain limit value between 35 and 40 (Figure 5a). For example, the P-IBI values of BX, GJC, DSQ, MGC, and ZY decreased as the TLI values (TLI > 35) increased. When Wu et al. [65] applied the cumulative coefficient method to construct the phytoplankton integrity index to evaluate the water ecological health of Taihu Lake basin and compared and analyzed the similarities and differences between the evaluation results of the phytoplankton integrity index and the water environment quality index, the results showed that these two indices have significant correlation, and the evaluation results of the phytoplankton integrity index are lower than those of the water environment quality index. The evaluation results of the P-IBI values of SQ and LJG at some sample sites in Dan Reservoir in this study were also lower than the evaluation results of TLI values. The differences that cause TLI and P-IBI may be due to the different distribution and classification of the selected key parameters. Unlike traditional water quality methods, P-IBI is a comprehensive indicator that not only captures the trophic state of the water body but also identifies changes in aquatic ecosystems related to biota [66].

4.3. Influencing Factors Driving P-IBI

Many factors affect the ecological status of the water environment. The indicators and values of the reference system criteria in different regions are different, and the health results and evaluation criteria differ with different reference point criteria. The selection of parameters is the key to building a multi-parameter evaluation system, and the selection of indicators is influenced too much by human subjective factors. Moreover, relevant environmental and meteorological conditions and human interference can have an impact on the results of P-IBI [59].
COD had a significant effect on P-IBI in all seasons in this study, and WT was negatively correlated with both spring and autumn P-IBI. P-IBI scores were positively correlated with NH4+-N in spring and NO3-N in summer, probably because there is a promotion effect of increasing ammonia nitrogen and nitrate concentrations on phytoplankton growth under certain conditions [67]. However, the results of the present study showed that their communities change positively with ammonia and nitrate concentrations. P-IBI was positively correlated with TN in spring, and Ling et al. [44] also showed that TN and NO3-N were positively correlated with P-IBI scores. P-IBI in winter was higher than in other seasons, while WT was negatively correlated with both P-IBI in spring and in autumn. The possible reason is that the determining external environmental factor limiting the phytoplankton community in the water column is water temperature, and its influence was much higher than that of factors such as nutrient salt concentration [68]. When the water temperature limits the outbreak of blooms of certain eutrophic and hypereutrophic species in the community, the ecological niches originally occupied by one or several phytoplankton species are released. The competitive relationship of interspecific competition in phytoplankton communities is greatly weakened under the influence of dominant external stresses such as temperature [69]. High nutrient concentrations had a facilitating effect on phytoplankton, and a large number of phytoplankton species appeared with a relatively reasonable community structure [42]. Due to the limitation of external pressure factors, the absence of absolutely dominant species, the large number of species, and the complex and reasonable community structure cause the P-IBI composition parameters of the sites in this region to be in a relatively healthy state.

5. Conclusions

In this study, the P-IBI effectively reflects the spatial and temporal variability of reservoir ecosystem health in Danjiangkou Reservoir and can be used for studies of the long-term ecological condition of other large drinking-water reservoirs. In general, the ecological condition of Danjiangkou Reservoir is good and could ensure the safety of water extraction. There is significant spatial and temporal variability in the P-IBI of Danjiangkou Reservoir. The P-IBI results in winter are the best, and the P-IBI in spring is the worst. The P-IBI values of Han Reservoir were higher than those of Dan Reservoir in all seasons except summer. P-IBI and its component parameters are highly correlated with water quality factors, and temperature and nutrients are the main factors affecting P-IBI. Seasonal changes and interannual fluctuations affect evaluation of water quality, so it is necessary to conduct ecological health assessment of water quality in drinking reservoirs regularly. Further, in future studies, it is necessary to check the selection of indicators and optimize the P-IBI evaluation system according to the different characteristics of water bodies.

Supplementary Materials

The following supporting information can be downloaded at: https://www.mdpi.com/article/10.3390/su15065282/s1. Table S1. 26 candidate biological parameters. Table S2. Results of Mann-Whitney tests.

Author Contributions

Conceptualization, M.Q., Y.L. and B.L.; methodology, M.Q. and P.F.; software, M.Q.; validation, M.Q., H.W. and W.W.; formal analysis, M.Q.; investigation, H.W. and W.W.; resources, P.F.; data curation, M.Q. and Y.L.; writing—original draft preparation M.Q. and Y.L.; writing—review and editing P.F., B.M., R.G. and B.L.; visualization, M.Q. and P.F.; supervision, P.F., Y.L. and H.L.; project administration, Y.L.; funding acquisition, Y.L. All authors have read and agreed to the published version of the manuscript.

Funding

This study was funded by the National Natural Science Foundation of China (No. 51879130), the Higher Discipline Innovation and Talent Introduction Base of Henan Province (No. CXJD2019001), and the Key Research and Development Projects of Henan Province (No. 221111520600).

Institutional Review Board Statement

Not applicable.

Informed Consent Statement

All authors agreed with the content and gave explicit consent to submit.

Data Availability Statement

Not applicable.

Acknowledgments

We are grateful to the International Joint Laboratory of Watershed Ecological Security of Middle Route Project of South–North Water Diversion in Henan Province, which provided the experiment platform.

Conflicts of Interest

The authors declare no conflict of interest.

References

  1. Cao, X.; Ji, Z.; Lan, H.; Liu, H.; Qu, J. Eutrophication control of lake/reservoir water sources and assurance of drinking water safety in China considering global climate change. Chin. Eng. Sci. 2022, 24, 34–40. [Google Scholar]
  2. Paul, B.; Bhattacharya, S.S.; Gogoi, N. Primacy of ecological engineering tools for combating eutrophication: An ecohydrological assessment pathway. Sci. Total Environ. 2021, 762, 143171. [Google Scholar] [PubMed]
  3. Glibert, P.M. Eutrophication, harmful algae and biodiversity—Challenging paradigms in a world of complex nutrient changes. Mar. Pollut. Bull. 2017, 124, 591–606. [Google Scholar]
  4. Heisler, J.; Glibert, P.M.; Burkholder, J.M.; Anderson, D.M.; Cochlan, W.; Dennison, W.C.; Dortch, Q.; Gobler, C.J.; Heil, C.A.; Humphries, E.; et al. Eutrophication and harmful algal blooms: A scientific consensus. Harmful Algae 2008, 8, 3–13. [Google Scholar] [PubMed] [Green Version]
  5. Noori, R.; Ansari, E.; Bhattarai, R.; Tang, Q.; Aradpour, S.; Maghrebi, M.; Torabi Haghighi, A.; Bengtsson, L.; Kløve, B. Complex dynamics of water quality mixing in a warm mono-mictic reservoir. Sci. Total Environ. 2021, 777, 146097. [Google Scholar]
  6. Karr, J.R. Assessment of biotic integrity using fish communities. Fisheries 1981, 6, 21–27. [Google Scholar]
  7. Liao, J.; Huang, Y. Research progress on using index of biological integrity to assess aquatic ecosystem health. Chin. J. Appl. Ecol. 2013, 24, 295–302. [Google Scholar]
  8. Wu, N.; Schmalz, B.; Fohrer, N. Development and testing of a phytoplankton index of biotic integrity (P-IBI) for a German lowland river. Ecol. Indic. 2012, 13, 158–167. [Google Scholar]
  9. Maxted, J.R.; Barbour, M.T.; Gerritsen, J.; Poretti, V.; Primrose, N.; Silvia, A.; Penrose, D.; Renfrow, R. Assessment framework for mid-Atlantic coastal plain streams using benthic macroinvertebrates. J. N. Am. Benthol. Soci. 2000, 19, 128–144. [Google Scholar]
  10. Arman, N.Z.; Salmiati, S.; Said, M.I.M.; Aris, A. Development of macroinvertebrate-based multimetric index and establishment of biocriteria for river health assessment in Malaysia. Ecol. Indic. 2019, 104, 449–458. [Google Scholar]
  11. Carpenter, K.E.; Johnson, J.M.; Buchanan, C. An index of biotic integrity based on the summer polyhaline zooplankton community of the Chesapeake Bay. Mar. Environ. Res. 2006, 62, 165–180. [Google Scholar] [CrossRef]
  12. Yin, X.; Xu, Z.; Yan, N.; Wu, W.; Song, J. Community structure and biological integrity of fluvial algae in Weihe River Basin. Acta Sci. Circum. 2013, 33, 518–527. [Google Scholar]
  13. Padisák, J.; Borics, G.; Grigorszky, I.; Soróczki-Pintér, É. Use of phytoplankton assemblages for monitoring ecological status of lakes within the water framework directive: The assemblage index. Hydrobiologia 2006, 553, 1–14. [Google Scholar] [CrossRef]
  14. Huang, Y.; Li, Y.; Ji, D.; Nwankwegu, A.S.; Lai, Q.; Yang, Z.; Wang, K.; Wei, J.; Norgbey, E. Study on nutrient limitation of phytoplankton growth in Xiangxi Bay of the Three Gorges Reservoir, China. Sci. Total Environ. 2020, 723, 138062. [Google Scholar] [CrossRef] [PubMed]
  15. Al-Janabi, Z.Z.; Al-Obaidy, A.M.J.; Abdul-Rahman-Al-Kubaisi. Use of Phytoplankton Index of Biological Integrity (P-IBI) as a tool to evaluate Tigris RiverHealth. Mesop. Environ. J. 2016, A, 62–68. [Google Scholar]
  16. Lacouture, R.V.; Johnson, J.M.; Buchanan, C.; Marshall, H.G. Phytoplankton index of biotic integrity for Chesapeake Bay and its tidal tributaries. Estuar. Coast. 2006, 29, 598–616. [Google Scholar] [CrossRef]
  17. Zhu, H.; Hu, X.; Wu, P.; Chen, W.; Wu, S.; Li, Z.; Zhu, L.; Xi, Y.; Huang, R. Development and testing of the phytoplankton biological integrity index (P-IBI) in dry and wet seasons for Lake Gehu. Ecol. Indic. 2021, 129, 107882. [Google Scholar] [CrossRef]
  18. Ma, B.; Wu, C.; Ding, F.; Zhou, Z. Predicting basin water quality using source-sink landscape distribution metrics in the Danjiangkou Reservoir of China. Ecol. Indic. 2021, 127, 107697. [Google Scholar] [CrossRef]
  19. Duan, W.; Zhu, G.; Liu, J.; Yang, W.; Shi, P.; Xu, H.; Zhu, M. An evaluation method for ecological security of water resource reservoirs. China Environ. Sci. 2020, 40, 4135–4145. [Google Scholar]
  20. Li, Y.; Yang, N.; Qian, B.; Yang, Z.; Liu, D.; Niu, L.; Zhang, W. Development of a bacteria-based index of biotic integrity (Ba-IBI) for assessing ecological health of the Three Gorges Reservoir in different operation periods. Sci. Total Environ. 2018, 640–641, 255–263. [Google Scholar] [CrossRef]
  21. Guo, S.; Wang, X.; Han, P.; Zheng, B.; Jiang, Y.; Guo, K.; Han, X.; Li, B.; Gao, X.; Li, Y. Spatiotemporal characteristics of layered chlorophyll-a concentration and influencing factors in Danjiangkou Reservoir. J. Lake Sci. 2021, 33, 366–376. [Google Scholar]
  22. Pang, F.; Du, R.; Sun, R.; Yin, X.; Chen, Z.; Gao, W.; Huang, H. Comprehensive analysis technology of multi-index monitoring on spatial heterogeneity of water quality of Danjiangkou reservoir and its effects. Chin. J. Environ. Eng. 2022, 16, 2783–2795. [Google Scholar]
  23. Li, Y.; Gao, W.; Li, J.; Wen, Z.; Liu, H.; Hu, L.; Zhang, N.; Cheng, X. Spatial and temporal distribution of phytoplankton in the water source of the middle route of the South-to-North Water Diversion Project. Chin. J. Ecol. 2008, 27, 14–22. [Google Scholar]
  24. Tan, X.; Xia, X.; Cheng, X.; Zhang, Q. Temporal and spatial pattern of phytoplankton community and its biodiversity indices in the Danjiangkou Reservoir. Environ. Sci. 2011, 32, 2875–2882. [Google Scholar]
  25. Zhao, Z.; Wang, J.; Zhang, Y.; Jing, Z.; Hou, Y.; Sun, W.; Wang, X. Phytoplankton community structure and biodiversity in the water source area along the middle route of South-to-North Water Transfer Project. S.-N. Water Transf. Water Sci. 2022, 20, 914–924. [Google Scholar]
  26. State Environmental Protection Administration. Environmental Quality Standards for Surface Water. 2002. Available online: https://english.mee.gov.cn/Resources/standards/water_environment/quality_standard/200710/t20071024_111792.shtml (accessed on 14 January 2023).
  27. Qian, K.; Liu, X.; Chen, Y. A review on methods of cell enumeration and quantification of freshwater phytoplankton. J. Lake Sci. 2015, 27, 767–775. [Google Scholar]
  28. Hu, H.; Wei, Y. The Freshwater Algae of China: Systematics, Taxonomy and Ecology; Science Press: Beijing, China, 2006. [Google Scholar]
  29. Hydrological Bureau of the Ministry of Water Resources; Yangtze River Basin Water Environment Testing Center. Map of Common Algae in Chinese Inland Waters; Changjiang Press: Wuhan, China, 2012.
  30. GB11893-89; Water Quality—Determination of Total Phosphorus. Ammonium Molybdate Spectrophotometric Method. Quality Inspection Press: Beijing, China, 1989.
  31. HJ 636-2012; Water Quality—Determination of Total Nitrogen. Alkaline Potassium Persulfate Digestion UV Spectrophotometric Method. Environmental Science Press: Beijing, China, 2012.
  32. HJ 535-2009; Water Quality—Determination of Ammonia Nitrogen. Nessler’s Reagent Spectrophotometry. Environmental Science Press: Beijing, China, 2009.
  33. State Environmental Protection Administration. Monitoring and Analysis Methods of Water Waste Water, 4th ed.; Environmental Science Press: Beijing, China, 2002. [Google Scholar]
  34. GB 11892-89; Water Quality—Determination of Permanganate Index. Standards Press: Beijing, China, 1990.
  35. HJ 828-2017; Water quality—Determination of the Chemical Oxygen Demand. Dichromate Method. Environmental Science Press: Beijing, China, 2017.
  36. HJ 897-2017; Water quality—Determination of Chlorophyll a. Spectrophotometric Method. Environmental Science Press: Beijing, China, 2018.
  37. HJ 501-2009; Determination of Total Organic Carbon.Combustion Oxidation Nondispersive Infrared Absorption Method. Environmental Science Press: Beijing, China, 2009.
  38. Xing, B.; Xu, J.; Cao, Y.; Deng, G.; Pang, W.; Wang, Q. Phytoplankton community structure and ecological evaluation in summer, Lake Changhai of Jiuzhaigou National Nature Reserve. J. Lake Sci. 2020, 32, 1088–1099. [Google Scholar]
  39. Wang, X.; Sun, M.; Wang, J.; Yang, L.; Luo, L.; Li, P.; Kong, F. Microcystis Genotype Succession and Related Environmental Factors in Lake Taihu during Cyanobacterial Blooms. Environ. Microbiol. 2012, 64, 986–999. [Google Scholar] [CrossRef]
  40. Jin, X.; Tu, Q. Code for Investigation of Lake Eutrophication, 2nd ed.; China Environmental Science Press: Beijing, China, 1990. [Google Scholar]
  41. Wang, M.; Liu, X.; Zhang, J. Evaluate method and classification standard on lake eutrophication. Environ. Monit. China 2002, 18, 47–49, 1002–6002. [Google Scholar]
  42. Cai, K.; Qin, C.; Li, J.; Zhang, Y.; Niu, Z.; Li, X. Preliminary study on phytoplanktonic index of biotic integrity (P-IBI) assessment for lake ecosystem health: A case of Taihu Lake in Winter, 2012. Acta Ecol. Sin. 2016, 36, 1431–1441. [Google Scholar]
  43. Wang, X.; Guo, K.; Li, X.; Pang, W.; You, Q.; Wang, Q. Construction of phytoplanktonic index of biotic integrity and evaluation of water ecological health in Dianshan Lake, China. J. Shanghai Normal Univ. 2021, 50, 39–49. [Google Scholar]
  44. Lin, L.; Wang, F.; Chen, H.; Fang, H.; Zhang, T.; Cao, W. Ecological health assessments of rivers with multiple dams based on the biological integrity of phytoplankton: A case study of North Creek of Jiulong River. Ecol. Indic. 2021, 121, 106998. [Google Scholar] [CrossRef]
  45. Zhang, Y.; Ban, X.; Li, E.; Wang, Z.; Xiao, F. Evaluating ecological health in the middle-lower reaches of the Hanjiang River with cascade reservoirs using the Planktonic index of biotic integrity (P-IBI). Ecol. Indic. 2020, 114, 106282. [Google Scholar] [CrossRef]
  46. Huang, H.; Zhou, L.; Chen, J.; Wei, T. Ggcor: Extended Tools for Correlation Analysis and Visualization. 2020. Available online: https://rdrr.io/github/houyunhuang/ggcor/src/R/cor-tbl.R (accessed on 14 January 2023).
  47. Wickham, H. Ggplot2: Elegant Graphics for Data Analysis; Springer: New York, NY, USA, 2016. [Google Scholar]
  48. Oksanen, J.; Blanchet, F.G.; Kindt, R.; Legendre, P.; Minchin, P.R.; O’Hara, R.B.; Simpson, G.L.; Solymos, P.; Stevens, M.H.H.; Wagner, H. Vegan: Community Ecology Package. 2020. Available online: https://CRAN.R-project.org/package=vegan (accessed on 14 January 2023).
  49. Staehr, P.A.; Sand-Jensen, K. Seasonal changes in temperature and nutrient control of photosynthesis, respiration and growth of natural phytoplankton communities. Freshw. Biol. 2006, 51, 249–262. [Google Scholar] [CrossRef]
  50. Jia, H.; Xu, J.; Lei, J. Study on the relationship between phytoplankton community and environmental factors in Danjiangkou Reservoir Bay. Yangtze River 2019, 50, 52–58. [Google Scholar]
  51. Rao, K.; Zhang, X.; Yi, X.; Li, Z.; Wang, P.; Huang, G.; Guo, X. Interactive effects of environmental factors on phytoplankton communities and benthic nutrient interactions in a shallow lake and adjoining rivers in China. Sci. Total Environ. 2018, 619–620, 1661–1672. [Google Scholar] [CrossRef]
  52. Wang, Y.; Chen, L.; Niu, Y.; Yu, H.; Luo, M. Spatio-temporal variation in phytoplankton community and its influencing factors in Danjiangkou Reservoir. J. Lake Sci. 2016, 28, 1057–1065. [Google Scholar]
  53. Sommer, U.; Gliwicz, Z.M.; Lampert, W.; Duncan, A. The PEG-model of seasonal succession of planktonic events in fresh waters. Arch. Für Hydrobiol. 1986, 106, 433–471. [Google Scholar] [CrossRef]
  54. Shen, H.; Xu, Y.; Wang, L.; Zhang, M.; Kong, L.; Cai, Q. Spatial and temporal variations of phytoplankton in Danjiangkou Reservoir and its affecting factors. Plant Sci. 2011, 29, 683–690. [Google Scholar]
  55. Zheng, B.; Chen, Z.; Li, Y.; Fohrer, N.; Zhang, Y.; Wu, D.; Yan, X.; Li, B. Structural characteristics and driving factors of the planktonic eukaryotic community in the Danjiangkou Reservoir, China. Water 2020, 12, 3499. [Google Scholar] [CrossRef]
  56. Kane, D.D.; Gordon, S.I.; Munawar, M.; Charlton, M.N.; Culver, D.A. The Planktonic Index of Biotic Integrity (P-IBI): An approach for assessing lake ecosystem health. Ecol. Indic. 2009, 9, 1234–1247. [Google Scholar] [CrossRef]
  57. Maulood, B.K.; Alobaidy, A.H.M.J.; Alsaboonchi, A.; Abid, H.S.; Alobaidy, G.S. Phytoplankton Index of Biological Integrity (P-IBI) in Several Marshes, Southern IRAQ. J. Environ. Protect. 2011, 2, 387–394. [Google Scholar] [CrossRef] [Green Version]
  58. Yan, X.; Zhang, Y.; Li, Y.; Jiang, Y.; Cui, Z.; Gao, X.; Wu, N.; Nicola, F.; Han, X. Hydrologic and physicochemical factors co-drive seasonal changes of phytoplankton during dynamic water diversion processes in the Danjiangkou Reservoir. J. Lake Sci. 2021, 33, 1350–1363. [Google Scholar]
  59. Xiong, M.; Li, Q.; Chen, Q.; He, Y.; Ma, X.; Han, M.; Tang, C.; Zhang, H. Evaluation of water ecosystem health of Baihua Reservoir in Guizhou based on GIS and P-IBI. Chin. J. Ecol. 2019, 38, 3093–3101. [Google Scholar]
  60. Hu, J.; Shen, Q.; Chen, M.; Chi, S.; Hu, J. Phytoplankton index of biotic integrity based on factor analysis for water source assessment. Acta Ecol. Sin. 2019, 39, 3759–3769. [Google Scholar]
  61. Zhu, D. Comprehensive evaluation of health status of Danjiangkou Reservoir. In Proceedings of the 2018 Academic Annual Conference of Chinese Hydraulic Society, Nanchang, China, 25–27 May 2018. [Google Scholar]
  62. Zhang, X.; Xiong, J.; Cheng, J.; Yao, Z.; Chen, Y. Application of fuzzy mathematics for evaluation of eutrophication in Danjiangkou Reservoir. Environ. Monit. China 2017, 33, 99–105. [Google Scholar]
  63. Wan, Y.; Zhang, L.; Fu, X.; Jin, H. Analysis and evaluation of nutrient degree and eutrophication prevention in Danjiangkou Reservoir. J. Beijing Normal Univ. 2020, 56, 275–281. [Google Scholar]
  64. Zhao, K.; Yang, W.; Sha, J.; Shang, Y.; Li, X. Spatial characteristics of nutrient status in Danjiangkou Reservoir. Environ. Sci. Technol. 2020, 43, 51–58. [Google Scholar]
  65. Wu, Z.; Kong, M.; Cai, Y.; Wang, X.; Li, K. Index of biotic integrity based on phytoplankton and water quality index: Do they have a similar pattern on water quality assessment? A study of rivers in Lake Taihu Basin, China. Sci. Total Environ. 2019, 658, 395–404. [Google Scholar] [CrossRef]
  66. Pomari, J.; Kane, D.D.; Ferreira, R.A.R.; Nogueira, M.G. A new tool to assess ecosystem health in large subtropical reservoirs: Development and validation of a Planktonic Index of Biotic Integrity. Aquat. Ecosyst. Health 2021, 22, 15–29. [Google Scholar] [CrossRef]
  67. Wu, Z.; Wang, X.; Chen, Y.; Cai, Y.; Deng, J. Assessing river water quality using water quality index in Lake Taihu Basin, China. Sci. Total Environ. 2018, 612, 914–922. [Google Scholar] [CrossRef] [PubMed]
  68. Zhu, W.; Wan, L.; Zhao, L. Interspecific competition patterns of algae under different temperature and nutrient mass concentration conditions. Ecol. Environ. 2008, 17, 6–11. [Google Scholar]
  69. You, X.; Wang, Z.; Shi, X.; Zhu, M. Advances in phytoplankton interspecific competition research. Trans. Oceanol. Limnol. 2007, 114, 161–166. [Google Scholar]
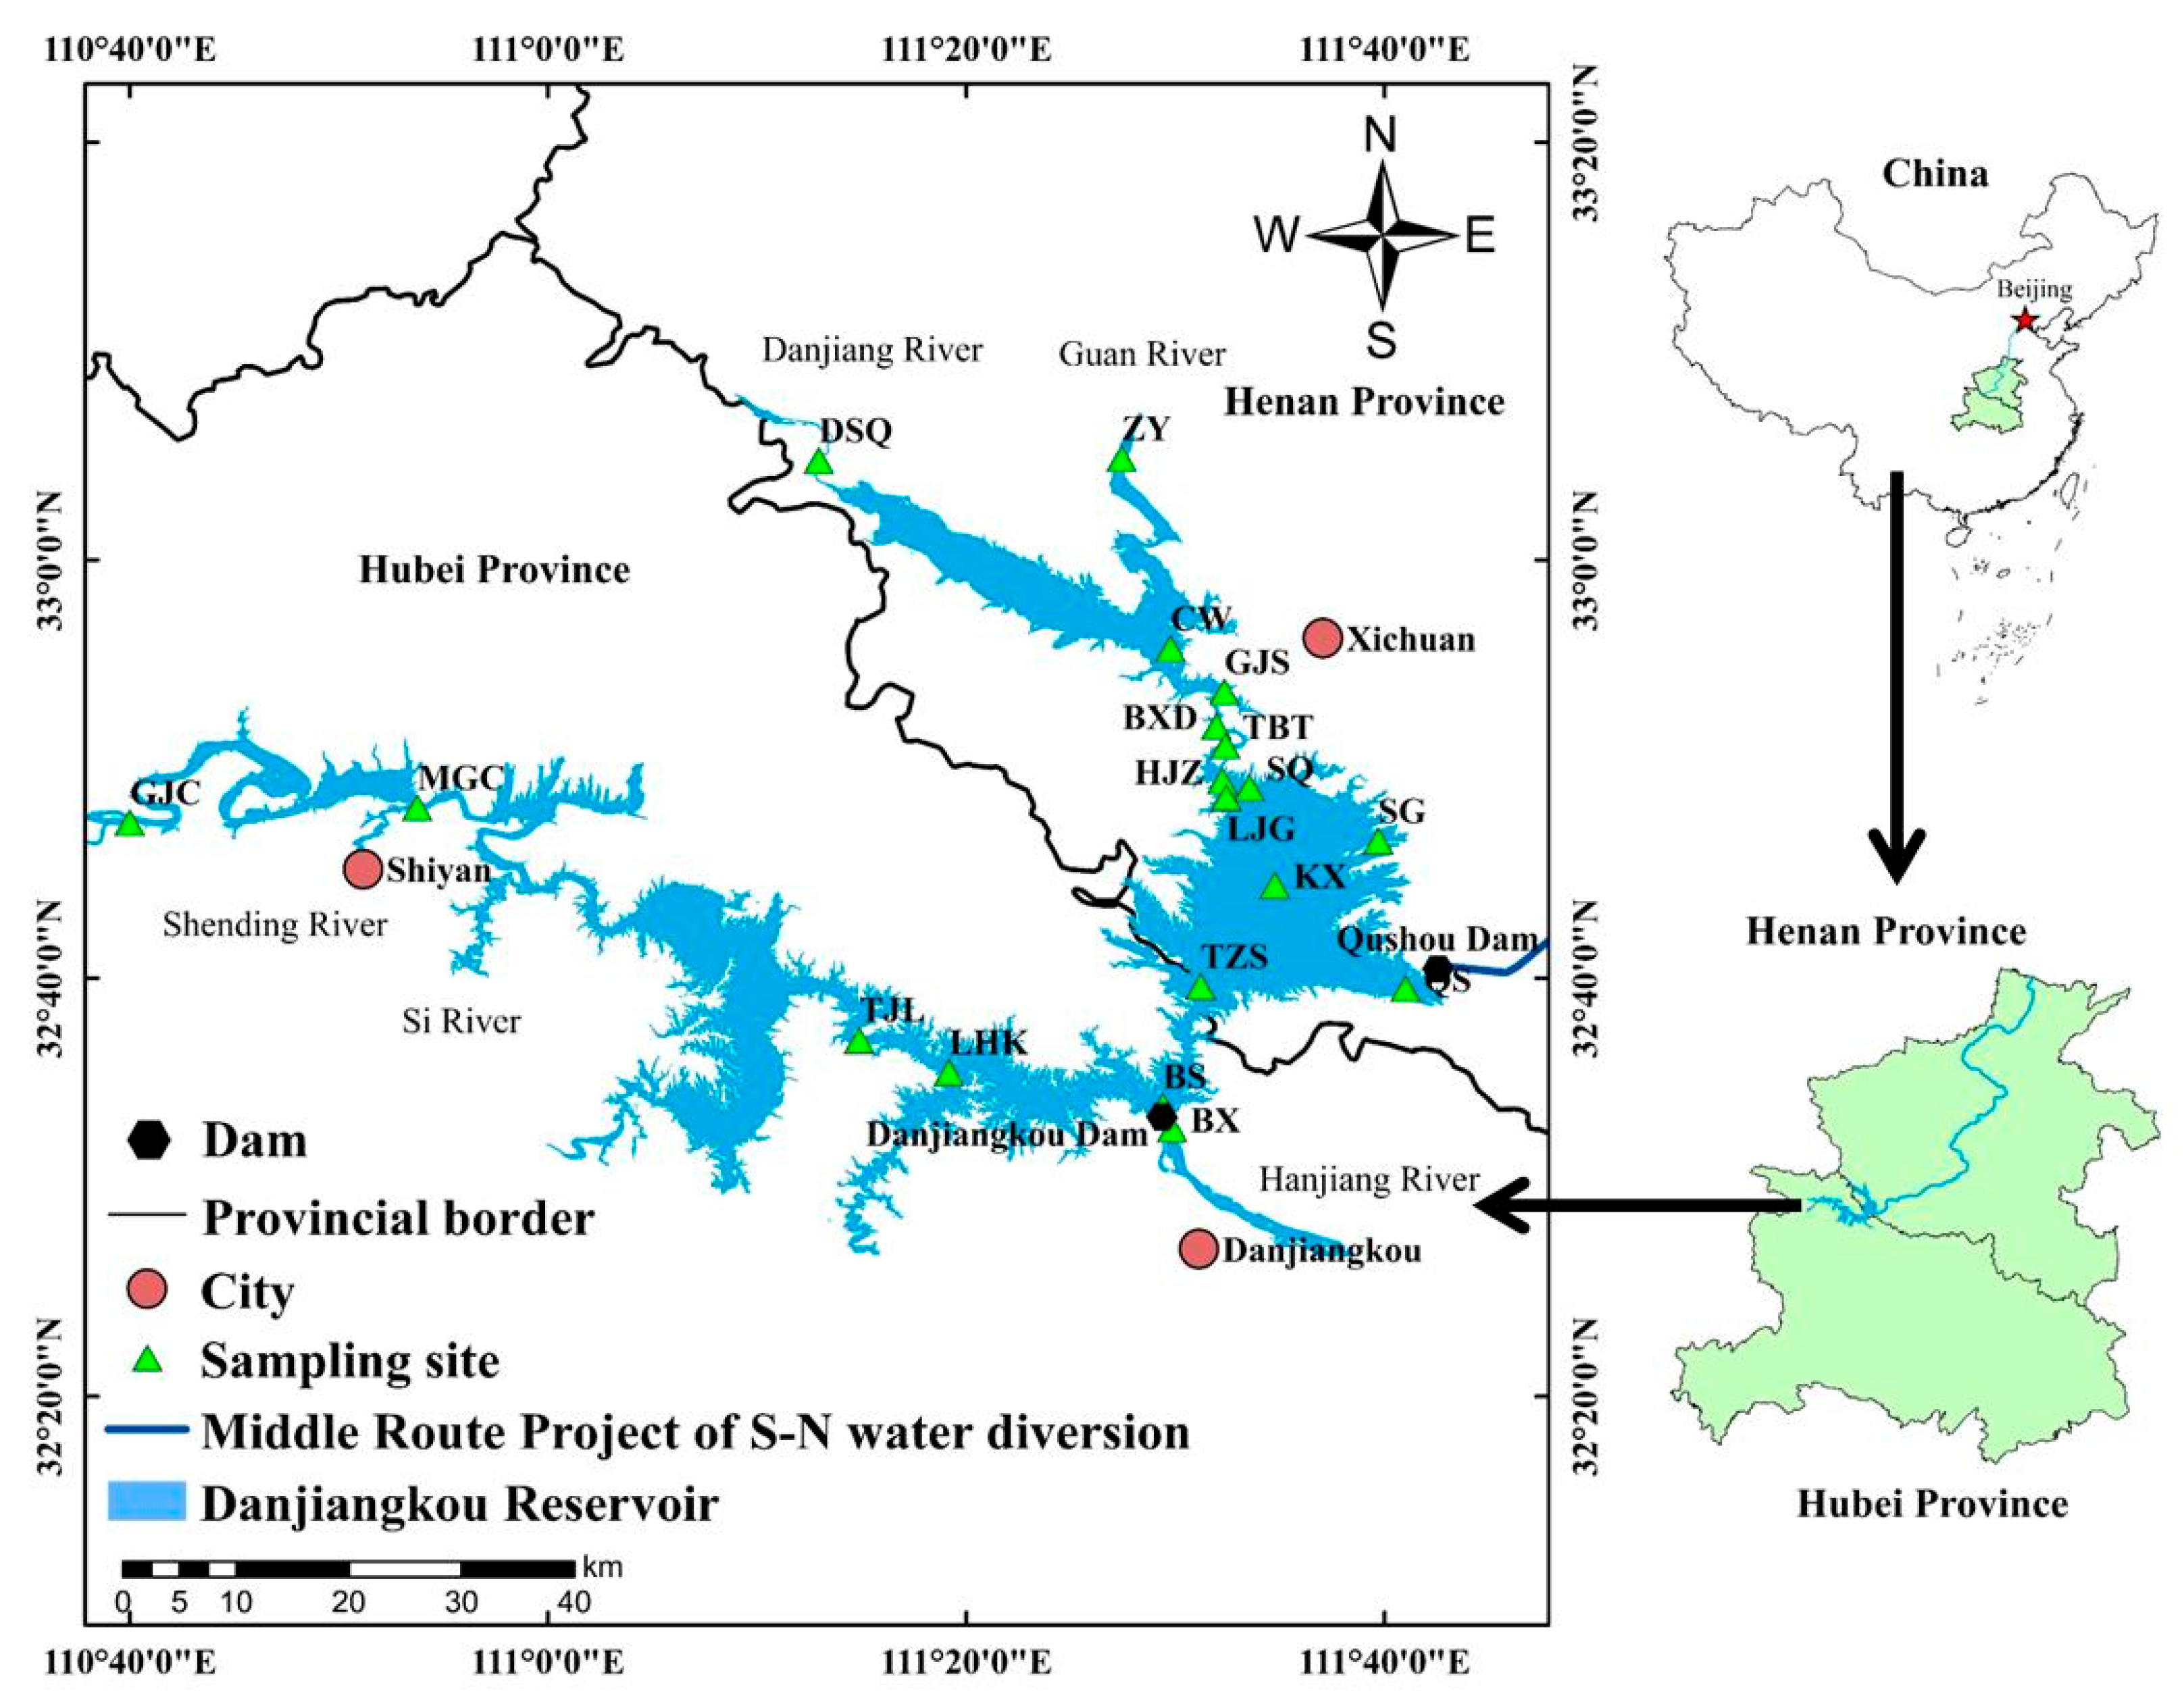
Figure 1. Distribution of sampling sites in Danjiangkou Reservoir.
Sustainability 15 05282 g001
Figure 2. Species composition and cell density of phytoplankton in Danjiangkou Reservoir. (a) Phytoplankton species composition and (b) cell density of phytoplankton.
Sustainability 15 05282 g002
Figure 3. Pearson correlation analysis among candidate biological indicators in four seasons. (a) Spring. (b) Summer. (c) Fall. (d) Winter.
Sustainability 15 05282 g003
Figure 4. Spatial and temporal variation of P-IBI in Danjiangkou Reservoir. Note: ns indicates p > 0.05, * indicates p < 0.05. (a) Seasonal variation of P-IBI. (b) Interannual variation of P-IBI. (c) Temporal variation of P-IBI. (d) Spatial variation of P-IBI.
Sustainability 15 05282 g004
Figure 5. Linear regression analysis of P-IBI and TLI in Danjiangkou Reservoir. (a) Linear regression of seasonal mean of P-IBI and TLI and (b) the linear regression of P-IBI and TLI in spring.
Sustainability 15 05282 g005
Figure 6. Redundancy analysis of between environmental parameters, the component metrics, and P-IBI scores. (a) Spring. (b) Summer. (c)Autumn. (d) Winter.
Sustainability 15 05282 g006
Table 1. Physical and chemical factors of Danjiangkou Reservoir in different seasons.
ParametersSpringSummerAutumnWinter
WT (°C)22.19 ± 2.57 b28.69 ± 2.65 a21.79 ± 1.58 b11.23 ± 1.95 c
pH8.92 ± 0.26 a8.64 ± 0.35 b8.40 ± 0.16 c8.51 ± 0.14 b
DO (mg/L)9.04 ± 1.90 b9.43 ± 0.91 b7.41 ± 0.58 c11.00 ± 1.30 a
Cond (μS/cm)293.52 ± 66.08 a257.57 ± 76.33 a180.30 ± 79.02 bc219.31 ± 47.32 c
ORP (mV)110.80 ± 20.43 c165.51 ± 35.09 b206.71 ± 44.13 a149.3 8 ± 53.40 b
NO3-N (mg/L)0.91 ± 0.431.03 ± 0.500.90 ± 0.390.95 ± 0.61
NH4+-N (mg/L)0.28 ± 0.08 a0.27 ± 0.06 a0.11 ± 0.05 b0.08 ± 0.03 b
TN (mg/L)1.62 ± 0.871.80 ± 0.741.43 ± 0.571.41 ± 1.11
TP (mg/L)0.02 ± 0.01 b0.04 ± 0.01 a0.02 ± 0.01 b0.02 ± 0.01 b
CODMn (mg/L)2.24 ± 0.41 b2.69 ± 0.78 a2.81 ± 0.88 a2.18 ± 0.59 b
TOC (mg/L)2.86 ± 0.61 a2.89 ± 0.72 a3.16 ± 0.83 a2.16 ± 1.41 b
SD (m)3.12 ± 1.572.86 ± 1.663.38 ± 1.602.60 ± 1.51
COD (mg/L)9.81 ± 2.70 a10.44 ± 2.40 a5.32 ± 2.21 b5.43 ± 2.39 b
Note: Values are the arithmetic mean ± standard deviation of the sample. Different lowercase letters are represented for p < 0.05; a significant difference was achieved at 0.05 level.
Table 2. Candidate parameters and corresponding scores.
SeasonSelected Multi-MetricsAssigned Scores
54321
springM3>16.314–16.311.5–148.25–11.5<8.25
M4>19.616–19.68.0–165.25–8<5.25
M14<0.290.29–0.510.51–0.670.67–1.11>1.11
M21>2.472.26–2.472.08–2.271.73–2.08<1.73
M23>2.842.56–2.842.07–2.561.88–2.07<1.88
M26<3.253.25–55.0–6.06–7.30>7.3
summerM1>3633–3628–3324.25–28<24.25
M4>16.35.0–7.07–10.7510.75–16.3<5
M8<7.967.96–43.143.1–87.5887.58–190.04>190.04
M14<0.240.24–0.480.48–0.840.84–1.34>1.34
autumnM14<0.540.27–0.540.16–0.270.11–0.16>3.00
M17<0.040.07–0.040.04–0.100.10–0.14>0.14
M21>2.702.52–2.702.27–2.521.92–2.27>1.92
M23>3.312.44–3.311.98–2.441.3–1.98>1.3
winterM14<0.050.05–0.090.09–0.141.15–0.14>1.15
M17<0.040.04–0.070.07–0.110.11–0.31>0.31
M20<0.560.56–0.770.77–0.920.92–0.97>0.97
M21>2.362.17–2.361.91–2.171.19–1.91<1.19
M24<0.440.44–0.540.54–0.660.66–0.83>0.83
Disclaimer/Publisher’s Note: The statements, opinions and data contained in all publications are solely those of the individual author(s) and contributor(s) and not of MDPI and/or the editor(s). MDPI and/or the editor(s) disclaim responsibility for any injury to people or property resulting from any ideas, methods, instructions or products referred to in the content.