Abstract
The optimization of the sampling scheme is particularly important in order to achieve sustainability in quality management. This paper discusses the problem of optimizing the design of metrological sampling scheme when the mean is a random variable. Assuming that the prior distribution of product means is known, a Bayesian posterior probability is calculated by using the likelihood function with decision variables to measure the sampling risk, and the expected cost of the sampling scheme is calculated based on the protection of producer and user risk in combination with the Taguchi quality loss function. The influence of model parameters on the selection of the optimal sampling scheme is investigated through sensitivity analysis. The model constructed in this paper solves the problem of sampling design in the case of food processing enterprises, quantifies the quality loss of products in the sampling process, facilitates sustainable quality management of enterprises, and has important theoretical significance and application value for sustainable business management of food processing enterprises.
1. Introduction
In quality management, the traditional sampling and testing method has led many food processing enterprises to neglect sampling risk, resulting in product quality loss during sampling and testing, and inspection omissions and deviation problems in quality management such as excessive pesticide residues and excessive additives. For example, according to the New York Post, Fresh Ideation Food Group LLC was forced to urgently recall its products after the FDA detected Listeria monocytogenes in environmental samples of more than 400 of its products as a result of inspection oversight problems caused by traditional sampling methods [1]; according to Slash Gear, ready-to-eat ham products manufactured by Olymel in Quebec, Canada, were tested and found positive for Salmonella enteritidis by the Food Safety and Inspection Service (FSIS) of the US Department of Agriculture due to oversight in sampling methods [2]; the outbreak of salmonella in peanut butter in the U.S. and Canada, which resulted in hundreds of infections and nine deaths, was also caused by companies using traditional sampling and testing methods that led to omissions and discrepancies in testing [3]; Chinese milk powder companies used traditional sampling and testing methods resulting in discrepancies in corporate testing, and causing their milk powder products, as detected by the Food and Drug Administration, to have excessive melamine; similarly, an Irish company’s pork products were found by the Food and Drug Administration to contain dioxin bacteria due to missed tests resulting from the use of traditional sampling and testing methods. These inspection omissions and deviations had a serious impact on the sustainable business management of food processing enterprises, resulting in serious economic loss and loss of goodwill.
The traditional sampling and inspection methods cause unsustainable quality management of food processing enterprises due to the neglect of sampling risk and quality loss, which in turn lead to a series of serious consequences such as consuming more resources, generating more pollution, and causing greater loss. The concept and method of sustainable quality management provide a new way to solve the above problems. Sustainable quality management requires that resource efficiency, environmental impact, quality safety, and quality cost be taken into account to improve the overall effectiveness of quality management in the whole process of quality management. Therefore, sustainable quality management should fully consider the characteristics of material saving, low energy consumption, ecology, durability, multi-functionality, renewability, natural renewability, and anti-luxury. Under the concept of sustainable quality management, constructing a set of efficient and sustainable sampling schemes to solve the problems of additive exceedance testing omissions and deviations in quality management, as well as reducing quality loss in the sampling process is a major quality management problem that food processing enterprises need to solve urgently at present.
Therefore, this paper intends to construct a sampling and testing optimization model based on sampling risk constraint and quality loss minimization, and to conduct comparative numerical analysis and sensitivity analysis with the cases of pesticide residue and additive sampling tests in food processing enterprises. On this basis, an efficient and sustainable improved metrological sampling scheme is constructed to reduce quality loss and potential risk and achieve sustainable management of food processing enterprises.
In the following sections, the corresponding literature review is first conducted in Section 2; the modelling notations and assumptions for sampling plan design are defined in the beginning of Section 3; then, target cost in the sampling process and optimal sampling plan design are formulated and analyzed in Section 3, including prior estimation of product means and risk in the sampling process (Section 3.1), design of the sampling plan (Section 3.2), cost minimization objectives in the sampling process (Section 3.3), and algorithm design for optimal sampling scheme (Section 3.4); the numerical and sensitivity analyses for the sampling scheme design model are implemented and discussed in Section 4; and the research contributions and foresights from this study are summarized and concluded in Section 5.
2. Literature Review
Acceptance sampling schemes are widely used in product quality control to determine the acceptability of batches and to obtain quality information about batches. The optimal design of acceptance sampling usually minimizes the expected cost and provides the required risk protection for both producers and the users. The optimal design of acceptance sampling schemes has been extensively studied; Khan and Aslam et al. [4] discussed the fuzzy acceptance sampling scheme based on the first transmuted Weibull distribution in the presence of imprecise product quality. Wu et al. [5] discussed a variables stage-independent multiple sampling plan and integrated it with the most widely-used process capability index C pk. Lee and Wu et al. [6] considered a product lifetime with a gamma distribution and developed two acceptance sampling plans. Kamesh et al. [7] discussed a sampling method with mixed exponential means of samples. Fernández [8] studied a count-based sampling test for the number of defects obeying a binomial distribution to determine the sample size of the optimal sampling scheme. Hussain and Aslam et al. [9] proposed a ranked set sampling scheme based on exponential distribution. Atefe et al. [10] discussed the optimal sampling scheme for products obeying standard normal distribution. Sharma et al. [11] studied the design of a sampling scheme for batch products obeying log-normal distribution. Fernández et al. [8] studied the sampling design based on defect counts obeying binomial distribution. Alisson et al. [12] studied the sampling scheme for products obeying negative binomial distribution. The above studies assume that the distribution of product quality characteristics is known, however, in the process of batch product delivery, the prior probability of product quality characteristics is often not completely clear to the users as a trade secret. Sometimes the parameters of the product quality characteristics distribution need to be estimated as random variables.
During the quality inspection process, the quality characteristics of product batches fluctuate, resulting in quality loss. Therefore, the quality loss function needs to be utilized in the design of the optimization scheme to measure the impact of quality fluctuations on the producer and user. A suitable quality loss function can model the fluctuation of product quality characteristics better during sampling and express the impact of quality loss on users better. The quality loss function we use here is the Taguchi quality loss function [13] for the hope-small characteristic, because the quality loss is caused by fluctuations in the function of the product. The smaller the fluctuations, the smaller the loss. Francisco et al. [14] investigated a standardized sampling scheme using linear regression analysis to determine the quality loss function. Fernández [15] discussed that the quality loss function was polynomial in the case of batch products. Allen et al. [16] discussed the optimization of a sampling scheme for products with a quantile function of the quality loss function under the assumption that the quality characteristics obey a normal distribution. Hsieh et al. [17] proposed the design of a sampling scheme under a linear quality loss function. Yasar et al. [18] proposed a sampling scheme under hazard rate function-based quality loss. Sajnóg et al. [19] discussed a metric-based scheme procedure for clinical imaging samples. Based on the literature discussion, most of the literature use the Taguchi quality loss function to estimate the quality loss in the sampling process, but few combine with the Taguchi loss function to estimate the cost in the past studies. This paper uses cost minimization as the optimal goal combined with the Taguchi loss function to design the sampling scheme.
As an important part of sustainable quality management, the design of sampling programs is particularly critical. Quality management is closely linked with sustainability issues, and this link is made through product quality. Currently, sustainable quality management mainly addresses issues such as material and energy consumption through Lean 6 Sigma. Shohreh et al. [20] chose a system dynamics and fuzzy TOPSIS approach to improve sustainable management of passenger rail transport organization. Wadghane et al. [21] used MIS, GIS, and IT to improve farmers’ sustainability management of a sugarcane growing ecosystem. Albert et al. [22] assessed sustainability management in NGOs with the help of a maturity model. Shri [23] improved sustainability quality management in enterprises by creating better value stream target conditions to improve efficiency and reduce costs. Sepahvand et al. [24] investigated strategies for sustainable management of groundwater resources in Romeshkan plain using the fuzzy Delphi technique. Based on the literature discussion, most of the methods regarding quality management are improved on the basis of the traditional sampling scheme design. In order to improve the sustainability management capability of enterprises in the sense of understanding sustainability, a new sampling scheme design needs to be introduced so that enterprises can optimize product quality and enhance the core competitiveness.
Based on the above discussion, the existing literature does not fully consider the following key issues of sampling scheme design: (1) controlling the impact of risk and quality loss in the sampling process; (2) specifying the goal of cost minimization in the sampling process; (3) estimating the likelihood function of the mean of product quality characteristics in the sampling process (i.e., the case where the product mean is a random variable); and (4) applying the improved method to metrological data. Thus, this paper aims to construct an optimization model for sampling tests with sampling risk constraint and quality loss minimization, and to design an optimal sampling scheme design to improve the sustainability of enterprise quality management.
To address the above issues, the innovations of this paper can be summarized as follows: (1) proposing an optimal design for a sampling scheme based on sampling risk constraint and quality loss minimization and applying the improved method to metrological data; (2) effectively controlling the impact of risk and quality loss in the sampling process on the optimal design; (3) quantifying the sampling cost in the sampling process by the improved quality loss function, and being able to find the minimum cost and the corresponding optimal sampling scheme through the traversal method.
3. Model Formulations and Solutions
3.1. Prior Distribution and Sampling Risk
In industrial practice, product quality characteristics are usually assumed to obey a normal distribution with known constants for both the mean and variance. Lam et al. [25] study the problem of designing sampling schemes for a sequence of normally distributed variables, and Liu [26] discusses the sampling test for sample means obeying a normal distribution at stage k. However, the mean of product quality characteristics is often unknown in some cases, causing it to be assigned a random variable due to customer requirements for quality characteristics or processing. In actual production, the prior distribution of the mean values of the quality characteristics can be inferred based on the sampling data and information of the past product quality characteristics. In this paper, the normal distribution is used to describe prior information about quality characteristics.
Assume that in the production process, the product quality characteristics obey a normal distribution with mean and variance . For the quality characteristic with upper specification limit , the pass rate of the batch product is
For the sampling test using the hope-small characteristic, the producer is mainly concerned with whether to accept the null hypothesis, , where is the acceptable upper bound of the mean, while the user focuses on the alternative hypothesis, , where . When , the batch should be accepted, and when , the batch should be rejected. Traditional methods assume that the mean value is a fixed constant, but in actual production, the mean value of quality characteristics is sometimes not a fixed constant but a random variable due to the influence of many factors. If the sampling plan is designed according to the traditional method, it may cause a greater risk of misjudgment and bring greater loss to the producer or user. For this reason, a more scientific and reasonable sampling scheme needs to be designed.
The information of the mean is contained in the sample mean when a sample of capacity is randomly selected from the batch of products. Assuming that the standard deviation of the quality characteristics is a known constant, the likelihood function can be constructed when estimating the mean value using the sample information.
The purpose of batch sampling acceptance sampling is to distinguish between satisfactory and unsatisfactory batches correctly. Based on the sample observations, the null hypothesis is rejected when is sufficiently large. For sampling tests with upper specification limits, the lot will be accepted when . The inspection scheme can be described by the sample size and . A sampling acceptance scheme can be outlined as follows: (i) samples are randomly selected from the submitted batch; (ii) the observed value of the sample mean is calculated; (iii) is less than or equal to , the inspection lot is accepted; otherwise, the inspection lot is rejected.
Using to denote the probability that the batch is accepted, the information of can be described by the distribution of the sampling scheme and the sample mean when the mean is unknown, where obeys a normal distribution with mean and variance .
Therefore, the likelihood function can be expressed as , i.e.,
The optimal design of traditional batch sampling schemes usually assumes that the mean value of quality characteristics is constant. In actual production, the mean value of quality characteristics is often a random variable due to factors such as equipment deterioration, raw material quality fluctuations, and stress variations. Therefore, it is more appropriate to use the prior distribution information of the mean value of quality characteristics. In this paper, the mean value of product quality characteristics is regarded as a random variable, denoted as , and its prior probability density function and cumulative distribution function are denoted as and , respectively. Further, if the mean values of the quality characteristics obey the truncated normal distribution, i.e., , its probability density function is
Since the sampling scheme is to provide the necessary risk protection for both the producers and the users, posterior probabilities are used in order to integrate the sample information into the optimal design of the sampling scheme. For a given sampling scheme , the user risk can be defined as
The producer risk can be defined as
Among them are
3.2. Sampling Plan Design
In the actual sampling, producers and users need to determine in advance the mutually acceptable risk range. If a batch is rejected, the producer risk should be controlled within . On the contrary, if a batch is accepted, the risk of the users should be controlled within , then the optimal sampling scheme should satisfy the requirements and .
The feasible domain of the sampling scheme can be expressed as
where is the set of positive numbers and as a function of the sample size , is decreasing, while is increasing. Therefore, if the sampling scheme is feasible, for , we have
where and are the upper and lower specification limits of the sample size . As a function of , the side bounds and are nondecreasing because is nondecreasing and is nondecreasing.
The feasible domain can be further expressed as
When both and tend to infinity and tends to a fixed value , there exists and tends to zero, where . That is, both the producer and user risk are related to the sampling scheme and tend to zero, which indicates that the sampling feasible domain is nonempty.
3.3. Objective Function
The objective cost function is established to determine the optimal sampling plan, which is designed to minimize the total cost considering the sampling risk and quality loss. Assuming that is the sampling cost of a single product, denotes the cost of batch product rejection, and the quality loss function of the received batch product denotes the cost of batch product acceptance, the total cost consists of the cost caused by batch product acceptance, rejection, and sampling inspection. Considering the randomness of the mean value of the batch product, the mean of products can take any value from 0 to . The closer the mean is to zero, the better. Therefore, the cost of batch product acceptance is proportional to the quality loss function of the hope-small characteristics. Combined with the impact of lot on the total cost, can be expressed as
The cost of lot rejection is assumed to be , where is a positive constant. Therefore, under the condition that is known, the total cost corresponding to the sampling scheme can be expressed as
The optimal sampling scheme needs to minimize the total expected cost , so the objective function can be expressed as
where the expected cost of the sampling scheme can be expressed as
Thus, we can find the optimal sampling scheme by solving the following nonlinear programming problem
The constraint is
3.4. Optimal Sampling Scheme
In practice, it is difficult to find the optimal sampling scheme for the hope-small characteristic directly. However, the optimal sampling scheme can be better estimated by using algorithm optimization. Suppose that is a set of randomly selected samples from the distribution , then the following algorithm can be designed as shown in Algorithm 1 (usually considering the case where the variance is known).
Step 1. Select appropriate a priori parameters , based on the characteristics of product quality characteristics, and estimate the prior distribution of product mean by .
Step 2. Sample a set of estimates of a product lot from the truncated normal distribution and calculate the likelihood function of the sample means to estimate the probability of receiving a product lot.
Step 3. Give the target mean values of the product for the received and rejected batches, and , and the maximum allowable producer risk and user risk. Here it is required that and .
Step 4. Fixing sample size n, conduct random simulations of the producer and user risk in combination with constraints
Filter the range of values of the canonical limit under the specified sample size n, where the initial range of is .
Step 5. Select the quality loss function of the hope-small characteristic and the unit cost loss function with and . Obtain the variation of the expected cost with respect to the upper normative limit for given sample size.
Step 6. Repeat the operations of steps 4 and 5 and compare the expected cost with different sample sizes to select the minimum expected cost and the corresponding optimal sampling scheme . The solution of the optimal sampling scheme is introduced in an example below, and the effects of the model parameters on the total cost and decision variables are analyzed.
| Algorithm 1. Optimal sampling scheme solution |
| Input: Give the target mean values of and for the received and rejected batches, as well as the maximum allowable production-side risk and use-side risk . Select the appropriate a priori parameters and based on the characteristics of the product quality characteristics. is usually taken as 100. Sample a set of estimated samples of a product lot from a truncated-tailed normal distribution. |
| 1: for do |
| 2: for do |
| 3: if 4: Calculate the expected cost of the sampling scheme |
| 5: end if |
| 6: end for |
| 7: end for 8: Find the sampling scheme corresponding to minimum cost |
| Output: Optimal sampling scheme . |
4. Numerical and Sensitivity Analyses
Based on the sampling scheme design model, this section will analyze the sampling and testing case of sulfur dioxide concentration of a food processing enterprise’s production raw materials. This food processing company requires the maximum risk value of 5% and 10% for the producers and users, respectively, in the sampling and testing process [27]. In addition, the producers considered the mean value not exceeding 1.5 percentage points to be acceptable and exceeding 2.5 percentage points is considered unacceptable by the using party. The prior distribution of mean sulfur dioxide concentration in this raw material is assumed to be , and the model parameters are shown in Table 1.

Table 1.
Model parameters and values.
4.1. Numerical Analysis
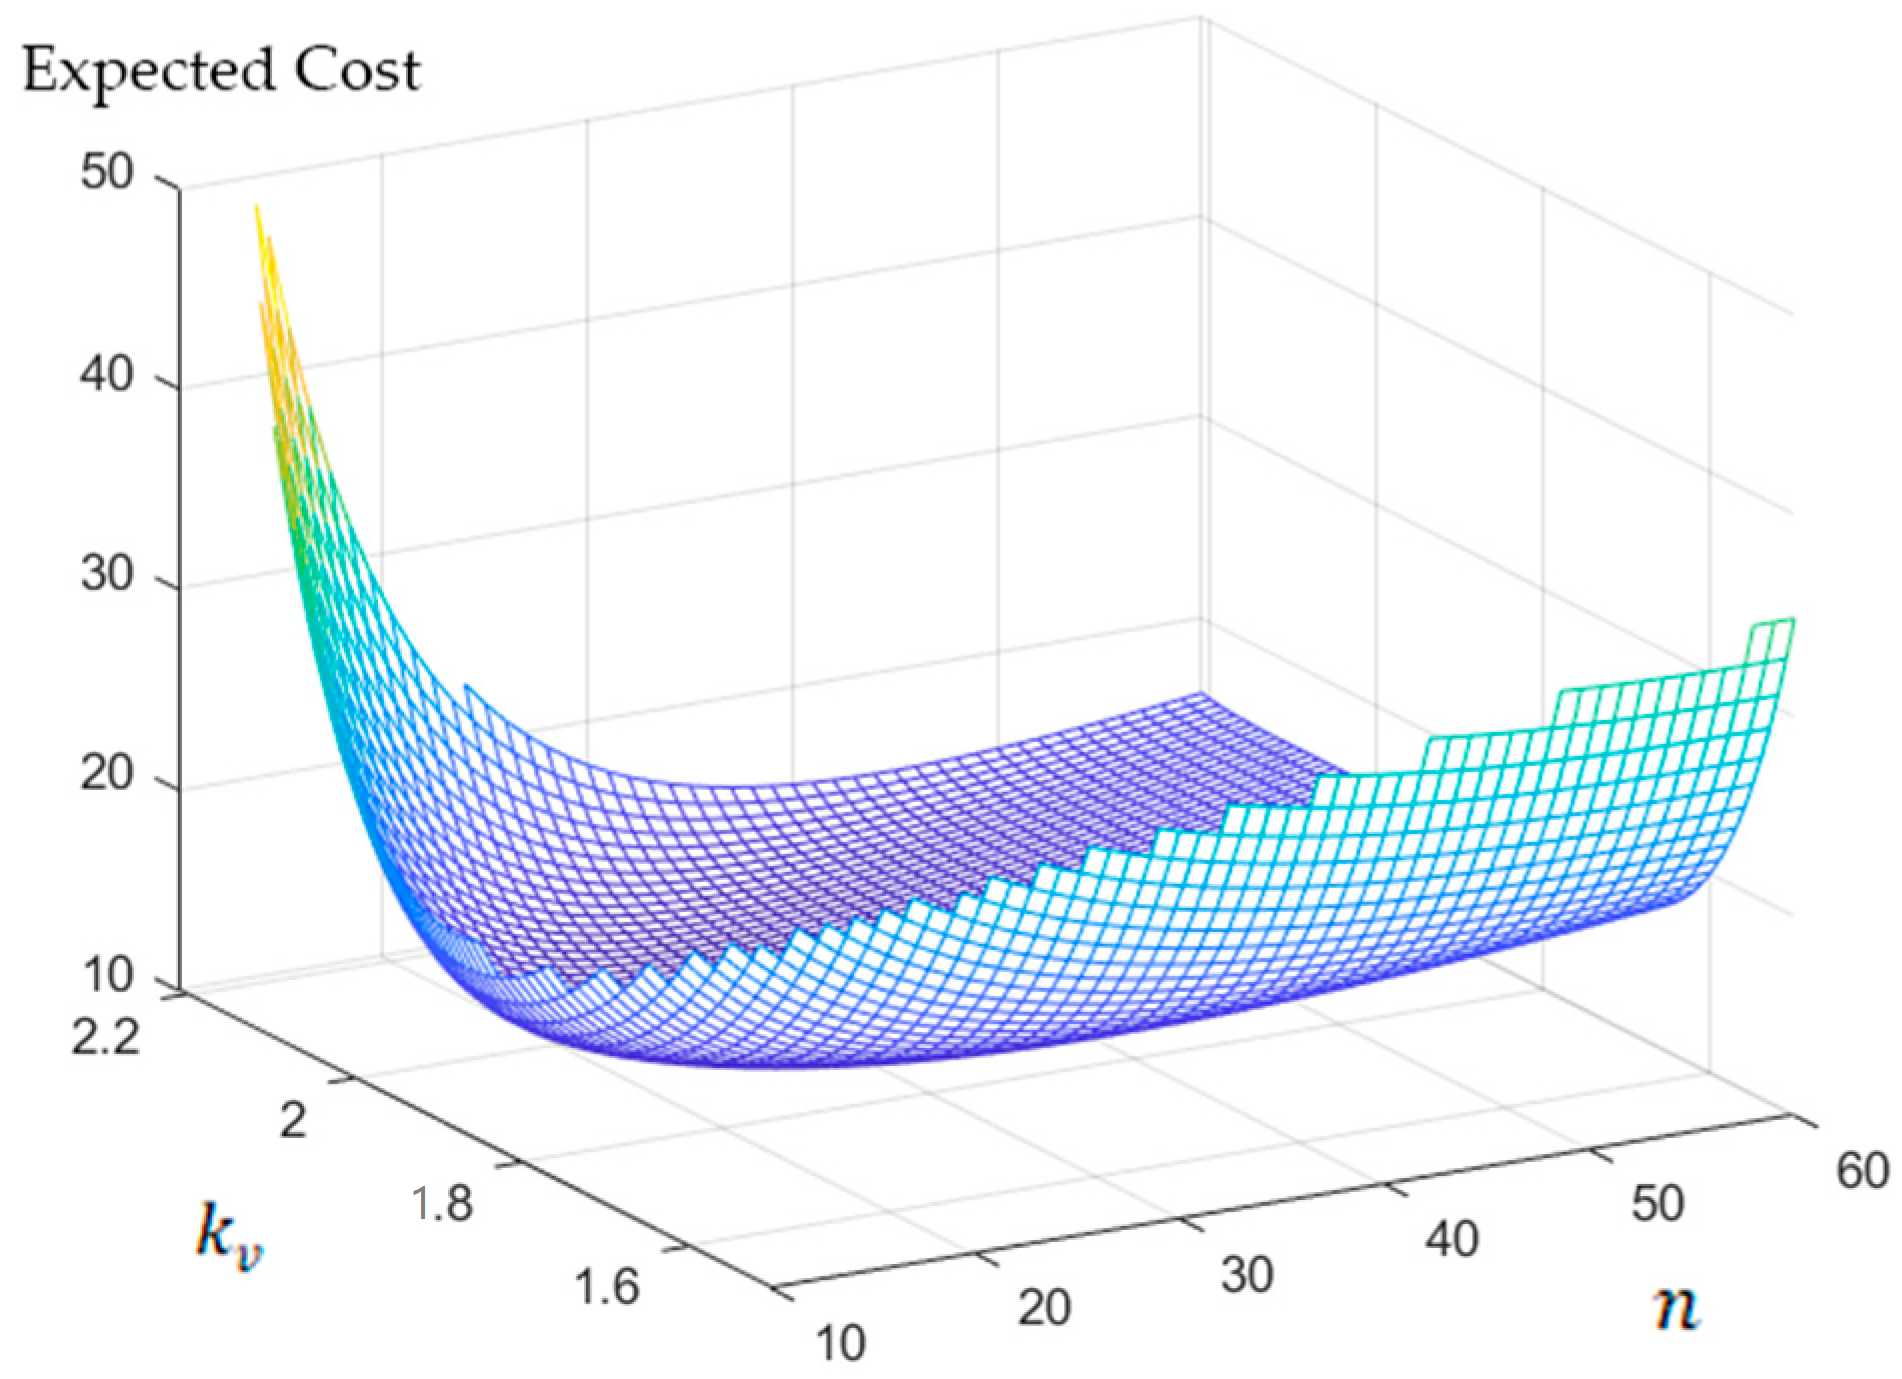
Under the objective of minimizing the total expected cost combined with sampling risk and quality loss, the optimal sampling scheme is calculated by Equation (14). The optimal sampling scheme with the expected cost is obtained by simulation. The production-side and use-side risk are 0.024 and 0.022, respectively. The relationship between the expected cost and the two decision variables is shown in Figure 1. As shown in Figure 1, the improved sampling scheme can quantify the sampling loss of the model, which is beneficial for the production side to optimize the sampling budget.

Figure 1.
Relationship between decision variables and expected cost.
Using the traditional sampling scheme to test the sulfur dioxide concentration of production materials, the cost is as high as 71.3979, and both types of sampling risk are high at approximately 0.07. A traditional sampling scheme only finds the optimal design by optimizing the two types of sampling risk without fully considering the loss of sampling costs. It is likely to lead companies to ignore the loss of product quality in the pursuit of optimal sampling risk, meaning the sampling costs remain high.
Compared with the traditional sampling scheme , the improved sampling scheme (as shown in Table 2) minimizes the expected cost as the goal to constrain sampling risk and quality loss, which tends to tighten, and helps protect the interests of the users. At the same time, the improved scheme reduces the loss of the producers, which is conducive to optimizing the sampling budget of the producing party.
Table 2.
Comparison of the traditional sampling scheme and the improved sampling scheme.
4.2. Sensitivity Analysis
To further analyze the effect of the model parameters on the decision variables of the improved optimal sampling scheme, sensitivity analysis is conducted.
4.2.1. Sensitivity Analysis of
In Table 3, when α increases, the optimal sampling scheme is slightly tightened and , , and increase. When increases, the optimal sampling scheme is relaxed, decreases slightly. At the same time, and have a tendency to increase, but the maximum of and will not exceed 0.03. More precisely, when and increase to 0.05, the sampling scheme is the same as the misclassification probability of 0.03 is the same.
Table 3.
Effect of test misclassification probability on optimal sampling scheme and two types of risk.
4.2.2. Sensitivity Analysis of
As shown in Table 4, when increases, the optimal sampling scheme tends to relax and then tighten. At the same time, decreases, decreases, and increases. It should be noted that when gradually increases to 1.3, the threshold increases reaching an upper limit of 1.96. When continues to increase to 2, gradually decreases but the decreasing trend is relatively slow.
Table 4.
Effect of expectation of product mean on optimal sampling scheme and two types of risk.
4.2.3. Sensitivity Analysis of
As shown in Table 5, when the upper bound of the acceptable mean increases, the sample size required for the optimal sampling scheme increases and gradually increases. When exceeds 1.5, the optimal sampling scheme changes more significantly than before reaches 1.5. As a whole, when gradually increases, increases, increases and decreases.
Table 5.
Effect of the upper bound of the acceptable mean on the optimal sampling scheme and the two types of risk.
4.2.4. Sensitivity Analysis of
As shown in Table 6, when increases, the optimal sampling scheme tends to relax. In addition, decreases and increases, but the trend of does not change significantly. The change of sample size is more obvious when is less than 2.5.
Table 6.
Impact of the lower bound of the batch rejection mean on the optimal sampling scheme and the two types of risk.
4.2.5. Sensitivity Analysis of
In Table 7, when the batch size increases, the sampling scheme tends to tighten. In addition, increases, decreases, and also decreases.
Table 7.
Effect of batch size on the optimal sampling scheme and the two types of risk.
5. Discussions and Conclusions
The lack of effective control over the sampling risk, quality loss in the sampling process, and the bias in the estimation of product mean values lead to unsustainable product quality management. This paper attempts to propose an optimal design for a sampling scheme based on sampling risk constraint and quality loss minimization and discusses the influence of model parameters on the optimal sampling scheme selection. The results of the study show that: (1) the sampling risk in the sampling process has a large impact on the design of the sampling scheme; when the expected value of the product mean increases, the sampling scheme tends to relax and tighten. When the upper bound of the acceptable mean increases, the sample size and threshold required for the sampling scheme will gradually increase. When the lower bound of the batch rejection mean increases, the sampling scheme tends to relax and when the batch size increases, the sampling scheme tends to tighten. (2) The parameters of product quality characteristic distribution are estimated as random variables, which can optimize the sampling cost, save enterprise budget, and improve the optimal allocation of resources. (3) The reasonable use of quality loss function can better simulate the quality fluctuation of products in the sampling process, which is convenient for enterprises to regulate the sampling cost, in line with the characteristics of material saving, ecology, and durability in sustainable quality management. In addition, the quality loss function can reduce the customer turnover rate, coordinate the stability of the environment and the sustainable use of resources, and improve the enterprise’s sustainable management ability and level.
When talking about the sustainability of product quality, it is important to note that it is inevitably related to the sustainable management ability of enterprises. In order to improve the sustainable management capability and core competitiveness of enterprises, it is necessary to improve the sustainable management model. The model constructed in this paper solves the problem of sampling scheme design for sulfur dioxide concentration of production raw materials in food enterprises. Based on the above research findings, firstly, enterprises should reasonably assess the potential risk and seek to maximize the benefits while protecting the legitimate rights and interests of consumers. Secondly, enterprises should do preliminary market research and accurately grasp the prior estimation of product characteristics. In this way, based on product acceptance and rejection guidelines, enterprises can quantify the sampling risk and product quality loss during sampling. Finally, according to marketing changes, enterprises should promptly adjust the sampling cost per unit of product to reduce sampling costs under the premise of ensuring stable product quality and controlling sampling risk.
Based on the above findings, the theoretical contributions of this paper can be summarized as follows: (1) proposing an optimal design for a sampling scheme based on sampling risk constraint and quality loss minimization, and applying the improved scheme to metrological data; (2) controlling the impact of risk and quality loss on the sampling scheme in the sampling process effectively; (3) quantifying the sampling cost in the sampling process through the improved quality loss function; and (4) using the traversal method to find the minimum cost and the corresponding optimal sampling scheme.
This study focuses mainly on the theoretical exploration of the optimal design for a sampling scheme based on sampling risk constraint and quality loss minimization, which could be applied to the practice of sustainable quality management in enterprises. Even though insightful findings were discovered, some important research issues are still worthy of further exploration in the future. First, the influence of different model parameters on the design of a sampling scheme can be further investigated. Second, more accurate prior estimates of different product quality characteristics, including different distributions of product quality characteristics, can be made in future studies to investigate the optimal design of sampling schemes for all product quality characteristics. The fuzzy clustering [28] approach can be considered for the estimation of prior information, including DSFCM and DSFCM_N [29]. Third, more potential risk in the sampling process can be considered according to the sampling and testing practices of different companies. Fourth, this paper mainly considers the case when the variance of product quality characteristics is known and when the variance is unknown, the sample variance can be used to estimate the product, which can be a direction for future research. Finally, in future research, we can conduct empirical studies on the sampling cases of different enterprises.
Author Contributions
Writing—original draft preparation, M.W.; investigation, F.Y.; supervision, B.Z.; writing—review and editing, Z.C. All authors have read and agreed to the published version of the manuscript.
Funding
This work was funded by the National Social Science Fund of China (Grant No. 22FJYB023), the Humanities and Social Science Youth Fund of the Ministry of Education of China (Grant No. 21YJC790017), the National Natural Science Foundation of China (Grant No. 71603125), China Scholarship Council (Grant No. 201706865020), and the Young Leading Talent Program of Nanjing Normal University.
Institutional Review Board Statement
Not applicable.
Informed Consent Statement
Not applicable.
Data Availability Statement
Some or all data, models, or codes that support the findings of this study are available from the corresponding author upon reasonable request.
Conflicts of Interest
The authors declare no conflict of interest.
References
- Daniella, G. Hundreds of Sandwiches, Snacks Recalled over Listeria Concerns [EB/OL]. Available online: https://www.google.com/amp/s/nypost.com/2023/02/07/fresh-ideation-food-group-issues-recall-over-lysteria-wories/amp/ (accessed on 2 March 2023).
- Palatino, L. USDA Details Beef and Ham Recalls over E. coli and Salmonella Risk [EB/OL]. Available online: https://www.slashgear.com/usda-details-beef-and-ham-recalls-over-e-coli-and-salmonella-risk-17669234 (accessed on 3 March 2023).
- Abebe, G. Effects of Institutional Pressures on the Governance of Food Safety in Emerging Food Supply Chains: A Case of Lebanese Food Processors. Agric. Hum. Values 2020, 37, 1125–1138. [Google Scholar] [CrossRef]
- Khan, M.Z.; Khan, M.F.; Aslam, M.; Razzaque, A. Fuzzy Acceptance Sampling Plan for Transmuted Weibull Distribution. Complex Intell. Syst. 2022, 8, 4783–4795. [Google Scholar] [CrossRef]
- Wu, C.W.; Darmawan, A.; Liu, S.W. Stage-independent multiple sampling plan by variables inspection for lot determination based on the process capability index Cpk. Int. J. Prod. Res. 2022, 1–13. [Google Scholar] [CrossRef]
- Lee, A.; Wu, C.W.; Liu, S.W.; Liu, C.H. Designing acceptance sampling plans based on the lifetime performance index under gamma distribution. Int. J. Adv. Manuf. Technol. 2021, 115, 3409–3422. [Google Scholar] [CrossRef]
- Kamesh, R.; Vaddagani, S.; Sumana, C. Six-directional sampling method and mean mixing indices for solids blending performance analysis of DEM simulations. Powder Technol. 2022, 398, 117051. [Google Scholar] [CrossRef]
- Fernández, A.J.; Pérez-González, C.J.; Suárez-Rancel, M.M. Optimal lot sentencing based on defective counts and prior acceptability. J. Comput. Appl. Math. 2021, 388, 113317. [Google Scholar] [CrossRef]
- Hussain, S.; Ahmad, I.; Saghir, A.; Aslam, M.; Almanjahie, I. Mean Ranked Acceptance Sampling Plan under Exponential Distribution. Ain Shams Eng. J. 2021, 12, 4125–4131. [Google Scholar] [CrossRef]
- Banihashemi, A.; Nezhad, M.S.F.; Amiri, A. A new approach in the economic design of acceptance sampling plans based on process yield index and Taguchi loss function. Comput. Ind. Eng. 2021, 159, 107155. [Google Scholar] [CrossRef]
- Sharma, G.M.; Wang, S.S.; Pereira, M.; Bedford, B.; Wehling, P.; Arlinghaus, M.; Warren, J.; Whitaker, T.; Jackson, L.; Canida, T.; et al. Sampling plan designs for gluten estimation in oat flour by discrete and composite sampling. Food Control 2021, 129, 107943. [Google Scholar] [CrossRef]
- Santana, A.S.; Lima, A.P.S.; Santana, E.D.R.; Santos, A.; Cristaldo, P.; Albano, A.; Ana, P.; Bacci, L. Development of conventional sampling plans for egg masses and nymphs of citrus blackfly Aleurocanthus woglumi Ashby (Hemiptera: Aleyrodidae). Crop Prot. 2021, 149, 105777. [Google Scholar] [CrossRef]
- Wang, G.X.; Han, Z.J. The relationship between mass loss and signal-to-noise ratio of looking large and looking small characteristics. Mech. Sci. Technol. 2000, 2, 236–238. [Google Scholar]
- Jr, F.S.S.; Lopes, M.C.; Farias, E.S.; Sarmento, R.; Pereira, P.; Picanço, M. Standardized sampling plan for common blossom thrips management in melon fields from north Brazil. Crop Prot. 2020, 134, 105179. [Google Scholar]
- Fernández, A.J. Economic lot sampling inspection from defect counts with minimum conditional value-at-risk. Eur. J. Oper. Res. 2017, 258, 573–580. [Google Scholar] [CrossRef]
- Allen, D.E.; Powell, R.J.; Singh, A.K. Take it to the limit: Innovative CVaR applications to extreme credit risk measurement. Eur. J. Oper. Res. 2016, 249, 465–475. [Google Scholar] [CrossRef]
- Hsieh, C.C.; Lu, Y.T. Risk-embedded Bayesian acceptance sampling plans via conditional value-at-risk with Type II censoring. Comput. Ind. Eng. 2013, 65, 551–560. [Google Scholar] [CrossRef]
- Mahmood, Y.; Fatima, S.; Khan, H.; Amir, H.; Khoo, M.; Sin, T. Acceptance sampling plans based on Topp-Leone Gompertz distribution. Comput. Ind. Eng. 2021, 159, 107526. [Google Scholar] [CrossRef]
- Sajnóg, A.; Hanć, A.; Barałkiewicz, D. Metrological approach to quantitative analysis of clinical samples by LA-ICP-MS: A critical review of recent studies. Talanta 2018, 182, 92–110. [Google Scholar] [CrossRef] [PubMed]
- Shohreh, M.; Grzegorz, S.; Houshmand, M. System Dynamics Modeling and Fuzzy MCDM Approach as Support for Assessment of Sustainability Management on the Example of Transport Sector Company. Energies 2022, 15, 4917. [Google Scholar]
- Wadghane, R. Sustainability Management Status of Agro-Ecosystems: A Case Study of Sugarcane Farmers in Shevgaon and Paithan (Sub-Districts) of Maharashtra, India. Agric. Res. 2022, prepublish. [Google Scholar] [CrossRef]
- Albert, M.; Bauche, X.; Closmann, L.; Eichholz, T.; Preis, K. Sustainability management in non-governmental organisations: Development of a maturity model. Int. J. Innov. Sustain. Dev. 2022, 16, 425–460. [Google Scholar] [CrossRef]
- Shri, B. An approach to integrating sustainability management parameters and indicators into value stream mapping. Asian J. Res. Bus. Econ. Manag. 2021, 11, 43–50. [Google Scholar]
- Sepahvand, F.; Naderi Mahdei, K.; Gholamrezai, S.; Bijani, M. Strategies to sustainable management of groundwater resources in Romeshkan plain. Environ. Sci. 2022, 20, 155–172. [Google Scholar]
- Lam, Y.; Li, K.H.; Ip, W.C. Sequential variable sampling plan for normal distribution. Eur. J. Oper. Res. 2006, 172, 127–145. [Google Scholar] [CrossRef]
- Liu, W. A k-stage sequential sampling procedure for estimation of normal mean. J. Stat. Plan. Inference 1997, 65, 109–127. [Google Scholar] [CrossRef]
- Zhou, J.X.; Mao, S.S. Statistical Methods for Quality Management, 2nd ed.; China Statistics Press: Beijing, China, 2008; pp. 86–92. [Google Scholar]
- Tang, Y.; Pan, Z.; Pedrycz, W.; Ren, F.; Song, X.C. Viewpoint-Based Kernel Fuzzy Clustering with Weight Information Granules. IEEE Trans. Emerg. Top. Comput. Intell. 2022, 1, 1–15. [Google Scholar] [CrossRef]
- Zhang, Y.; Bai, X.; Fan, R.; Wang, Z. Deviation-Sparse Fuzzy C-Means With Neighbor Information Constraint. IEEE Trans. Fuzzy Syst. 2018, 27, 185–199. [Google Scholar] [CrossRef]
Disclaimer/Publisher’s Note: The statements, opinions and data contained in all publications are solely those of the individual author(s) and contributor(s) and not of MDPI and/or the editor(s). MDPI and/or the editor(s) disclaim responsibility for any injury to people or property resulting from any ideas, methods, instructions or products referred to in the content. |
© 2023 by the authors. Licensee MDPI, Basel, Switzerland. This article is an open access article distributed under the terms and conditions of the Creative Commons Attribution (CC BY) license (https://creativecommons.org/licenses/by/4.0/).