Article

Slope Stability and Effectiveness of Treatment Measures during Earthquake

1
School of Civil Engineering, Qingdao University of Technology, Qingdao 266520, China
2
Xi’an China Highway Geotechnical Engineering Co., Ltd., Xi’an 710075, China
*
Author to whom correspondence should be addressed.
Sustainability 2023, 15(6), 5309; https://doi.org/10.3390/su15065309
Submission received: 26 February 2023 / Revised: 12 March 2023 / Accepted: 14 March 2023 / Published: 16 March 2023

Abstract

:
Slopes are prone to instability during earthquakes, which will cause geological disasters such as landslides and pose a great threat to people’s lives and property. Therefore, it is necessary to analyze the stability of slopes and the effectiveness of treatment measures during earthquakes. In this study, an actual slope in the creeping slide stage was selected and located in an area where earthquakes occur frequently. Once the slope experiences instability, it will produce great damage. Therefore, a finite difference program, Fast Lagrangian Analysis of Continua in Two Dimensions (FLAC2D), was employed in the numerical simulation to explore the stability of the slope before and after treatment under earthquake action. Different from previous studies, this study explores the effectiveness of various treatment measures on slope stability during earthquake. The computed results show that the stability of the slope is greatly influenced by earthquakes, and the slope displacement under seismic conditions is far larger than that under natural conditions. Three treatment measures, including excavation, anti-slide piles, and anchor cables, can significantly reduce slope displacement and the internal force on anti-slide piles, and improve the stability of a slope during an earthquake. This will provide a valuable reference for the strengthening strategies of unstable slopes. The analysis technique as well as the derived insights are of significance for slope stability and the effectiveness of treatment measures.

1. Introduction

Many disasters are caused by slope instability, so slope stability has been widely studied. Southwest China is a mountainous region and has many natural slopes. In this region, most of the towns are built in the flat area under the mountain, and most of the roads and bridges are built on the mountain. The consequences are unimaginable if the slope of the mountain is destroyed. Usually, a natural slope will be unstable under extreme external loading, which will lead to a landslide disaster, especially earthquakes and rainfall, and so on. Therefore, it is important to improve the stability of slopes so as to prevent disasters.
Earthquakes are one of the main reasons for landslide disasters [1]. For example, the 2017 Jiuzhaigou earthquake triggered a large number of landslides, which meant that 73,671 houses were damaged [2]. On 6 September 2018, an earthquake occurred in Hokkaido, Japan, which also triggered a large-scale landslide [3]. In 2014, an earthquake occurred in Ludian County, Yunnan Province, which triggered the Hongshiyan landslide and formed a landslide dam in the Niulan River, threatening the lives of more than 10,000 people [4,5]. During 2008 Wenchuan earthquake, a landslide occurred in Wangjiayan, Beichuan County, which covered most of the county and directly killed around 1600 people [6,7,8,9,10]. In the 2013 Lushan earthquake, thousands of landslides were triggered due to the earthquake [11]. To explore the damage effects of different seismic parameters on the rock and soil mass, Cheng et al., [12] studied the effect of different seismic input amplitudes on the seismic performance of slopes based on a centrifuge model test. Xu et al. [13] conducted a uniaxial compression test on hard rock and found that the loading rate has an important effect on the strength and deformation characteristics of the rock mass. In short, the landslide disaster usually caused by an earthquake is more serious than the earthquake itself. Therefore, it is particularly vital to ensure the stability of slopes under earthquakes.
Several investigations based on physical model tests have been carried out to evaluate slope stability [14,15,16,17]. In addition, the numerical simulation technique is widely used in the analysis of slope stability, compared with physical model tests. This is because this technique not only reproduces the soil–structure interaction but also simulates the slope failure under various conditions, such as rainfall [18,19,20], earthquakes [21,22,23,24,25], human activity [26,27,28], etc. For example, Yin et al. [29] simulated the Wangjiayan landslide during the 2008 Wenchuan earthquake using the Fast Lagrangian Analysis of Continua in Three Dimensions (FLAC3D) program. The computed results showed that the shear strain increment of a landslide after an earthquake is 3000 times higher than that before the earthquake, but the displacement of the slope was relatively small, which indicated that anti-slide piles played an important role in resisting slope deformation. Ding et al. [30] explored the influence of the design parameters of anti-slide piles on the dynamic contact stress, shear force, and bending moment on piles during an earthquake, and the simulated results presented the most significant factor affecting the dynamic contact stress and bending moment on piles. Lai et al. [31] used Fast Lagrangian Analysis of Continua (FLAC) to simulate a slope with multiple anti-slide piles under an earthquake and applied the strength reduction method to analyze the stability of the slope. However, in numerical modeling, it is essential to set appropriate boundary conditions, mechanical models, and parameters to ensure the accuracy of the numerical simulation [32,33,34]. Huang et al. [35] explored the slope stability using the finite element model considering various treatment measures, including anti-slide piles, anchor cable, and anti-slide piles with anchor cables, under an earthquake, and obtained that anti-slide piles with anchor cables had the best effect on slope deformation. The internal force distribution on piles for this treatment measure was more reasonable, and the slope stability was greatly improved. Qiao et al. [36] established a numerical model for the reinforcement of embankment slopes with anti-slide piles, and analyzed the mechanical behavior of piles under different parameters considering the soil–pile interaction. The influence of different parameters on the reinforcement effect, structural deformation, and economic benefits was systematically studied. Based on the finite element method, Ye et al. [24] conducted a numerical simulation on the reliability and stability of a slope, and found that the reliability of the slope decreased and the failure probability significantly increased as the peak seismic acceleration increased. Yang et al. [37] studied the deformation law and stability of accumulation of landslides under the coupling condition of an earthquake and rainfall by means of a physical model test and numerical simulation. The results indicated that the coupling effect had the greatest influence on the stability of the slope toe of the landslide.
In this study, the Bainigou slope, located in Qiaojia County of Yunnan Province, Southwest China, is selected, as this slope is currently in the creeping slip stage due to earthquakes and local excavation. This will seriously threaten the safety of 13 households and a newly constructed expressway in this area. Based on the above, a two-dimensional (2D) numerical model is created by finite difference program FLAC based on this actual slope. Various treatment measures are employed to improve the slope’s stability during earthquakes, including excavation, anti-slide piles, and anchor cables. Different from previous studies, this study mainly focuses on the effectiveness of various treatment measures on slope stability during an earthquake. The deformation characteristics of the slope before and after treatment under an earthquake are systematically analyzed and compared. The seismic response of supporting structures is discussed in detail to explore the effectiveness of treatment measures.

2. Description of Bainigou Slope
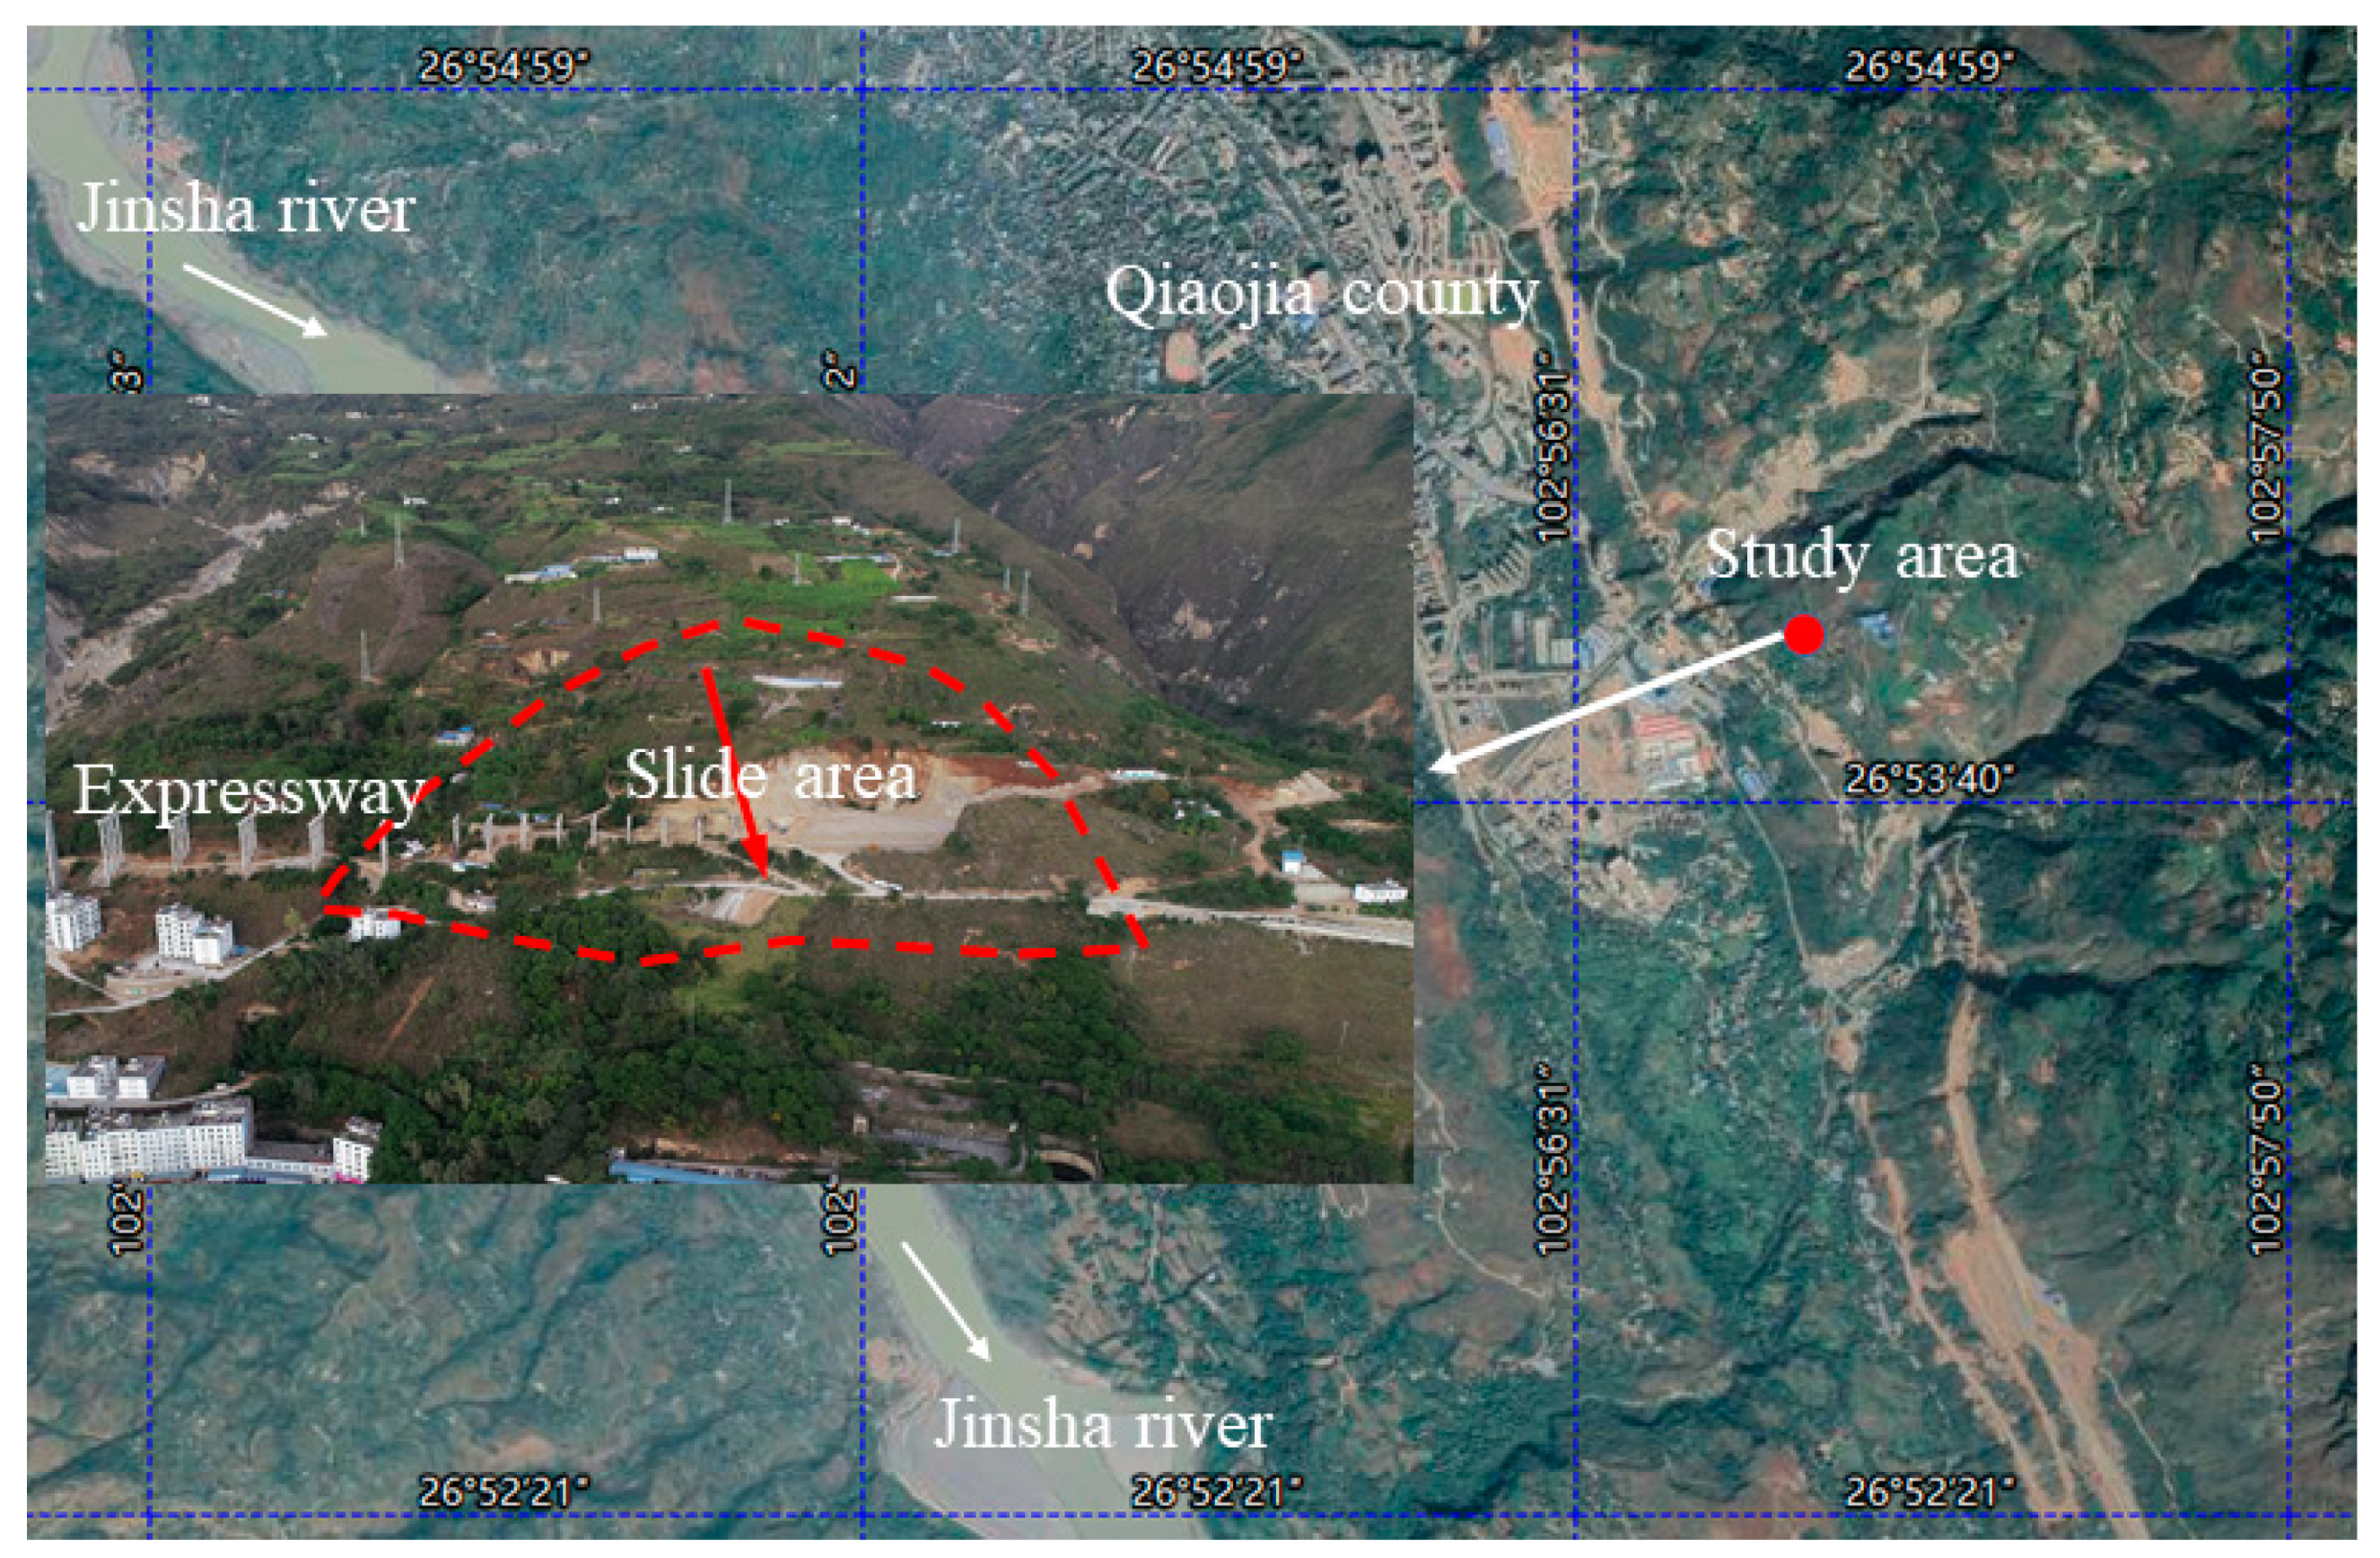
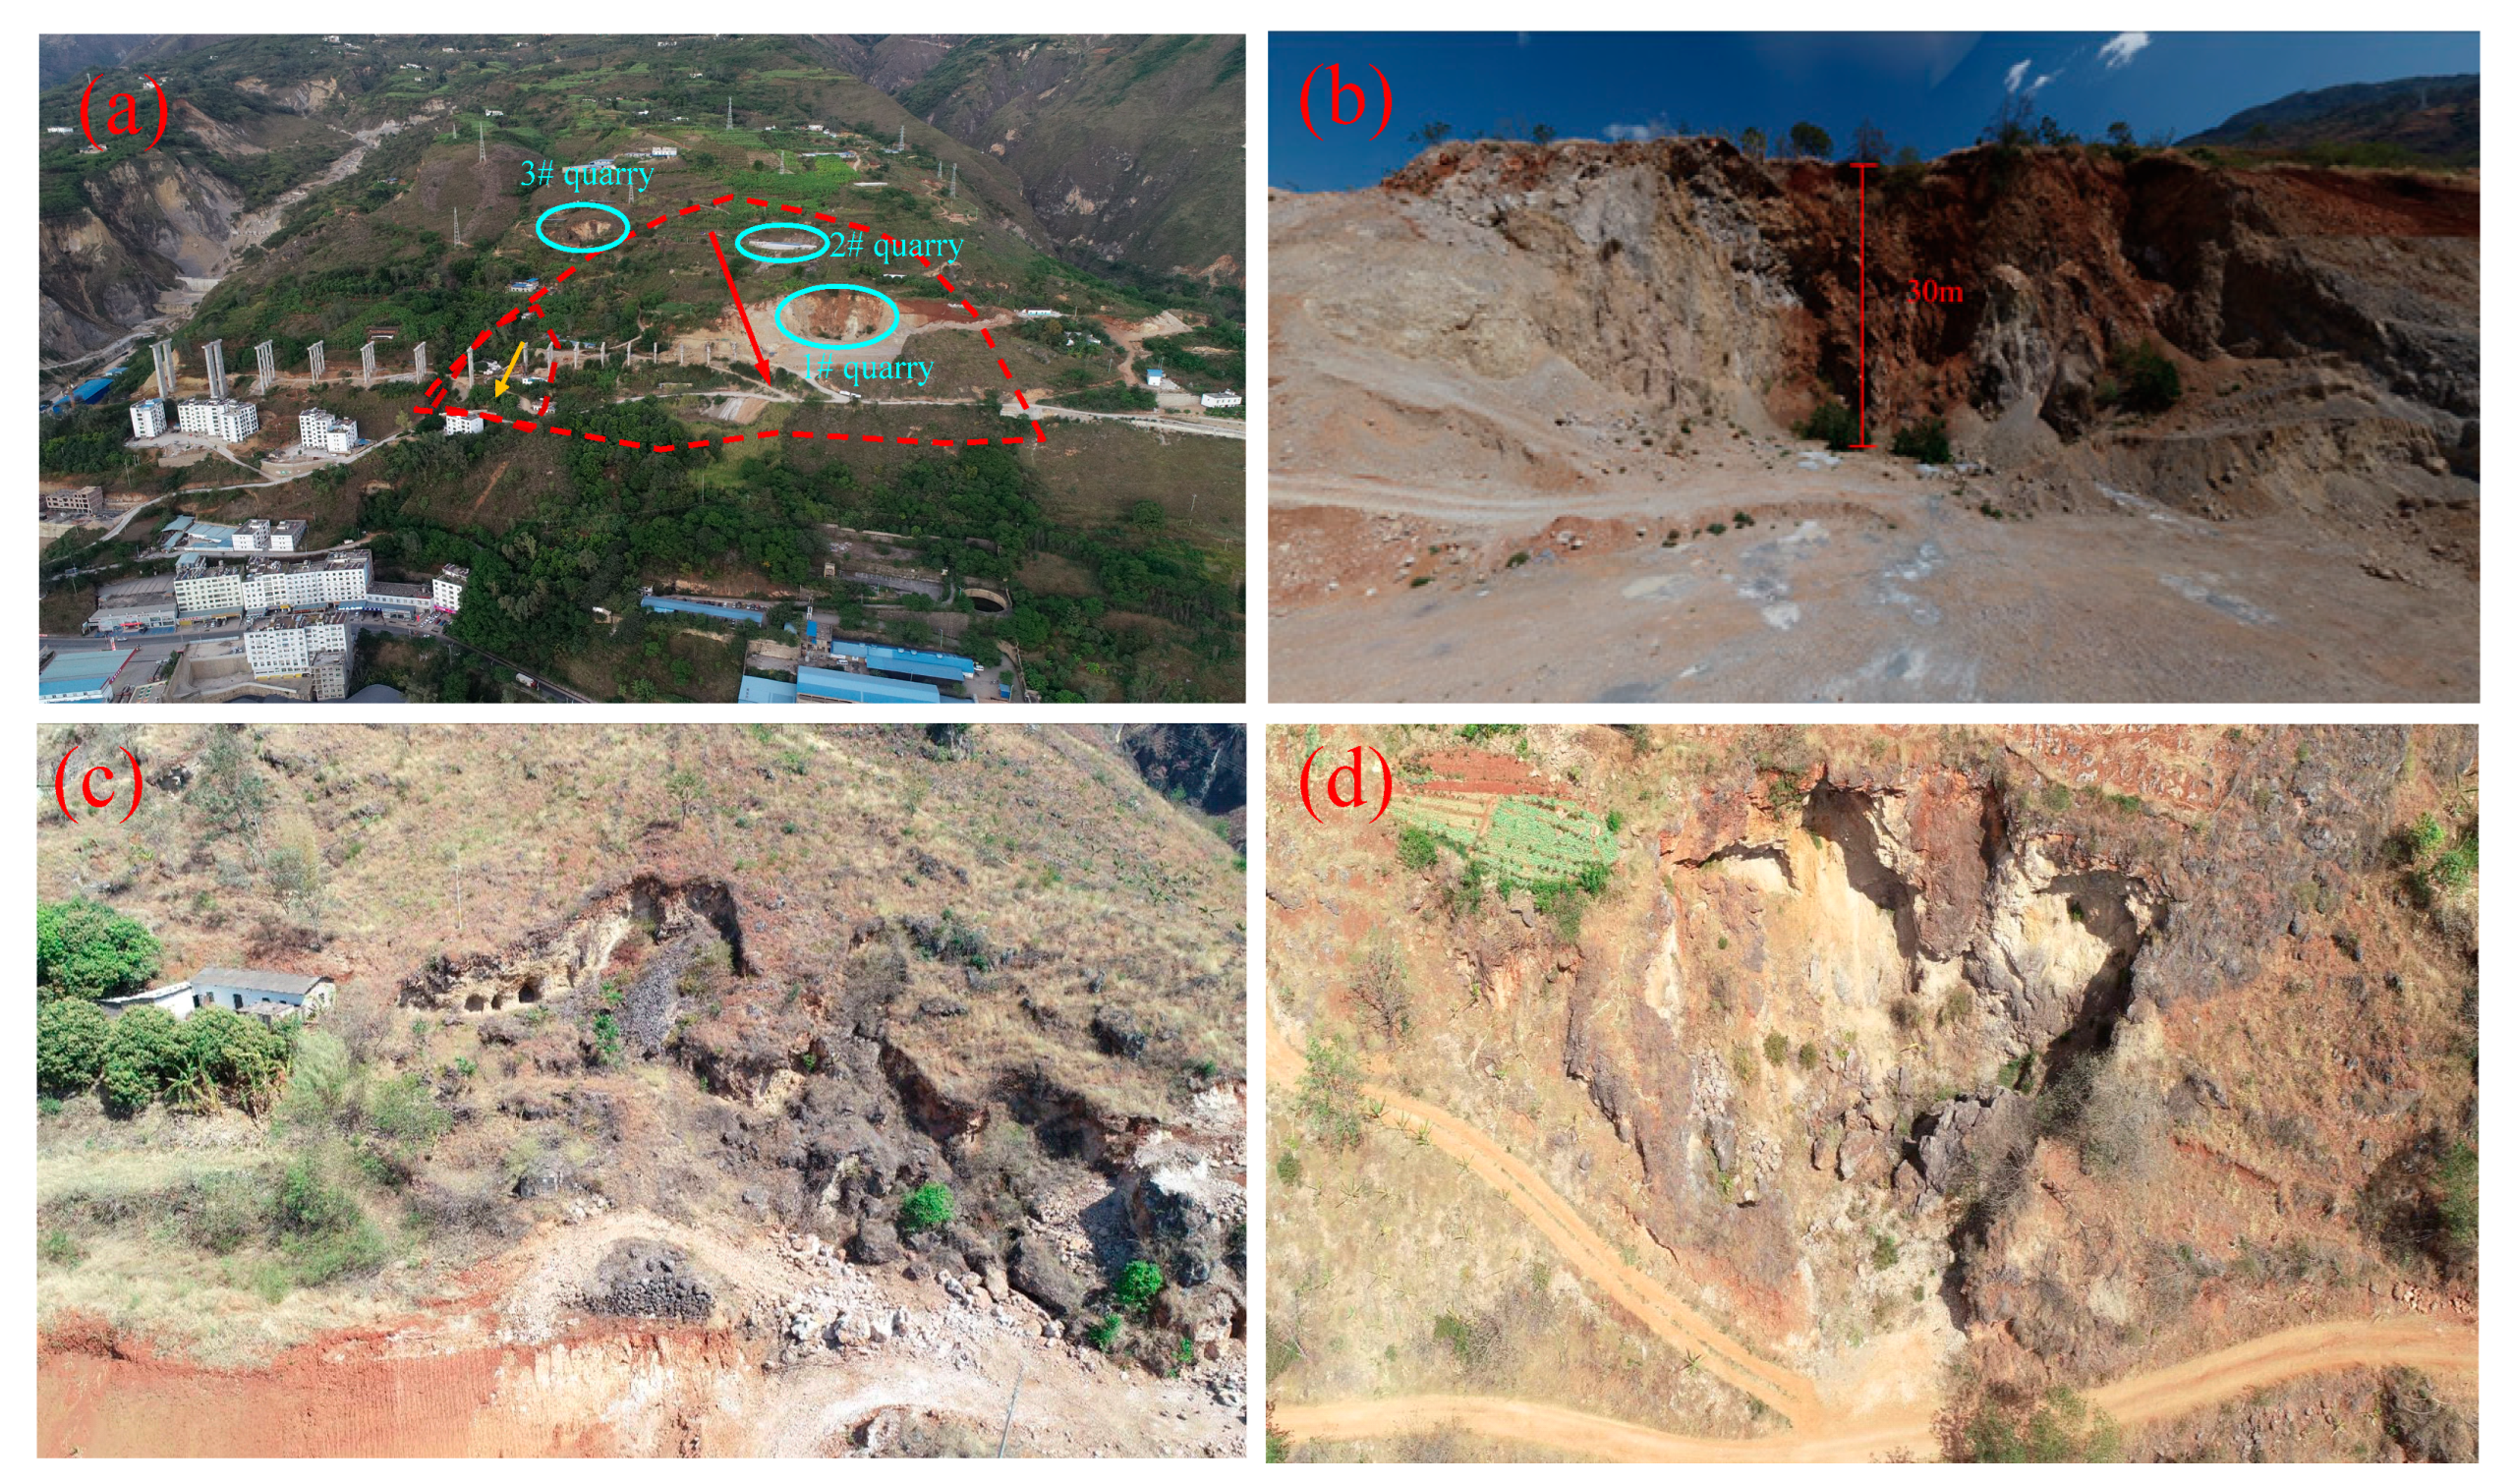
2.1. Overview

The Bainigou slope is located in Qiaojia County of Yunnan Province, Southwest China, 2.5 km away from Jinsha River, as shown in Figure 1. The trailing edge of this slope is clearly visible. Overall, the sliding zone of the slope presents a fan shape and its size is approximately 350 m wide and 300 m long. The area of the sliding zone is approximately 7.6 × 10⁴ m2. The difference in elevation between the front and rear edges of the sliding zone is around 117 m. The maximum thickness of the sliding zone is 45 m, and the average thickness is 32 m. The volume of the sliding zone is approximately 2.5 × 10⁶ m3.

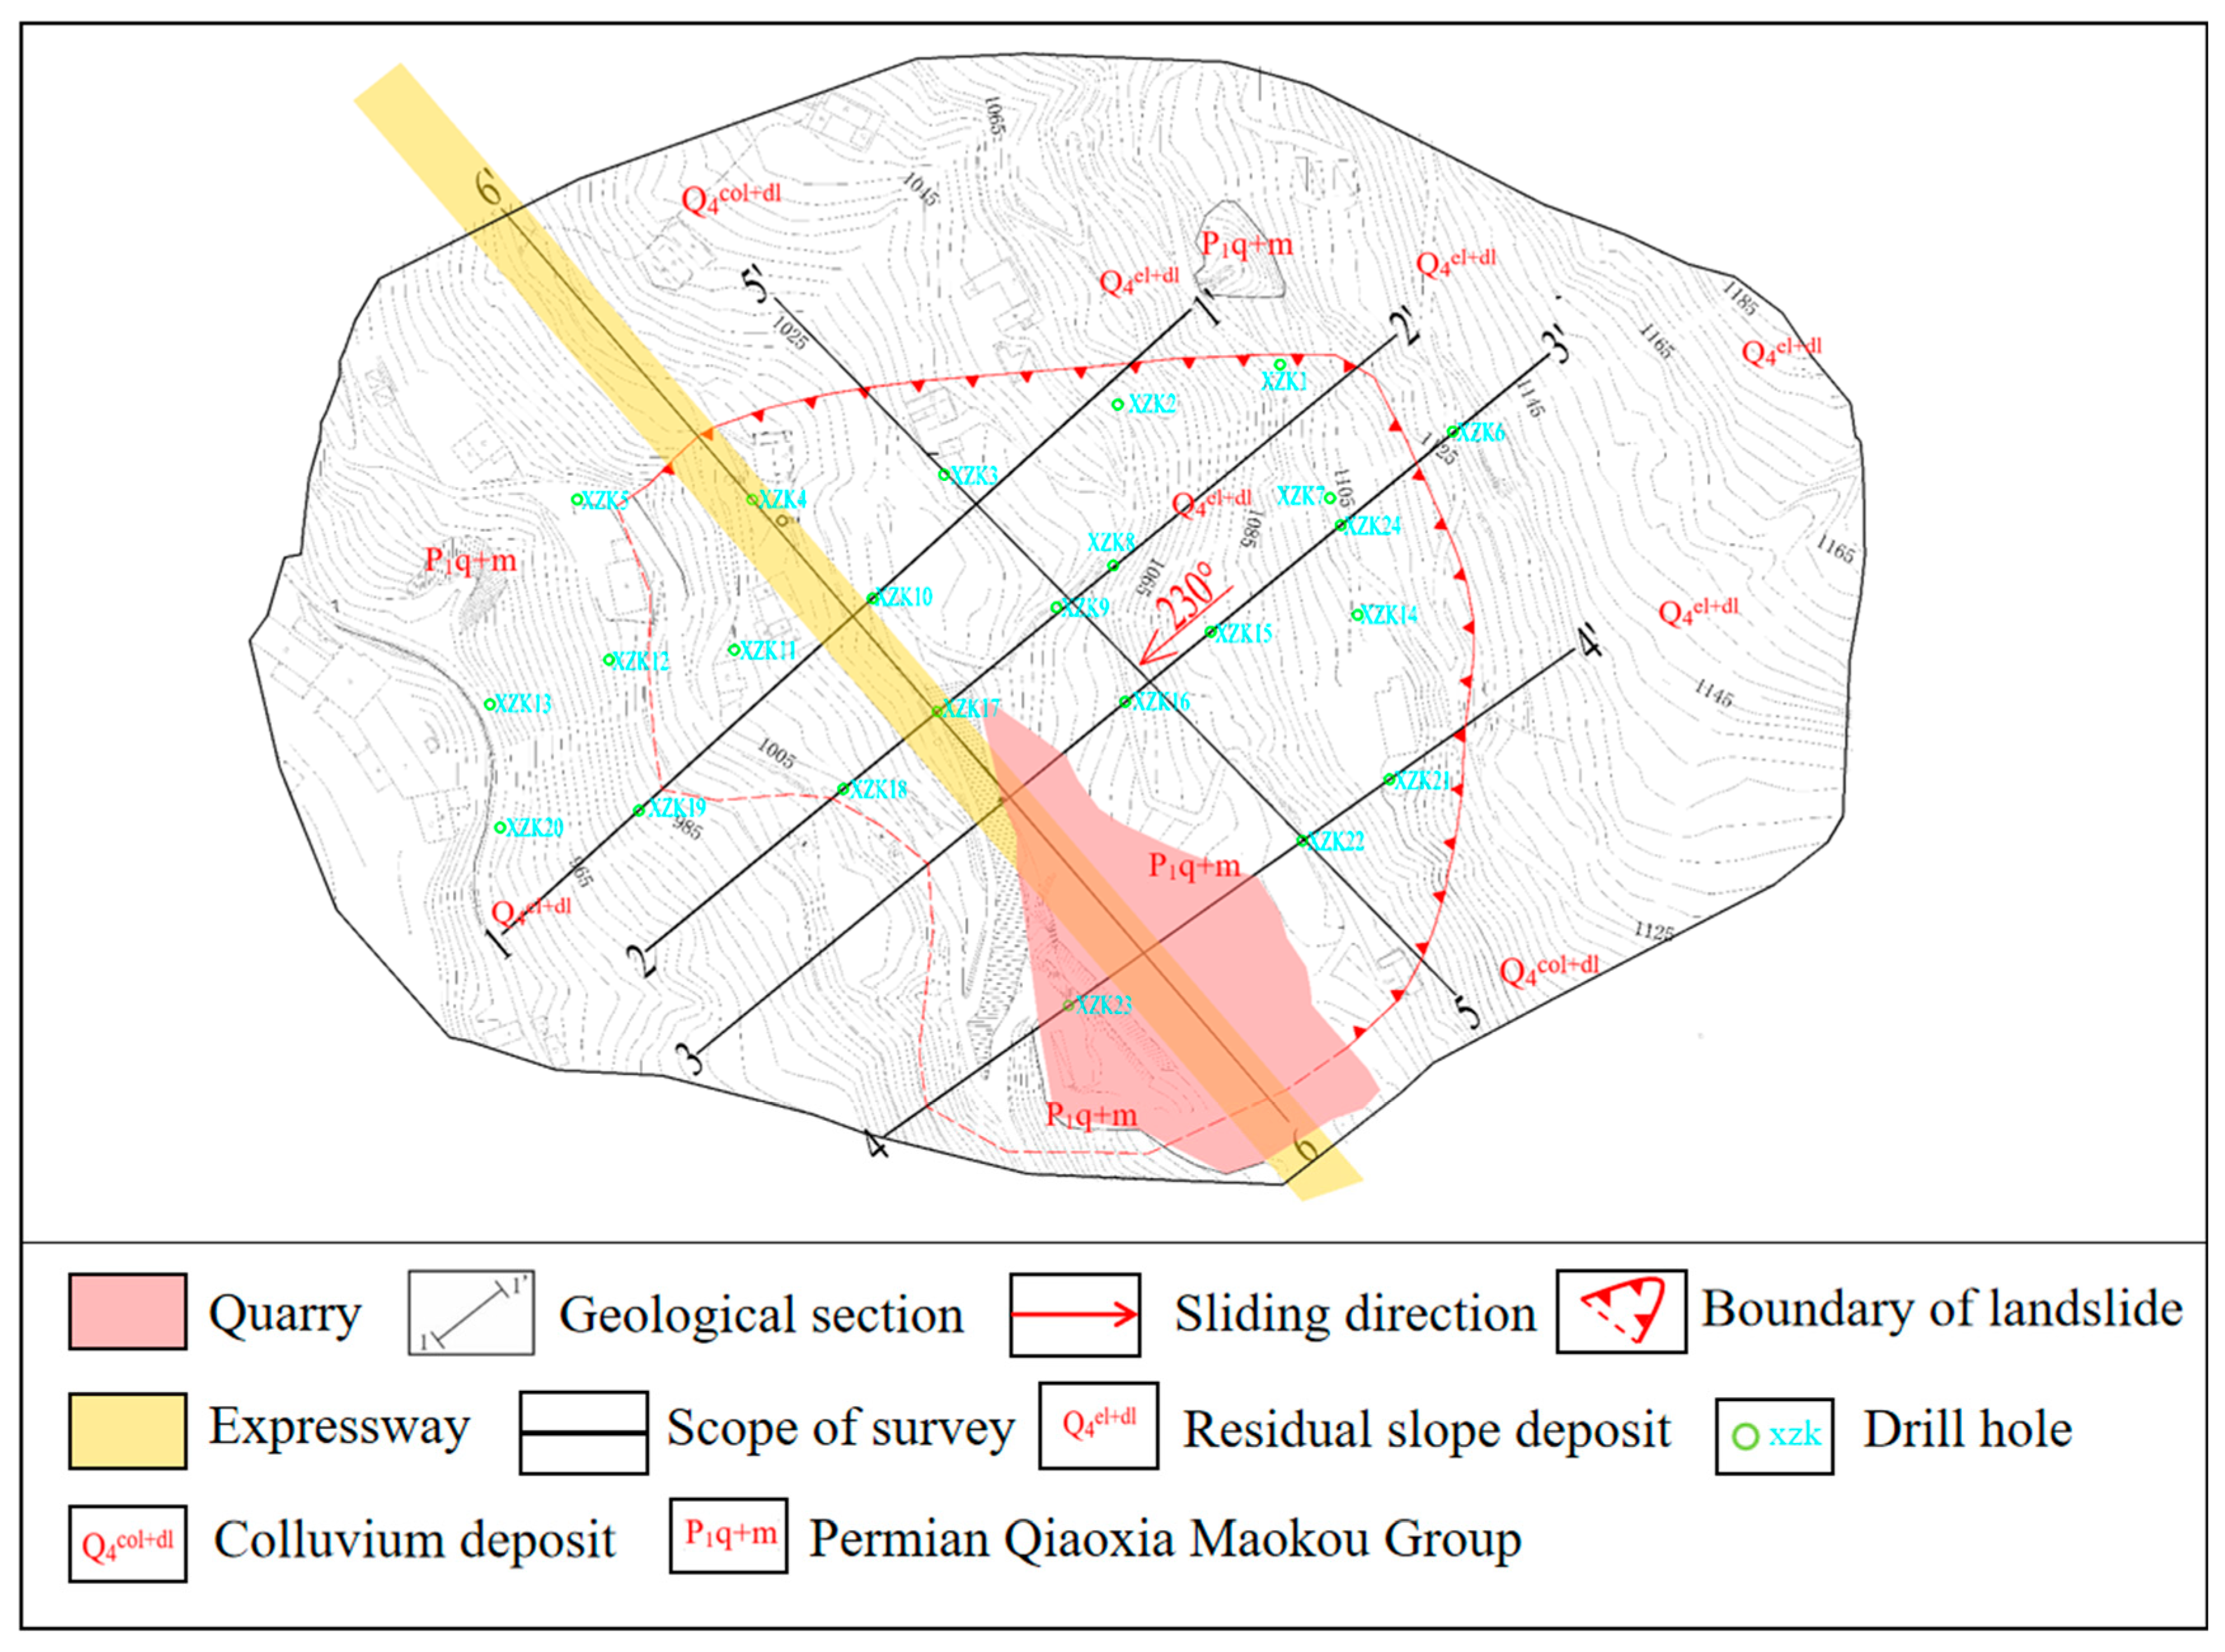
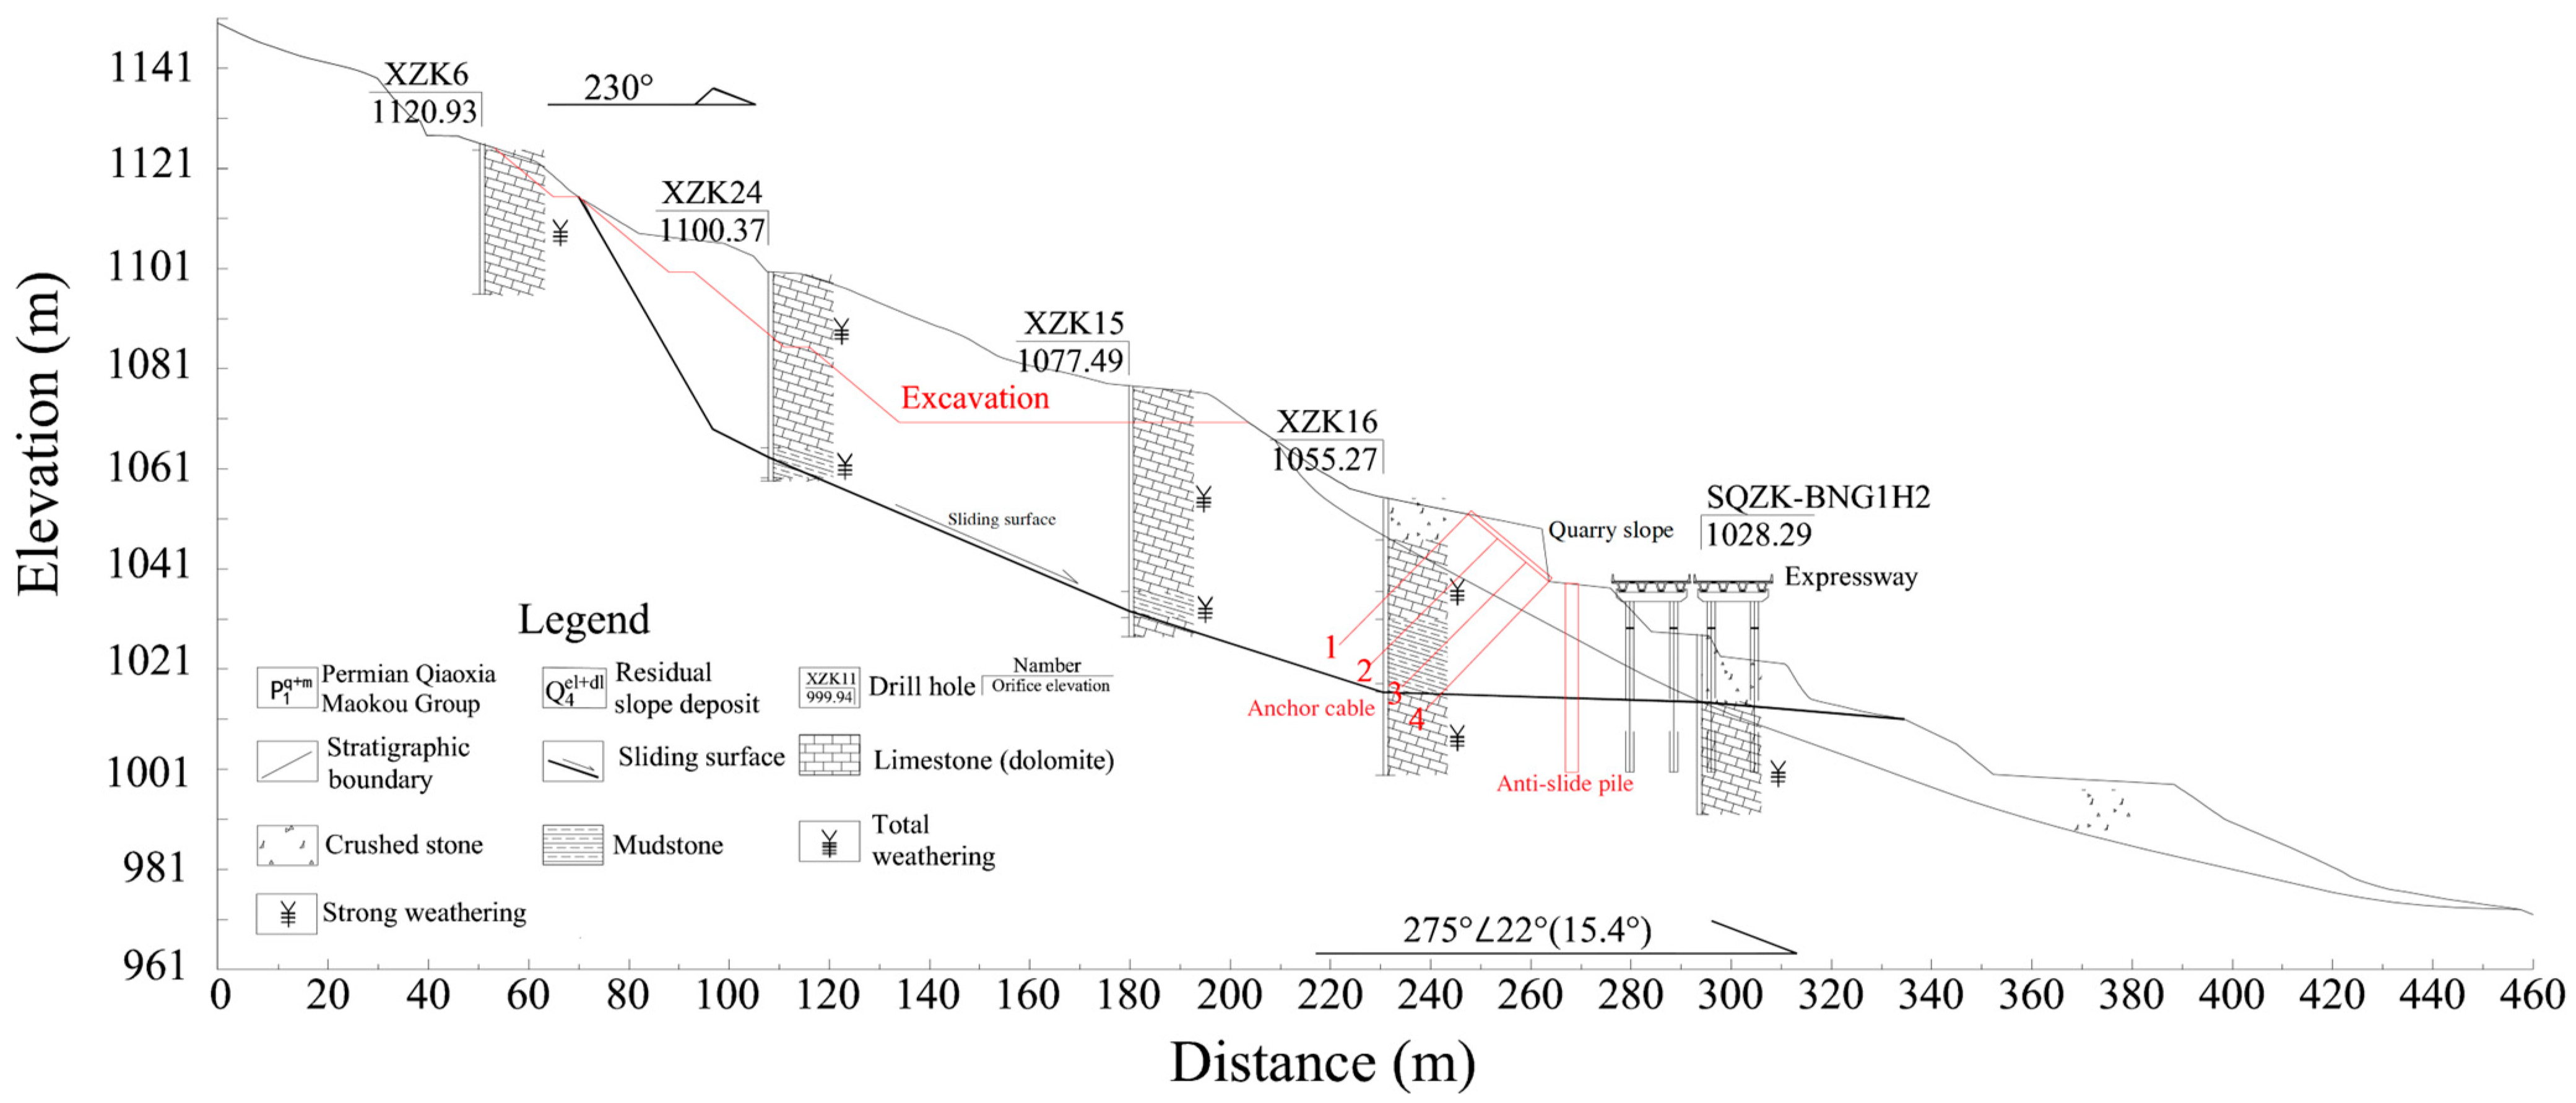
2.2. Engineering Geology

Figure 2 shows the engineering geology of the Bainigou slope. From Figure 2, the exposed strata from top to bottom in the slope area are a residual slope deposit (Q4el+dl), Permian Qiaoxia Maokou Group (P1q+m), sandstones, and argillaceous limestone. The surface eluvium consists of brownish red silty clay and gravelly soil with uneven thickness. The overlying bedrock is mainly strong weathering limestone with locally visible wrinkling. The limestone is interspersed with a layer of soft mudstone with a thickness of 2~5 m, distributed at a depth of 25~40 m and dip angle of 20~25°. The mudstone layer has high water content and is a relative aquifuge, which is seriously muddied and has low strength under tectonic extrusion and long-term groundwater infiltration.
The slope is located in the gorge geomorphic area along Jinsha River, with strong neotectonic movement and relatively fragile geological conditions. The study area is located within the active fault zone of Xiaojiang, where faults are active and neotectonic movement is strong, resulting in frequent earthquakes. According to previous statistics, in the past 100 years, there have been 20 earthquakes with a magnitude of 4 or above and 4 earthquakes with a magnitude of 6 or above in the study area and its periphery. This is the cause of rock fragmentation with obvious weathering in the slope area. Meanwhile, the slope is near a river valley area with a hot climate and little rainfall. There is no water system in this area, and an artificial water channel exists on the surface. The slope area is locally low-lying, and groundwater is relatively scarce. As such, groundwater is mainly bedrock crevice water and pore water of the loose soil layer.
Human engineering activities are active in the slope area, and many slope excavations and quarrying activities have been carried out due to engineering construction. There are three quarries near this area (Figure 3), and quarry 1 is the largest, which is located at the front edge of the slope with a length of around 100 m and a width of around 90 m. After mining, a steep cliff slope with a height of 30 m and a slope of 90° was formed. Quarry 2 is located above quarry 1, and quarry 3 is located at the back edge of the slope. These three quarries were formed by blast mining. There is an expressway, part of which is in the form of a bridge, under construction in the front edge of the slope. Pile foundation in the expressway is excavated by blasting.
The soft mud interlayer in the soil layer profile of the slope area provides a necessary condition for the occurrence of landslides, and quarry excavation is a direct reason for landslides. As such, the sliding of the slope body is formed along the mudstone layer. The vibrations generated by human activities and earthquakes promote the sliding of the slope.

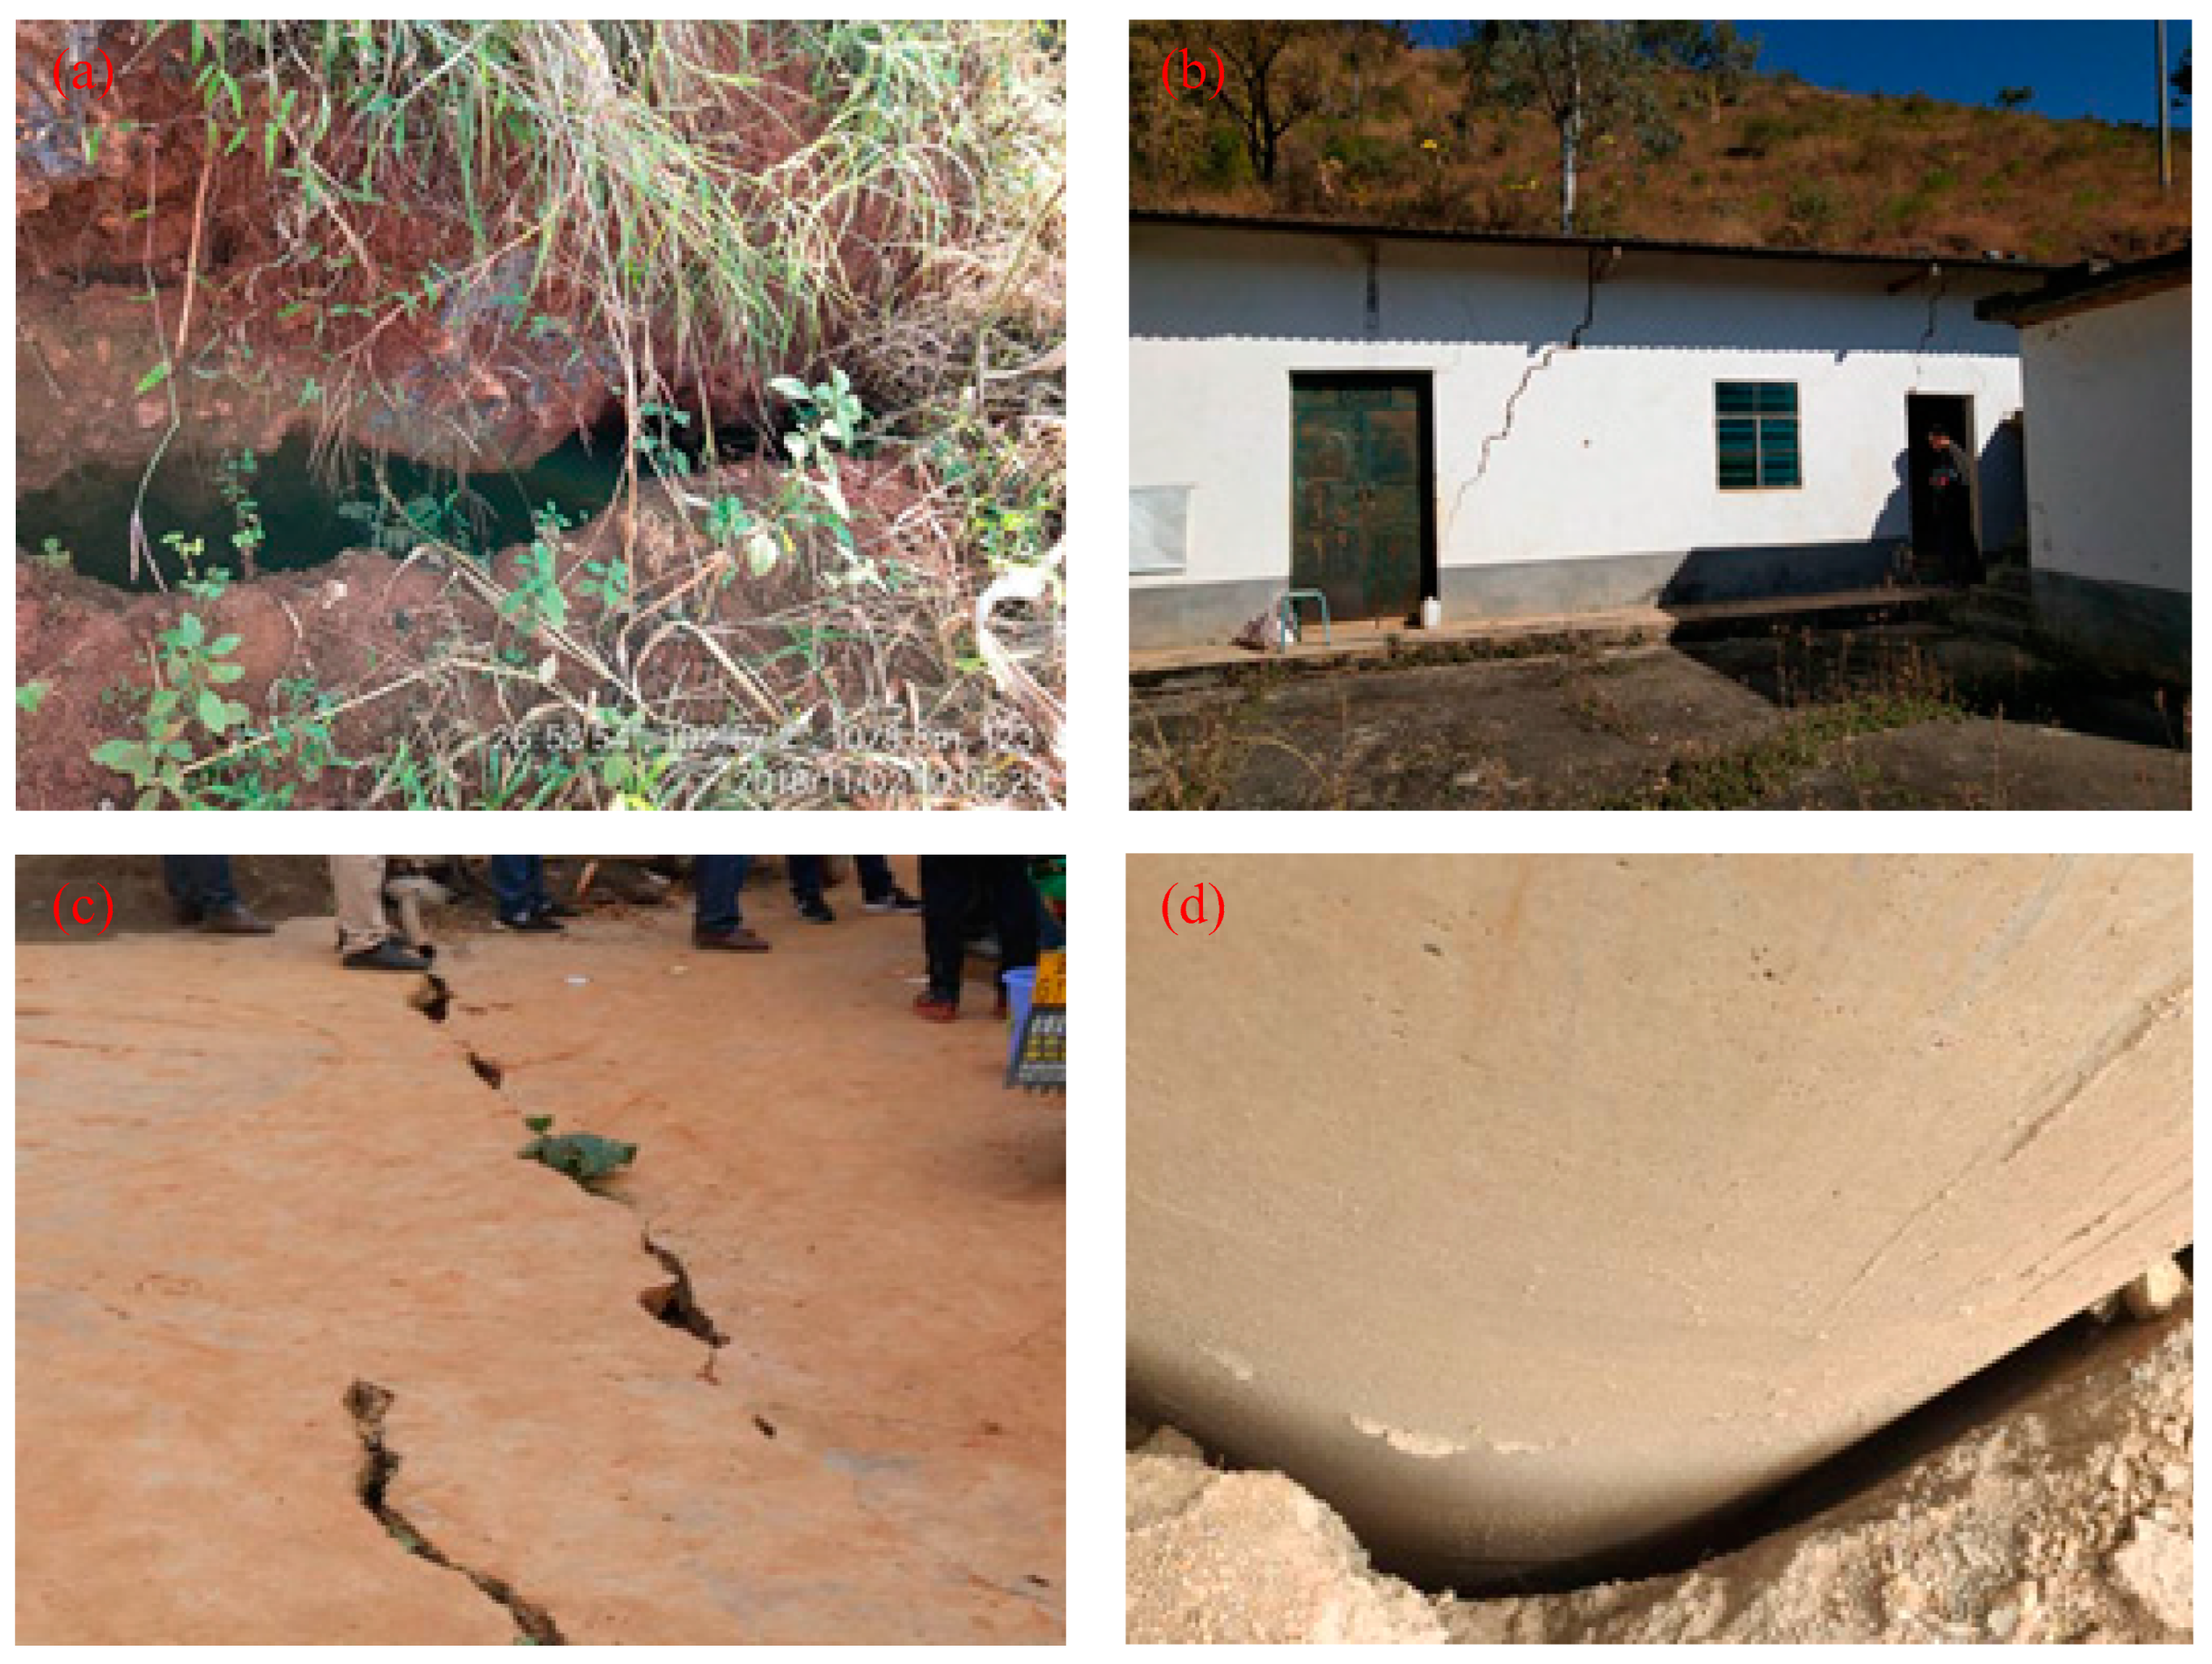
2.3. Deformation of Slope

The tension cracks at the rear edge of the slope (Figure 4a) are 0.1~0.5 m wide, with a visible depth of around 2 m and a large dip angle and deep development to the weak mudstone. The surface cracks on the left side of the slope are approximately 220 m long and 0.1~0.2 m wide. The deformation of the slope has caused shear cracks in the wall of a house (Figure 4b). The cracks on the right boundary of the slope are around 25 m long, and there are shear cracks on the ground in nearby residential buildings (Figure 4c). As part of the pier in the expressway is located in the front of the slope, there are 2~3 cm visible cracks between the soil and pier (Figure 4d). There are no deformation cracks or shear expansion on the front edge of the slope, so it was judged that the middle and rear parts of the slope were deformed as a whole, the sliding zone was not fully penetrated, and the slope was in the creeping slip stage.

3. Numerical Simulation of Slope

3.1. Numerical Modeling

FLAC has a great advantage in simulating the large deformation of slopes and has various constitutive models for geotechnical material and structural elements, which can be used to successfully simulate static and dynamic responses to geotechnical engineering problems. Based on this, nonlinear time history analysis of a numerical model for slopes is performed using the FLAC program in this study. In the numerical simulation of slope stability, the sliding between geotechnical bodies is dominant, and lateral interaction is relatively minor. As such, a 2D numerical model using the FLAC program is created in this study. Four typical cross-sections (Figure 2) are selected to perform the slope stability analysis. According to a 3-3′ cross-section (Figure 5), Figure 6 illustrates the created 2D numerical model of the slope. The maximum size of the grid mesh is 1.5 m to ensure the accuracy of seismic wave propagation in this model [38]. In Figure 6, there are three recorded points, i.e., locations 1, 2, and 3. The colors in the picture are used to distinguish the types of soil materials. The Mohr–Coulomb elastoplastic strength criterion was adopted in the numerical simulation. The Mohr–Coulomb strength criterion is commonly used in the calculation of soil or rock mass [39]. Relevant parameters are easily available from the engineering geological investigation report. The model parameters were finally determined according to the engineering geological investigation report of the Bainigou slope, summarized in Table 1.
The boundary and loading conditions are implemented through the following stages:
(1)
In the stage of static analysis, the horizontal and vertical degrees of freedom (DOFs) of the bottom boundary for the model are fixed, and the horizontal and vertical DOFs of the lateral boundary for the model are fixed and free, respectively.
(2)
In the stage of dynamic analysis, as seismic motion is applied at the bottom of the model in the form of a stress time history, a quiet boundary is adopted at the bottom of the model, and a free field boundary is adopted at the lateral boundary of the model. Considering that Rayleigh damping can approximately reflect the frequency independence of rock and soil materials [38], the Rayleigh damping of 5% proportional mass and stiffness is selected.
(3)
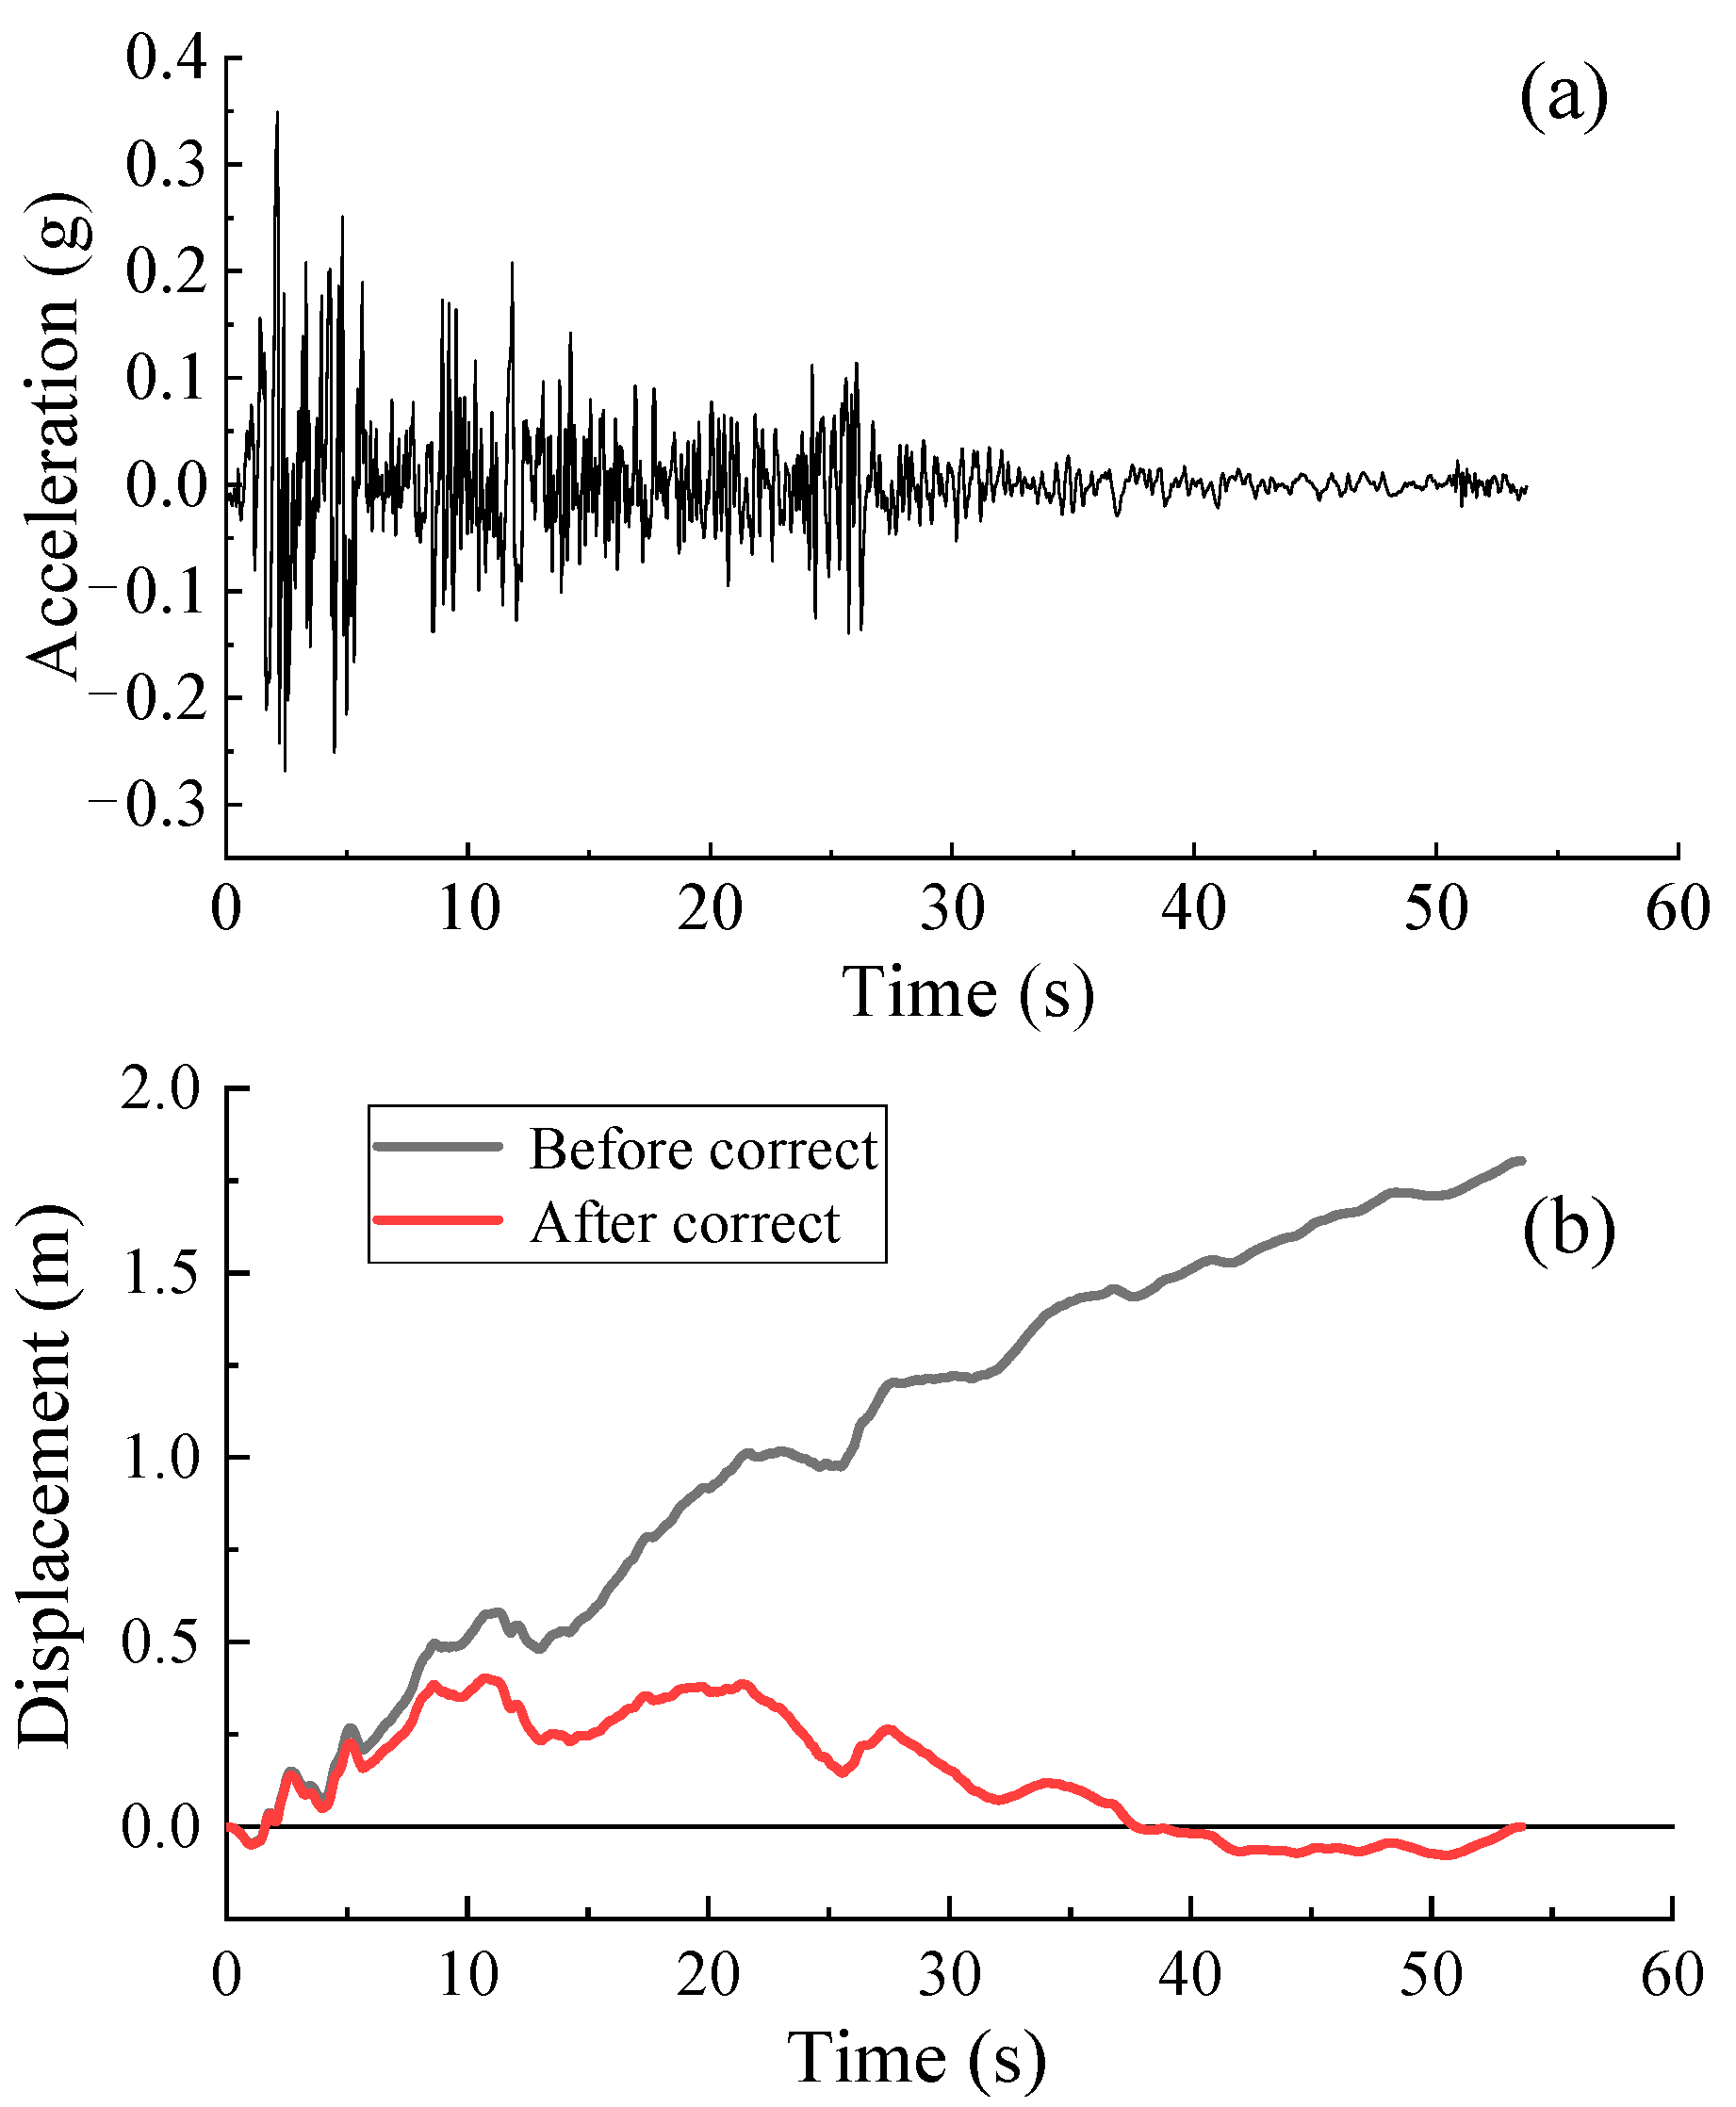
The typical earthquake ground motion of the El Centro, California Imperial Valley earthquake of 18 May 1940 is selected, and such an earthquake was induced by a strike–slip fault. The NS component of the El Centro (1940) earthquake is used for seismic motion, as shown in Figure 7a. The duration of this motion is 53.7 s, and the maximum acceleration is 0.39 g, which occurred at 2.2 s. Before inputting seismic motion, a baseline correction needed to be carried out to convert seismic motion from acceleration to stress; meanwhile, we ensured that the final displacement of seismic motion was 0. Finally, the stress time history is imparted to the bottom of the model. Figure 7b illustrates the displacement time histories of seismic motion before and after correction.

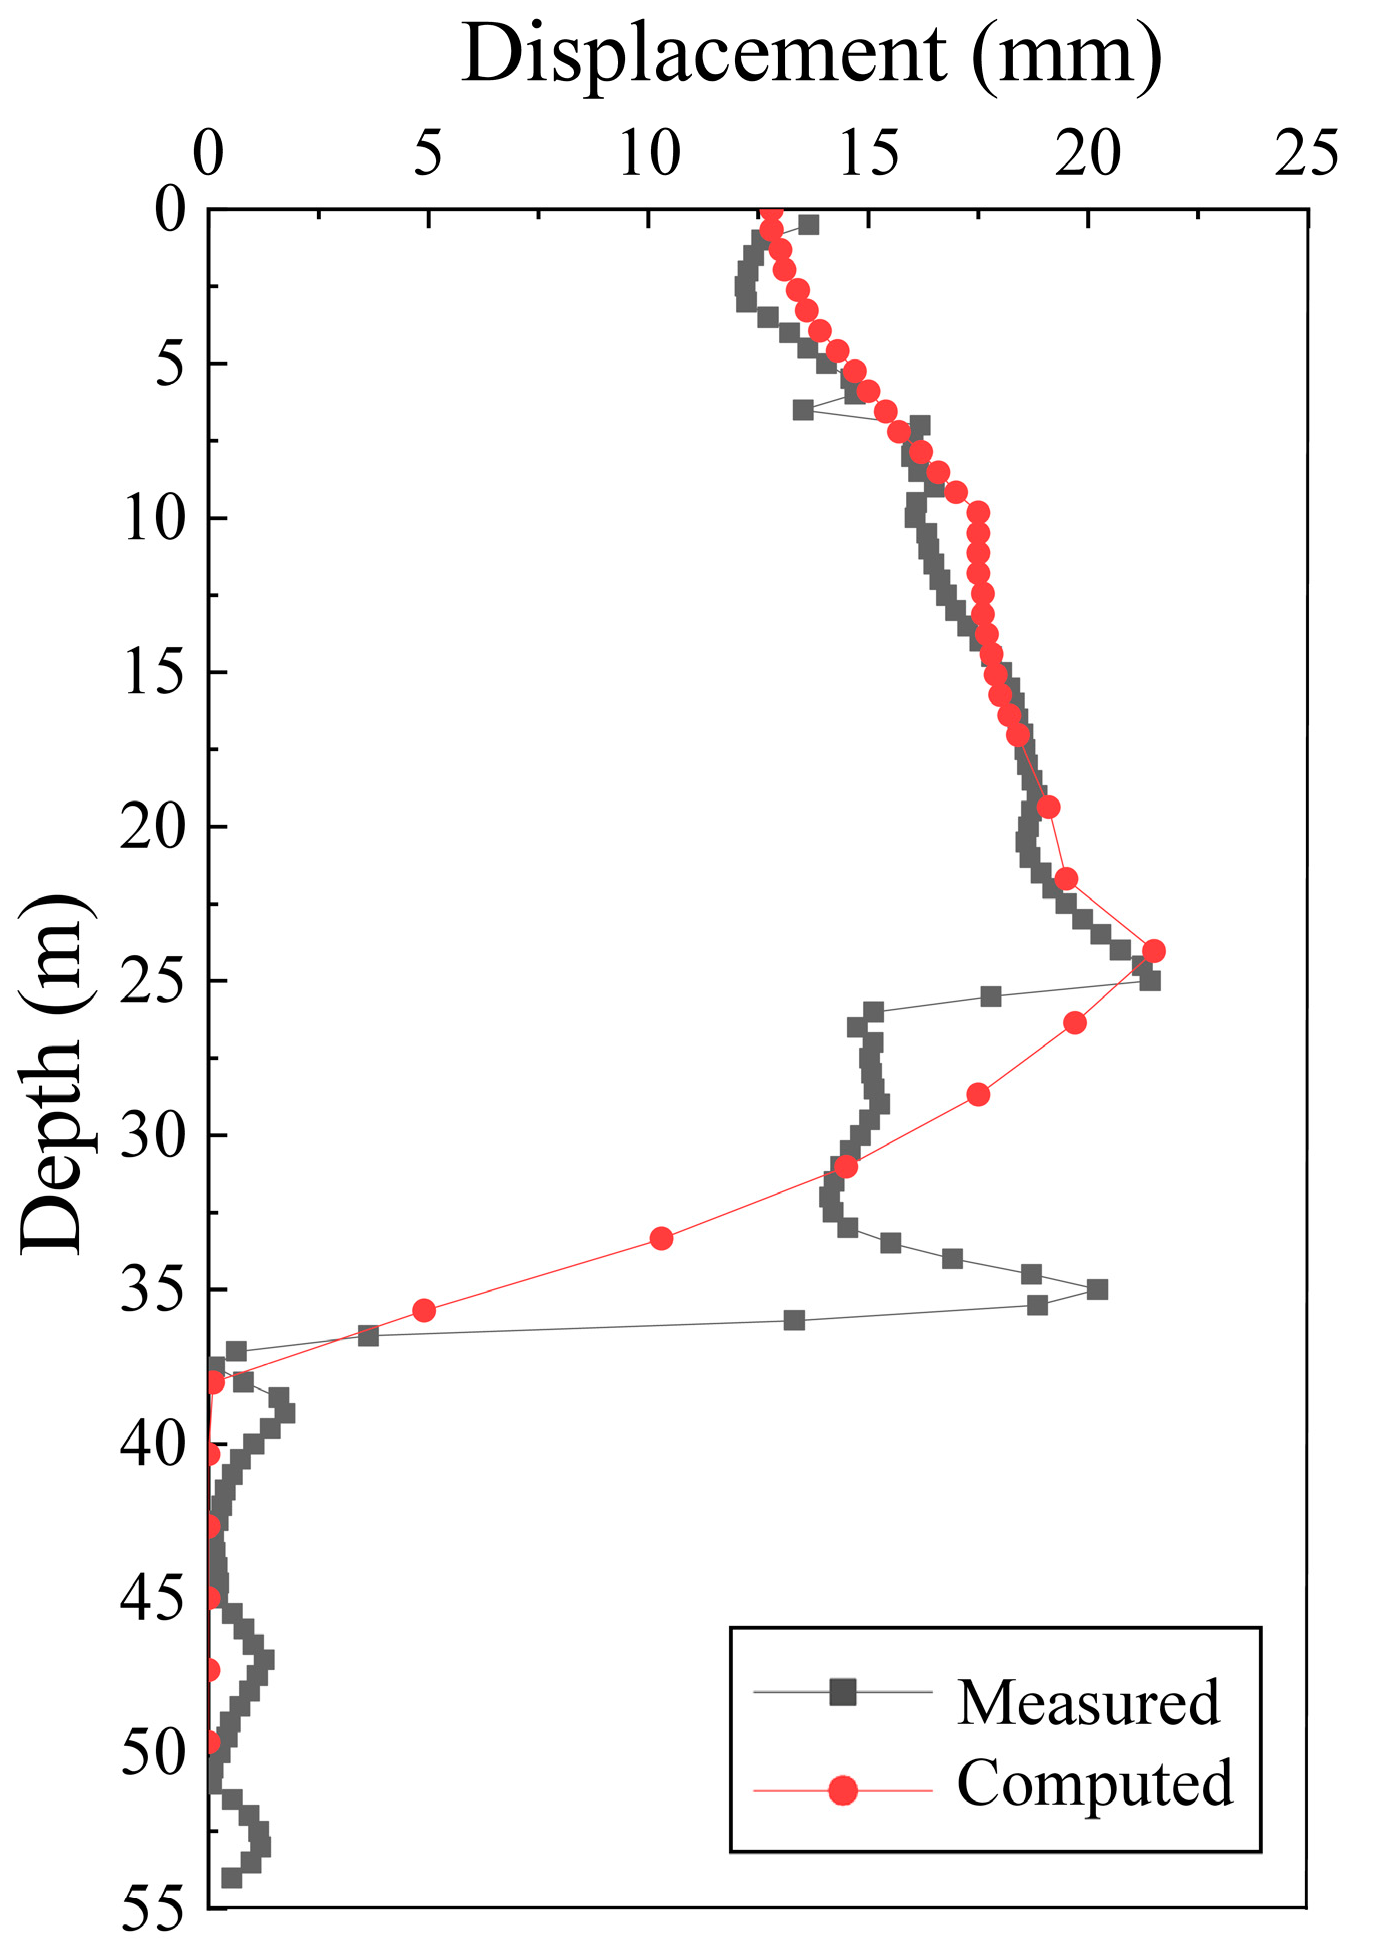
3.2. Validation of Numerical Model

To ensure that the established numerical model can reasonably reproduce the deformation characteristics of the slope, the field deep hole monitoring data are used to verify the reliability of the numerical model in this study. Figure 8 displays the comparison of the field-measured horizontal displacement of a typical hole (XZK16, shown in Figure 5) in the 3-3’ cross-section and the computed horizontal displacement at the corresponding position in the numerical model. From this figure, the measured and computed displacements at a 0~25 m depth present a consistent trend. The measured displacement is different from the computed one at a 25~37 m depth. The measured and computed displacements are both very small below a 37 m depth. On the whole, the trend of the measured and computed displacements is consistent along the depth. This indicates that the established numerical model based on the Mohr–Coulomb strength criterion can reproduce the response of the slope and be used to perform the analysis of slope stability under different conditions.

4. Computed Response before Treatment

Figure 9 illustrates the contour of the slope response including the horizonal displacement and maximum shear strain increment before treatment under different conditions. From Figure 9a, the horizontal displacement contour shows that there is obvious sliding on the slope surface. Obvious shear strain drives the shear deformation of the sliding zone and leads the sliding body to move forward as a whole under natural conditions. The phenomenon mentioned above may be explained through the following. The stress concentration causes damage and promotes failure progress. The damage characteristic is a key factor that causes the failure of geotechnical engineering. The same comment can be made about Li et al. [40] and Zhang et al. [41]. According to the horizontal displacement of the sliding body, it can be significantly divided into three deformation zones, including the rear part, middle part, and front part. Accordingly, the displacement of each part is 0.04~0.06 m, 0.06~0.08 m, and 0.08~0.1 m, respectively. The displacement increases gradually from the rear to the front, which reflects the displacement accumulation of the sliding body. The maximum displacement of the slope occurs near the quarry slope (Figure 5), and the displacement is more than 0.1 m, which indicates that there may be a shallow landslide herein. The obviously larger shear strain is observed near the shallow sliding zone, which is not completely penetrated. The contours of the horizontal displacement and maximum shear strain increment of the model at the end of shaking are shown in Figure 9b. From Figure 9b, an obvious relative displacement between the sliding body and sliding bed is observed, and the displacement of the sliding bed is almost 0, which reflects that the sliding body has an overall sliding trend. Compared with the natural conditions, the displacement of the sliding body still increases gradually from the rear part to the front part. The displacement increases from 3~4 m to 4~5 m in a smaller zone of the rear sliding body, and the displacement in most zones of the sliding body is 5~6 m. The maximum shear strain increment distributes along the sliding surface, and the maximum shear strain increment in the front and rear sections of the sliding zone is larger than that in the middle section. In brief, the displacement and maximum shear strain increment under seismic conditions are much greater than that under natural conditions, which reflects that the earthquake weakens greatly the stability of the slope.

5. Computed Response after Treatment

5.1. Treatment Measures

According to the computed response before treatment above, the necessary treatment measures should be employed to prevent slope sliding and improve slope stability. As the depth of the sliding surface reaches approximately 20 m, the sliding force is very large. As such, various treatment measures are applied to enhance the slope stability, including excavation in the slope top, and anti-slide piles and anchor cables in the slope toe, as shown in Figure 5. The excavation in the slope top may obviously reduce the sliding force. This excavation is divided into four parts, and the slope rate for every part is 1:1.25. Except for the slope top, the slope height of every part is 15 m, with a platform width of 5 m. The anti-slide piles are installed in the inner side of the expressway to resist the slope sliding. The length of an anti-slide pile is 34 m, with an embedded depth of 11 m in the slide bed. As the quarry slope is very close to the expressway, four anchor cables are used to prevent the possible sliding of the quarry slope, with a 25-m-long anchor cable and a 10 m anchored section. The parameters of supporting structures are determined according to the references [42,43], as summarized in Table 2 and Table 3.

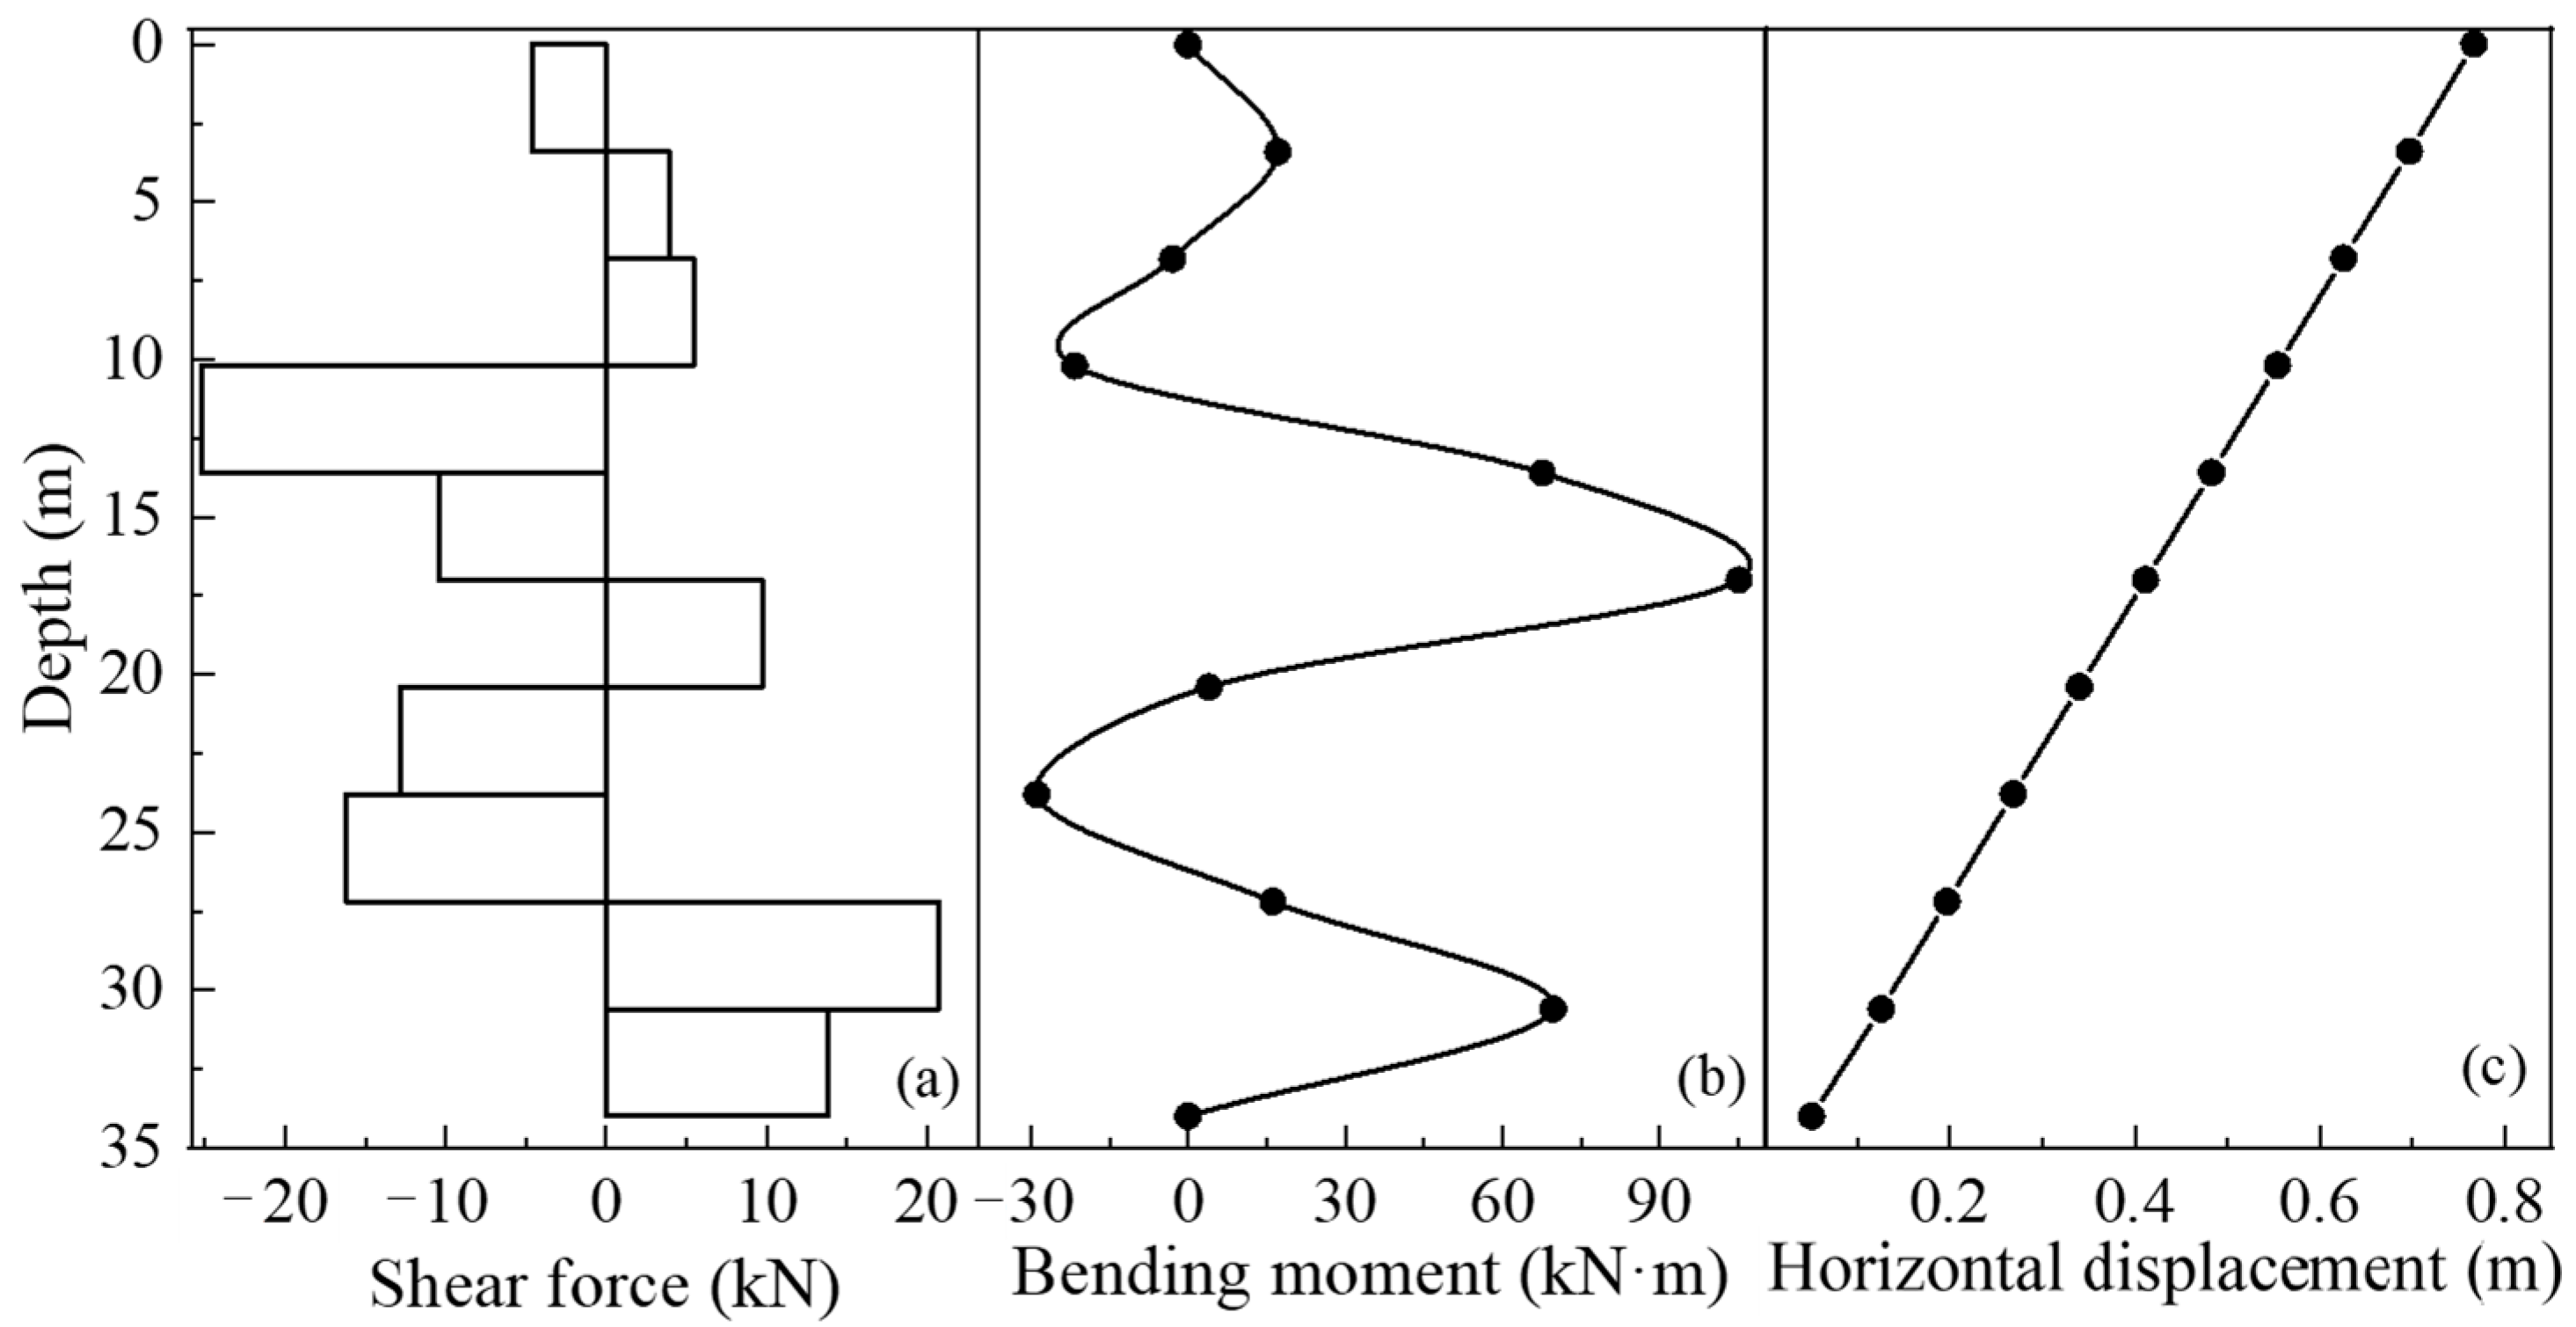
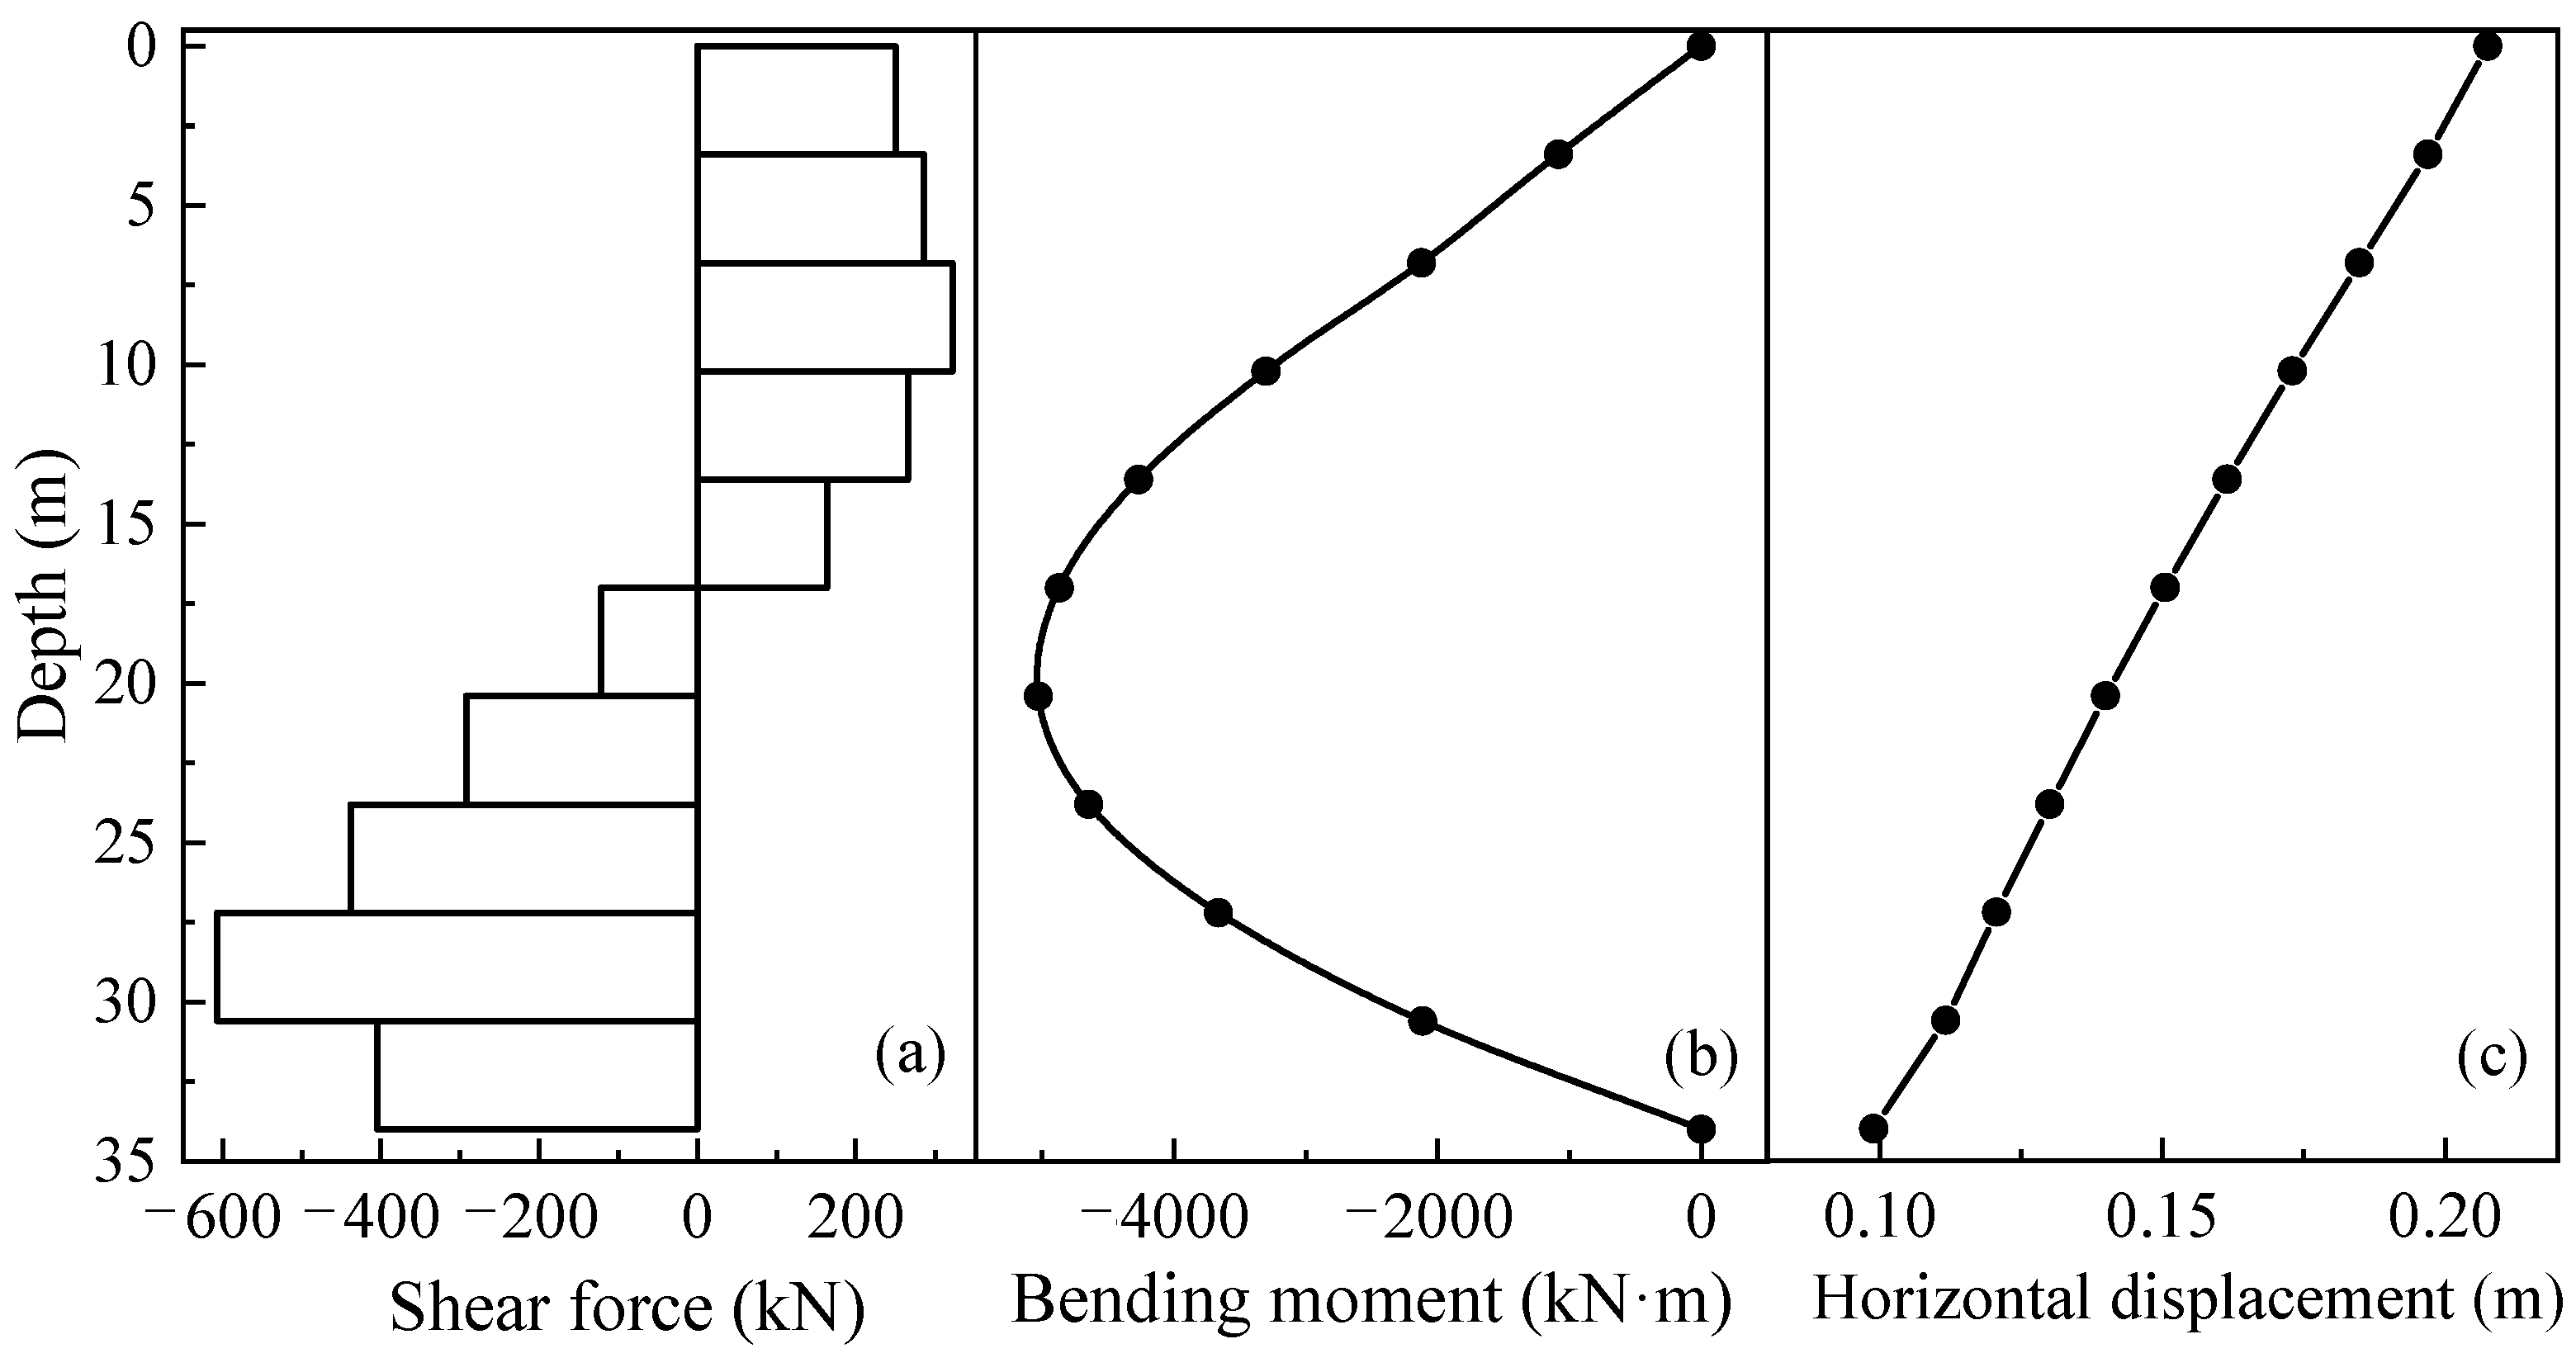
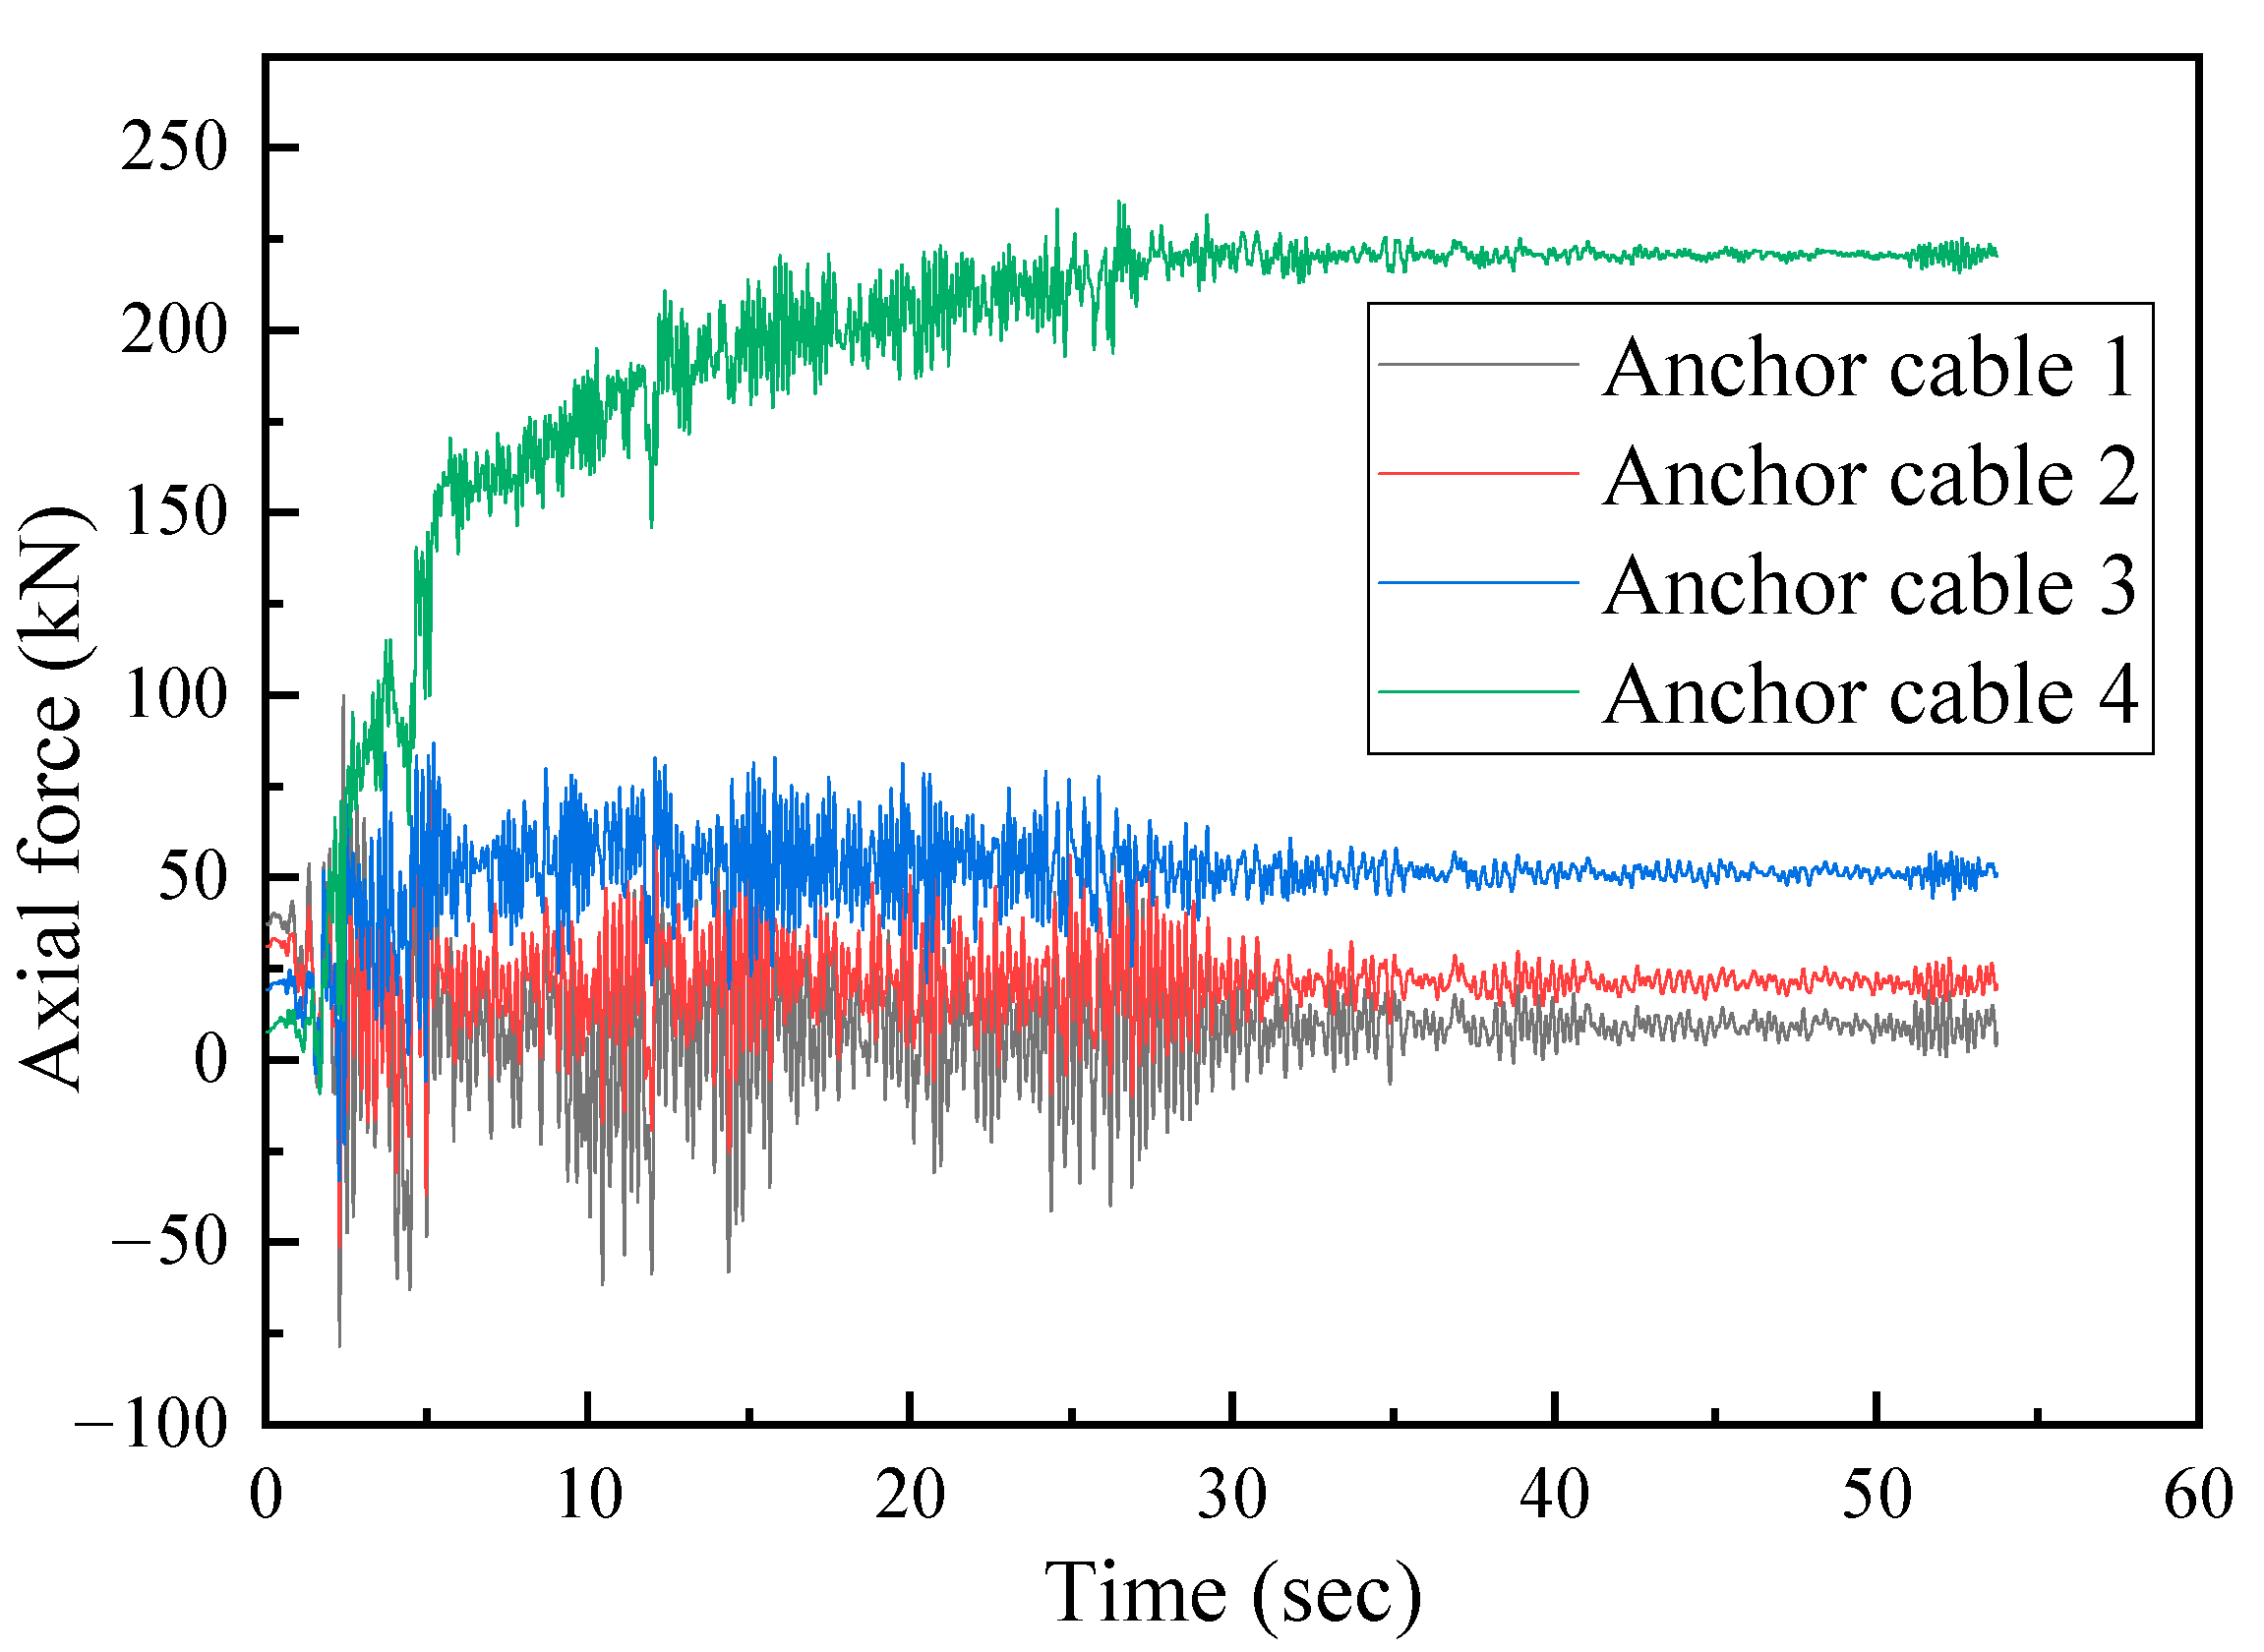
5.2. Response of Supporting Structures

Figure 10 illustrates the internal force response of the anti-slide pile at the end of shaking. In this figure, the shear force distribution of the anti-slide pile is complex, which can be related to the fact that it has passed through four soil layers with different properties. The maximum shear force on the anti-slide pile is 25.2 kN, which occurs in the upper half of the anti-slide pile. The maximum bending moment on the anti-slide pile reaches 105.2 kN·m. The smaller internal force on the anti-slide pile reflects that the excavation at the rear of the slope effectively reduces the sliding force of the slope to which the anti-slide pile is subjected. The reason is that the excavation treatment reduces the sliding mass and significantly improves the slope stability. The maximum displacement of the anti-slide pile is 0.8 m, which occurs at the top of the pile. The displacement of the anti-slide pile presents a linear state, which indicates that the anti-slide pile has not been damaged and maintains a good anti-slide capacity.
In fact, the seismic response on the anti-slide pile is constantly changing with time during shaking. By analyzing and comparing the internal force time histories on the anti-slide pile at different time steps, it is observed that the maximum shear force and bending moment on the anti-slide pile occur at around 2.5 s, which is essentially consistent with the time step of the maximum acceleration of input motion (t = 2.2 s, shown in Figure 7a). The slope may produce a huge sliding force at the time step of maximum acceleration, which leads to a larger internal force on the anti-slide pile. Furthermore, Figure 11 displays the seismic response on the anti-slide pile at t = 2.5 s. It is noted that the depth of the sliding surface is approximately 20 m. In Figure 11, the shear force on the anti-slide pile is divided into two parts by the sliding surface. The shear force in the upper part is mainly caused by the sliding mass, and the shear force in the lower part is caused by the anti-slide force provided by the embedded section of the anti-slide pile. The position of the sliding surface corresponds to the criticality of the shear force distribution. Therefore, the sliding force of the upper soil layers is effectively reduced by the anti-sliding pile. The maximum shear force on the anti-slide pile is 606 kN at the lower end of the pile. The maximum bending moment on the anti-slide pile is 5026 kN·m, which occurs at the sliding surface. The horizontal displacement of the anti-slide pile is relatively small, and the maximum displacement is 0.2 m. At this time step, the shear force and bending moment on the anti-slide pile are much larger than that at the end of shaking, as shown in Figure 10.
Four anchor cables are used to support the quarry slope, labeled as No. 1, 2, 3, and 4 from top to bottom (Figure 5). The axial force time histories of each anchor cable during shaking are shown in Figure 12. Note that the axial force of anchor cable No. 4 becomes gradually greater than that of other three anchor cables. Its axial force reaches 220.4 kN at the end of shaking. The reason is that anchor cable No. 4 is subjected to the largest sliding force. The variation in the axial force of the anchor cable is a crucial factor reflecting the stability of the slope. The same comment can be made about Sun et al. [44]. The local sliding of the slope can be suppressed by setting the anchor cable. The axial force of the four anchor cables gradually increases from top to bottom (i.e., from No. 1 to 4). This indicates that there may be a local sliding tendency at the bottom of the quarry slope.

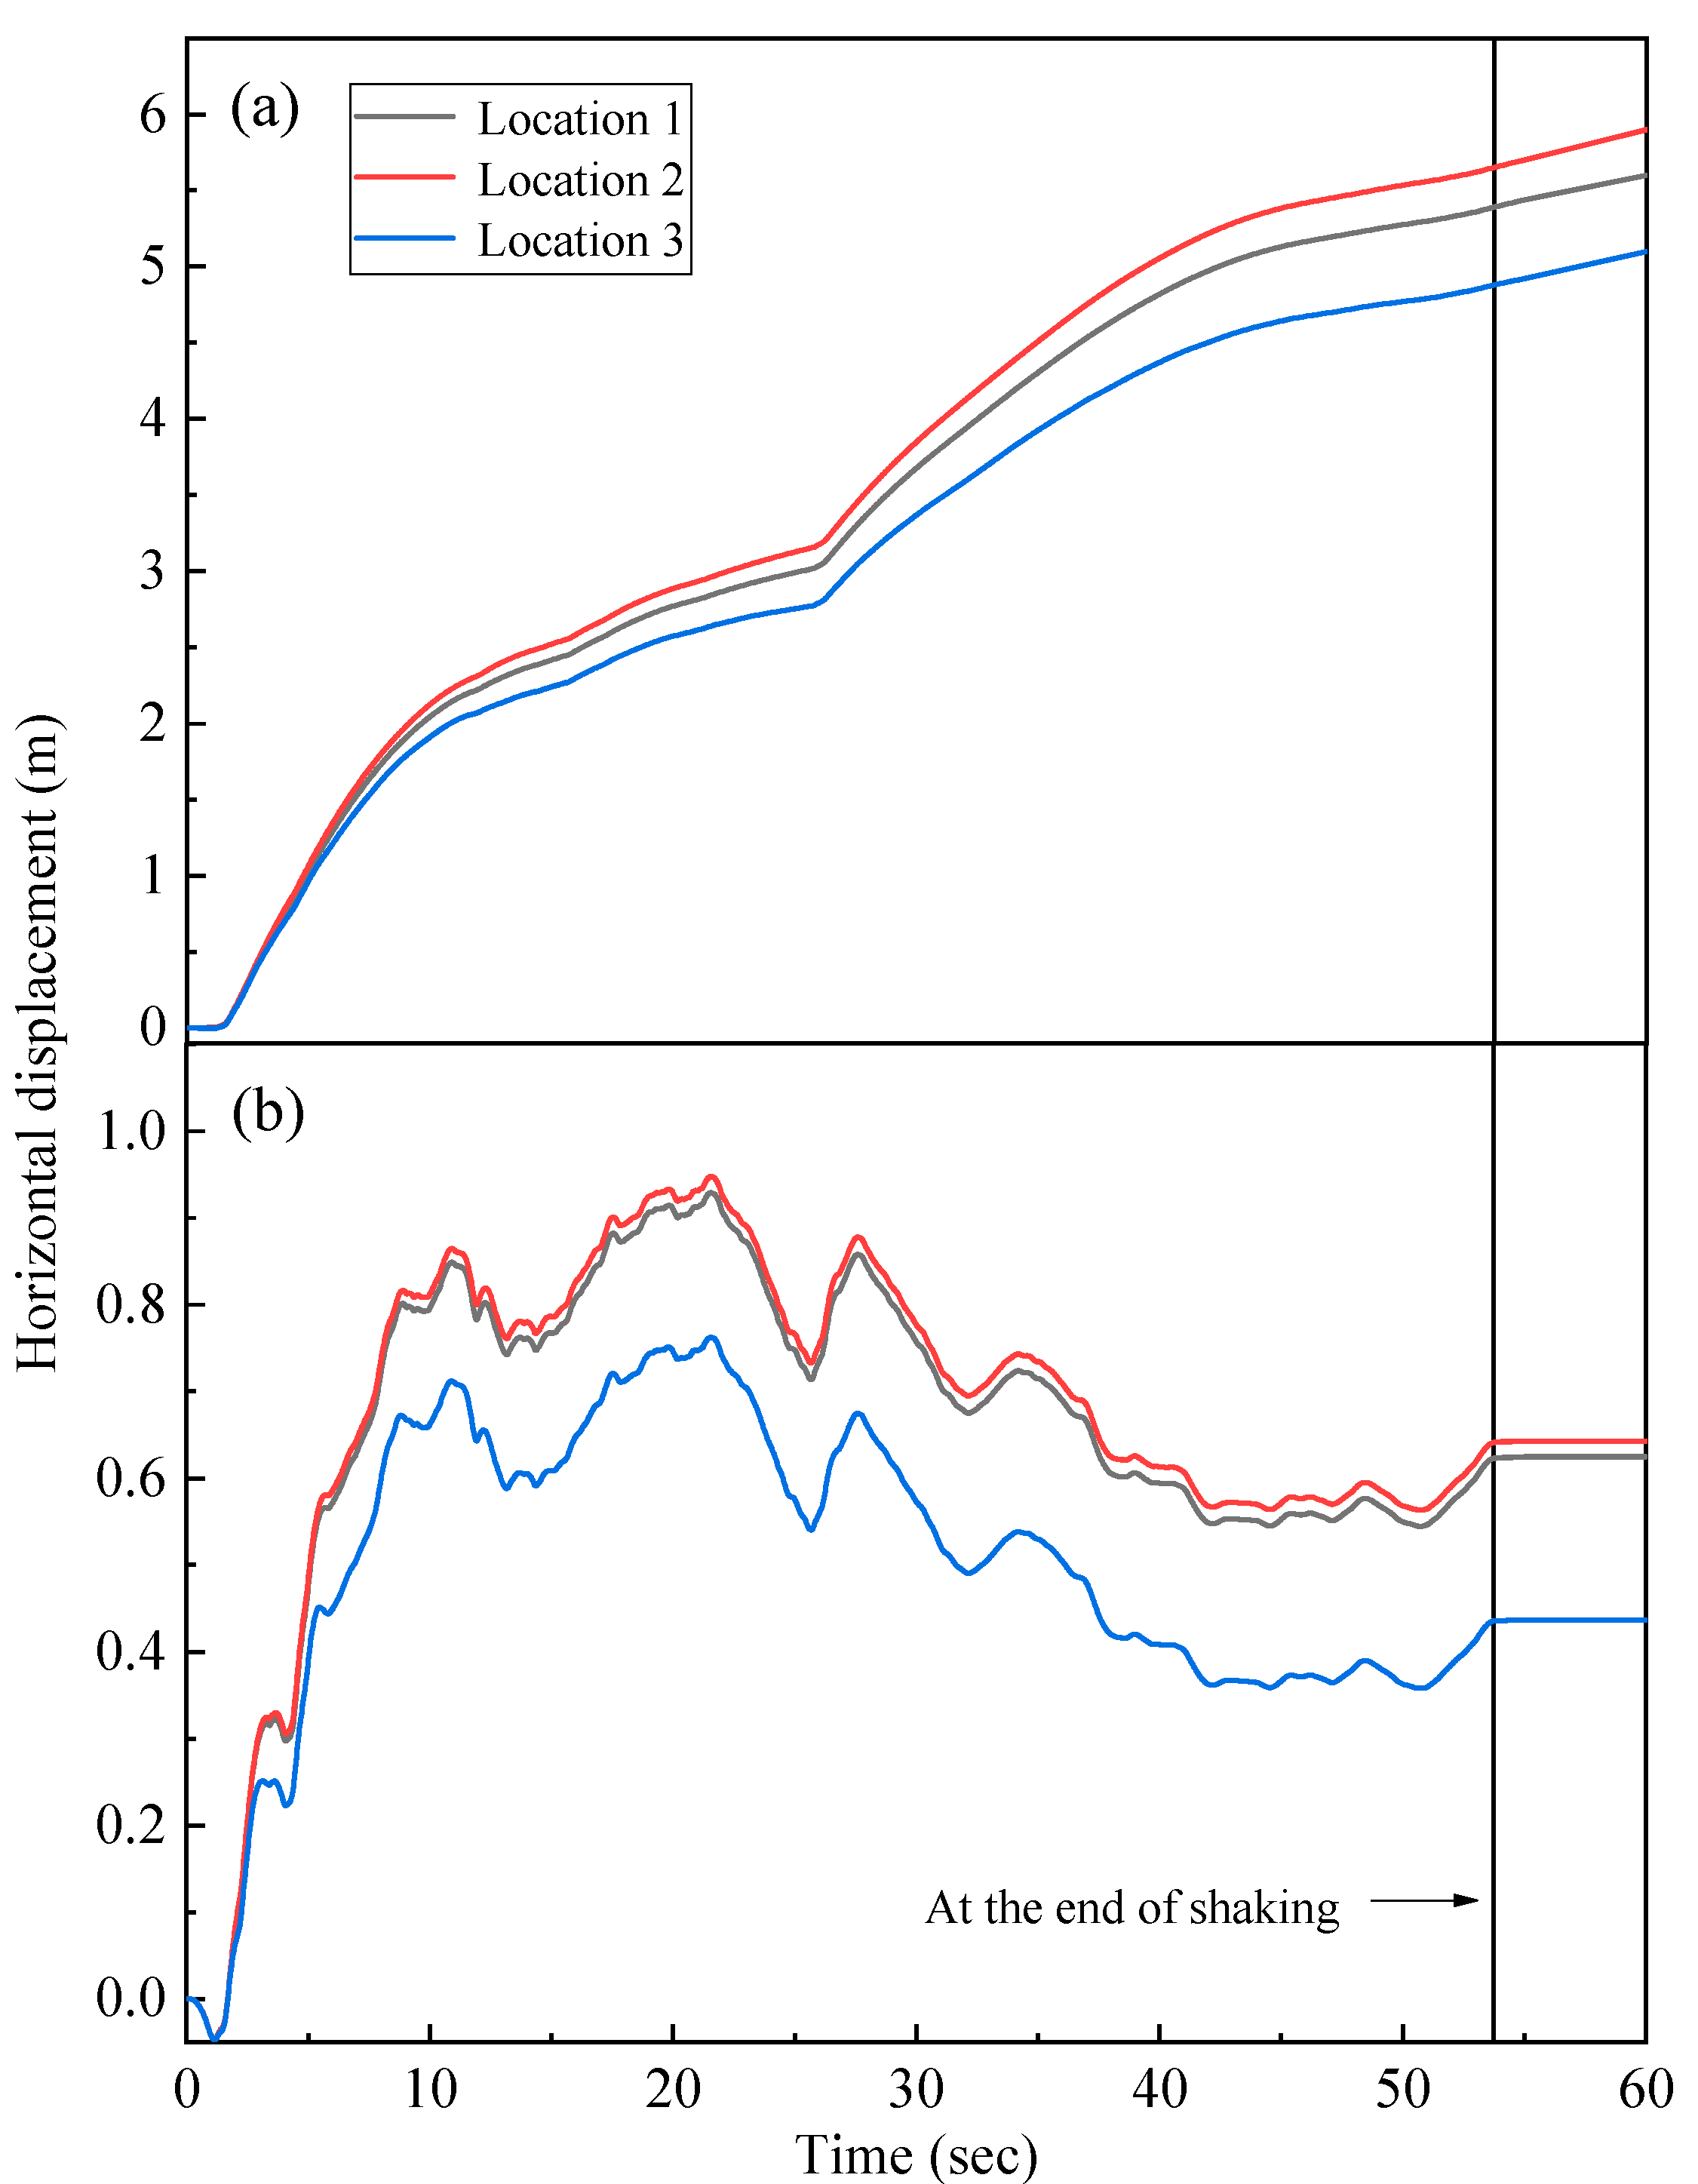
5.3. Response of Slope

The horizontal displacement and maximum shear strain increment of the model after treatment under seismic conditions are shown in Figure 13. For convenience, two typical time steps (t = 2.5 s for maximum internal force on anti-slide pile and t = 53.7 s for the end of shaking) are selected to analyze the slope response during an earthquake. From Figure 13a, the whole sliding body presents a consistent displacement. The maximum displacement occurs at the quarry slope. The maximum shear strain increment distributes along the sliding surface, but does not completely penetrate. The displacement and maximum shear strain increment noticeably decrease compared with the computed response before treatment (Figure 9b), which also indicates that the treatment measures are effective. The slope response at t = 2.5 s after treatment is shown in Figure 13b. Overall, the displacement and maximum shear strain increment at t = 2.5 s are obviously smaller than that at t = 53.7 s. This indicates that the slope is more unstable at the end of the shaking.
Figure 14 demonstrates the displacement time histories for three recorded locations before and after treatment. Before treatment, the displacement at the three recorded locations continues to increase during the earthquake and there are no fluctuations, which indicates that the slope is extremely unstable. The displacement at the three recorded locations continues to increase after the end of shaking, indicating that slope displacement does not converge. Combined with the maximum shear strain increment (Figure 9b), this indicates that the slope has produced obvious damage during the earthquake. After treatment, the displacement at the three recorded locations fluctuates with the input motion during the earthquake. After the end of shaking, the displacement at the three recorded locations remains constant and the displacement converges to a specific value. This reflects that the slope stability has been effectively enhanced and the slope is stable during seismic loading through the use of treatment measures.

6. Summary and Conclusions

A two-dimensional numerical model of the Bainigou slope is created using a finite difference program, FLAC, according to a typical section and the geological conditions in this study. The effectiveness of the created numerical model is verified based on in-situ recorded data. The response difference of the slope before and after treatment is explored, as well as the responses of supporting structures. As observed in this study, the following conclusions can be drawn:
(1)
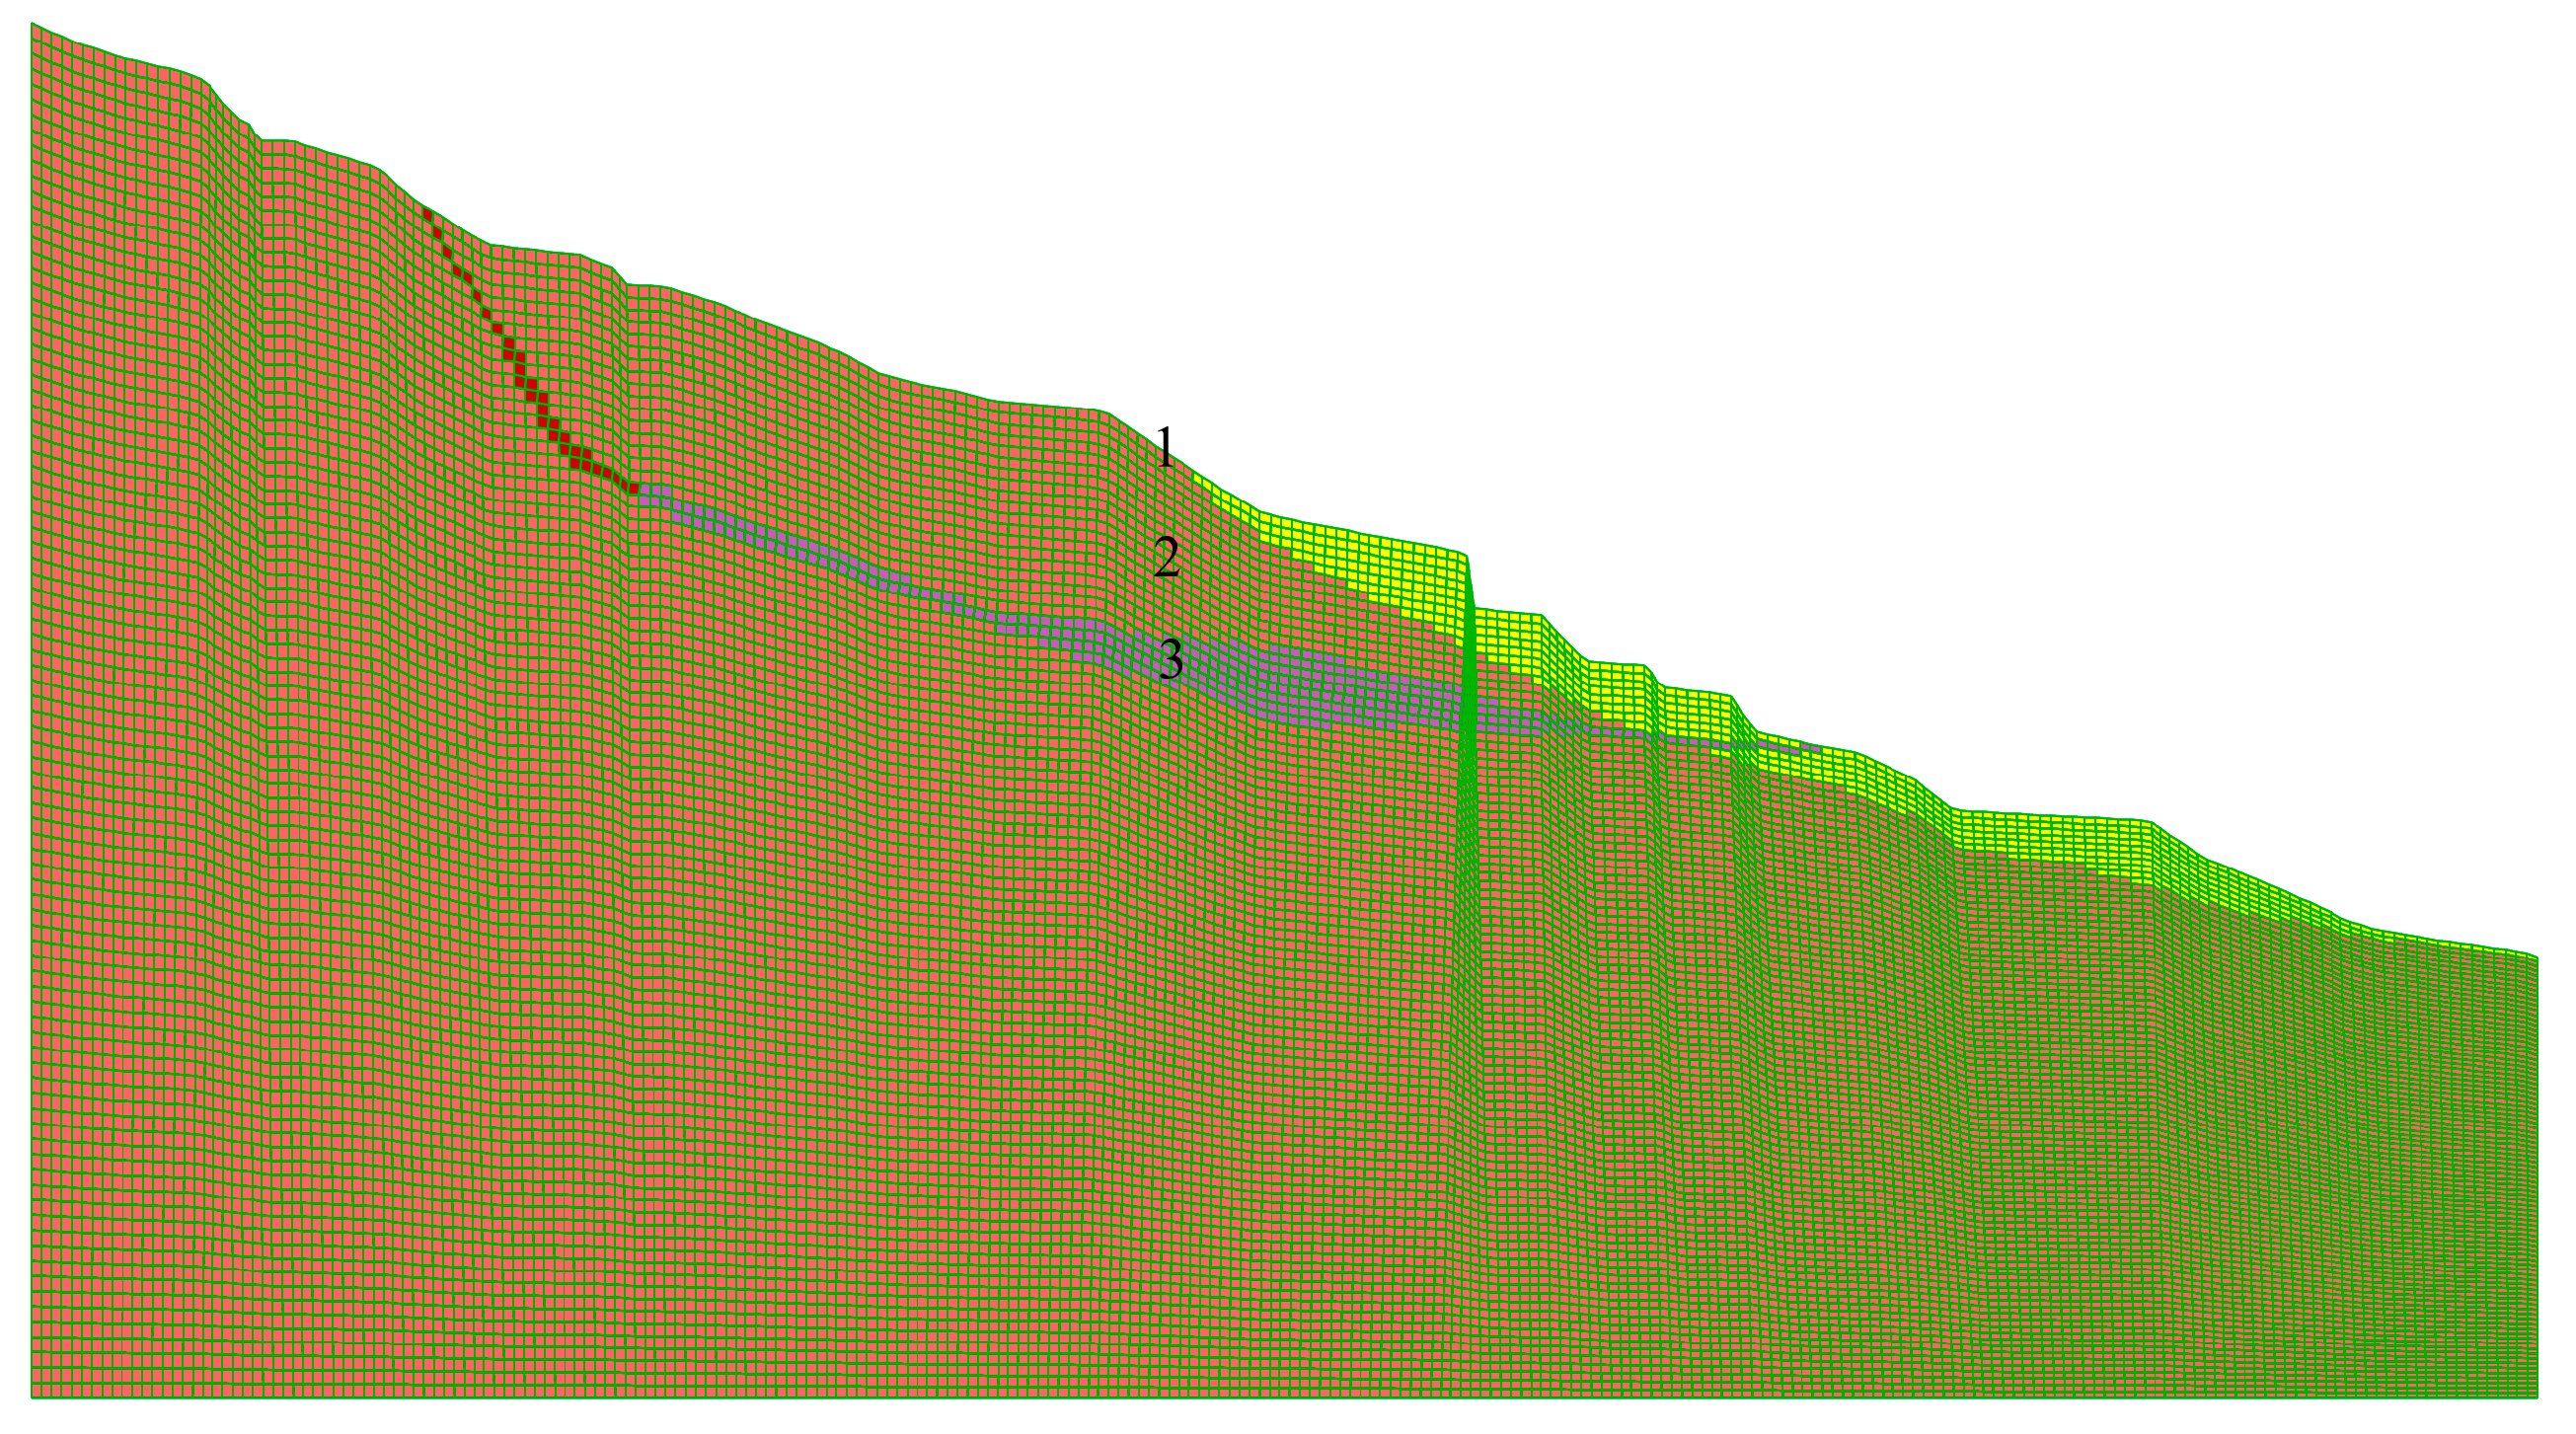
Under natural conditions, the displacement of the sliding body presents a cumulative phenomenon from the back edge to the front edge, and the maximum shear strain increment distributes along the sliding surface, but does not penetrate.
(2)
The stability of the slope is greatly influenced by the earthquake, and the three treatment measures improve effectively the stability of the slope after comparing the response of the slope before and after treatment. The slope after treatment is stable according to the displacement time histories of recorded points.
(3)
The shear force and bending moment on the anti-slide pile should be closely related to the intensity of the input earthquake motion, and the displacement of the anti-slide pile depends on the sliding displacement of the slope. The smaller shear force and bending moment on the anti-slide pile indicate that the excavation effectively reduces the sliding force of the slope at the end of shaking.
(4)
The axial force of four anchor cables presents an obvious change before shaking and at the end of shaking, which indicates that there may be a local sliding risk near the quarry slope.
(5)
The parameters of excavation and supporting structures in this study are all specified values, and the influence of changing the parameters on the slope stability is not considered. Therefore, the next investigation will mainly focus on improving the slope stability via parameter optimization and comparing the treatment effects of different measures.
(6)
In this study, only one seismic motion is selected in the dynamic analysis of the model, so the influence of different frequencies and amplitudes can be explored in the next slope stability investigation by selecting multiple seismic motions.

Author Contributions

Conceptualization, X.L.; Methodology, L.S.; Software, L.Z.; Validation, W.S.; Formal analysis, D.Z.; Investigation, Z.W.; Data curation, L.Z.; Writing—original draft, L.Z.; Writing—review & editing, L.S. All authors have read and agreed to the published version of the manuscript.

Funding

This study is funded by the National Key R&D Program of China (2018YFC1505304) and the National Natural Science Foundation of China (42072310 and 51808307). Data for this study were provided by Xi’an China Highway Geotechnical Engineering Co., Ltd. This support is gratefully acknowledged.

Data Availability Statement

All data or models used for this study are available from the corresponding author upon reasonable request.

Conflicts of Interest

The authors certify that they have no affiliations with or involvement in any organization or entity with any financial interest or non-financial interest in the subject matter or materials discussed in this manuscript.

References

  1. Jagodnik, V.; Arbanas, Z. Cyclic behaviour of uniform sand in drained and undrained conditions at low confining stress in small-scale landslide model. Sustainability 2022, 14, 12797. [Google Scholar] [CrossRef]
  2. Fan, X.; Scaringi, G.; Xu, Q.; Zhan, W.; Dai, L.; Li, Y.; Pei, X.; Yang, Q.; Huang, R. Coseismic landslides triggered by the 8th August 2017 Ms 7.0 Jiuzhaigou earthquake (Sichuan, China): Factors controlling their spatial distribution and implications for the seismogenic blind fault identification. Landslides 2018, 15, 967–983. [Google Scholar] [CrossRef]
  3. Cui, Y.; Bao, P.; Xu, C.; Ma, S.; Zheng, J.; Fu, G. Landslides triggered by the 6 September 2018 Mw 6.6 Hokkaido, Japan: An updated inventory and retrospective hazard assessment. Earth Sci. Inform. 2021, 14, 247–258. [Google Scholar] [CrossRef]
  4. Shi, Z.; Xiong, X.; Peng, M.; Zhang, L.M.; Xiong, Y.F.; Chen, H.X.; Zhu, Y. Risk assessment and mitigation for the Hongshiyan landslide dam triggered by the 2014 Ludian earthquake in Yunnan, China. Landslides 2016, 14, 269–285. [Google Scholar] [CrossRef]
  5. Luo, J.; Pei, X.J.; Evans, S.G.; Huang, R.Q. Mechanics of the earthquake-induced Hongshiyan landslide in the 2014 Mw 6.2 Ludian earthquake, Yunnan, China. Eng. Geol. 2019, 251, 197–213. [Google Scholar] [CrossRef]
  6. Chigira, M.; Wu, X.Y.; Inokuchi, T.; Wang, G.H. Landslides induced by the 2008 Wenchuan earthquake, Sichuan, China. Geomorphology 2010, 118, 225–238. [Google Scholar] [CrossRef]
  7. Dai, F.; Tu, X.; Xu, C.; Gong, Q.; Yao, X. Rock avalanches triggered by oblique-thrusting during the 12 May 2008 Ms 8.0 Wenchuan earthquake, China. Geomorphology 2011, 132, 300–318. [Google Scholar] [CrossRef]
  8. Yuan, R.M.; Tang, C.L.; Hu, J.C.; Xu, X.W. Mechanism of the Donghekou landslide triggered by the 2008 Wenchuan earthquake revealed by discrete element modeling. Nat. Hazards Earth Syst. Sci. 2014, 14, 1195–1205. [Google Scholar] [CrossRef] [Green Version]
  9. Song, Y.; Huang, D.; Cen, D. Numerical modelling of the 2008 Wenchuan earthquake-triggered Daguangbao landslide using a velocity and displacement dependent friction law. Eng. Geol. 2016, 215, 50–68. [Google Scholar] [CrossRef]
  10. Ren, Z.K.; Zhang, Z.Q.; Zhang, H.P.; Zheng, W.J.; Zhang, P.Z. The role of the 2008 Mw 7.9 Wenchuan earthquake in topographic evolution: Seismically induced landslides and the associated isostatic response. Tectonics 2018, 37, 2748–2757. [Google Scholar] [CrossRef]
  11. Zhou, S.; Fang, L.; Liu, B. Slope unit-based distribution analysis of landslides triggered by the April 20, 2013, Ms 7.0 Lushan earthquake. Arab. J. Geosci. 2015, 8, 7855–7868. [Google Scholar] [CrossRef]
  12. Cheng, H.; Zhou, J.; Chen, Z.; Huang, Y.A. comparative study of the seismic performances and failure mechanisms of slopes using dynamic centrifuge modeling. J. Earth Sci. 2021, 32, 1166–1173. [Google Scholar] [CrossRef]
  13. Xu, R.; Zhang, S.; Li, Z.; Yan, X. Experimental investigation of the strain rate effect on crack initiation and crack damage thresholds of hard rock under quasi-static compression. Acta Geotech. 2023, 18, 903–920. [Google Scholar] [CrossRef]
  14. Jing, J.; Wu, Z.; Yan, W.; Ma, W.; Liang, C.; Lu, Y.; Chen, D. Experimental study on progressive deformation and failure mode of loess fill slopes under freeze-thaw cycles and earthquakes. Eng. Geol. 2022, 310, 106896. [Google Scholar] [CrossRef]
  15. Kim, Y.A.; Lee, H.I.; Ko, K.W.; Kwon, T.H. Centrifuge modeling and analytical validation of seismic amplification in a slope during earthquakes–implications to seismic slope stability analysis. Soil Dyn. Earthq. Eng. 2022, 163, 107502. [Google Scholar] [CrossRef]
  16. Tan, W.; Huang, Q.; Chen, X. Physical model test on the interface of loess fill slope. Land 2022, 11, 1372. [Google Scholar] [CrossRef]
  17. Yang, B.; Hou, J.; Zhou, Z.; Gou, J. Failure behavior and mechanism of a slope under the action of earthquake after rainfall. Nat. Hazards 2023. [Google Scholar] [CrossRef]
  18. Wang, L.Q.; Yin, Y.P.; Zhang, Z.H.; Huang, B.L.; Wei, Y.G.; Zhao, P.; Hu, M.J. Stability analysis of the Xinlu Village landslide (Chongqing, China) and the influence of rainfall. Landslides 2019, 16, 1993–2004. [Google Scholar] [CrossRef]
  19. Liu, X.; Wang, Y.; Li, D.Q. Numerical simulation of the 1995 rainfall-induced Fei Tsui Road landslide in Hong Kong: New insights from hydro-mechanically coupled material point method. Landslides 2020, 17, 27–277. [Google Scholar] [CrossRef]
  20. Xu, J.; Ueda, K.; Uzuoka, R. Numerical modeling of seepage and deformation of unsaturated slope subjected to post-earthquake rainfall. Comput. Geotech. 2022, 148, 104791. [Google Scholar] [CrossRef]
  21. Gao, G.; Meguid, M.A.; Chouinard, L.E.; Zhan, W.W. Dynamic disintegration processes accompanying transport of an earthquake-induced landslide. Landslides 2020, 18, 909–933. [Google Scholar] [CrossRef]
  22. Wang, H.L.; Liu, S.Q.; Xu, W.Y.; Yan, L.; Qu, X.; Xie, W.C. Numerical investigation on the sliding process and deposit feature of an earthquake-induced landslide: A case study. Landslides 2020, 17, 2671–2682. [Google Scholar] [CrossRef]
  23. Cho, Y.; Rathje, E.M. Generic predictive model of earthquake-induced slope displacements derived from finite-element analysis. J. Geotech. Geoenviron.Eng. 2022, 148, 04022010. [Google Scholar] [CrossRef]
  24. Ye, S.; Shi, Y. Reliability analysis of slope reinforced by anchors under earthquake action. Soil Mech. Found. Eng. 2022, 59, 376–384. [Google Scholar] [CrossRef]
  25. Hwang, Y.W.; Rathje, E.M. Insights into seismic slope deformation patterns using finite element analysis. Soil Dyn. Earthq. Eng. 2023, 164, 107660. [Google Scholar] [CrossRef]
  26. Yan, G.Q.; Yin, Y.P.; Huang, B.L.; Zhang, Z.H.; Zhu, S.N. Formation mechanism and characteristics of the Jinjiling landslide in Wushan in the Three Gorges Reservoir region, China. Landslides 2019, 16, 2087–2101. [Google Scholar] [CrossRef]
  27. Wang, Z.; Shi, F.; Li, D.; Li, H. Tunneling-induced deep-seated landslides: A case study in Gulin County, Sichuan, China. Arab. J. Geosci. 2020, 13, 71–78. [Google Scholar] [CrossRef]
  28. Yang, Z.; Fan, X.; Yang, Y.; Hou, K.; Du, J.; Chen, X.; Mi, Y.; Jiang, C.; Zhang, J.; Guo, Y. Deformation patterns and failure mechanism of high and steep stratified rock slopes with upper steep and lower gentle style induced by step-by-step excavations. Environ. Earth Sci. 2022, 81, 229. [Google Scholar] [CrossRef]
  29. Yin, Y.; Li, B.; Wang, W. Dynamic analysis of the stabilized Wangjiayan landslide in the Wenchuan Ms 8.0 earthquake and aftershocks. Landslides 2015, 12, 537–547. [Google Scholar] [CrossRef]
  30. Ding, H.; Chen, J.; Song, L. The force analysis of anchor anti-slide pile in slope reinforcement under seismic load. Appl. Mech. Mater. 2015, 777, 148–153. [Google Scholar] [CrossRef]
  31. Lai, J.; Zheng, Y.; Liu, Y.; Li, X.; Liu, H. Seismic design of multiple anti-slide piles by strength reduction dynamics analysis method. Electron. J. Geotech. Eng. 2015, 20, 1725–1737. [Google Scholar]
  32. Zhang, M.; Yin, Y.P.; Huang, B.L. Mechanisms of rainfall-induced landslides in gently inclined red beds in the eastern Sichuan Basin, SW China. Landslides 2015, 12, 973–983. [Google Scholar] [CrossRef]
  33. Cheng, D.; Cui, Y.; Su, F.; Jia, Y.; Choi, C.E. The characteristics of the Mocoa compound disaster event, Colombia. Landslides 2018, 15, 1223–1232. [Google Scholar] [CrossRef] [Green Version]
  34. Lin, F.; Wu, L.Z.; Huang, R.Q.; Zhang, H. Formation and characteristics of the Xiaoba landslide in Fuquan, Guizhou, China. Landslides 2018, 15, 669–681. [Google Scholar] [CrossRef]
  35. Huang, Y.; Xu, X.; Mao, W. Numerical performance assessment of slope reinforcement using a pile-anchor structure under seismic loading. Soil Dyn. Earthq. Eng. 2020, 129, 105963. [Google Scholar] [CrossRef]
  36. Qiao, S.; Xu, P.; Teng, J.; Sun, X. Numerical study of optimal parameters on the high filling embankment landslide reinforced by the portal anti-slide pile. KSCE J. Civ. Eng. 2020, 24, 1460–1475. [Google Scholar] [CrossRef]
  37. Yang, X.; Diao, X.; Zhou, T.; Hu, F.; Wang, S. Study on the stability of accumulated layer landslide under the coupling action of earthquake and rainfall. KSCE J. Civ. Eng. 2023, 27, 98–108. [Google Scholar] [CrossRef]
  38. Itasca Consulting Group, Inc. FLAC (Fast Lagrangian Analysis of Continua); User’s Manual-Version 7.0; Itasca Consulting Group, Inc.: Minneapolis, MN, USA, 2011. [Google Scholar]
  39. Jong, D.Y.; Han, U.C.; Jang, U.J.; Ri, Y.N. Determination of safety factor for rock mass surrounding tunnel by sudden change of equivalent plastic strain in strength reduction method. Geotech. Geol. Eng. 2022, 40, 3493–3509. [Google Scholar] [CrossRef]
  40. Li, Z.; Liu, J.; Liu, H.; Zhao, H.; Xu, R.; Gurkalo, F. Stress distribution in direct shear loading and its implication for engineering failure analysis. Int. J. Appl. Mech. 2023. [Google Scholar] [CrossRef]
  41. Zhang, Z.; Li, Z.; Xu, G.; Gao, X.; Liu, Q.; Li, Z.; Liu, J. Lateral abutment pressure distribution and evolution in wide pillars under the first mining effect. Int. J. Min. Sci. Technol. 2023. [Google Scholar] [CrossRef]
  42. Xu, J.; Zheng, Y.; Ye, H.; Feng, X. Research of embedded anti-slide pile supporting slope during earthquake. Chin. J. Undergr. Space Eng. 2011, 7, 781–788. (In Chinese) [Google Scholar]
  43. Wu, R.; Zhou, H.; Hu, Y.; Li, P.; Zhong, Y. Research on distribution law of landslide thrust of anchored anti-slide pile base on FLAC3D. J. Disaster Prev. Mitig. Eng. 2013, 33, 548–555. (In Chinese) [Google Scholar]
  44. Sun, J.; Yu, T.; Dong, P. Pseudo-dynamic analysis of reinforced slope with anchor cables. Soil Dyn. Earthq. Eng. 2022, 162, 107514. [Google Scholar] [CrossRef]
Figure 1. Location of Bainigou slope.
Sustainability 15 05309 g001
Figure 2. Engineering geology of Bainigou slope.
Sustainability 15 05309 g002
Figure 3. Quarry near slope zone: (a) location of quarry; (b) quarry 1; (c) quarry 2; (d) quarry 3.
Sustainability 15 05309 g003
Figure 4. Visible cracks near slope: (a) tension cracks; (b) shear cracks in the wall; (c) shear cracks on the ground; (d) cracks between soil and pier.
Sustainability 15 05309 g004
Figure 5. The 3-3′ cross-section of the Bainigou slope (before and after treatment).
Sustainability 15 05309 g005
Figure 6. Numerical model of 3-3′ cross-section for Bainigou slope.
Sustainability 15 05309 g006
Figure 7. Base input motion: (a) acceleration time history; (b) displacement time histories of seismic motion before and after correction.
Sustainability 15 05309 g007
Figure 8. Comparison of measured and computed horizontal displacements.
Sustainability 15 05309 g008
Figure 9. Contour of slope response before treatment: (a) natural conditions; (b) seismic conditions.
Sustainability 15 05309 g009
Figure 10. Response of anti-slide pile at the end of shaking: (a) shear force; (b) bending moment; (c) horizontal displacement.
Sustainability 15 05309 g010
Figure 11. Response of anti-slide pile at t = 2.5 s: (a) shear force; (b) bending moment; (c) horizontal displacement.
Sustainability 15 05309 g011
Figure 12. Axial force time histories of anchor cables during earthquake.
Sustainability 15 05309 g012
Figure 13. Contour of slope response after treatment under seismic conditions: (a) t = 53.7 s (b) t = 2.5 s.
Sustainability 15 05309 g013
Figure 14. Horizontal displacements at three recorded locations: (a) before treatment; (b) after treatment.
Sustainability 15 05309 g014
Table 1. Material parameters for model.
MaterialDensity
(kg/m3)
Elastic Modulus
(MPa)
Poisson’s RatioCohesion
(kPa)
Friction Angle
(o)
Gravel soil2000400.152230
Mudstone (middle and front part of sliding zone)18883.70.32017.6
Mudstone (back part of sliding zone)18883.70.3030
Limestone (strong weathering)239719600.375030
Table 2. Physical and mechanical parameters of anti-slide pile.
Supporting StructureElastic Modulus
(MPa)
Density
(kg/m3)
Coupling Stiffness
(MN/m2)
Coupling Cohesion
(kN/m)
Coupling Friction Angle
(o)
NormalShearNormalShearNormalShear
Anti-slide pile3 × 10425002 × 1052 × 1051030030
Table 3. Physical and mechanical parameters of anchor cable.
Supporting StructureElastic Modulus
(MPa)
Density
(kg/m3)
Bond Stiffness
(MN/m2)
Cohesive Force
(kN/m)
Friction Angle
(o)
Anchor cableFree1.95 × 1057850000
embedding2 × 10415025
Disclaimer/Publisher’s Note: The statements, opinions and data contained in all publications are solely those of the individual author(s) and contributor(s) and not of MDPI and/or the editor(s). MDPI and/or the editor(s) disclaim responsibility for any injury to people or property resulting from any ideas, methods, instructions or products referred to in the content.

