Article

Predicting the Potential Distribution of the Endangered Plant Eucommia ulmoides in China under the Background of Climate Change

1
National Engineering Laboratory for Resource Development of Endangered Chinese Crude Drugs in Northwest of China, Xi’an 710119, China
2
The Key Laboratory of Medicinal Resources and Natural Pharmaceutical Chemistry, Shaanxi Normal University, The Ministry of Education, Xi’an 710119, China
3
College of Life Sciences, Shaanxi Normal University, Xi’an 710119, China
4
Lueyang County Traditional Chinese Medicine Industry Development Service Center, Hanzhong 724300, China
*
Authors to whom correspondence should be addressed.
Sustainability 2023, 15(6), 5349; https://doi.org/10.3390/su15065349
Submission received: 22 February 2023 / Revised: 11 March 2023 / Accepted: 13 March 2023 / Published: 17 March 2023
(This article belongs to the Section Sustainability, Biodiversity and Conservation)

Abstract

:
Eucommia ulmoides, a single extant species of Eucommiaceae, is a perennial deciduous tree distributed across central China. The bark of E. ulmoides is rich in chlorogenic acid and flavonoids that possesses high medicinal value, whereas its leaves and seeds contain abundant Eucommia ulmoides gum (EUG), which is a unique strategic resource in China that can be used as a substitute for natural rubber. Under the background of global warming, the evaluation of habitat suitability is of great significance for the protection and management of E. ulmoides. For this study, maximum entropy (MaxEnt) modeling was employed to simulate the potentially suitable region for E. ulmoides over four periods (current, 2050s, 2070s, and 2090s) under four climate change scenarios (SSP1-2.6, SSP2-4.5, SSP3-7.0, and SSP5-8.5), as well as to analyze changes in the spatial patterns of E. ulmoides and the essential environmental factors affecting the growth and distribution of E. ulmoides. The results revealed that the current potentially suitable region for E. ulmoides was 211.14 × 10⁴ km2, which accounted for 21.99% of China’s territory. The low impact areas for E. ulmoides were distributed in Guizhou, Zhejiang, Sichuan, eastern Chongqing, southern Shaanxi, western Hubei, eastern Shandong, southern Anhui, southern Gansu, and northern Yunnan Provinces. The key bioclimatic variables affecting the distribution of E. ulmoides were mean diurnal range and mean temperature of the coldest quarter, with their contribution rates of 53.8% and 41.4%, respectively. Furthermore, core distributional shift analysis indicated that the center of the potentially suitable regions of E. ulmoides exhibited a general trend of shifting to the northwest and high latitudes. Finally, conservation strategies are proposed, such as the establishment of ex situ protection sites and germplasm resource collection. Future researchers can conduct further studies by integrating the quality of E. ulmoide herbs and environmental variables. In this study, for technical reasons, we only considered the effect of climate on species distribution without considering other biotic and abiotic factors, which can be further addressed by future researchers.

1. Introduction

Climate has a profound impact on species distribution patterns and is also one of the critical factors that determines them at large-scales [1]. According to the Fifth Assessment Report (AR5) of the Intergovernmental Panel on Climate Change (IPCC), compared with the period 1986–2005, the average global surface temperature is expected to rise by 0.3–0.7 °C from 2016 to 2035, and by 0.3–4.8 °C from 2081 to 2100 [2]. Continuous global warming will also increase climate variability and alter the probability and intensity of extreme weather and climatic events, such as high temperatures, heat waves, droughts, heavy rains, and snowstorms [3]. Scientists warn that global warming will be the most serious environmental issue that humanity faces in the 21st century [4].
Changes in global temperatures have dramatically altered the distribution ranges, population sizes, community compositions and structures, and genetic diversity of many species [5]. In particular, global warming/climate change reduces the capacity of wild plants to thrive in their existing habitats, which induces them to adapt by migrating to cooler habitats, or through natural selection [6]. Migration implies that plants must propagate across terrestrial barriers to new environments via spores, seeds, or other nutritional tissues, thus facing the risk of declining numbers or even extinction [7,8]. Although natural selection is a prolonged process that relies on inherent random mutations, plant populations or entire species may decline or become extinct if they cannot adapt and keep pace with climate change [9,10,11]. Therefore, it is expected that there may be a large number of extinctions of flora in the world during this century.
Ecological niche models (ENM), which are based on geographical distribution data of species and environmental variables to predict their potentially suitable distribution, have become increasingly diverse over the years to include Ecological-Niche Factor Analysis (ENFA), Generalized Linear Model (GLM), and Maximum Entropy (MaxEnt) Modeling [12,13,14]. Among them, MaxEnt modeling is the most extensively used due to its robust operability, good prediction performance, high prediction accuracy, small sample size, small site deviation, and good data simulation effects. MaxEnt modeling was developed based on the maximum entropy principle. The principle of maximum entropy is a model creation rule that requires selecting the most unpredictable (maximum entropy) prior assumption if only a single parameter is known about a probability distribution. The goal is to maximize “uniformity”, or uncertainty in making a prior probability assumption, so the MaxEnt modeling has minimal subjective bias [15,16]. Based on the above advantages, MaxEnt has been applied to the protection of endangered plant resources, (e.g., Caesarpinia bonduc (L.) Roxb, Schisandra sphenanthera Rehd et Wils.), alien invasive plant protection (e.g., Rapidrum rugosum (L.)), and the identification of suitable areas for medicinal plants (e.g., Scutellaria baicalensis) [17,18,19,20].
E. ulmoides is a perennial deciduous tree belonging to the Eucommia genus of Eucommiaceae, which is a single extant species of Eucommiaceae unique to China [12,13,14,21]. E. ulmoides is also a plant that remains from geological history, which favors a sunny, warm, and humid environment [22,23]. In China, E. ulmoides is primarily distributed in areas south of the Qinling Mountains, including Sichuan, Guizhou, Hubei, Hunan, Shaanxi, Gansu, and Guangxi Provinces [24]. E. ulmoides has high medicinal value and economic benefits, so it is called “plant gold” [25,26].
As the seed coat of E. ulmoides is rich in colloids, it does not break easily after immersion in water [27]. Therefore, under natural conditions, the germination rate of its seeds is very low. In addition, E. ulmoides has a long growth cycle, and the ring peeling method is often used in production, which can easily cause the death of the original plant [28]. In recent decades, due to the deterioration of the ecological environment and artificial overexploitation, wild E. ulmoides resources have decreased sharply and the population is fragmented. Consequently, E. ulmoides has been listed as a Grade-II state-protected plant in China [29]. Meanwhile, E. ulmoides is listed as an endangered plant in CHINA PLANT RED DATA BOOK—Rare and Endangered Plants [30]. The development of artificial cultivation is an effective measure to protect endangered plants and achieve the sustainable utilization of resources. Although the artificial breeding of E. ulmoides has been carried out in many areas in China, the genetic background of artificially cultivated resources is solitary, the genetic basis is narrow, and the overall progress is slow. Thus far, investigations into E. ulmoides by international researchers have focused primarily on its pharmacological effects, chemical components, and genetic functions [31,32,33,34,35,36,37,38]. However, there have only been a few studies on its geographical distribution characteristics and ecological suitability. Therefore, in the context of climate change, it is imperative to systematically elucidate the potentially suitable regions of E. ulmoides.
This study employed optimized MaxEnt modeling to predict the potential distribution of E. ulmoides currently and in the future. The objectives of this research were to (1) explore the effects of climate change on E. ulmoides and analyze the primary climatic factors that limit its growth and distribution; (2) predict the distribution of potentially suitable regions for E. ulmoides under different climate scenarios; (3) predict the distribution of low impact areas and core distributional shifts of E. ulmoides under different climate scenarios. The results of this study will serve as important references for promoting artificial planting and protecting E. ulmoides germplasm resources.

2. Materials and Methods

2.1. Research Area

The distribution range of E. ulmoides in China includes Yanqing County, Beijing City to the north; Laibin City, Guangxi Zhuang Autonomous Region to the south; Yantai City, Shandong Province to the east; and the Tibetan Autonomous Prefecture of Garzê, Sichuan Province, to the west [24]. The natural distribution regions of E. ulmoides in China are ~24°13′59″–40°46′46″ N and 100°33′38″–122°28′74″ E [39].

2.2. Species Occurrence Data

From 2021 to 2022, we conducted extensive field investigations in Hubei, Henan, Sichuan, Anhui, Shaanxi, and Gansu Provinces, and obtained the coordinate information of 118 distribution points [40]. Further, we synthesized previously published scientific literature and public databases (China National Knowledge Infrastructure/CNKI (https://www.cnki.net, (accessed on 1 July 2022)), Google academic (https://scholar.google.com, (accessed on 1 July 2022)), China Digital Plant Herbarium/CVH (https://www.cvh.ac.cn, (accessed on 1 July 2022)), and Global Biodiversity Information Facility (https://www.gbif.org) (accessed on 1 July 2022)), for a total of 135 collected species sites. For samples that were not clearly identified via latitude and longitude data, or described only by location, we employed the Google coordinate pickup system to determine the latitude and longitude. To avoid errors caused by clustering effects, Trim Duplicate Occurrences in ENMtools v1.4 was used to screen the original species distribution points to make certain that solely one species distribution point was retained in every grid (2.5 arcminutes) [41,42]. Finally, we obtained 247 valid species distribution points for MaxEnt modeling (Figure 1; Table A1, Appendix A).

2.3. Environmental Variable Screening and Data Processing

The 19 bioclimatic factors were downloaded from the WorldClim database website (https://www.worldclim.org; accessed on 1 May 2022), including one current period (1970–2000) and three future periods (2050s, 2070s, and 2090s). The contemporary environmental data were averaged over the period 1970–2000. According to the climatic similarity principle, environmental variables for future periods are obtained by extrapolation from known contemporary data [43]. WorldClim datasets have been broadly utilized for species distribution modeling [44].
Various climate change scenarios will typically lead to different predicted results. We selected four shared socioeconomic pathways (SSPs: SSP1-2.6, SSP2-4.5, SSP3-7.0, and SSP5-8.5) for three general circulation models (GCMs: BCC-CSM2-MR, CNRM-CM6-1, and MIROC-ES2L) to provide a reference for future bioclimatic data. Consequently, 37 complete sets of bioclimatic factor data were involved in this study, including one set of current data and 36 sets of future data.
Due to the multicollinearity between bioclimatic factors, 19 bioclimatic factors were screened to avoid model overfitting that could impact model accuracy [45]. Firstly, the ENMtools v1.4 program was employed to calculate the Persons correlation coefficient (R) of the 19 bioclimatic factors, and |R| ≥ 0.80 was employed as the threshold to determine whether the two variables were significantly correlated [46]. Secondly, MaxEnt v3.4.1 software was used for pre-modeling and to obtain the contribution percentage of each environmental factor to the model and Jackknife analysis results [47]. Bio-climatic factors for model construction were selected by retaining those that were relatively important in the significant correlation. Finally, BIO02, BIO03, BIO04, BIO08, BIO11, BIO14, and BIO18 were selected for modeling.

2.4. Model Establishment, Optimization, and Evaluation

Maxent v3.4.1 software was employed to construct a maximum entropy model for E. ulmoides [48]. To ensure that the distribution of E. ulmoides datasets was closer to normal distribution, we randomly selected 30% distribution points as test sets for model evaluation, while the remaining 70% distribution points were used as training sets for model construction. The maximum iteration limit was set to 5000, and the number of repeated operations was set to 10 [49].
Meanwhile, the <kuemn> program package of R v3.6.2 was employed to optimize the feature class (FC) and regularization multiplier (RM) of the model [50]. Finally, we selected the (OR_AICC) model with a statistical significance omission rate below the threshold (0.05), and the delta AICC value not higher than 2 as the optimal model [51].

2.5. Classification of Suitable Areas and Modeling Accuracy Evaluation

The value range for species suitable areas was (0, 1), where values closer to 1 indicated that the area was more suitable for the survival of species [52]. The threshold selection directly affected the extent of suitable regions, where an unreasonable threshold led to a significant difference between the predicted suitable area and the actual distribution range of species. For this study, the Maximum Test Sensitivity Plus Specificity (MTSPS) threshold was used to classify suitable regions. Above the threshold, it could be divided into three equal parts (poorly, moderately, and highly suitable regions, respectively) [51].
In this study, the area value under the ROC curve was used to evaluate the accuracy of the model. The AUC value range was (0, 1), where the closer the AUC value was to 1, the higher the accuracy of the model [53]. It is generally believed that an AUC value of >0.9 indicates fabulous prediction [54]. Simultaneously, we additionally viewed the difference between the training AUC and test AUC, where the smaller the absolute value of difference, the higher the accuracy of the model [42].

2.6. Analysis of Low Impact Areas

Low impact areas refer to those that are suitable for species distribution during each time period; that is, areas that were less impacted by climate change [55]. The potentially suitable regions distribution map was obtained by superimposing the overlapping portions of the binary suitable area distribution maps of different periods. The unsuitability and suitability matrices of E. ulmoides were established using DIVA-GIS v7.5 software (http://www.diva-gis.org; accessed on 5 October 2022), and the completely overlapping portions in the superimposed layers were selected [56]. Finally, a visualization of potentially suitable regions were performed [57,58]. In this study, we predicted the low impact areas of four shared socioeconomic pathways (SSP1-2.6, SSP2-4.5, SSP3-7.0, and SSP5-8.5) in current and future periods (2050s, 2070s, and 2090s).

2.7. Analysis of Spatial Pattern Change

Spatial pattern changes refer to shifts in potentially suitable regions for species over different time periods, which are obtained by superimposing binary prediction maps of suitable regions during different periods [59]. Using DIVA-GIS v7.5 software (http://www.diva-gis.org; accessed on 10 October 2022), a matrix of non-suitable and suitable E. ulmoides matrices were established, after which the changes in spatial patterns of suitable distribution regions under current and future climate scenarios were analyzed [42].

2.8. Centroid Transfer Analysis

Centroids are one of the important indices that describe geographical spatial distribution, which are often employed to reflect changes in the terrestrial distribution of species. For this study, the suitable region of E. ulmoides were considered as a whole and simplified as a vector particle, which reflected distribution shifts (e.g., direction and distance) through centroid changes. SDMToolbox v2.4 in ArcGIS v10.2 was employed to track the centroid of E. ulmoides and to compare its distribution over different time periods under various climate scenarios [60]. Furthermore, the SDMToolbox toolkit was employed to track the centroid of E. ulmoides. The migration direction and distance of the centroid were analyzed via longitude and latitude coordinates.

3. Results

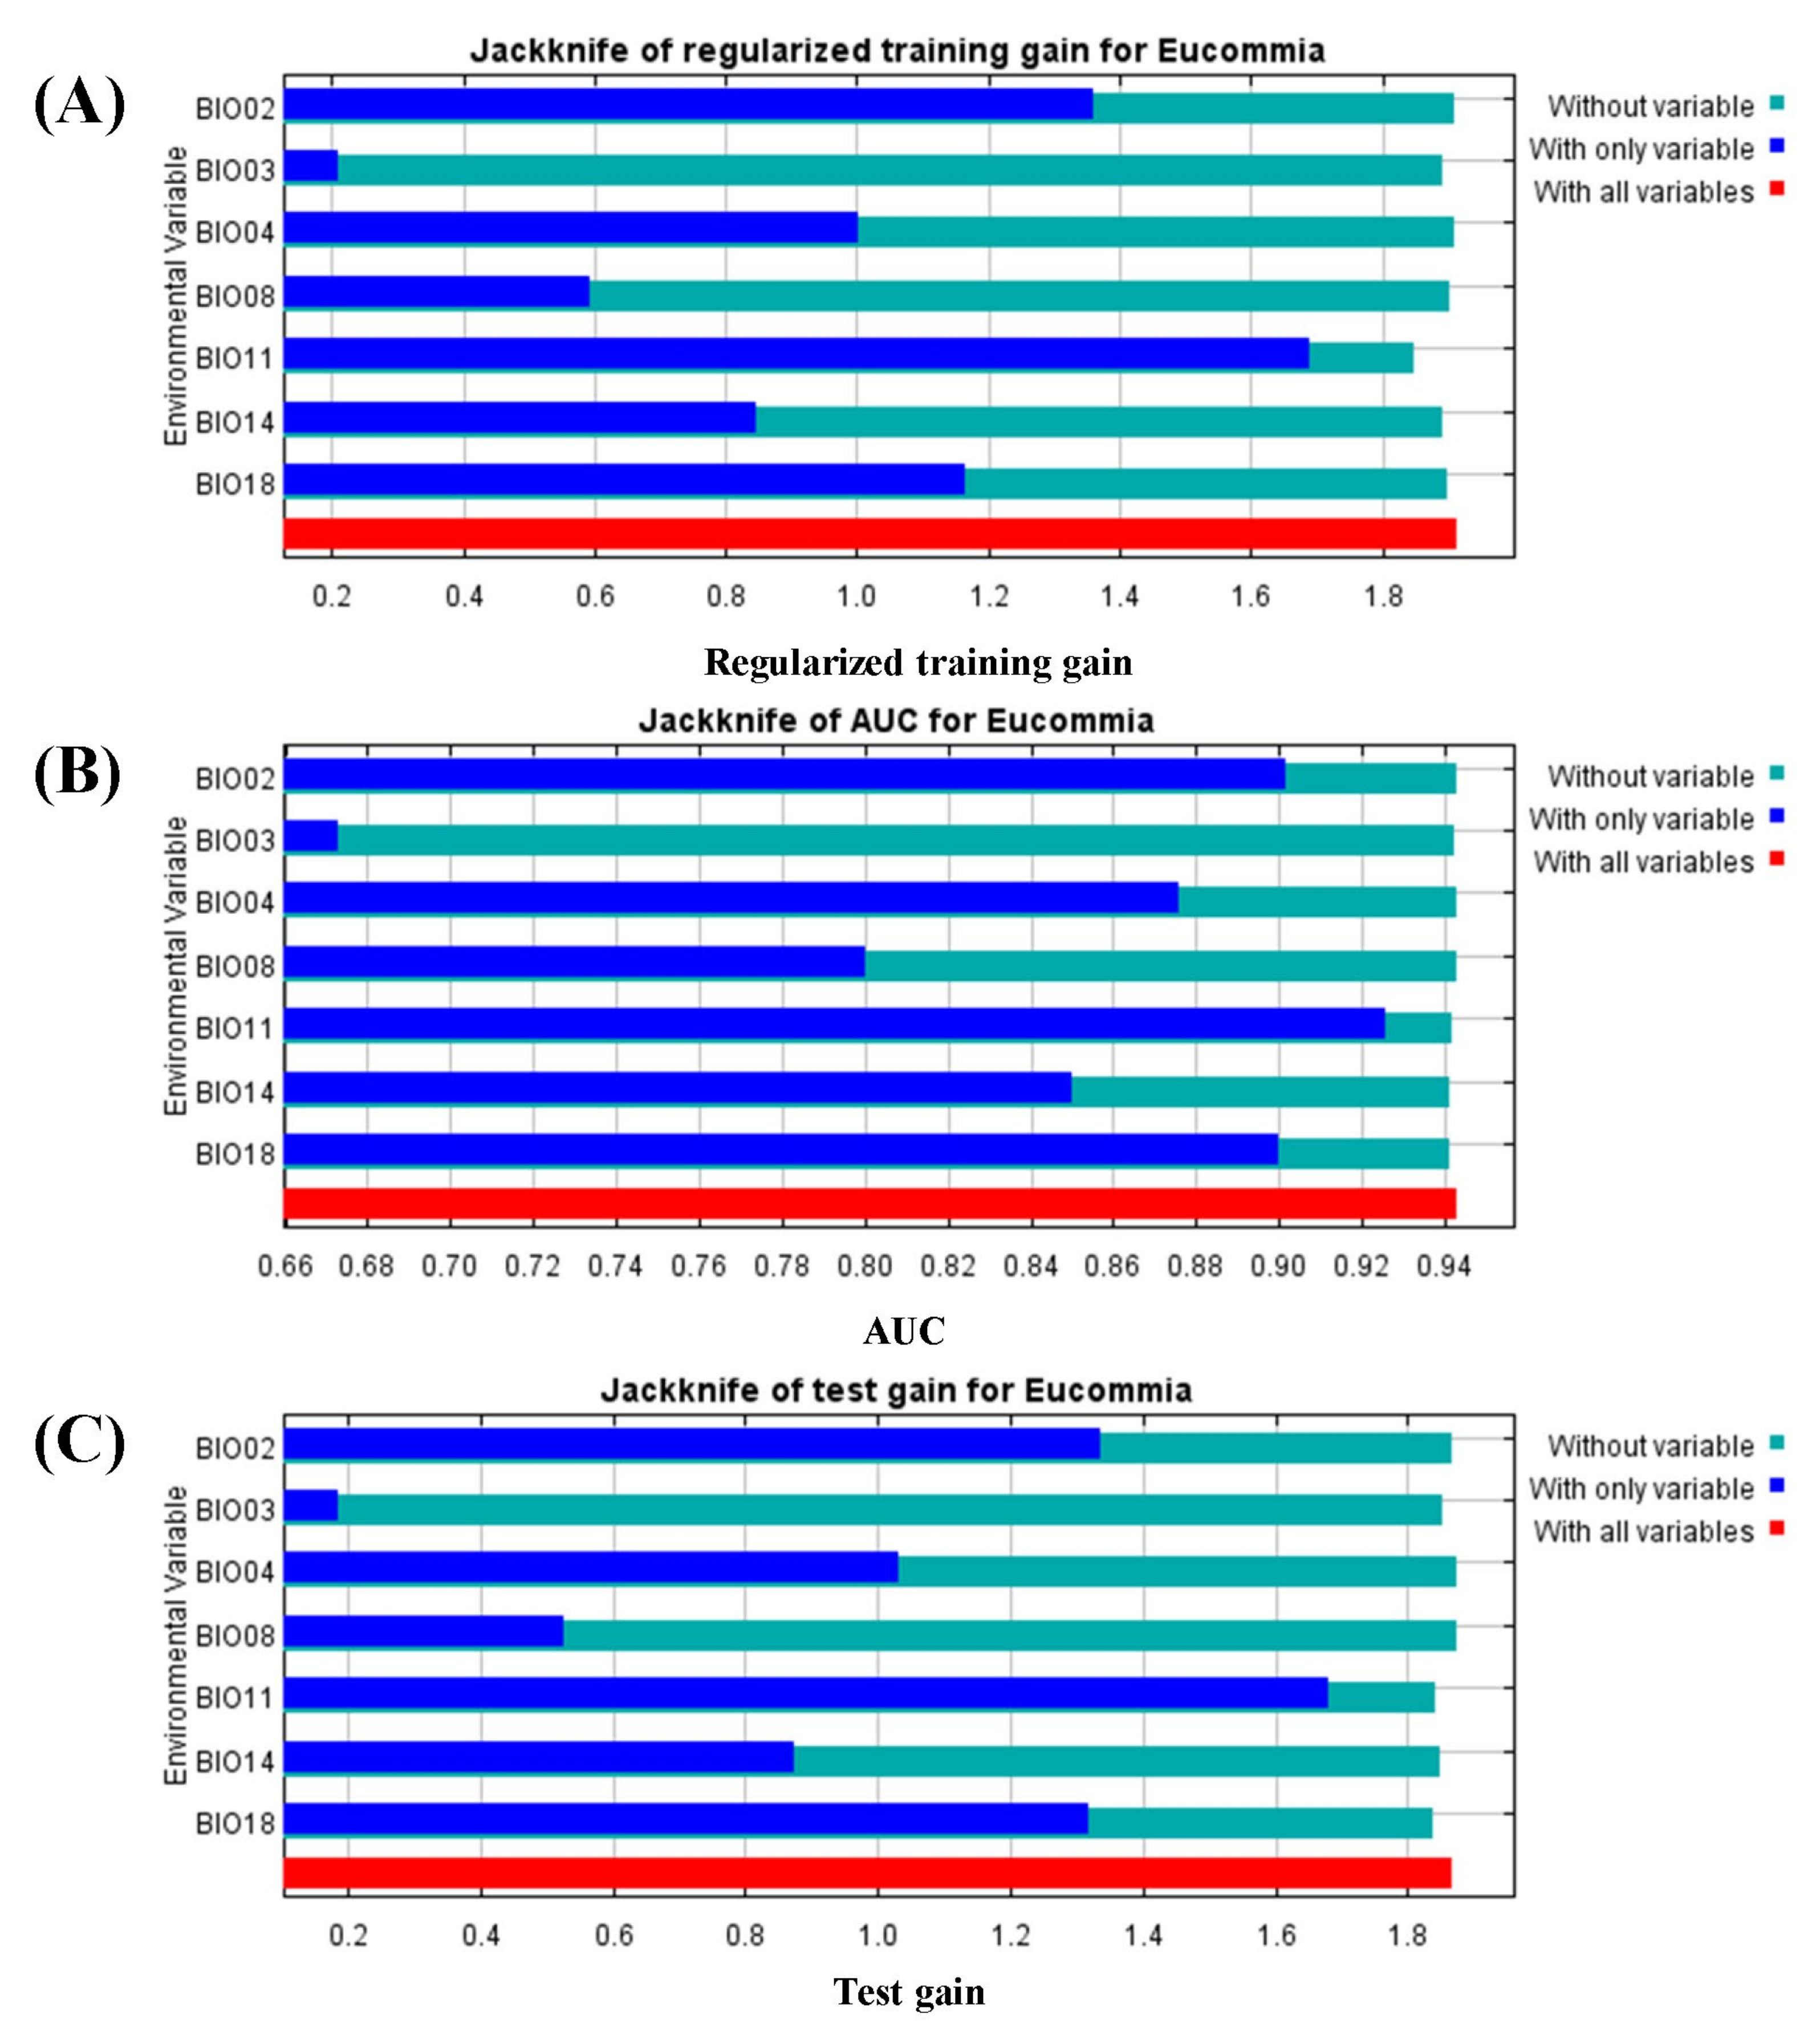
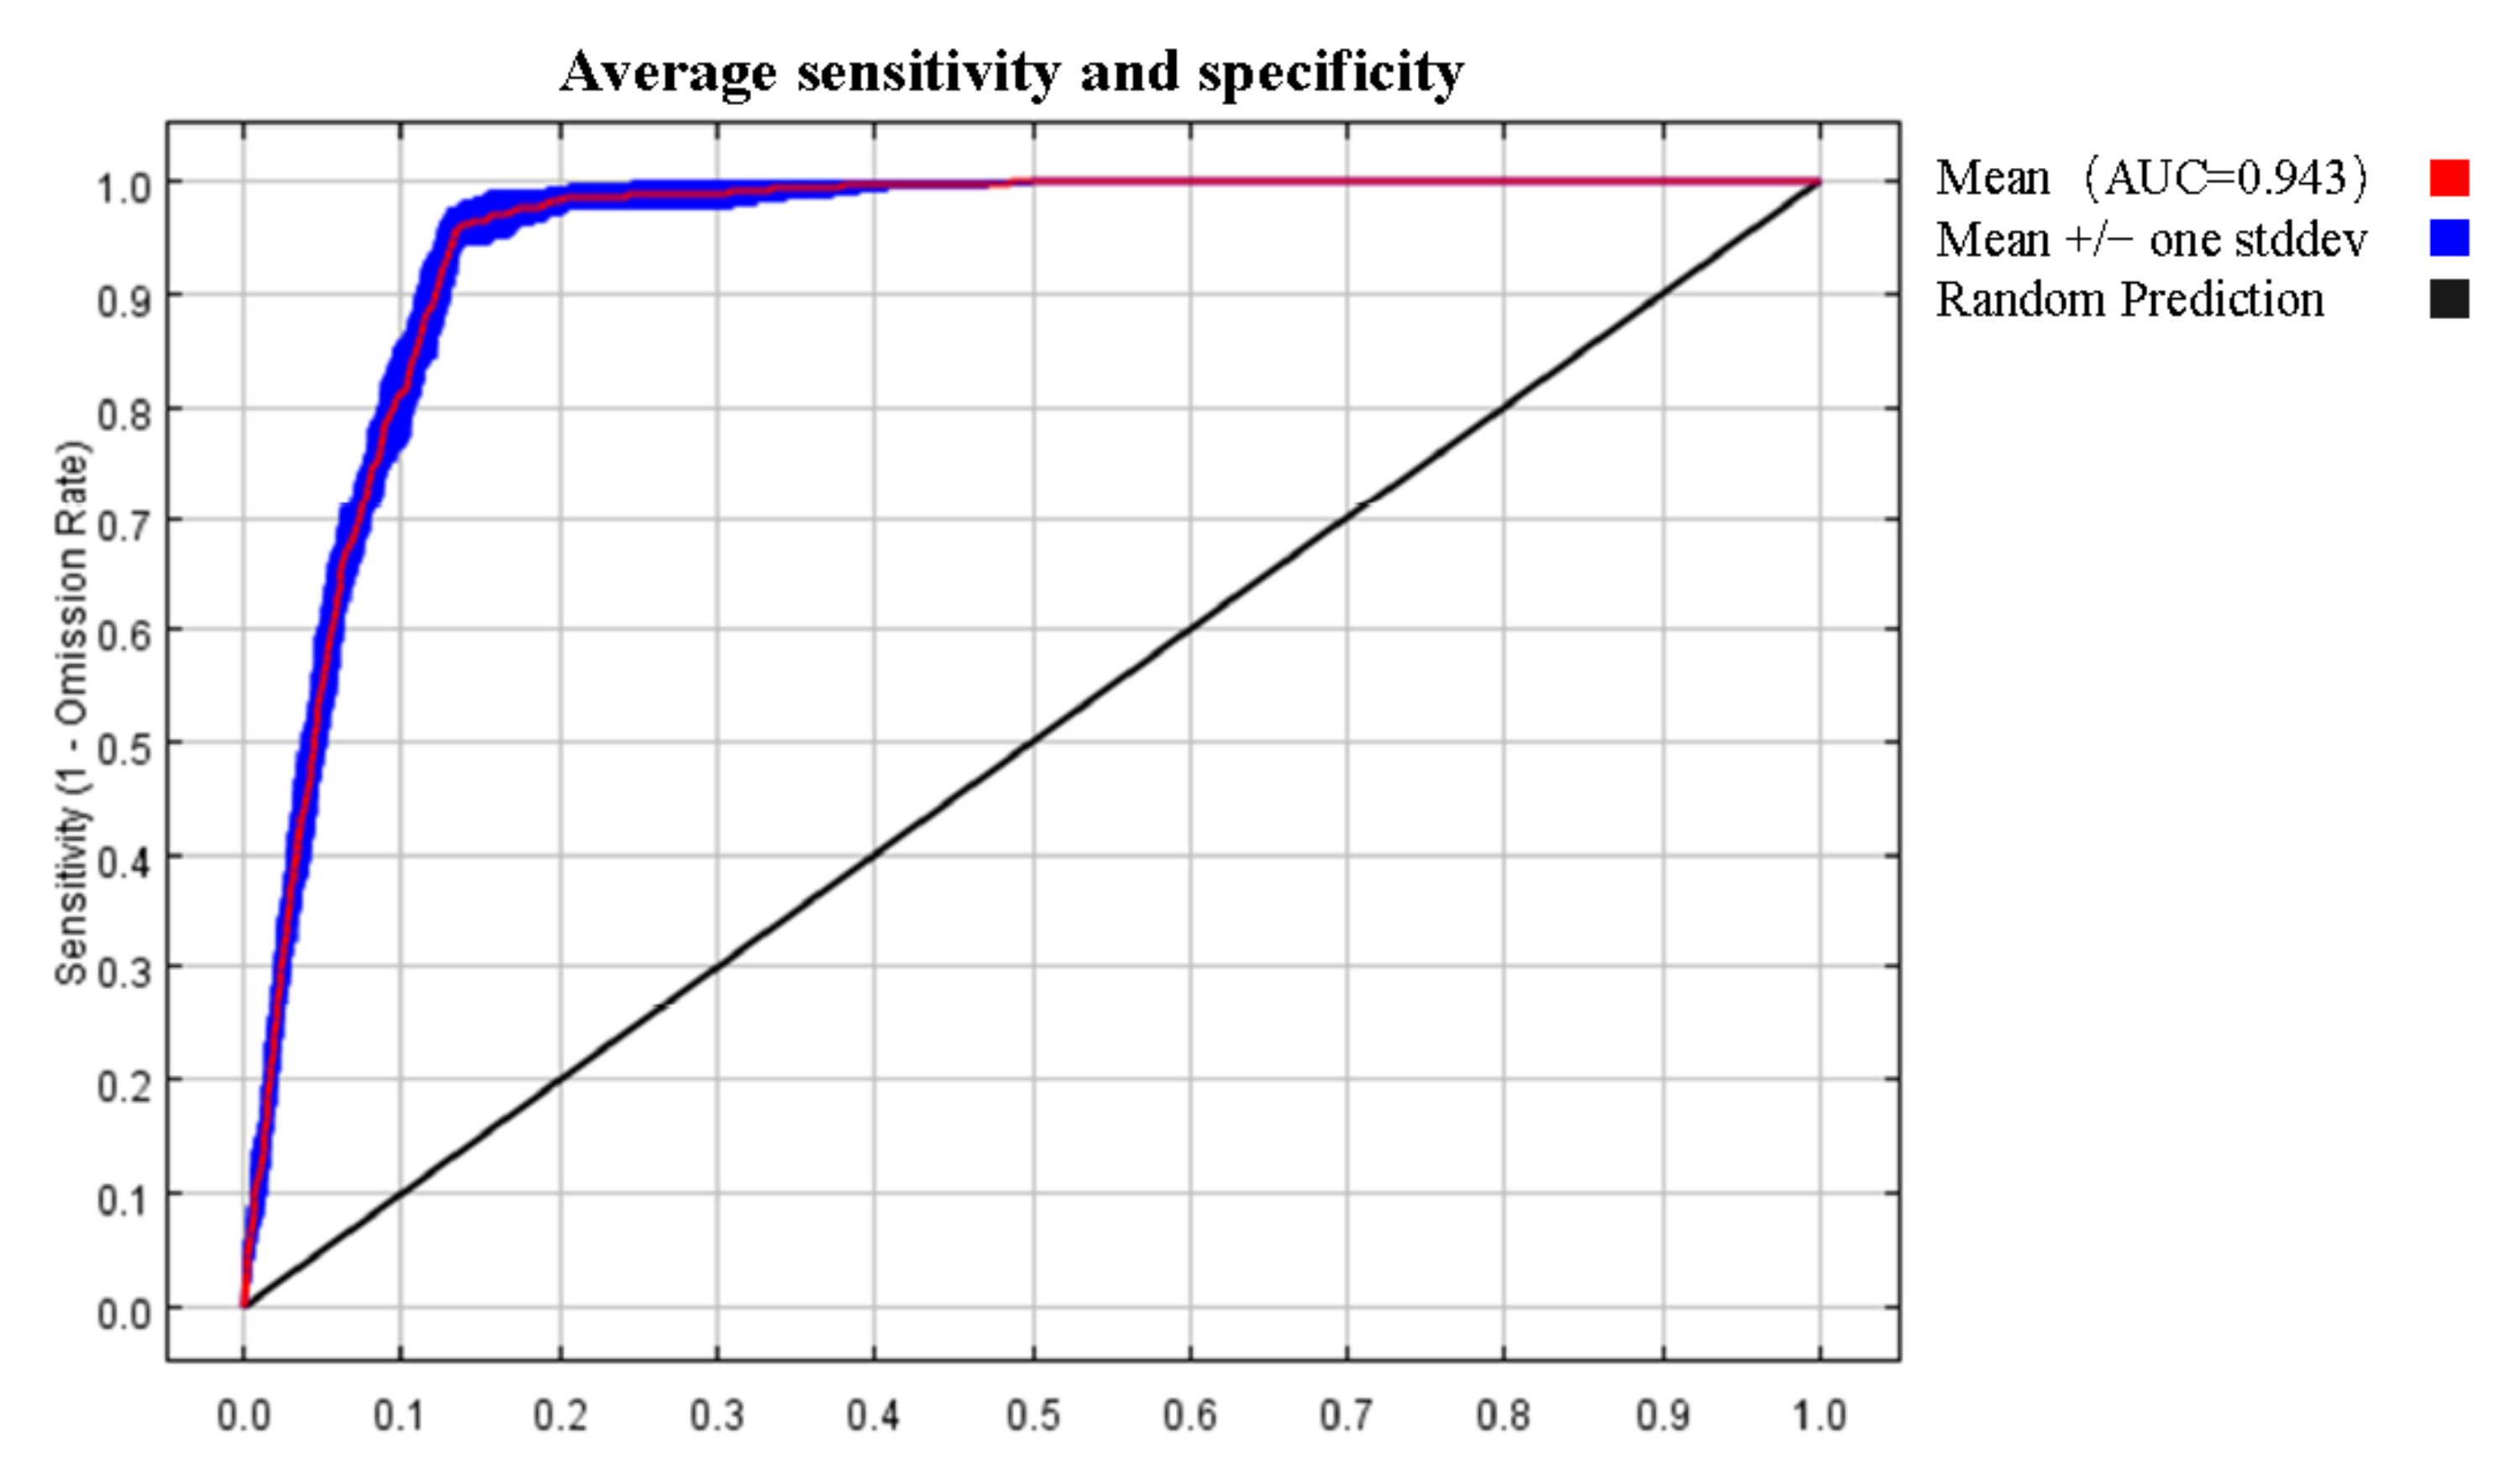
3.1. Analysis of the Model Accuracy and Classification of Suitable Regions

The model produced the greatest predicted results when FC was LQ and RM was 0.2. Under these conditions, the average value of the training AUC (AUCTRAIN) was 0.9473 ± 0.0022, whereas the average value of the test AUC (AUCTEST) was 0.9427 ± 0.0073. The absolute difference value between AUCTRAIN and AUCTEST (AUCDIFF) was 0.0046, which indicated that the model projected well.
The MTSPS threshold was set to 0.2078 and further divided as: 0–0.2078, unsuitable; 0.2078–0.4719, poorly suitable; 0.4719–0.7359, moderately suitable; 0.7359–1, highly suitable.

3.2. Environmental Variables Contribution Analysis

Seven environmental variables were finally used for the construction of the model, i.e., mean diurnal range (BIO02), isothermality (BIO03), temperature seasonality (BIO04), mean temperature of wettest quarter (BIO08), precipitation of driest month (BIO14), and precipitation of warmest quarter (BIO18). The percentage-wise contributions to model construction were BIO02 (53.8%) > BIO11 (41.4%) > BIO14 (1.6%) > BIO18 (1.3%) > BIO03 (0.8%) > BIO08 (0.7%) > BIO04 (0.4%) (Table 1; Figure 2).

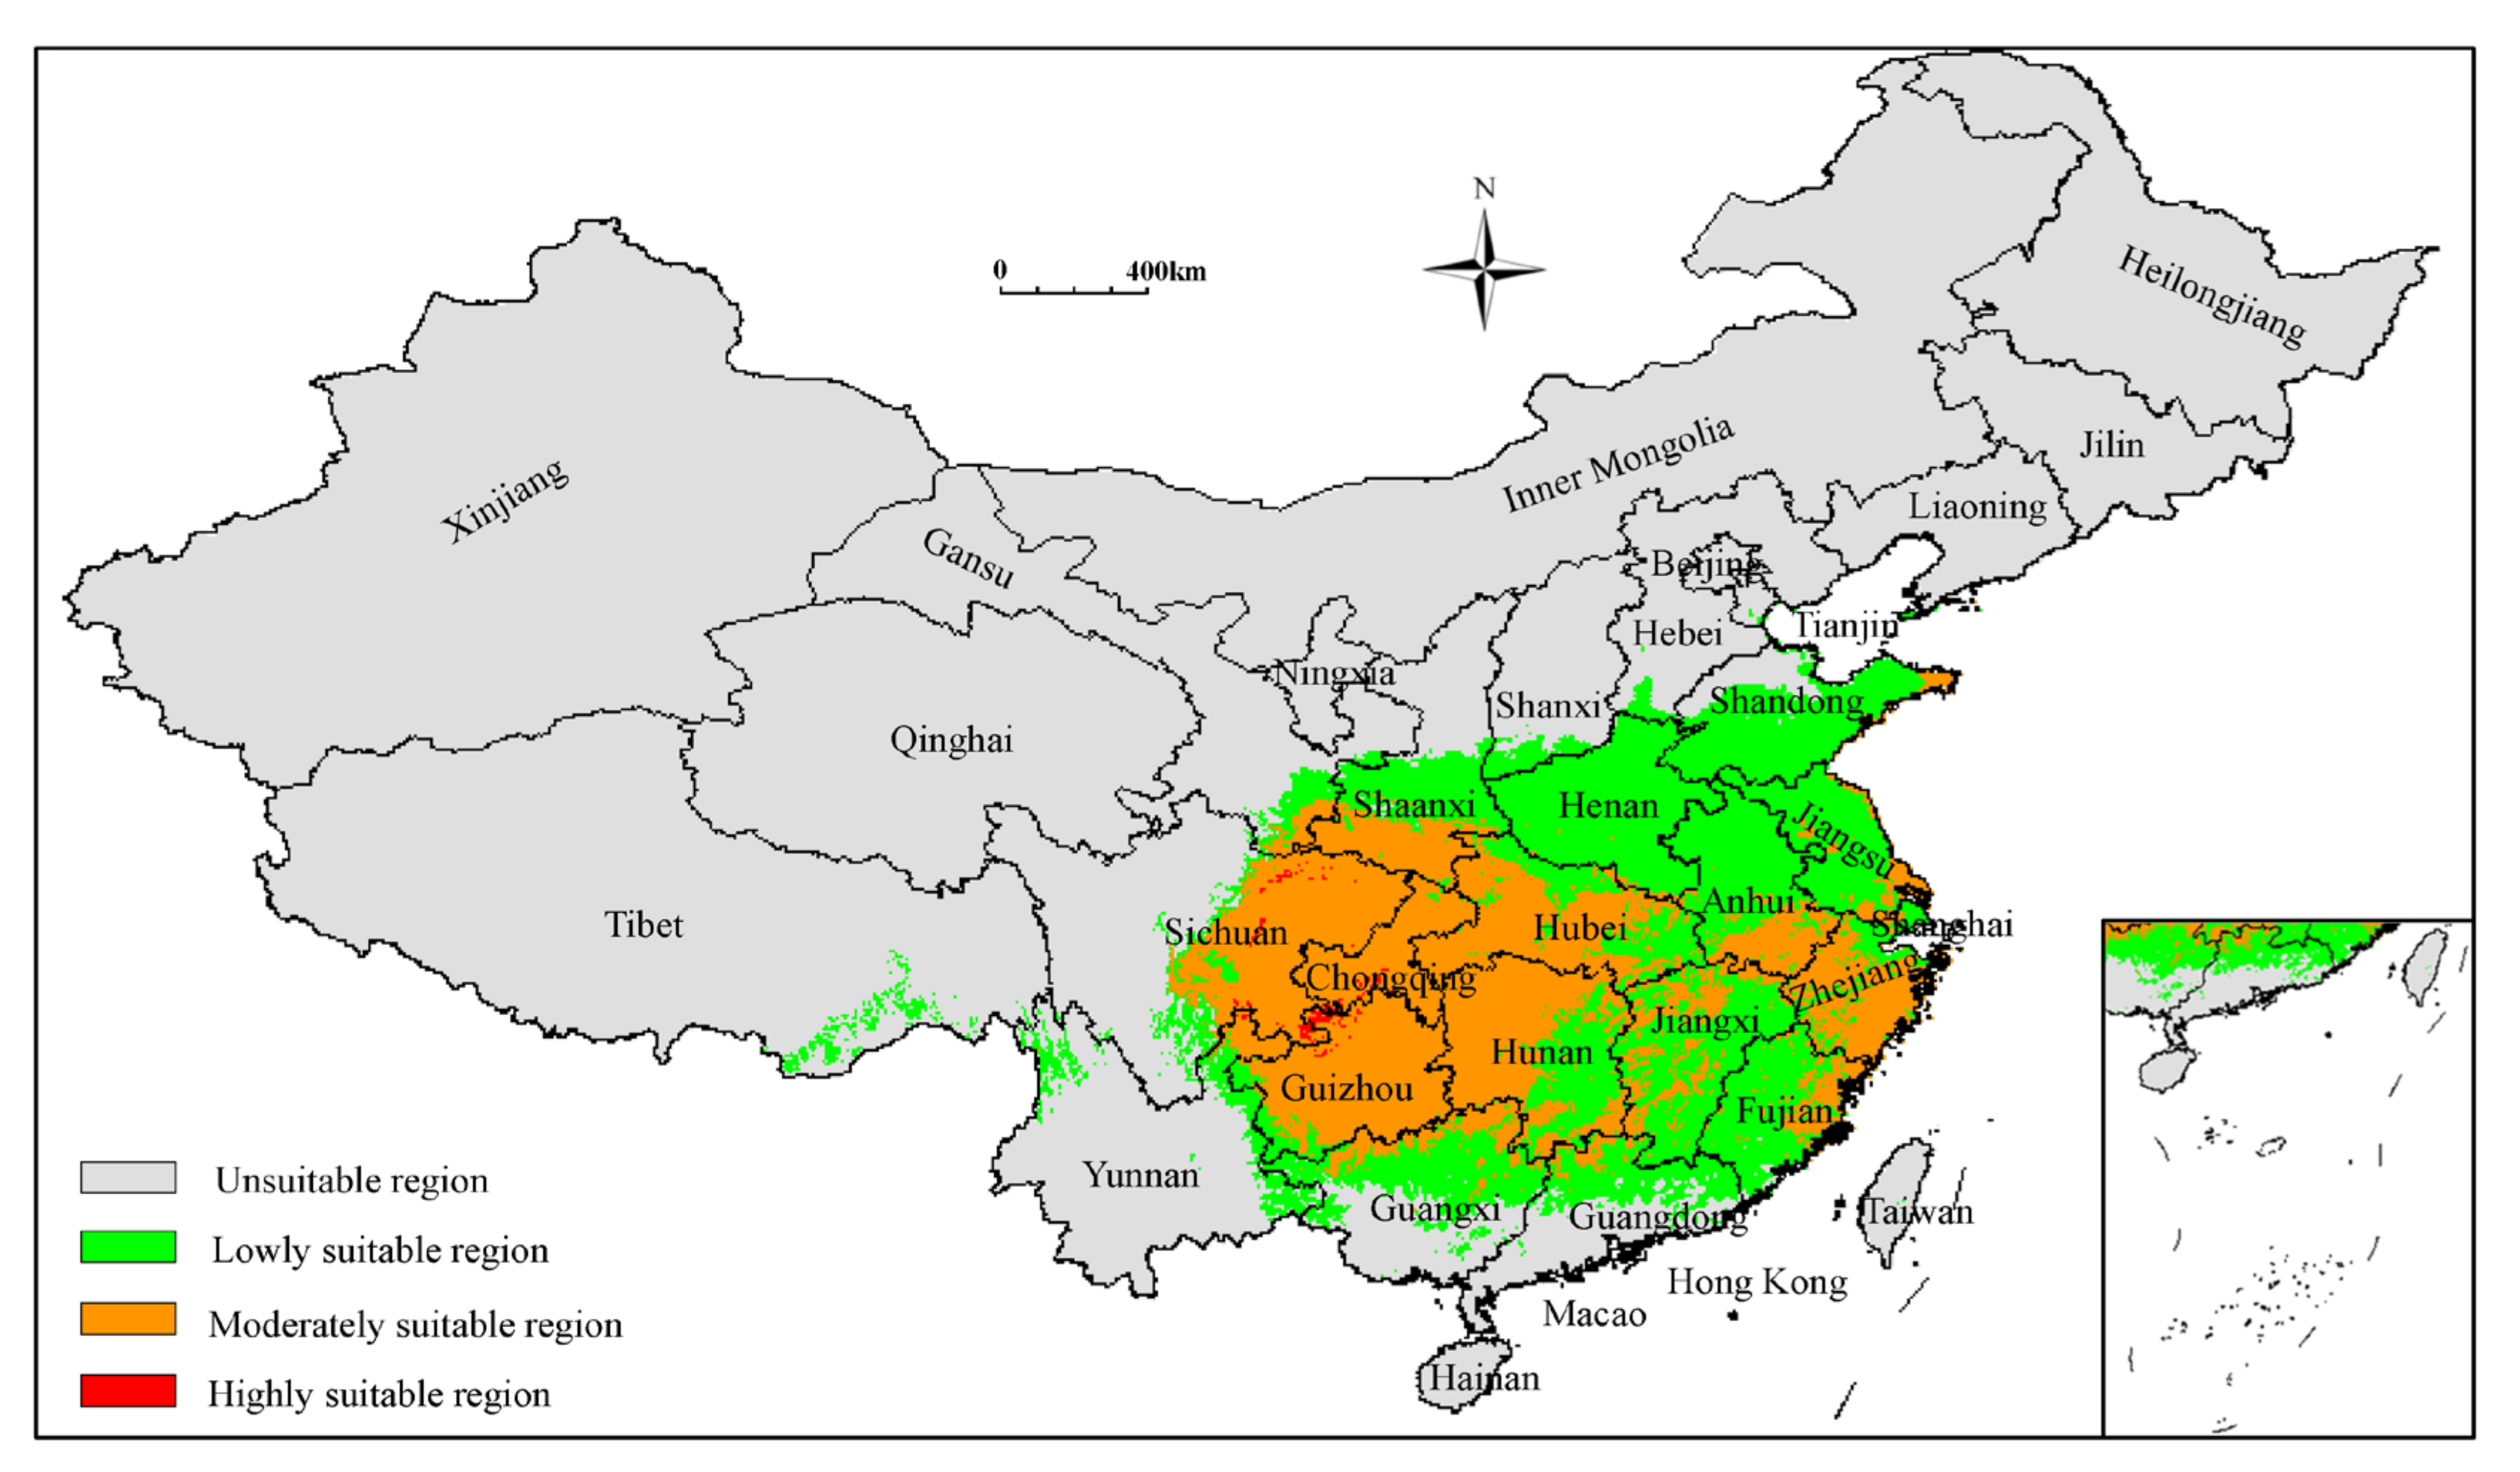
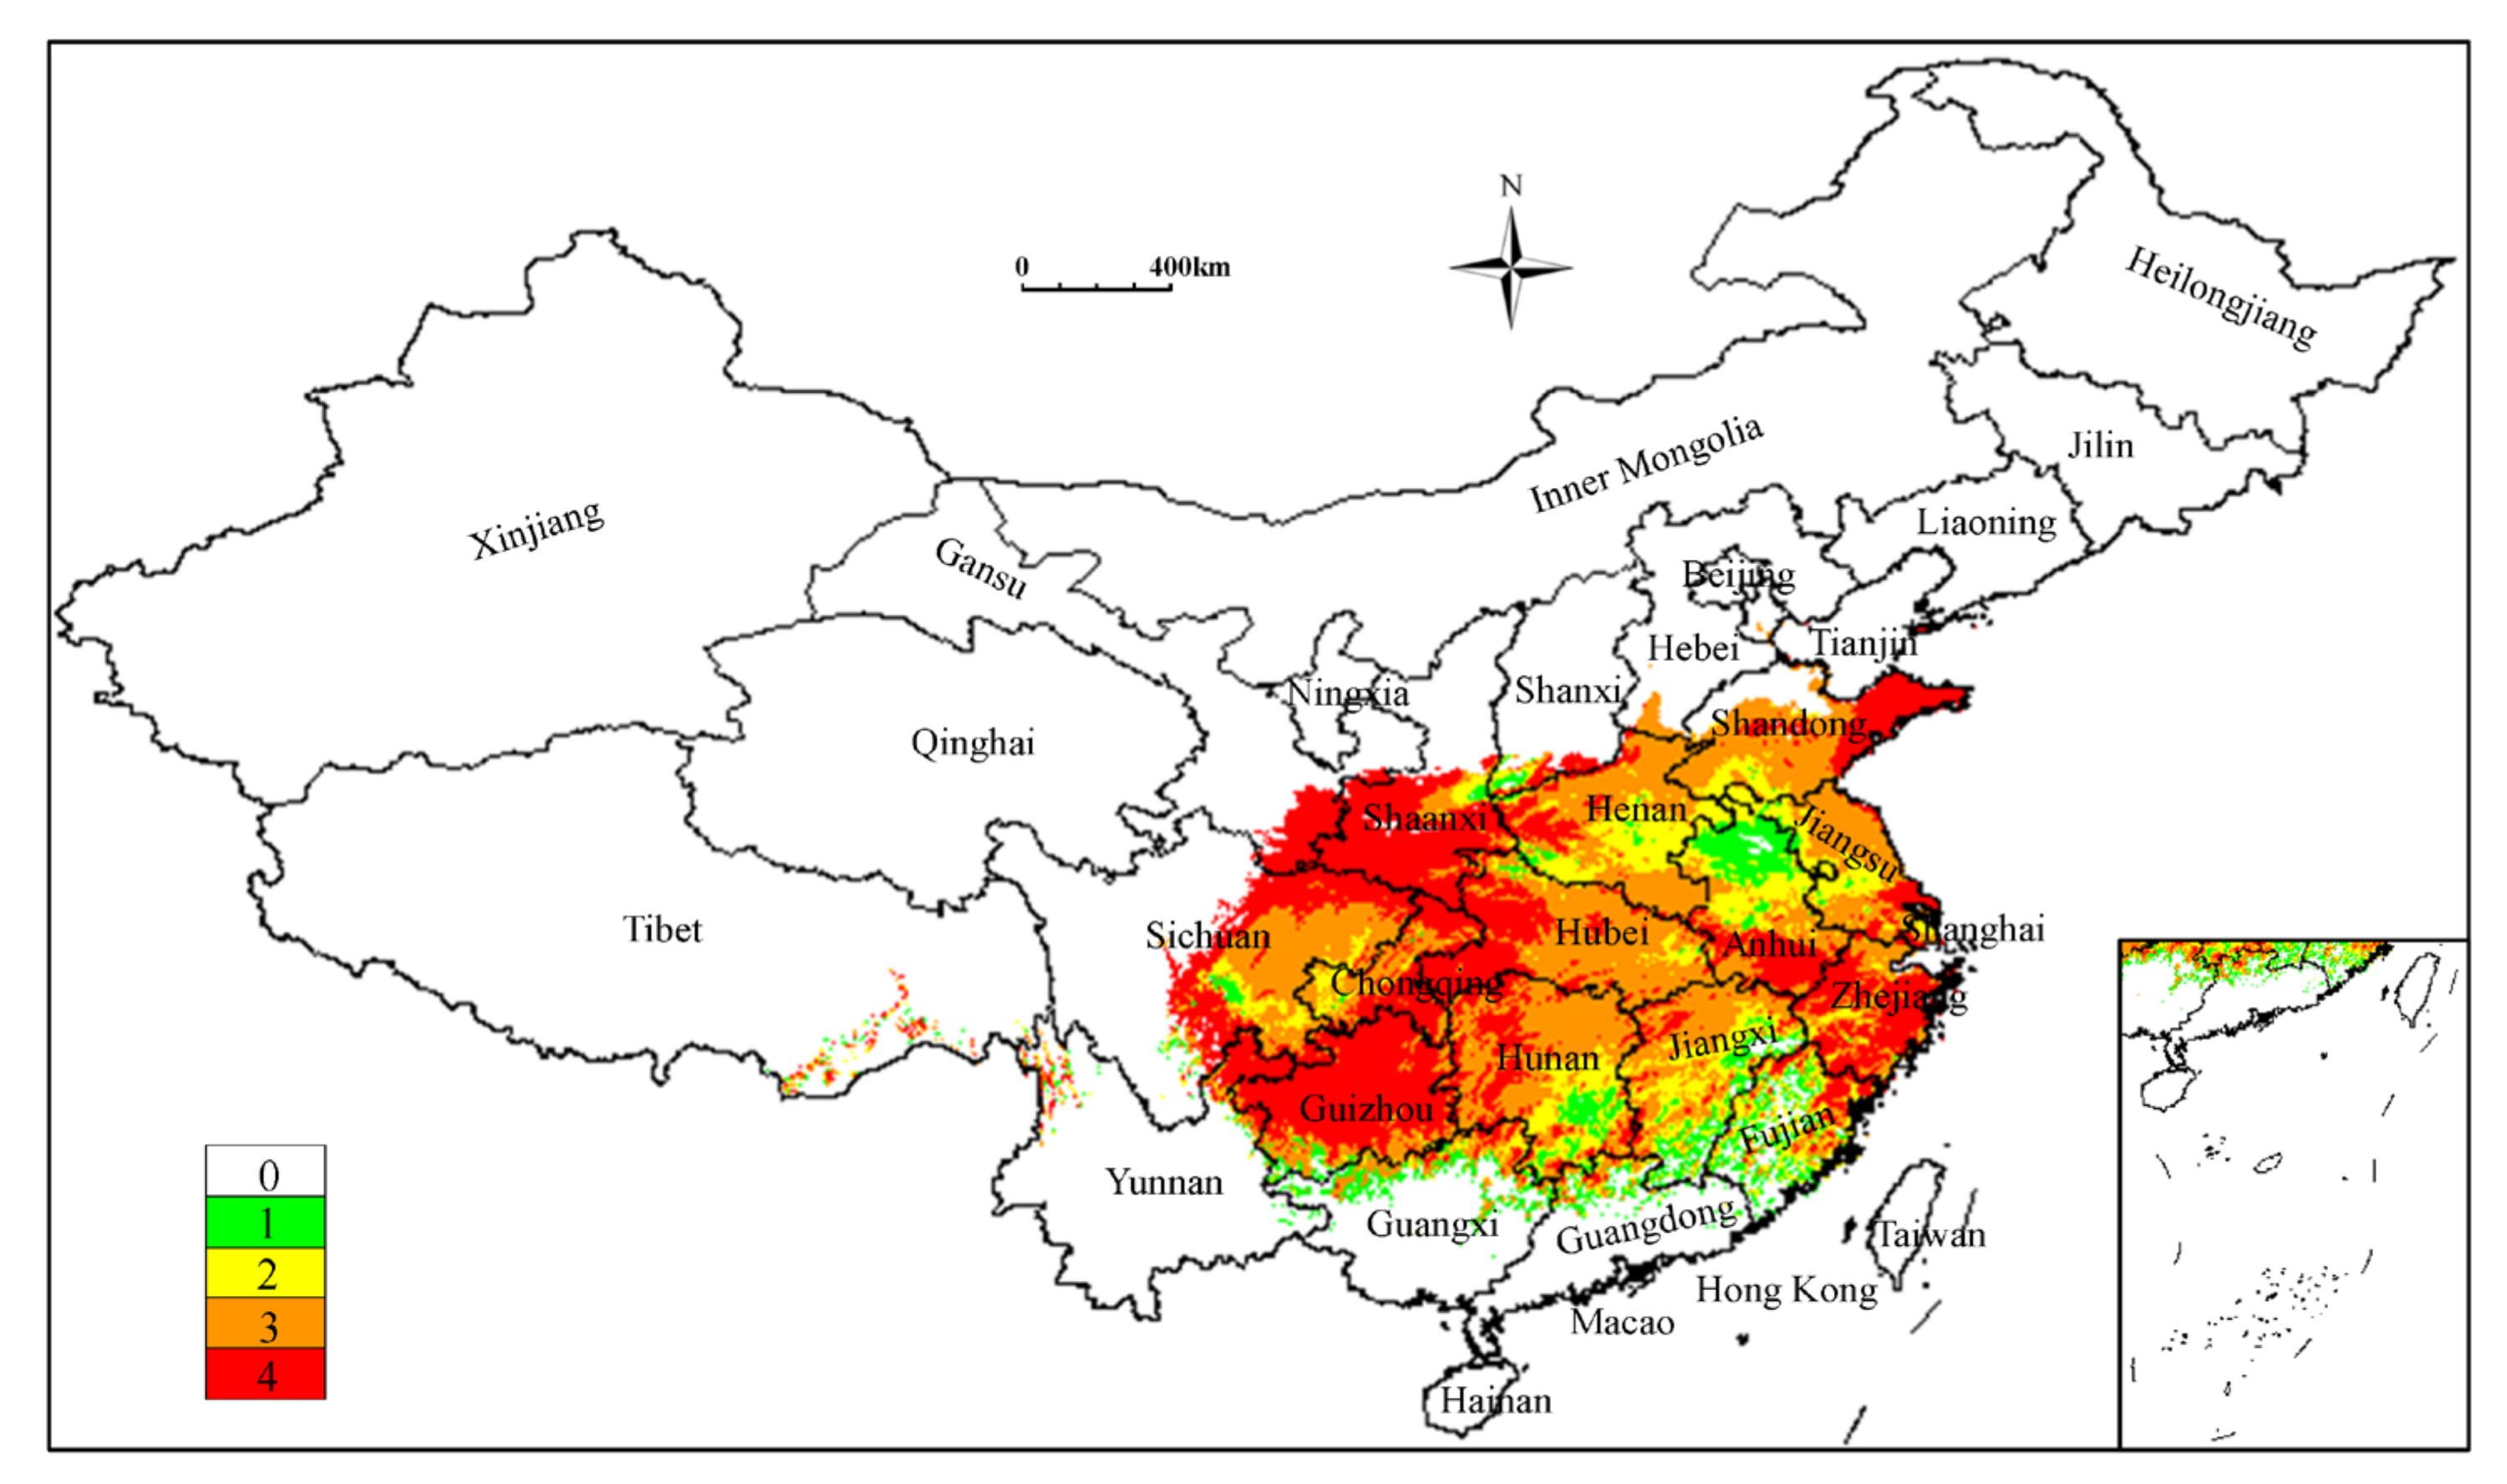
3.3. Analysis of Current Potentially Suitable Regions

Under current climatic conditions, the potentially suitable regions of E. ulmoides were 31° N–45° N, 101° E–124° E in China, whereas the current potentially suitable regions covered a total area of 211.14 × 10⁴ km2, primarily distributed in Shaanxi, Sichuan, Hunan, Jiangxi, Zhejiang, Anhui, Guizhou, Fujian, Henan, Hubei, Chongqing, and Jiangsu Provinces (Figure 3). The highly, moderately, and poorly suitable regions were 1.07 × 10⁴ km2, 96.39 × 10⁴ km2, and 113.68 × 10⁴ km2, respectively. The highly suitable regions were distributed mainly in Chongqing (Jiangjin, Qianjiang, Dianjiang County), Sichuan (Luzhou City), and Guizhou Provinces.

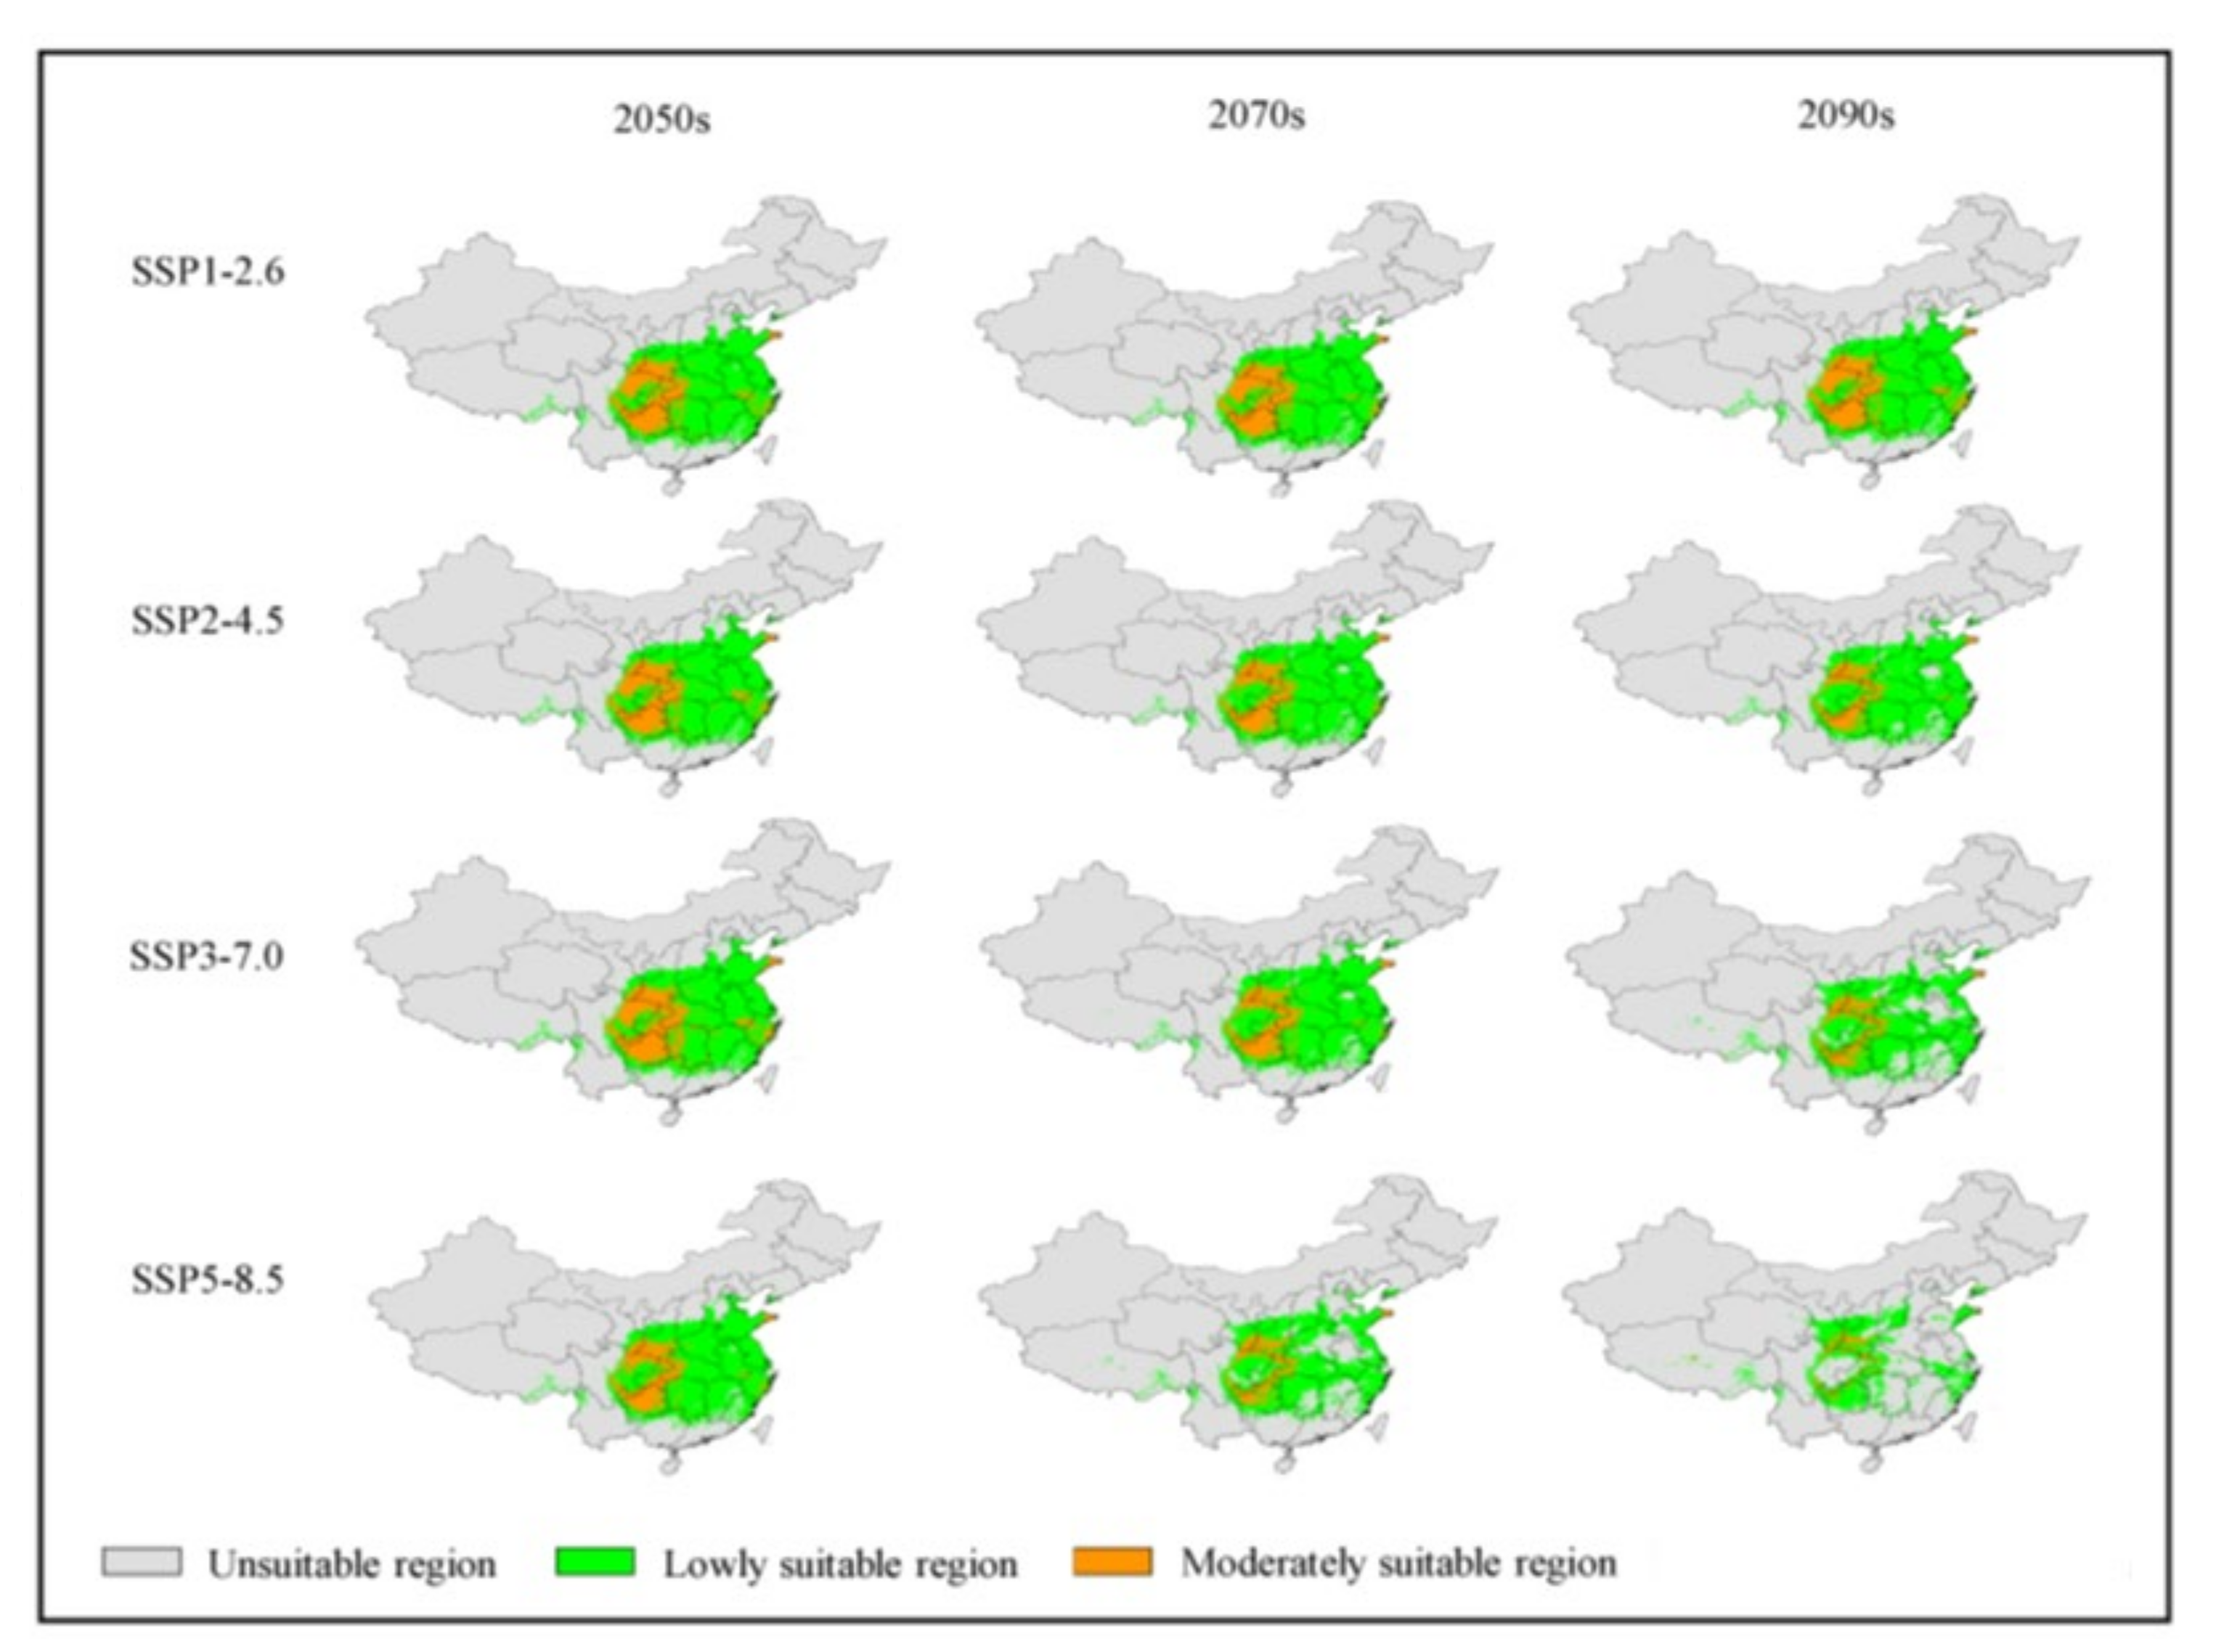
3.4. Analysis of Future Potentially Suitable Regions

For the three future periods, the potentially suitable regions of E. ulmoides under different climate scenarios were variable, but the change trends had certain similarities (Figure 4, Figure 5 and Figure 6; Table 2). Under all climate scenarios, both the area of moderately and highly suitable regions significantly decreased. Except for the 2090s under the SSP5-8.5 climate scenario, the area of poorly suitable regions increased significantly under all the other climate scenarios.
Under the SSP1-2.6 scenario, the total area of the suitable regions for E. ulmoides was not significantly altered (97.85–101.81% of current corresponding value); however, it did decrease and increase slightly in the 2070s and 2090s. Projecting into the future, the poorly suitable regions for E. ulmoides increased significantly (137.08–140.84% of the current corresponding value), of which the poorly suitable regions increased the most in the 2090s. In the 2050s, the highly suitable regions were 0.04 × 10⁴ km2, accounting for only 3.73% of the current corresponding value.
Under the SSP2-4.5 scenario, the total area of the suitable regions for E. ulmoides initially increased and then decreased, accounting for 100.77% in the 2050s, 96.92% in the 2070s, and 93.33% in the 2090s, respectively. The poorly suitable regions expanded significantly and exhibited an increasing trend (140.76–145.51% of the current corresponding value). The moderately suitable regions were 31.62 × 10⁴ km2 in the 2090s, accounting for only 32.81% of the current corresponding value.
Under the SSP3-7.0 scenario, the total area of the suitable regions for E. ulmoides initially increased and then decreased, where the total suitable regions in the 2090s were only 176.23 × 10⁴ km2, which accounted for 83.47% of the current corresponding value. Projecting into the future, the moderately suitable regions increased significantly (accounting for 132.83–147.55% of the current corresponding value), and to the greatest degree in the 2070s to 167.73 × 10⁴ km2.
Under the SSP5-8.5 scenario, the total area of the suitable regions for E. ulmoides exhibited a decreasing trend in the future periods, with the most significant decrease occurring in the 2090s at only 98.87 × 10⁴ km2, accounting for 46.83% of the current corresponding value. The moderately suitable regions showed an increasing trend in the 2050s and 2070s, accounting for 147.55% and 125.13% of the current corresponding value, respectively. In the 2090s, the moderately suitable regions showed a decreasing trend (only 87.99 × 10⁴ km2), accounting for 77.40% of the current corresponding value. The highly suitable regions decreased significantly, and there were minor changes between the three future periods. In the 2050s, the highly suitable regions were 0.02 × 10⁴ km2, whereas in the 2070s and 2090s the highly suitable regions were 0.01 × 10⁴ km2.

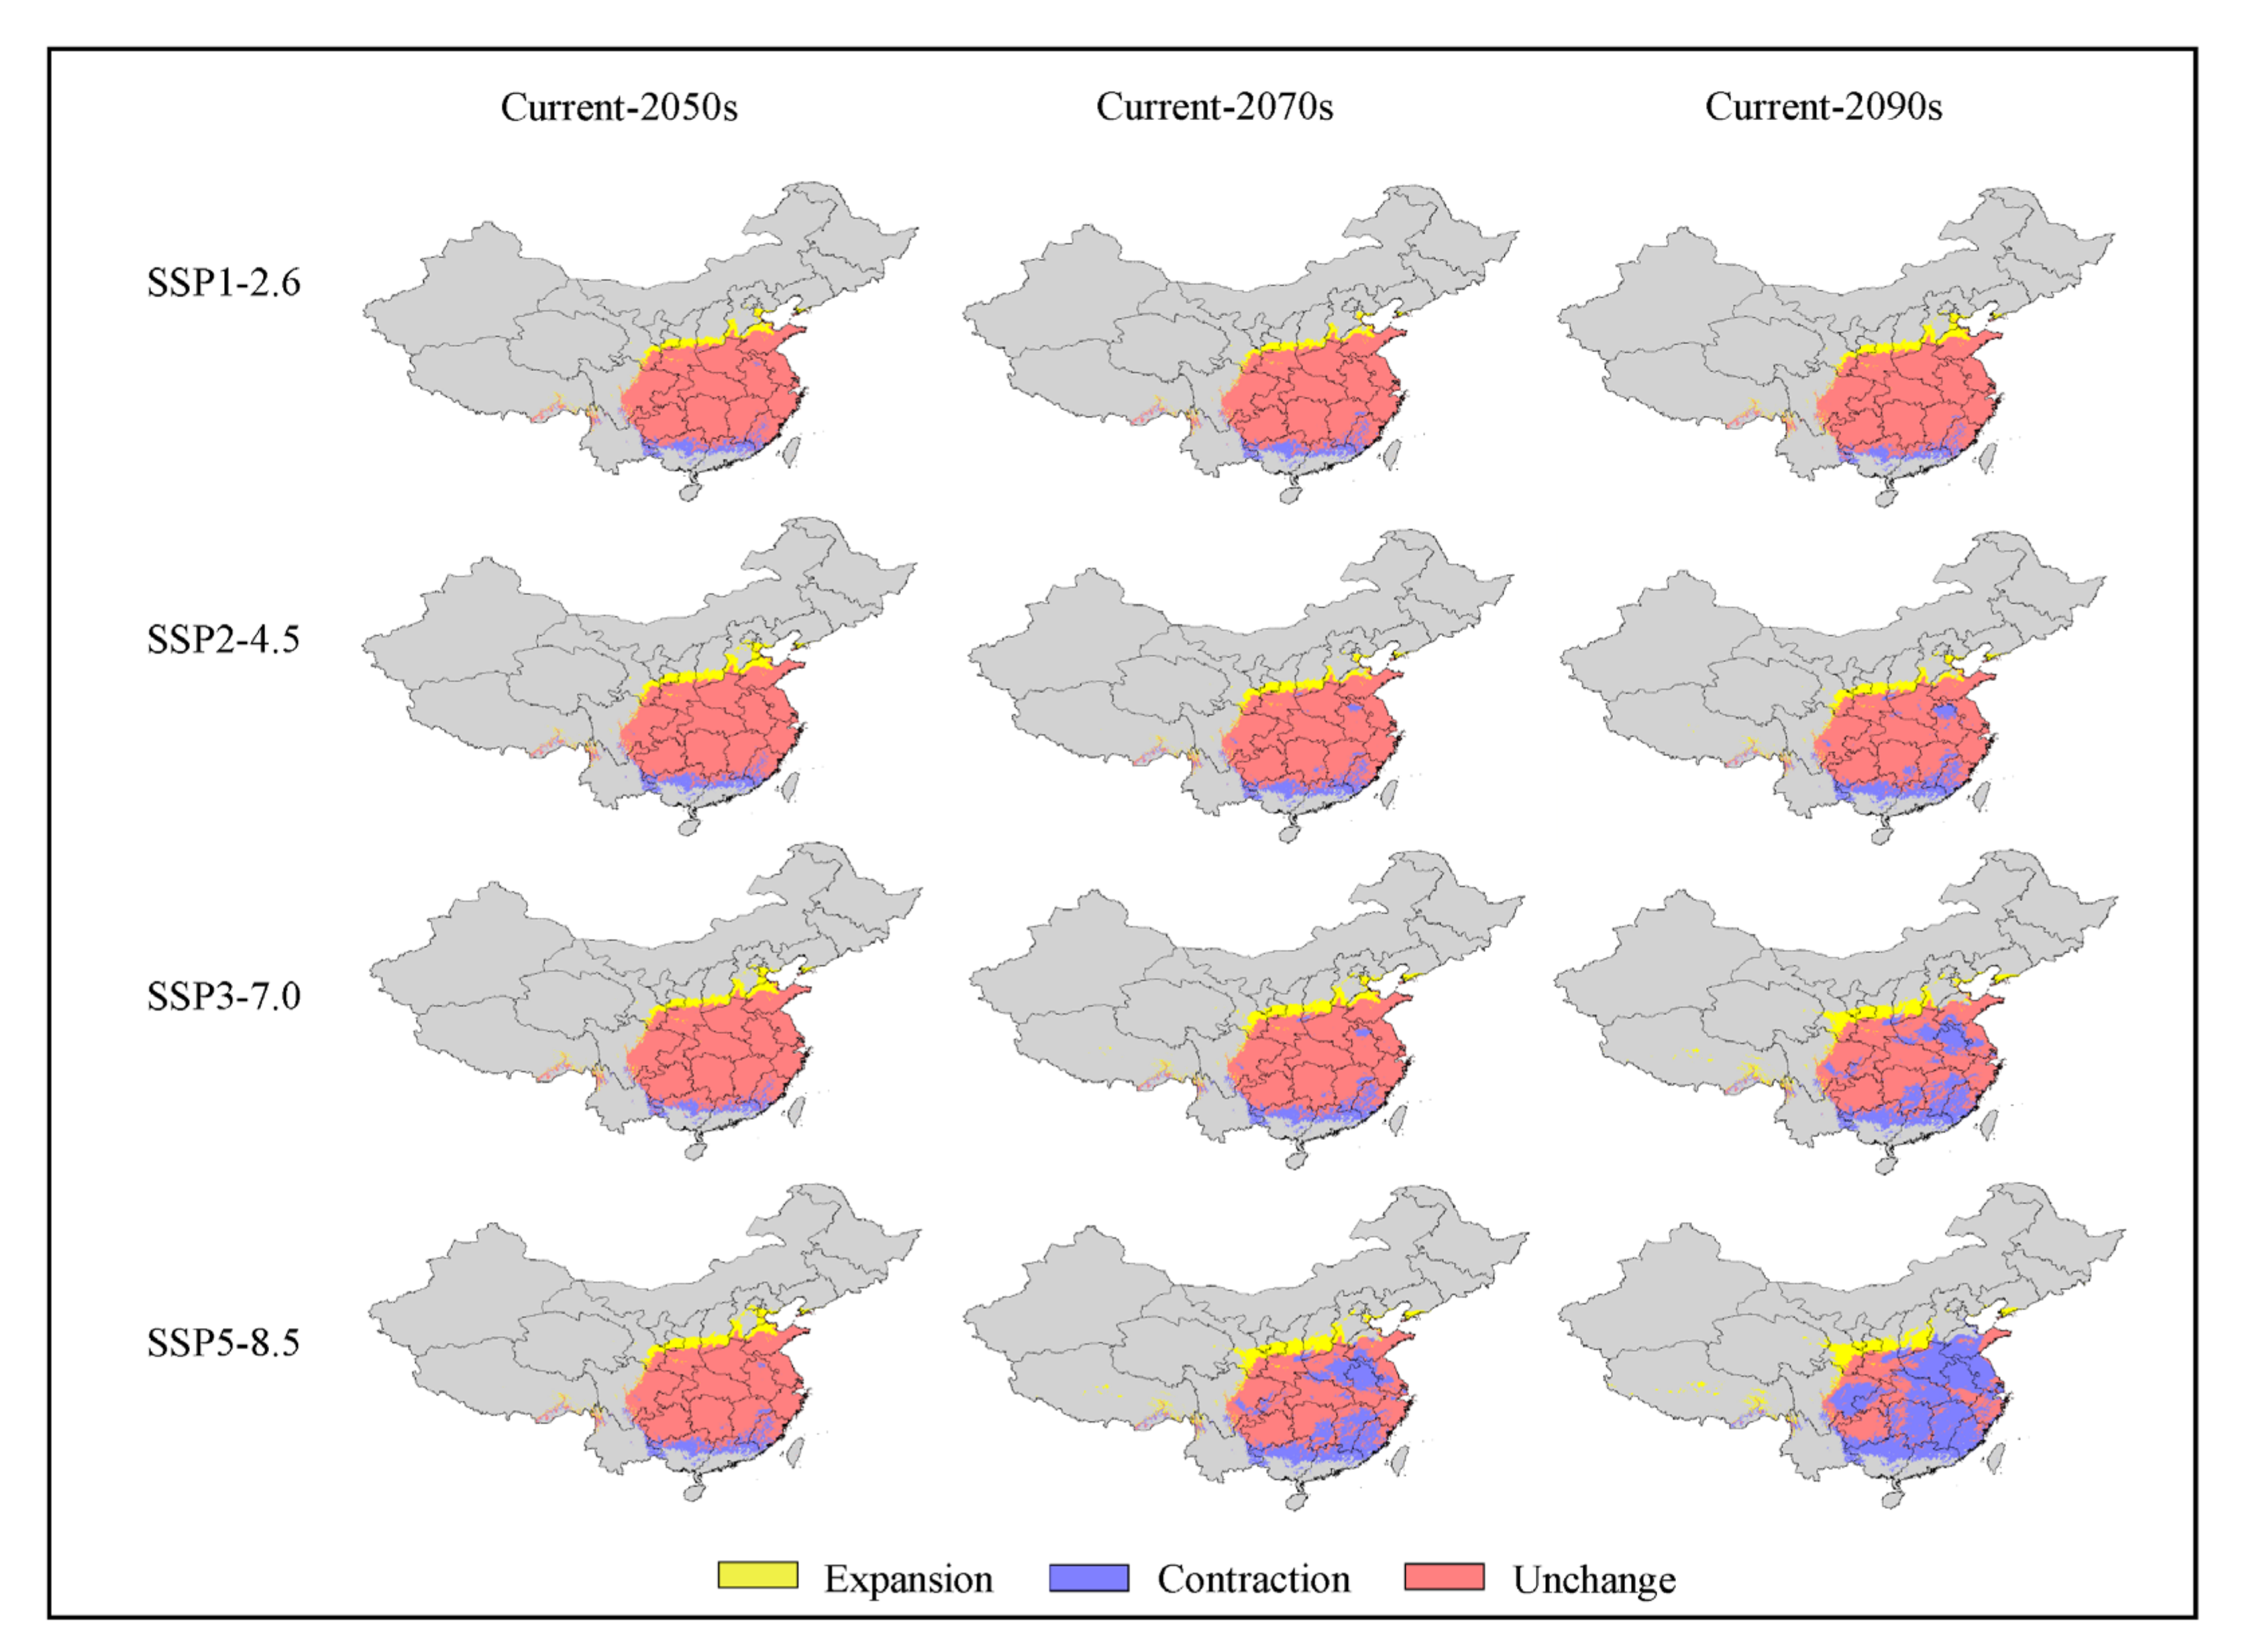
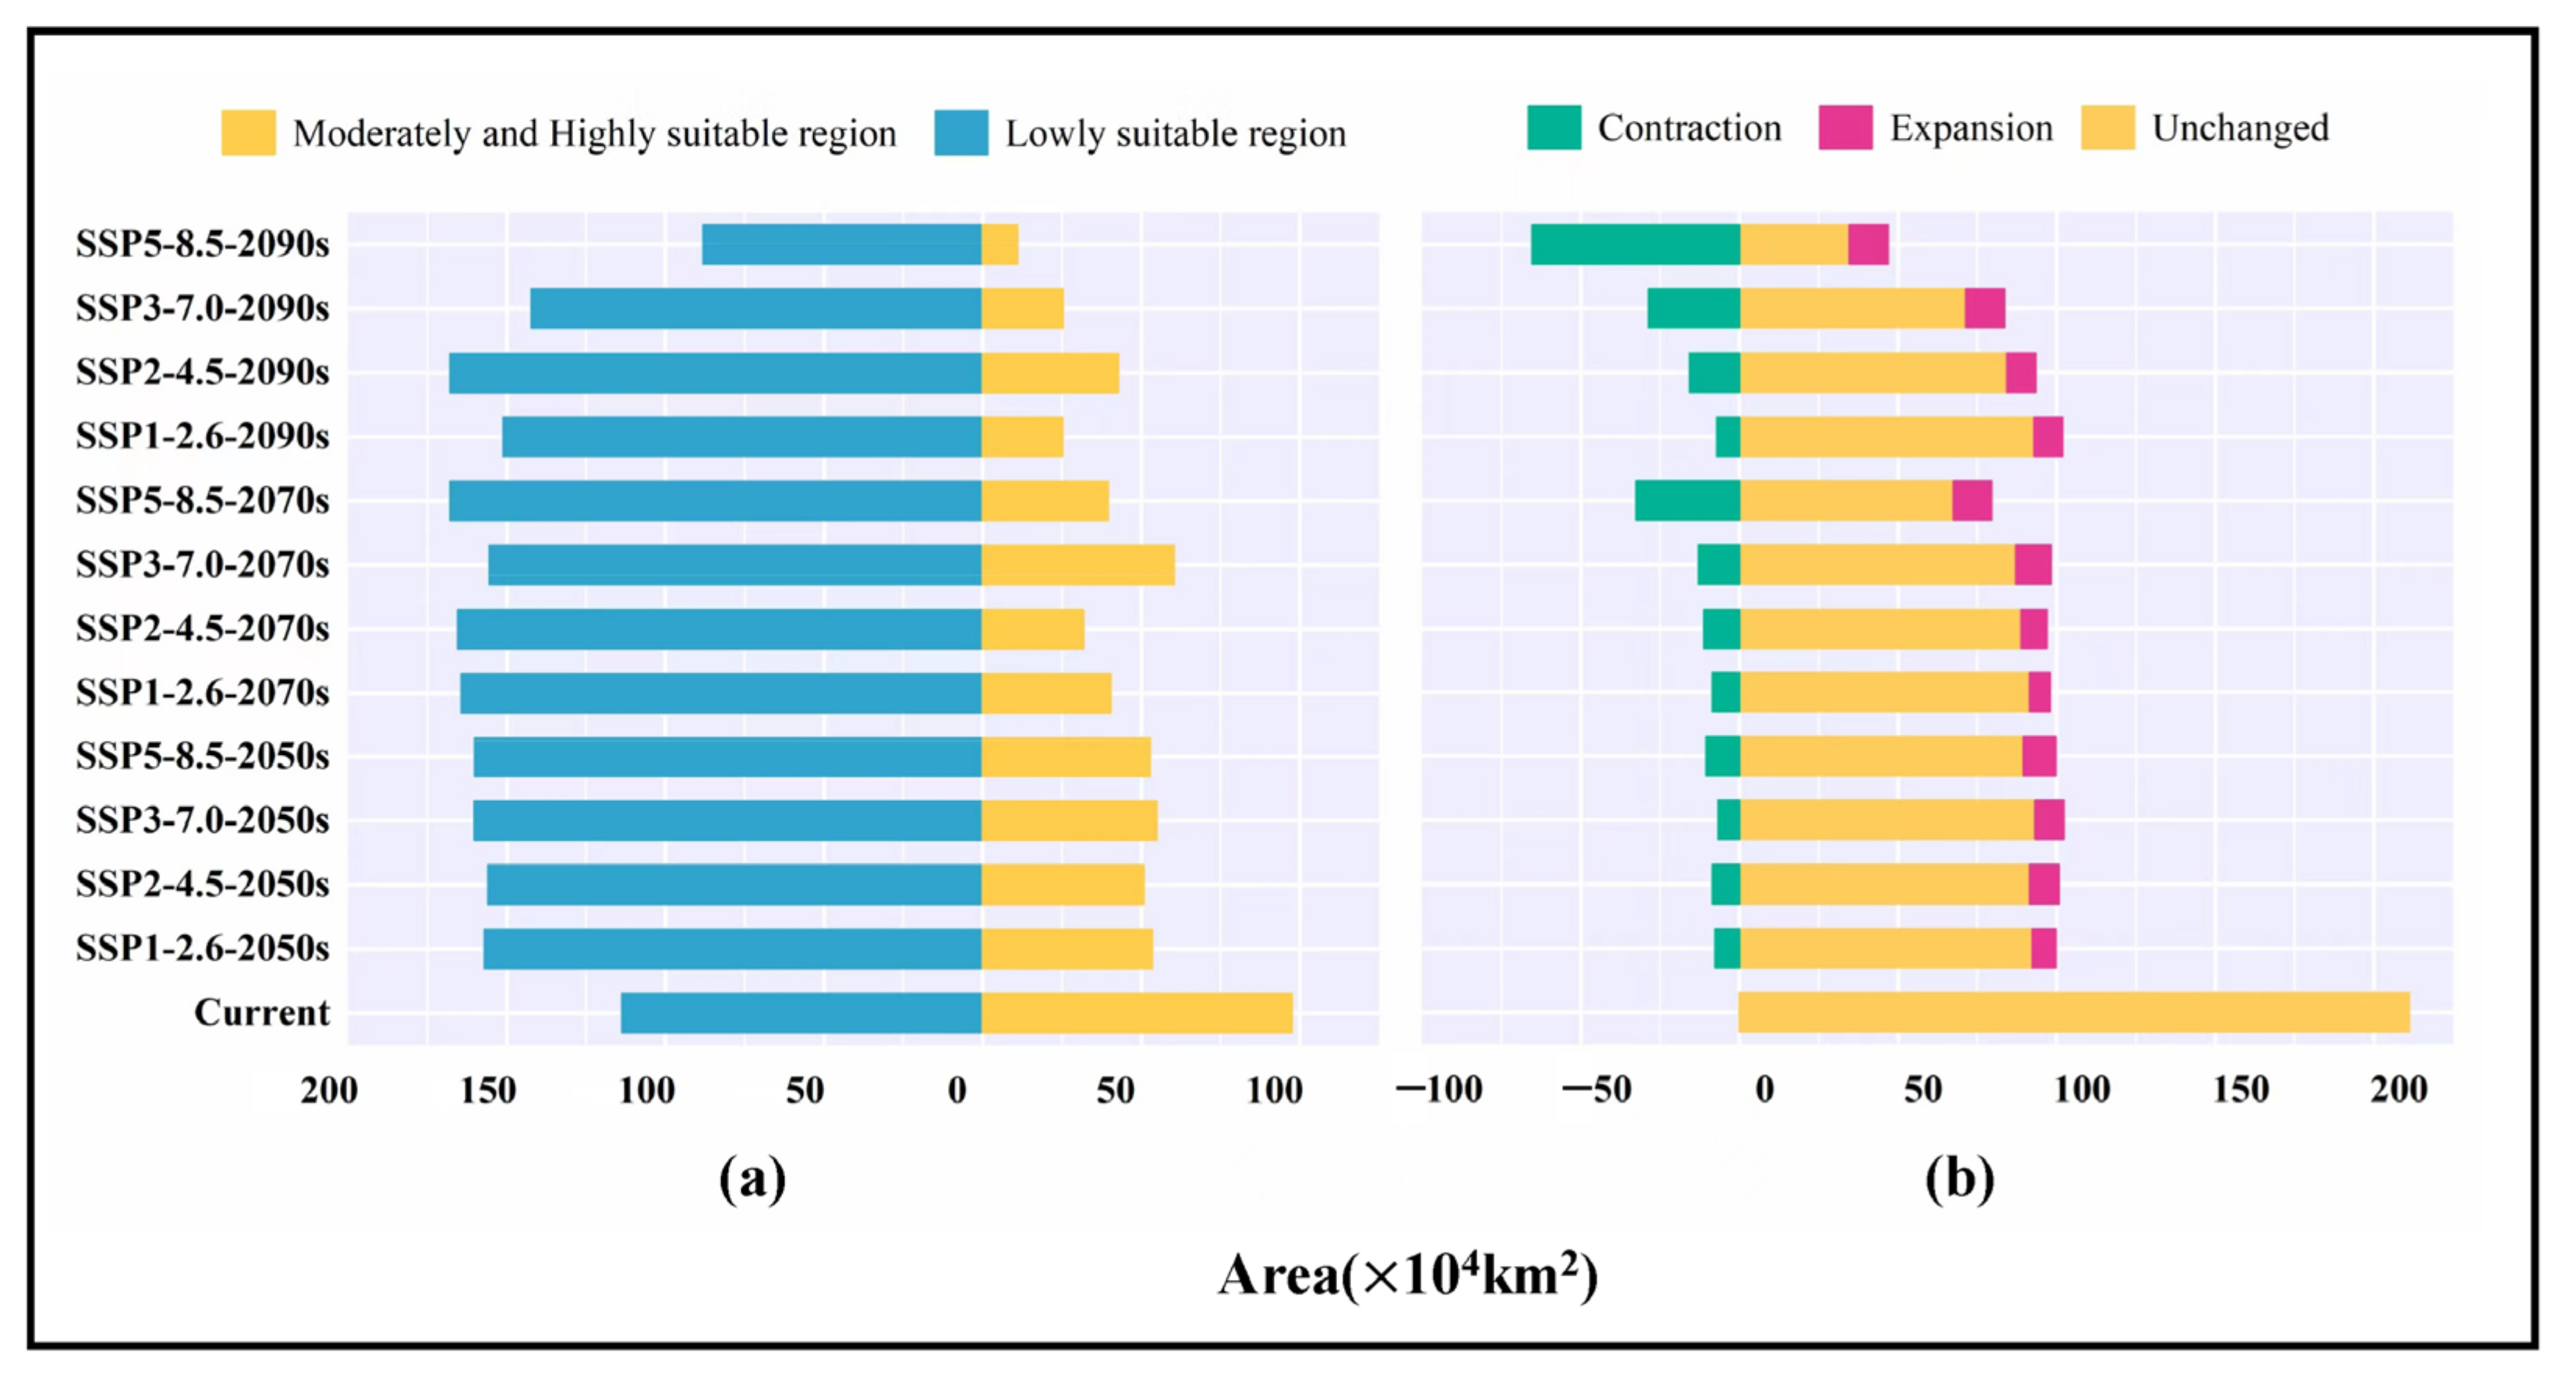
3.5. Analysis of Low Impact Areas

The prediction of the low impact areas varied significantly under different climate scenarios (Figure 7; Table 3). With the increased severity of climatic scenarios (SSP1-2.6 → SSP5-8.5), the distribution of low impact areas for E. ulmoides decreased (192.77 × 10⁴ → 73.37 × 10⁴ km2). The results indicated that Guizhou, eastern Chongqing, southern Shaanxi, western Hubei, eastern Shandong, central Zhejiang, southern Anhui, central Sichuan, southern Gansu, and northern Yunnan were low impact areas for the growth of E. ulmoides under any climatic scenarios (Figure 7). Furthermore, southern Shandong, northern Jiangsu, northern Henan, eastern Hunan, and northern Jiangxi were classified as low impact areas under three climatic scenarios.

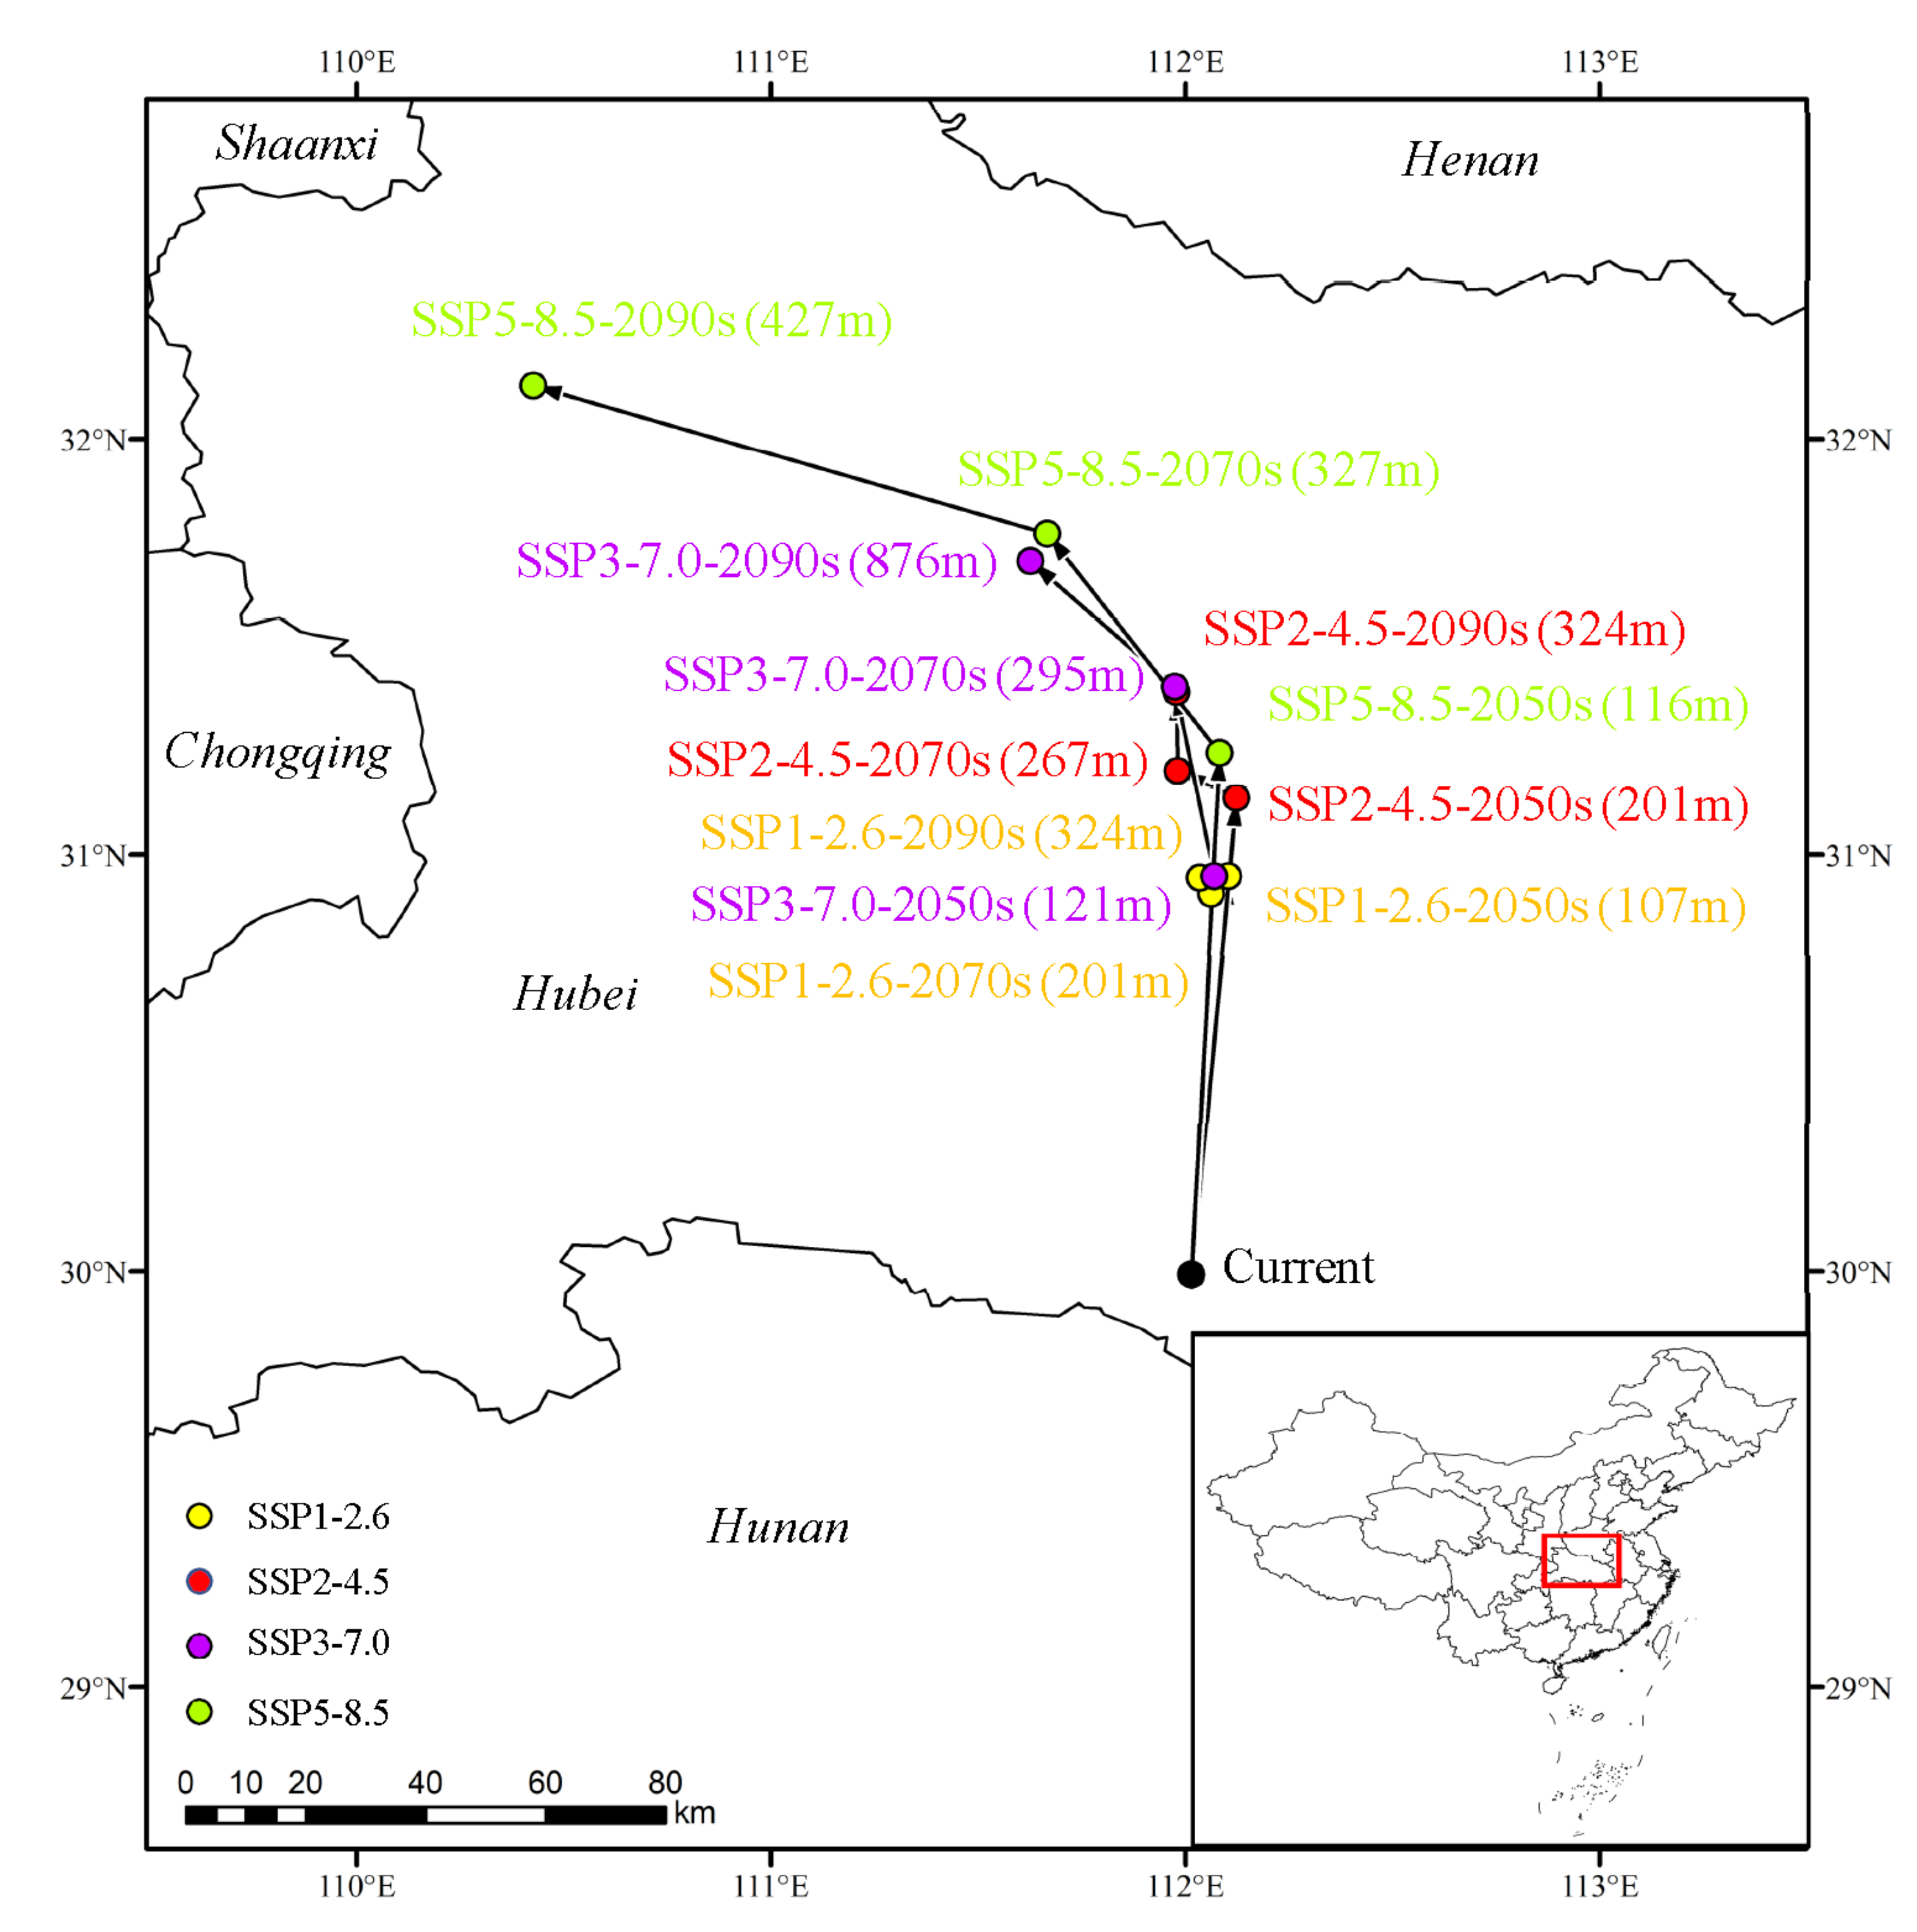
3.6. Shift in Distribution Center of the Suitable Region

The prediction results revealed that the potentially suitable regions for E. ulmoides tended to shift to the northwest (Figure 8). Currently, the center of the potentially suitable region for E. ulmoides is located in Gongan County, Jingzhou City, Hubei Province (112.02° E, 29.99° N). Under the SSP2-4.5 scenario, the center of potentially suitable regions shifted from Gong’an County, Jingzhou City, Hubei Province to Dongbao District, Jingmen City, Hubei Province. The centroid initially shifted 183.64 km (2050s) to the northeast, and then 106.79 km (2070s) to the northwest; finally, it moved 106.91 km (2090s) in a northwest direction. Under the SSP5-8.5 scenario, the center of the potentially suitable region shifted from Gong’an County, Jingzhou City, Hubei Province to Badong County, Enshi Tujia and Miao Autonomous Prefecture, Hubei Province. The centroid initially shifted from the northeast by 138.38 km (2050s), and then to the northwest by 69.89 km (2070s); finally, it moved 125.81 km (2090s) along a northwest direction.

4. Discussion

4.1. Model Accuracy Analysis

For decades, all kinds of species distribution models (SDM) have been widely used to evaluate the species’ ecological needs and predict their potentially suitable distribution. However, through the comparison of many researchers, it was found that the maximum entropy model is more accurate than other models, possessing the best sensitivity and better predictive performance [61,62,63]. As a simple and highly maneuverable model, MaxEnt should be optimized before use, otherwise the obtained prediction results may have large fitting deviations and convey an incorrect assessment of species niches [64]. This study systematically and comprehensively optimized the quality control of species distribution points, screening of environmental variables, classification of suitable areas, optimization of regularization multipliers and factor types, and the selection of atmospheric circulation and social sharing economy models to ensure the accuracy and credibility of the model. Under the optimal model conditions in this study, the difference between the absolute value of training and testing AUC (|AUCDIFF|) was 0.0046, which showed excellent predicted model results. In this study, four different shared socioeconomic paths (SSPs, SSP1-2.6, SSP2-4.5, SSP3-7.0, and SSP5-8.5) were selected to the distribution of potentially suitable regions for E. ulmoides, while most of previous studies only used two idealized scenarios, which cannot reflect general climate change, so adding two climate scenarios can better increase the prediction accuracy of the modeling [65,66,67].

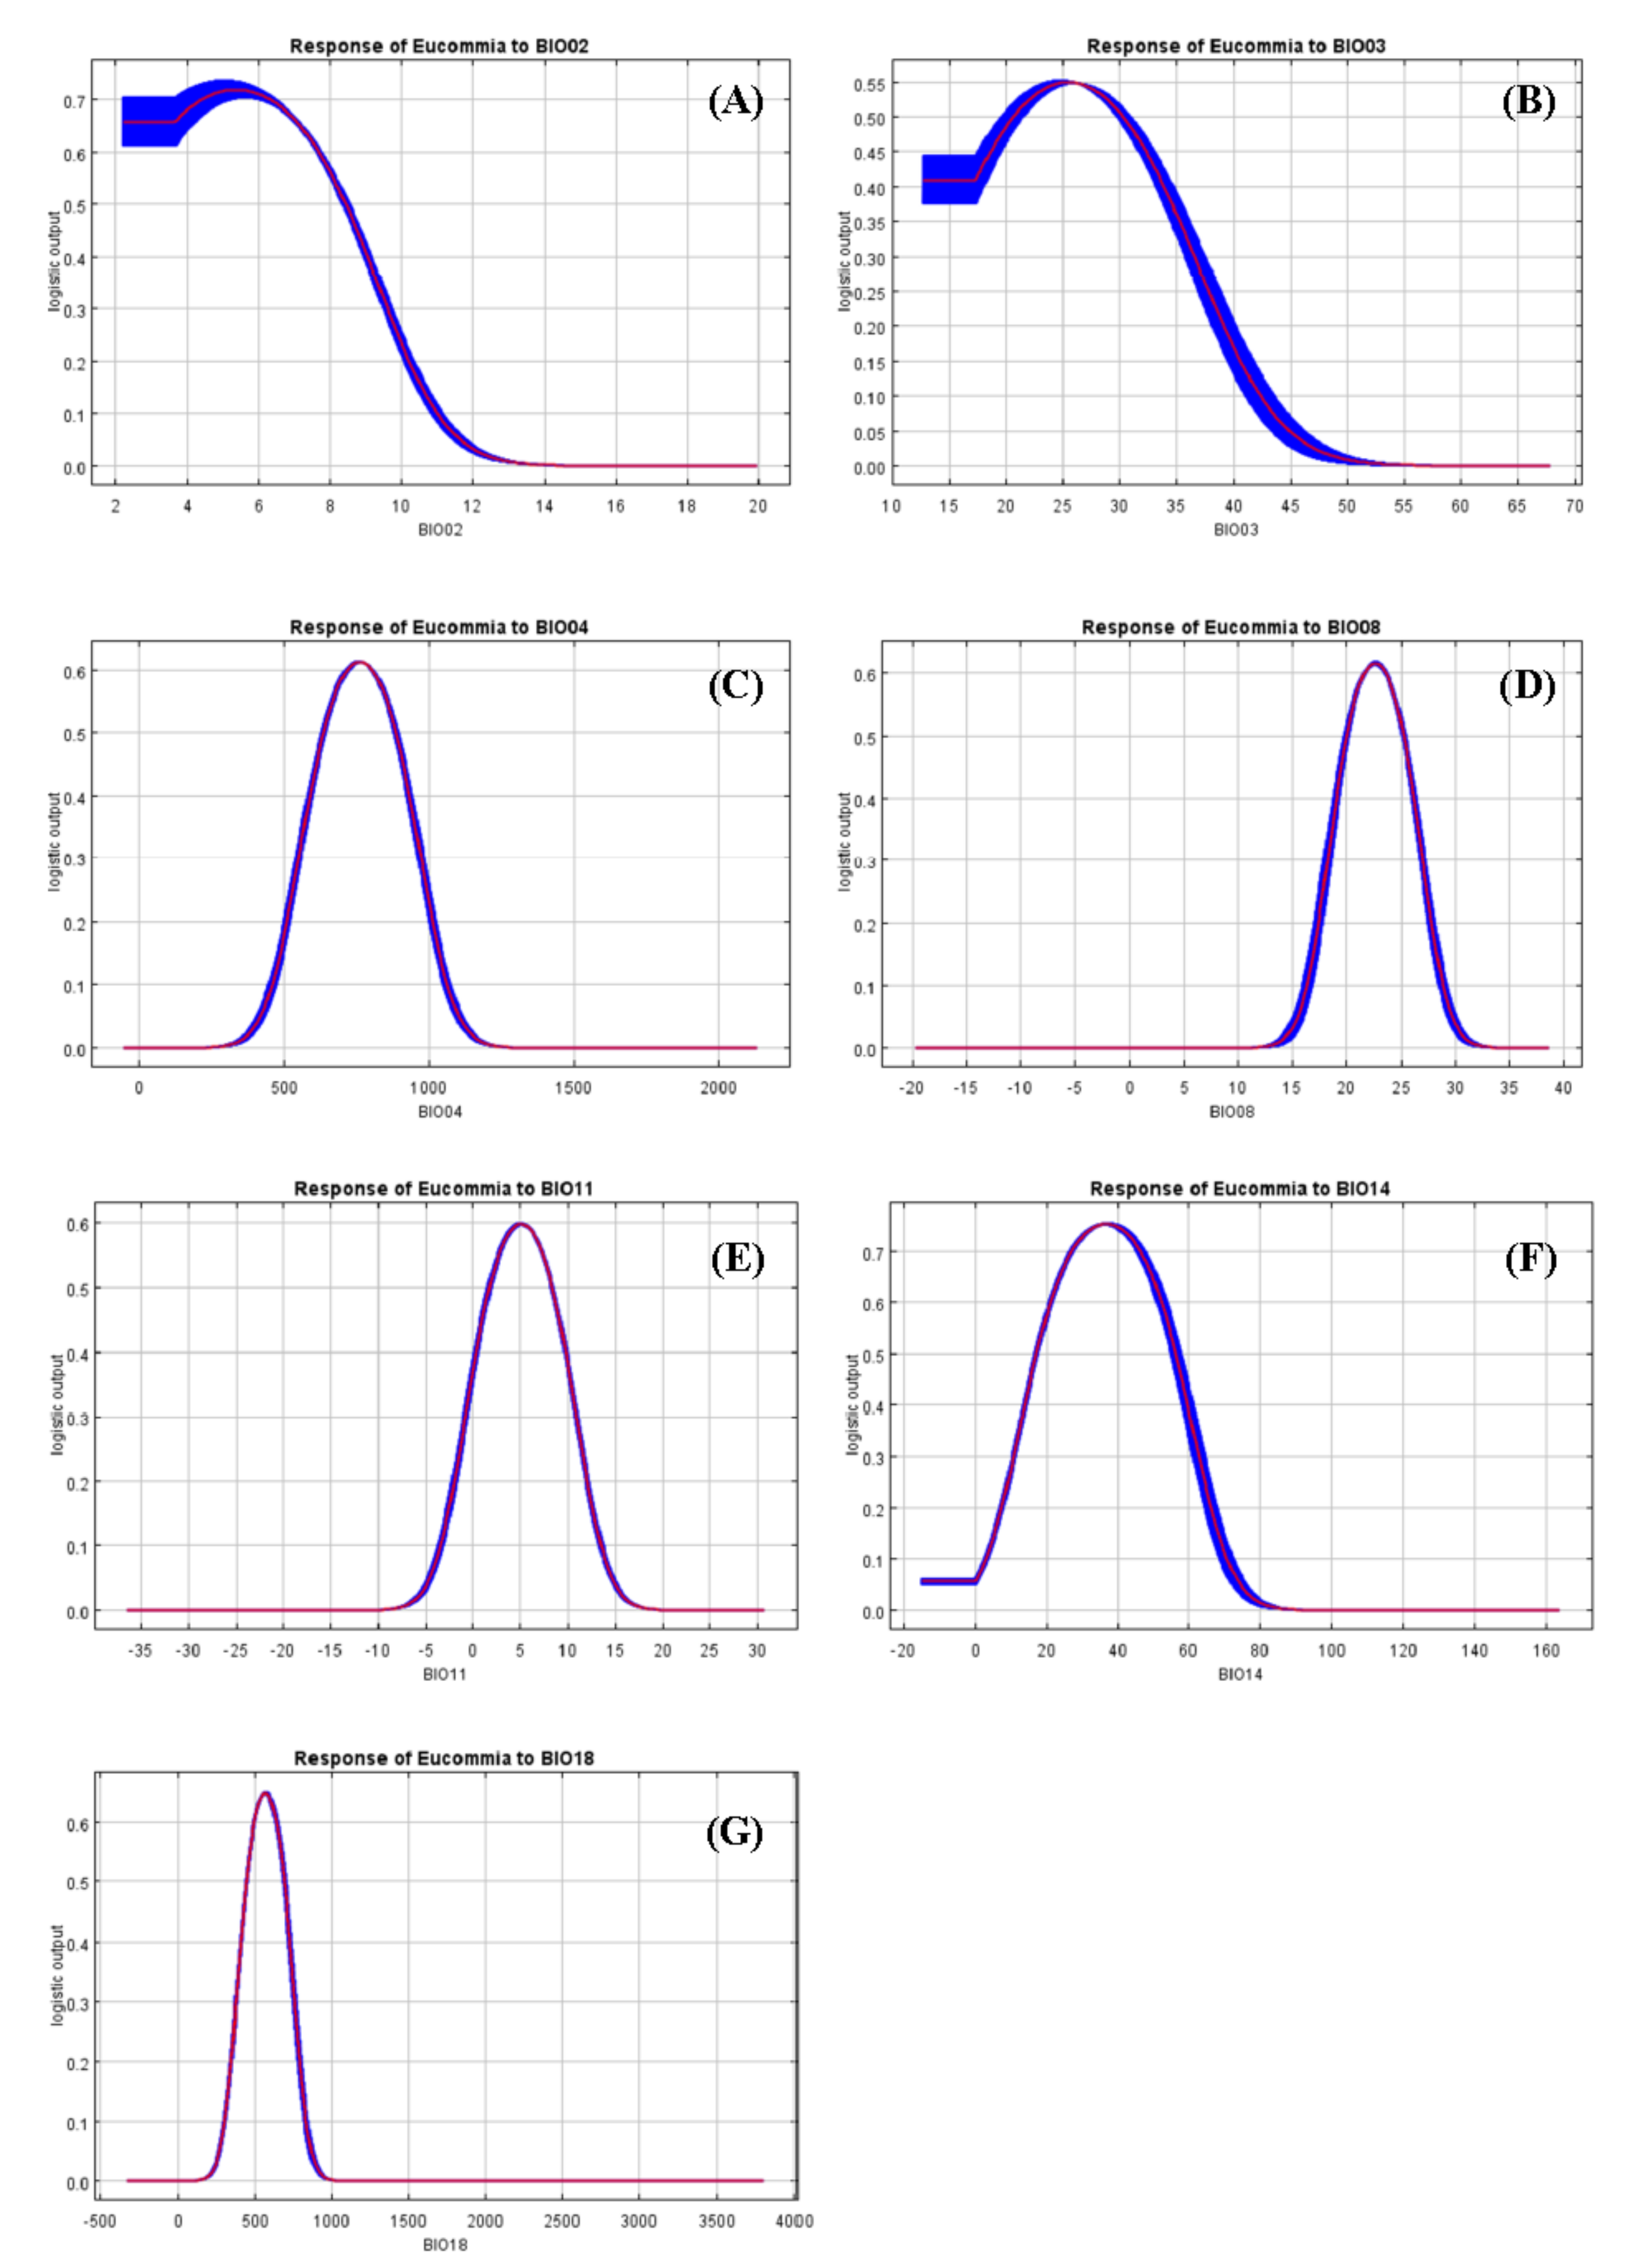
4.2. Impacts of Environmental Variables on Species Distribution

The spatial distribution of plants is intimately associated with environmental conditions, where climate is one of the important factors that determines the geographical distribution of plants at the regional scale [68]. Results based on contributing climatic factors showed that the influences of the mean diurnal range (BIO02) and mean temperature of coldest quarter (BIO11) were highest, at 53.8% and 41.4%, respectively (Table 1). They were the decisive factors that affected the geographical distribution of E. ulmoides. The influence of temperature on plant growth is comprehensive [69]. It can not only affect photosynthesis, respiration, transpiration, and other metabolic processes, but also affect the synthesis and transportation of organic matter [70]. Temperature is of vital importance for the growth and reproduction of E. ulmoides. E. ulmoides generally thrives on the sunny or semi-sunny slopes of hills or mountainous areas at altitudes of from 200 to 1300 m and annual average temperatures of 9–20 °C [39,71] (Figure A1 and Figure A2; Table 1).
The average monthly temperature differences between day and night ranged from 2.1 °C to 8.4 °C, which may have been because daytime/nocturnal temperature differences can affect plant growth. Moderate temperature differences at the flowering and fruit stage can improve yield and fruit quality, but too high temperature differences will lead to poor growth and yield reduction [72]. The average suitable temperature range in the coldest season was 2.1–7.8 °C, as E. ulmoides seeds can break dormancy and complete germination and other life activities under warm conditions. Natural regeneration, from seeds, is very important for the maintenance of natural plant populations, especially in trees such as E. ulmoides, where vegetative reproduction efficiency is very low [39]. The seeds of E. ulmoides mature in late October every year and germinate under warmer temperatures the next spring [39]. Therefore, suitable germination temperature in spring is of great significance for the life cycle of E. ulmoides. A previous study showed that the optimal germination temperature of E. ulmoides seeds was 13 °C to 20 °C, which was consistent with our prediction results. Meanwhile, through our extensive field survey, we also found that E. ulmoides thrives in warm, humid, and sunny environments, and is suitable for growing on fertile and breathable soil.
By analyzing response curves, we can also understand under what conditions E. ulmoides will be vulnerable to climate threats in the future and implement corresponding intervention measures accordingly (Figure A2). The growth and development of E. ulmoides is closely related to precipitation. The annual rainfall required for E. ulmoides to thrive ranges from ~450 to 1500 mm, and its fastest growth period occurs from April to October, which requires 80% of the annual precipitation [73]. For example, south of the Yangtze River the precipitation is substantial and uniform throughout the year, which can meet the growth needs of E. ulmoides. In the Aksu region of Xinjiang, rainfall is only <100 mm; thus, artificial irrigation is required to ensure its normal growth [74]. E. ulmoides has a strong adaptability to temperature and generally grows in areas where the annual average temperature ranges from 9 to 20 °C, where the extreme high temperature is not higher than 44 °C, and the extreme low temperature is not lower than −19 °C [39,71]. For instance, Zunyi in Guizhou, Luoyang in Henan, Jiangpu in Jiangsu, and Yunxi in Hubei belong to the central and northern subtropical and warm temperate regions, which can meet the temperature conditions that support the growth of E. ulmoides, and are the main E. ulmoides production areas in China [75]. However, E. ulmoides cultivated in Heilongjiang and Liaoning regions will suffer from severe cold below −20 °C in winter. Although its roots can grow normally, the aboveground portions are subject to severe freezing; thus, artificial warming measures should be implemented.

4.3. Spatial Dynamics of Potentially Suitable Areas

E. ulmoides is highly adaptable and is primarily distributed across the central regions of China. The prediction results revealed that the E. ulmoides distribution range in China was 31°–45° N, 101°–124° E, which was consistent with the previous research results of Liu Panfeng et al. [76]. However, compared with the previous study by Liu Panfeng et al., we also predicted the potentially E. ulmoides suitable regions under four climate scenarios (SSP1-2.6, SSP2-4.5, SSP3-7.0, and SSP5-8.5) in future (2050s, 2070s, and 2090s). We found that the change trend of potentially E. ulmoides suitable regions from 2050s to 2070s was basically consistent with that from 2070s to 2090s. This finding confirms a previous study of Robinia pseudoacacia L. in Europe, which means we can take reasonable measures to protect E. ulmoides at least 20 years in advance [77]. For some endangered plants (such as E. ulmoides), reasonable protection measures are essential for the maintenance of the populations. As the peel of E. ulmoides contains abundant colloids, under natural conditions the germination rate of its seeds is very low. Meanwhile, due to the deterioration of the global warming and artificial overexploitation, wild E. ulmoides resources have decreased sharply. Therefore, it is very urgent to establish the E. ulmoides Natural Reserve as soon as possible.
Various species adopt different strategies to deal with global warming; some respond by migrating to higher latitudes or altitudes, while others adapt by altering their physiological structures or growth and development rhythms. Yang et al. predicted the geographical distribution characteristics of Pteroceltis Tatarinowii in the future by using the MaxEnt modeling and ArcGis. The results indicated that the potentially suitable regions for deciduous trees tended to migrate to higher latitudes and northern regions [78]. With the help of a meta-analysis, Chen et al. concluded that species are migrating to higher latitudes at a rate of 16.9 km per decade [79]. Our prediction results were consistent with earlier studies, which reported that the potentially suitable region for E. ulmoides gradually shifted to higher latitudes and northern regions. Under the trend of global warming, by the end of this century, the global temperature is expected to rise between 1.4 and 5.0 °C, which will lead to a serious decline of suitable areas in low latitudes, such as Guangxi [80]. The samara of E. ulmoides has strong symmetry and proper size, which is very conducive to wind propagation in aerodynamics. Furthermore, fossil data also showed that the seeds of E. ulmoides fruits were reduced from two to one, possibly as an adaptation to wind propagation [81]. E. ulmoides has great cold resistance and easily spreads to high altitudes in the northwest, and the global warming trend will gradually accelerate this process [82].
For example, under the SSP5-8.5 scenario, the potentially suitable region for E. ulmoides in all time periods exhibited a significant decreasing trend. The distribution of E. ulmoides shifted to high latitude regions, and by the 2070s Guangxi, Guangdong, southern Jiangxi, northern Anhui, and eastern Henan were no longer suitable for its growth. By the 2090s, with further increases in the global temperature, the potentially suitable regions for E. ulmoides significantly reduced, where Hunan, Jiangxi, Henan, Anhui, northern Jiangsu, and western Shandong were no longer suitable for its growth. The potentially suitable regions for E. ulmoides in Shaanxi, Hubei, and Chongqing were also shrinking. We inferred that the reduction in low latitudes was caused by abnormal temperature increase.

4.4. Suggestions on Resource Conservation and Development

Currently, the wild E. ulmoides resources are on the verge of being endangered. Our field survey found that E. ulmoides had many distribution points in the surveyed areas, but the number of individual plants was very small. In some distribution sites, there were even no more than 20 plants, and no live seedlings were renewed. Wild E. ulmoides populations are highly susceptible to habitat changes and human activities. E. ulmoides has been listed on the Red List of Endangered Plant Species in China [83]. Artificial cultivation technologies have been comprehensive, so it is necessary to predict potentially suitable regions for E. ulmoides and, subsequently, to guide its rational planting and cultivation [84]. The results of the model showed that regardless of the future climate scenario, Guizhou, eastern Chongqing, southern Shaanxi, western Hubei, eastern Shandong, central Zhejiang, southern Anhui, central Sichuan, southern Gansu, and northern Yunnan would be the potentially suitable regions for E. ulmoides. This is because these areas are less impacted by climate; thus, they are suitable for artificial planting. Since 1980, Hanzhong City in Shaanxi Province has relied on the development of an E. ulmoides industry to revitalize the economies of mountainous areas and overcome poverty. E. ulmoides resources have achieved unprecedented development, and at present there are ~300 million E. ulmoides trees in Shangluo City, which account for ~31% of the total population of E. ulmoides trees in China [85].
E. ulmoides is rich in chlorogenic acid and flavonoids, which are used in a rare tonic medicine in China. According to the MaxEnt modeling, the overall potentially suitable region for the growth of E. ulmoides in China is 211.14 × 10⁴ km2. The sum of moderately and highly suitable regions is 97.46 × 10⁴ km2, which is significantly higher than the current planting area of E. ulmoides in China (~0.35 × 10⁴ km2) [85]. Consequently, there is enormous potential for the introduction and planting of E. ulmoides in various suitable regions across China.
Presently, the highly suitable regions for E. ulmoides growth are primarily distributed across a small portion of northern Sichuan and the border areas of Sichuan, Chongqing, and Guizhou. As chilly air is blocked by the Qinling Mountains, these areas have higher annual average temperature and accumulated temperature than other areas at the same latitude, with a longer frost-free period. Thus, they are currently the most suitable areas for the growth of E. ulmoides in China. Breeding bases for high-quality germplasm resources and simulated cultivation areas should be established in these areas to study the medicinal, economic, ecological, and ornamental garden values of E. ulmoides to fully realize its multiple benefits. Zhao et al. found that a significant number of Chinese fir trees died at the boundary of a low-suitability zone, which may have been due to the low climate suitability in these areas. If certain ecological factors exceed the tolerance range of Chinese fir, they will not survive [84]. Therefore, we suggest that artificial cultivation should not proceed in poorly suitable regions, which should instead be utilized as key investigation areas of wild germplasm resources to facilitate the strengthening of their protection and management.
Species conservation involves not only the preservation of a certain number of individuals but also conserving as much genetic diversity as possible [75]. Through our investigations we concluded that the main reasons for the genetic loss of E. ulmoides were as follows: (1) A lack of understanding of conservation resources and predatory exploitation have seriously damaged wild and semi-wild resources. (2) The large-scale planting of trees with a single provenance results in a large area of E. ulmoides forest with a narrow genetic basis. (3) Due to innovations in cultivation technologies and production demands, plant lines with short growth cycles, large bark yields, and high gum content are often selected for artificial propagation (e.g., cutting, tissue cultures, and grafting).
We propose that the conservation of E. ulmoides should focus on the following aspects: (1) National departments should formulate E. ulmoides resource cultivation planning and relevant policies, while increasing investments. (2) Establish ex situ protection sites to promote gene recombination and the rejuvenation of species. (3) A comprehensive nationwide survey of wild E. ulmoides resources should be conducted to collect species with obvious differences in attributes under various natural conditions. (4) Differences in geographical distribution and external morphologies are not necessarily genetic differences. Thus, it is necessary to combine molecular biological strategies to further study the intraspecific variations of E. ulmoides (e.g., Restriction Fragment Length Polymorphism and Random Amplified DNA Polymorphism) [86]. Only by fully elucidating the genetic diversity and species variation types can effective scientific conservation strategies be formulated.

4.5. Study Limitations

The development of the MaxEnt model relies primarily on bioclimatic factors and geographical data on species distribution, where the quantity and quality of species distribution points will directly impact the accuracy of the model [87]. The basic assumption of the MaxEnt model is that random or unbiased sampling is conducted in all research areas. E. ulmoides is primarily distributed in low mountains and valleys. Due to the constraints of various conditions, the sampling points are mostly concentrated in areas that are easy to collect, and the random samples obtained under the environmental gradient usually lack representativeness [87]. As a result, this causes the species distribution points used for modeling to deviate from the actual distribution of the species, reducing the prediction accuracy of the model. Future researchers can solve this problem by conducting a more extensive and accurate resource survey. In addition, the temporal differences between environmental data and E. ulmoides distribution data may also lead to bias in the study results. Due to the relative difficulty in obtaining real-time climate data, contemporary climate data (1970–2000) from the WorldClim database were used, which are not synchronized with the time of E. ulmoides distribution data. This bias should also be overcome in future studies.
For this study, we considered only the impacts of climate on species distribution. For technical reasons, we failed to refer to other biotic and abiotic factors such as interspecies interactions (competition, mutualism), human disturbances, and ecological factors (e.g., soil, topography, altitude, slope), which can have direct or indirect impacts on model results [88]. Although it is urgent that these technical issues be resolved in the future, the results of this study still have important reference significance for the resource zoning of E. ulmoides.

5. Conclusions

For this study, an optimized maximum entropy model was used to predict the distribution and changing trends of potentially E. ulmoides suitable regions in China under different climatic scenarios (SSP1-2.6, SSP2-4.5, SSP3-7.0, and SSP5-8.5) in recent (1970–2000) and future periods (2050s, 2070s, and 2090s). The mean diurnal range and mean temperature of the coldest quarter were the decisive factors that affected the geographical distribution of E. ulmoides, which were temperature-related factors. Temperature is of vital importance for the growth and reproduction of E. ulmoides. Core distributional shifts indicated that the center of potentially suitable regions for E. ulmoides tended to shift to the northwest. The global warming trend will gradually accelerate this process. Climate change will lead to further reduction of the distribution of E. ulmoides and intensify its endangerment. Reasonable conservation measures must be taken as soon as possible to protect this species. We suggest that breeding bases should be established in the highly suitable regions of E. ulmoides to preserve high quality germplasm resources. Meanwhile, the poorly suitable regions should instead be utilized as key investigation areas of wild germplasm resources to facilitate strengthening of their protection and management. In sum, this study will provide a scientific basis for the conservation and sustainable development of E. ulmoides resources.

Author Contributions

Conceptualization, S.X.; data curation, H.S. (He Si); formal analysis, H.S. (Hongxia Sun); funding acquisition, Z.W. and J.N.; investigation, X.L.; methodology, S.X.; project administration, J.N.; resources, X.L.; software, S.X.; supervision, S.W.; validation, H.S. (He Si); visualization, Q.Z.; writing—original draft, S.X.; writing—review and editing, Z.W. All authors have read and agreed to the published version of the manuscript.

Funding

This research was funded by Xi’an Science and Technology Project (20NYYF0057); Fundamental Research Funds for the Central Universities (grant numbers GK202103065, GK202205002, and GK202205004); Shaanxi Provincial Key R & D Program (2022SF-172, 2021SF-383, and 2020LSFP2-21); and Youth Innovation Team Construction Scientific Research Project of Shaanxi Education Department (21JP027); Shaanxi Administration of Traditional Chinese Medicine Projects (Grant number 2021-QYZL-01, 2021-QYPT-001).

Institutional Review Board Statement

Not applicable.

Informed Consent Statement

Not applicable.

Data Availability Statement

The bioclimatic variables are available from the WorldClim-Global Climate Database.

Conflicts of Interest

The authors declare no conflict of interest.

Appendix A

Figure A1. Jackknife test of the importance of variables. Blue, green, and red bars represent running the MaxEnt model with the variable alone, without the variable, and with all variables, respectively. (A): regularization training gain; (B) AUC; (C) Test gain.
Sustainability 15 05349 g0a1
Figure A2. Response curves of seven environmental predictors used in the ecological niche model for Eucommia ulmoides. (A): Mean diurnal range; (B): Isothermality; (C): Temperature seasonality; (D): Mean temperature of wettest quarter; (E): Mean temperature of coldest quarter; (F): Precipitation of driest month; (G): Precipitation of warmest quarter.
Sustainability 15 05349 g0a2
Figure A3. Prediction validation with receiver operator characteristic (ROC) curves using the MaxEnt model. AUC: the area under curve.
Sustainability 15 05349 g0a3
Table A1. The rarefying data points (247) of Eucommia ulmoides in China.
SpeciesLon 1Lat 1SpeciesLon 1Lat 1SpeciesLon 1Lat 1
Eucommia ulmoides100.354130.8958Eucommia ulmoides105.354230.1042Eucommia ulmoides107.104230.1042
Eucommia ulmoides102.020829.8958Eucommia ulmoides105.354232.2292Eucommia ulmoides107.104231.1458
Eucommia ulmoides102.062529.6042Eucommia ulmoides105.395828.1042Eucommia ulmoides107.229224.2292
Eucommia ulmoides102.062531.4792Eucommia ulmoides105.562526.2708Eucommia ulmoides107.229229.1458
Eucommia ulmoides102.145829.6458Eucommia ulmoides105.562528.1875Eucommia ulmoides107.270825.2708
Eucommia ulmoides102.562527.3958Eucommia ulmoides105.562528.3125Eucommia ulmoides107.312530.1458
Eucommia ulmoides102.687528.9375Eucommia ulmoides105.562530.6042Eucommia ulmoides107.312530.2708
Eucommia ulmoides102.729229.3542Eucommia ulmoides105.562532.1875Eucommia ulmoides107.354230.2708
Eucommia ulmoides102.854230.2708Eucommia ulmoides105.687524.5625Eucommia ulmoides107.354228.9375
Eucommia ulmoides103.104229.8125Eucommia ulmoides105.979229.6875Eucommia ulmoides107.354229.1042
Eucommia ulmoides103.270827.6875Eucommia ulmoides106.020828.4375Eucommia ulmoides107.354230.2292
Eucommia ulmoides103.354230.1458Eucommia ulmoides106.062526.0625Eucommia ulmoides107.395829.3542
Eucommia ulmoides103.395829.6042Eucommia ulmoides106.062526.4375Eucommia ulmoides107.479229.3542
Eucommia ulmoides103.645828.2708Eucommia ulmoides106.104225.5625Eucommia ulmoides107.604229.3125
Eucommia ulmoides103.812530.6875Eucommia ulmoides106.104228.5625Eucommia ulmoides107.604229.4375
Eucommia ulmoides104.020828.7708Eucommia ulmoides106.104233.5625Eucommia ulmoides107.604232.1042
Eucommia ulmoides104.312525.5625Eucommia ulmoides106.187528.1458Eucommia ulmoides107.687526.0625
Eucommia ulmoides104.312533.1042Eucommia ulmoides106.229229.1458Eucommia ulmoides107.895825.9792
Eucommia ulmoides104.395826.3542Eucommia ulmoides106.229229.1458Eucommia ulmoides108.020826.3542
Eucommia ulmoides104.437527.1458Eucommia ulmoides106.229232.2292Eucommia ulmoides108.104228.2292
Eucommia ulmoides104.520832.4375Eucommia ulmoides106.229232.4375Eucommia ulmoides108.145825.5625
Eucommia ulmoides104.645827.1042Eucommia ulmoides106.270829.1875Eucommia ulmoides108.145827.3125
Eucommia ulmoides104.687529.5208Eucommia ulmoides106.312528.3542Eucommia ulmoides108.270824.8542
Eucommia ulmoides104.729231.8542Eucommia ulmoides106.354228.4375Eucommia ulmoides108.354225.2292
Eucommia ulmoides104.979228.4792Eucommia ulmoides106.354229.9375Eucommia ulmoides108.354227.6042
Eucommia ulmoides104.979228.6042Eucommia ulmoides106.437526.4792Eucommia ulmoides108.395829.3542
Eucommia ulmoides105.020825.1458Eucommia ulmoides106.437527.3125Eucommia ulmoides108.437528.0625
Eucommia ulmoides105.104224.3542Eucommia ulmoides106.520826.4792Eucommia ulmoides108.437528.2292
Eucommia ulmoides105.104224.5625Eucommia ulmoides106.562526.2708Eucommia ulmoides108.479228.3958
Eucommia ulmoides105.229226.1875Eucommia ulmoides106.562529.3958Eucommia ulmoides108.520827.3542
Eucommia ulmoides105.229227.2708Eucommia ulmoides106.562529.5208Eucommia ulmoides108.520829.2708
Eucommia ulmoides105.229228.1042Eucommia ulmoides106.687525.9375Eucommia ulmoides108.520829.3542
Eucommia ulmoides105.229228.3125Eucommia ulmoides106.687526.4792Eucommia ulmoides108.645827.0208
Eucommia ulmoides105.270824.2292Eucommia ulmoides106.729226.6458Eucommia ulmoides108.645831.4792
Eucommia ulmoides105.270824.3542Eucommia ulmoides106.937531.9792Eucommia ulmoides108.687527.9375
Eucommia ulmoides105.270832.5625Eucommia ulmoides107.020825.3125Eucommia ulmoides108.854227.7292
Eucommia ulmoides105.312525.2708Eucommia ulmoides107.062524.5208Eucommia ulmoides108.854231.5208
Eucommia ulmoides105.312525.4792Eucommia ulmoides107.062529.6458Eucommia ulmoides108.979228.3542
Eucommia ulmoides105.312526.5625Eucommia ulmoides107.062532.3125Eucommia ulmoides109.062526.2708
Eucommia ulmoides105.312528.1458Eucommia ulmoides107.104229.0625Eucommia ulmoides109.104226.1875
Eucommia ulmoides105.354225.5625Eucommia ulmoides107.104229.4792Eucommia ulmoides109.104226.3125
Eucommia ulmoides109.145829.3542Eucommia ulmoides111.187530.2292Eucommia ulmoides114.645829.3125
Eucommia ulmoides109.187532.1875Eucommia ulmoides111.187531.5625Eucommia ulmoides114.812531.6458
Eucommia ulmoides109.229228.3958Eucommia ulmoides111.312527.4792Eucommia ulmoides114.854231.6042
Eucommia ulmoides109.395828.6042Eucommia ulmoides111.395826.2708Eucommia ulmoides115.145829.1875
Eucommia ulmoides109.437530.0208Eucommia ulmoides111.520824.4792Eucommia ulmoides115.145829.3125
Eucommia ulmoides109.437530.6458Eucommia ulmoides111.520828.1458Eucommia ulmoides115.437529.6875
Eucommia ulmoides109.479224.3125Eucommia ulmoides111.687525.3125Eucommia ulmoides115.937529.6042
Eucommia ulmoides109.479232.3542Eucommia ulmoides111.854224.8958Eucommia ulmoides115.979240.4792
Eucommia ulmoides109.520825.3542Eucommia ulmoides111.895828.1458Eucommia ulmoides116.062529.5625
Eucommia ulmoides109.562528.3542Eucommia ulmoides111.979226.7292Eucommia ulmoides116.062539.9792
Eucommia ulmoides109.604229.4792Eucommia ulmoides112.395833.7708Eucommia ulmoides116.229229.2708
Eucommia ulmoides109.604231.3958Eucommia ulmoides112.479237.7292Eucommia ulmoides116.229239.9792
Eucommia ulmoides109.604234.3542Eucommia ulmoides112.604237.8125Eucommia ulmoides116.520827.0208
Eucommia ulmoides109.729231.8542Eucommia ulmoides112.729227.2292Eucommia ulmoides116.604235.4375
Eucommia ulmoides109.729234.3542Eucommia ulmoides113.062525.8125Eucommia ulmoides116.854227.0625
Eucommia ulmoides109.854225.7292Eucommia ulmoides113.062528.1875Eucommia ulmoides116.979235.6042
Eucommia ulmoides110.020828.2292Eucommia ulmoides113.312535.3125Eucommia ulmoides117.020836.2708
Eucommia ulmoides110.062528.3958Eucommia ulmoides113.520835.2708Eucommia ulmoides117.020836.6458
Eucommia ulmoides110.062528.6458Eucommia ulmoides113.562535.1875Eucommia ulmoides117.145836.1875
Eucommia ulmoides110.104226.3958Eucommia ulmoides113.562535.3542Eucommia ulmoides117.270836.1042
Eucommia ulmoides110.104228.3958Eucommia ulmoides113.604235.7292Eucommia ulmoides117.312529.0208
Eucommia ulmoides110.145828.4375Eucommia ulmoides113.895828.6042Eucommia ulmoides117.979235.5625
Eucommia ulmoides110.145829.1042Eucommia ulmoides113.979235.3542Eucommia ulmoides118.062536.1875
Eucommia ulmoides110.187524.1458Eucommia ulmoides114.020826.1042Eucommia ulmoides118.104228.5208
Eucommia ulmoides110.187528.8125Eucommia ulmoides114.020826.5208Eucommia ulmoides118.145829.1875
Eucommia ulmoides110.229226.0208Eucommia ulmoides114.020827.3125Eucommia ulmoides118.145829.1458
Eucommia ulmoides110.229228.4792Eucommia ulmoides114.020827.3958Eucommia ulmoides118.979235.9792
Eucommia ulmoides110.229231.2708Eucommia ulmoides114.020828.4792Eucommia ulmoides119.187536.5625
Eucommia ulmoides110.354224.5625Eucommia ulmoides114.104227.1458Eucommia ulmoides119.437529.1875
Eucommia ulmoides110.395831.4375Eucommia ulmoides114.104231.8125Eucommia ulmoides119.437530.3125
Eucommia ulmoides110.437534.7708Eucommia ulmoides114.145827.2292Eucommia ulmoides119.437532.3958
Eucommia ulmoides110.437534.8125Eucommia ulmoides114.145827.3125Eucommia ulmoides119.937527.8542
Eucommia ulmoides110.479225.7708Eucommia ulmoides114.270825.6042Eucommia ulmoides120.104236.9792
Eucommia ulmoides110.520824.5625Eucommia ulmoides114.270826.6042Eucommia ulmoides120.395836.3125
Eucommia ulmoides110.687526.0208Eucommia ulmoides114.312527.6875Eucommia ulmoides120.520828.9792
Eucommia ulmoides110.854234.1875Eucommia ulmoides114.395828.6458Eucommia ulmoides120.770837.5208
Eucommia ulmoides110.937531.0625Eucommia ulmoides114.437529.0625Eucommia ulmoides120.895831.3125
Eucommia ulmoides110.937533.3125Eucommia ulmoides114.479229.0208Eucommia ulmoides121.270837.2292
Eucommia ulmoides111.020826.0625Eucommia ulmoides114.520828.0208Eucommia ulmoides121.354237.5208
Eucommia ulmoides111.062526.7708Eucommia ulmoides114.562525.8125Eucommia ulmoides121.395831.2292
Eucommia ulmoides111.187528.1042Eucommia ulmoides114.645828.9792Eucommia ulmoides122.187537.3542
Eucommia ulmoides122.270829.8125
1 Lon = Longitude, Lat = Latitude.

References

  1. Wilczek, A.M.; Cooper, M.D.; Korves, T.M.; Schmitt, J. Lagging adaptation to warming climate in Arabidopsis thaliana. Proc. Natl. Acad. Sci. USA 2014, 111, 7906–7913. [Google Scholar] [CrossRef] [PubMed] [Green Version]
  2. Guan, L.; Yang, Y.; Jiang, P.; Mou, Q.; Gou, Y.; Zhu, X.; Xu, Y.W.; Wang, R. Potential distribution of Blumea balsamifera in China using MaxEnt and the ex situ conservation based on its effective components and fresh leaf yield. Environ. Sci. Pollut. Res. 2022, 29, 44003–44019. [Google Scholar] [CrossRef]
  3. Xu, Y.; Ramanathan, V.; Victor, D.G. Global warming will happen faster than we think. Nature 2018, 564, 30–32. [Google Scholar] [CrossRef] [PubMed] [Green Version]
  4. An, R.; Ji, M.; Zhang, S. Global warming and obesity: A systematic review. Obes. Rev. 2018, 19, 150–163. [Google Scholar] [CrossRef]
  5. Lippmann, R.; Babben, S.; Menger, A.; Delker, C.; Quint, M. Development of Wild and Cultivated Plants under Global Warming Conditions. Curr. Biol. 2019, 29, R1326–R1338. [Google Scholar] [CrossRef] [PubMed]
  6. Ge, X.J.; Hsu, T.W.; Hung, K.H.; Lin, C.J.; Huang, C.C.; Huang, C.C.; Chiang, Y.C.; Chiang, T.Y. Inferring multiple refugia and phylogeographical patterns in Pinus massoniana based on nucleotide sequence variation and DNA fingerprinting. PLoS ONE 2012, 7, e43717. [Google Scholar] [CrossRef] [Green Version]
  7. Alberto, F.J.; Aitken, S.N.; Alía, R.; González-Martínez, S.C.; Hänninen, H.; Kremer, A.; Lefèvre, F.; Lenormand, T.; Yeaman, S.; Whetten, R.; et al. Potential for evolutionary responses to climate change–evidence from tree populations. Glob. Chang. Biol. 2013, 19, 1645–1661. [Google Scholar] [CrossRef] [PubMed] [Green Version]
  8. Shaw, R.G.; Etterson, J.R. Rapid climate change and the rate of adaptation: Insight from experimental quantitative genetics. New Phytol. 2012, 195, 752–765. [Google Scholar] [CrossRef]
  9. Aguirre-Liguori, J.A.; Ramírez-Barahona, S.; Gaut, B.S. The evolutionary genomics of species’ responses to climate change. Nat. Ecol. Evol. 2021, 5, 1350–1360. [Google Scholar] [CrossRef]
  10. McGaughran, A.; Laver, R.; Fraser, C. Evolutionary Responses to Warming. Trends Ecol. Evol. 2021, 36, 591–600. [Google Scholar] [CrossRef]
  11. Reich, P.B.; Oleksyn, J. Climate warming will reduce growth and survival of Scots pine except in the far north. Ecol. Lett. 2008, 11, 588–597. [Google Scholar] [CrossRef] [PubMed]
  12. Spencer, D.; Yue, Y.R.; Bolin, D.; Ryan, S.; Mejia, A.F. Spatial Bayesian GLM on the cortical surface produces reliable task activations in individuals and groups. Neuroimage 2022, 249, 118908. [Google Scholar] [CrossRef]
  13. Thameur, B.H.; Soufiène, S.; Haj Ammar, H.; Hammami, S. Spatial distribution and habitat selection of culicoides imicola: The potential vector of bluetongue virus in Tunisia. Onderstepoort. J. Vet. Res. 2021, 88, e1–e9. [Google Scholar] [CrossRef]
  14. Zhao, Y.; Adjallah, K.H.; Sava, A.; Wang, Z. MaxEnt feature-based reliability model method for real-time detection of early chatter in high-speed milling. ISA Trans. 2021, 113, 39–51. [Google Scholar] [CrossRef] [PubMed]
  15. Banavar, J.R.; Maritan, A.; Volkov, I. Applications of the principle of maximum entropy: From physics to ecology. J. Phys. Condens. Matter. 2010, 22, 063101. [Google Scholar] [CrossRef] [PubMed] [Green Version]
  16. Harte, J.; Newman, E.A. Maximum information entropy: A foundation for ecological theory. Trends Ecol. Evol. 2014, 29, 384–389. [Google Scholar] [CrossRef]
  17. Guo, Y.; Wei, H.; Lu, C.; Gao, B.; Gu, W. Predictions of potential geographical distribution and quality of Schisandra sphenanthera under climate change. PeerJ 2016, 4, e2554. [Google Scholar] [CrossRef] [Green Version]
  18. Wouyou, H.G.; Lokonon, B.E.; Idohou, R.; Zossou-Akete, A.G.; Assogbadjo, A.E.; Glèlè Kakaï, R. Predicting the potential impacts of climate change on the endangered Caesalpinia bonduc (L.) Roxb in Benin (West Africa). Heliyon 2022, 8, e09022. [Google Scholar] [CrossRef] [PubMed]
  19. Xian, X.; Zhao, H.; Wang, R.; Qiao, H.; Guo, J.; Zhang, G.; Liu, W.; Wan, F. Ecological Niche Shifts Affect the Potential Invasive Risk of Rapistrum rugosum (L.) All. in China. Front. Plant Sci. 2022, 13, 827497. [Google Scholar] [CrossRef]
  20. Zhang, L.; Cao, B.; Bai, C.; Li, G.; Mao, M. Predicting suitable cultivation regions of medicinal plants with Maxent modeling and fuzzy logics: A case study of Scutellaria baicalensis in China. Environ. Earth Sci. 2016, 75, 361. [Google Scholar] [CrossRef]
  21. He, X.; Wang, J.; Li, M.; Hao, D.; Yang, Y.; Zhang, C.; He, R.; Tao, R. Eucommia ulmoides Oliv.: Ethnopharmacology, phytochemistry and pharmacology of an important traditional Chinese medicine. J. Ethnopharmacol. 2014, 151, 78–92. [Google Scholar] [CrossRef]
  22. Ye, J.; Han, W.; Fan, R.; Liu, M.; Li, L.; Jia, X. Integration of Transcriptomes, Small RNAs, and Degradome Sequencing to Identify Putative miRNAs and Their Targets Related to Eu-Rubber Biosynthesis in Eucommia ulmoides. Genes 2019, 10, 623. [Google Scholar] [CrossRef] [PubMed] [Green Version]
  23. Zhao, Y.; Tan, D.-C.; Peng, B.; Yang, L.; Zhang, S.-Y.; Shi, R.-P.; Chong, C.-M.; Zhong, Z.-F.; Wang, S.-P.; Liang, Q.-L.; et al. Neuroendocrine–Immune Regulatory Network of Eucommia ulmoides Oliver. Molecules 2022, 27, 3697. [Google Scholar] [CrossRef]
  24. Dong, C.; Yao, T.; Zhang, Z.; Chen, W.; Liang, J.; Han, Y.; Huang, J.; Deshmukh, S.K.; Liang, Z. Structure and Function of Bacterial Microbiota in Eucommia ulmoides Bark. Curr. Microbiol. 2020, 77, 3623–3632. [Google Scholar] [CrossRef] [PubMed]
  25. Do, M.H.; Hur, J.; Choi, J.; Kim, M.; Kim, M.J.; Kim, Y.; Ha, S.K. Eucommia ulmoides Ameliorates Glucotoxicity by Suppressing Advanced Glycation End-Products in Diabetic Mice Kidney. Nutrients 2018, 10, 265. [Google Scholar] [CrossRef] [Green Version]
  26. Su, L.; Wang, Q.; Xiang, P.; Yin, D.; Ding, X.; Liu, L.; Zhao, X. Development of nitrile rubber/eucommia ulmoides gum composites for controllable dynamic damping and sound absorption performance. RSC Adv. 2022, 12, 21503–21511. [Google Scholar] [CrossRef]
  27. Suzuki, N.; Uefuji, H.; Nishikawa, T.; Mukai, Y.; Yamashita, A.; Hattori, M.; Ogasawara, N.; Bamba, T.; Fukusaki, E.; Kobayashi, A.; et al. Construction and analysis of EST libraries of the trans-polyisoprene producing plant, Eucommia ulmoides Oliver. Planta 2012, 236, 1405–1417. [Google Scholar] [CrossRef] [PubMed]
  28. Mwange, K.N.; Hou, H.W.; Cui, K.M. Relationship between endogenous indole-3-acetic acid and abscisic acid changes and bark recovery in Eucommia ulmoides Oliv. after girdling. J. Exp. Bot. 2003, 54, 1899–1907. [Google Scholar] [CrossRef] [Green Version]
  29. Yu, J.; Wang, Y.; Ru, M.; Peng, L.; Liang, Z. Genetic diversity in intraspecific hybrid populations of Eucommia ulmoides Oliver evaluated from ISSR and SRAP molecular marker analysis. Genet Mol Res 2015, 14, 7417–7425. [Google Scholar] [CrossRef] [PubMed]
  30. Fu, L.G. China Plant Red Data Book-Rare and Endangered Plants; Science Press: Beijing, China, 1991. (In Chinese) [Google Scholar]
  31. Jin, C.; Li, Z.; Li, Y.; Wang, S.; Li, L.; Liu, M.; Ye, J. Transcriptome analysis of terpenoid biosynthetic genes and simple sequence repeat marker screening in Eucommia ulmoides. Mol. Biol. Rep. 2020, 47, 1979–1990. [Google Scholar] [CrossRef] [PubMed]
  32. Li, A.; Yuan, J.F.; Gong, Q.; Zhang, N.; Chen, L.Y.; Luo, Y.Y.; Cui, Y.R.; Wang, H.L.; Liu, R.H. Effects of Eucommia ulmoides extract against renal injury caused by long-term high purine diets in rats. Food Funct. 2021, 12, 5607–5620. [Google Scholar] [CrossRef] [PubMed]
  33. Liu, C.; Guo, F.F.; Xiao, J.P.; Wei, J.Y.; Tang, L.Y.; Yang, H.J. Research advances in chemical constituents and pharmacological activities of different parts of Eucommia ulmoides. Chin. J. Chin. Mater. Med. 2020, 45, 497–512. (In Chinese) [Google Scholar] [CrossRef]
  34. Oikawa, H.; Miyazaki, S.; Kurata, R.; Hattori, M.; Hayashi, N.; Kawaguchi, N.; Hirata, T.; Ueda, T.; Fujikawa, T. Eucommia Leaf Extract Induces BDNF Production in Rat Hypothalamus and Enhances Lipid Metabolism and Aerobic Glycolysis in Rat Liver. Curr. Mol. Pharmacol. 2021, 14, 234–244. [Google Scholar] [CrossRef] [PubMed]
  35. Qing, J.; Du, Q.; Meng, Y.; Liu, P.; Du, H.; Wang, L. Genome-wide identification and expression pattern analysis of the ribonuclease T2 family in Eucommia ulmoides. Sci. Rep. 2021, 11, 6900. [Google Scholar] [CrossRef]
  36. Wu, G.H.; Chen, Y.; Zheng, L.H.; Huang, T.; Hao, X.J.; Zhang, J.X. Chemical Constituents of Eucommia ulmoides in Guizhou Province. Chin. Med. Mat. 2015, 38, 980–984. (In Chinese) [Google Scholar]
  37. Yan, Y.; Zhao, H.; Zou, L.S.; Liu, X.H.; Chai, C.; Wang, S.N.; Hua, Y.J. Difference of chemical constituents in Eucommiae Cortex from different habitats by LC-QTOF MS/MS. Chin. J. Chin. Mater. Med. 2017, 42, 2730–2737. (In Chinese) [Google Scholar] [CrossRef]
  38. Zhao, X.; Wang, Y.; Nie, Z.; Han, L.; Zhong, X.; Yan, X.; Gao, X. Eucommia ulmoides leaf extract alters gut microbiota composition, enhances short-chain fatty acids production, and ameliorates osteoporosis in the senescence-accelerated mouse P6 (SAMP6) model. Food Sci. Nutr. 2020, 8, 4897–4906. [Google Scholar] [CrossRef] [PubMed]
  39. Wang, Y.F.; Li, C.S.; Collinson, M.E.; Lin, J.; Sun, Q.G. Eucommia (Eucommiaceae), a potential biothermometer for the reconstruction of paleoenvironments. Am. J. Bot. 2003, 90, 1–7. [Google Scholar] [CrossRef]
  40. Xu, D.; Zhuo, Z.; Wang, R.; Ye, M.; Pu, B. Modeling the distribution of Zanthoxylum armatum in China with MaxEnt modeling. Glob. Ecol. Conserv. 2019, 19, e00691. [Google Scholar] [CrossRef]
  41. Zhang, L.; Cao, X.; Yao, Z.; Dong, X.; Chen, M.; Xiao, L.; Zhao, S. Identification of risk areas for Orobanche cumana and Phelipanche aegyptiaca in China, based on the major host plant and CMIP6 climate scenarios. Ecol. Evol. 2022, 12, e8824. [Google Scholar] [CrossRef]
  42. Zhao, Q.; Zhang, Y.; Li, W.-N.; Hu, B.-W.; Zou, J.-B.; Wang, S.-Q.; Niu, J.-F.; Wang, Z.-Z. Predicting the Potential Distribution of Perennial Plant Coptis chinensis Franch. In China under Multiple Climate Change Scenarios. Forests 2021, 12, 1464. [Google Scholar] [CrossRef]
  43. Nolzen, H.; Brugger, K.; Reichold, A.; Brock, J.; Lange, M.; Thulke, H.H. Model-based extrapolation of ecological systems under future climate scenarios: The example of Ixodes ricinus ticks. PLoS ONE 2022, 17, e0267196. [Google Scholar] [CrossRef] [PubMed]
  44. Gupta, R.; Sharma, L.K.; Rajkumar, M.; Mohammad, N.; Khan, M.L. Predicting habitat suitability of Litsea glutinosa: A declining tree species, under the current and future climate change scenarios in India. Landsc. Ecol. Eng. 2023, 1–15. [Google Scholar] [CrossRef]
  45. Zhang, J.; Jiang, F.; Li, G.; Qin, W.; Li, S.; Gao, H.; Cai, Z.; Lin, G.; Zhang, T. Maxent modeling for predicting the spatial distribution of three raptors in the Sanjiangyuan National Park, China. Ecol. Evol. 2019, 9, 6643–6654. [Google Scholar] [CrossRef] [PubMed] [Green Version]
  46. Torii, M.; Masuya, H.; Hattori, T. Temperature Characteristics of Two Fomitiporia Fungi Determine Their Geographical Distributions in Japan. Forests 2021, 12, 1580. [Google Scholar] [CrossRef]
  47. Guo, Q.; Li, H.; Zheng, W.; Pan, J.; Lu, J.; Li, J.; Zheng, Y. Analysis of genetic diversity and prediction of Larix species distribution in the Qinghai–Tibet Plateau, China. J. For. Res. 2022, 1–11. [Google Scholar] [CrossRef]
  48. Phillips, S.J.; Anderson, R.P.; Dudík, M.; Schapire, R.E.; Blair, M.E. Opening the black box: An open-source release of Maxent. Ecography 2017, 40, 887–893. [Google Scholar] [CrossRef]
  49. Anand, V.; Oinam, B.; Singh, I.H. Predicting the current and future potential spatial distribution of endangered Rucervus eldii eldii (Sangai) using MaxEnt model. Environ. Monit. Assess. 2021, 193, 147. [Google Scholar] [CrossRef] [PubMed]
  50. Cobos, M.E.; Peterson, A.T.; Barve, N.; Osorio-Olvera, L. kuenm: An R package for detailed development of ecological niche models using Maxent. PeerJ 2019, 7, e6281. [Google Scholar] [CrossRef] [Green Version]
  51. Akpoti, K.; Kabo-bah, A.T.; Dossou-Yovo, E.R.; Groen, T.A.; Zwart, S.J. Mapping suitability for rice production in inland valley landscapes in Benin and Togo using environmental niche modeling. Sci. Total Environ. 2020, 709, 136165. [Google Scholar] [CrossRef] [PubMed]
  52. Fang, B.; Zhao, Q.; Qin, Q.; Yu, J. Prediction of Potentially Suitable Distribution Areas for Prunus tomentosa in China Based on an Optimized MaxEnt Model. Forests 2022, 13, 381. [Google Scholar] [CrossRef]
  53. Li, Y.; Shao, W.; Jiang, J. Predicting the potential global distribution of Sapindus mukorossi under climate change based on MaxEnt modelling. Environ. Sci. Pollut. Res. 2022, 29, 21751–21768. [Google Scholar] [CrossRef] [PubMed]
  54. Kato, R.; Noguchi, H.; Honda, H.; Kobayashi, T. Hidden Markov model-based approach as the first screening of binding peptides that interact with MHC class II molecules. Enzyme Microb. Technol. 2003, 33, 472–481. [Google Scholar] [CrossRef]
  55. Lin, L.; Jin, L.; Wang, Z.H.; Cui, Z.J.; Ma, Y. Prediction of the potential distribution of Tibetan medicinal Lycium ruthenicum in context of climate change. Chin. J. Chin. Mater. Med. 2017, 42, 2659–2669. (In Chinese) [Google Scholar] [CrossRef]
  56. Jiménez-Valverde, A.; Lobo, J.M. Threshold criteria for conversion of probability of species presence to either–or presence–absence. Acta Oecol. 2007, 31, 361–369. [Google Scholar] [CrossRef]
  57. Pan, J.; Fan, X.; Luo, S.; Zhang, Y.; Yao, S.; Guo, Q.; Qian, Z. Predicting the Potential Distribution of Two Varieties of Litsea coreana (Leopard-Skin Camphor) in China under Climate Change. Forests 2020, 11, 1159. [Google Scholar] [CrossRef]
  58. Li, W.-N.; Zhao, Q.; Guo, M.-H.; Lu, C.; Huang, F.; Wang, Z.-Z.; Niu, J.-F. Predicting the Potential Distribution of the Endangered Plant Cremastra appendiculata (Orchidaceae) in China under Multiple Climate Change Scenarios. Forests 2022, 13, 1504. [Google Scholar] [CrossRef]
  59. Santos-Hernández, A.F.; Monterroso-Rivas, A.I.; Granados-Sánchez, D.; Villanueva-Morales, A.; Santacruz-Carrillo, M. Projections for Mexico’s Tropical Rainforests Considering Ecological Niche and Climate Change. Forests 2021, 12, 119. [Google Scholar] [CrossRef]
  60. Brown, J.L.; Bennett, J.R.; French, C.M. SDMtoolbox 2.0: The next generation Python-based GIS toolkit for landscape genetic, biogeographic and species distribution model analyses. PeerJ 2017, 5, e4095. [Google Scholar] [CrossRef] [Green Version]
  61. Garcia, K.; Lasco, R.; Ines, A.; Lyon, B.; Pulhin, F. Predicting geographic distribution and habitat suitability due to climate change of selected threatened forest tree species in the Philippines. Appl. Geogr. 2013, 44, 12–22. [Google Scholar] [CrossRef]
  62. Molloy, S.W.; Davis, R.A.; Van Etten, E.J.B. Species distribution modelling using bioclimatic variables to determine the impacts of a changing climate on the western ringtail possum (Pseudocheirus occidentals; Pseudocheiridae). Environ. Conserv. 2014, 41, 176–186. [Google Scholar] [CrossRef]
  63. Shabani, F.; Kumar, L.; Ahmadi, M. A comparison of absolute performance of different correlative and mechanistic species distribution models in an independent area. Ecol. Evol. 2016, 6, 5973–5986. [Google Scholar] [CrossRef] [PubMed] [Green Version]
  64. Kong, W.Y.; Li, X.H.; Zou, H.F. Optimizing MaxEnt model in the prediction of species distribution. J. Appl. Ecol. 2019, 30, 2116–2128. (In Chinese) [Google Scholar] [CrossRef]
  65. Çoban, H.O.; Örücü, Ö.K.; Arslan, E.S. MaxEnt Modeling for Predicting the Current and Future Potential Geographical Distribution of Quercus libani Olivier. Sustainability 2020, 12, 2671. [Google Scholar] [CrossRef] [Green Version]
  66. Qin, A.; Liu, B.; Guo, Q.; Bussmann, R.W.; Ma, F.; Jian, Z.; Xu, G.; Pei, S. Maxent modeling for predicting impacts of climate change on the potential distribution of Thuja sutchuenensis Franch., an extremely endangered conifer from southwestern China. Glob. Ecol. Conserv. 2017, 10, 139–146. [Google Scholar] [CrossRef]
  67. Zhang, K.; Yao, L.; Meng, J.; Tao, J. Maxent modeling for predicting the potential geographical distribution of two peony species under climate change. Sci. Total Environ. 2018, 634, 1326–1334. [Google Scholar] [CrossRef] [PubMed]
  68. Xie, C.; Tian, E.; Jim, C.Y.; Liu, D.; Hu, Z. Effects of climate-change scenarios on the distribution patterns of Castanea henryi. Ecol. Evol. 2022, 12, e9597. [Google Scholar] [CrossRef]
  69. Ding, Y.; Yang, S. Surviving and thriving: How plants perceive and respond to temperature stress. Dev. Cell 2022, 57, 947–958. [Google Scholar] [CrossRef]
  70. Li, Y.; Kong, D.; Fu, Y.; Sussman, M.R.; Wu, H. The effect of developmental and environmental factors on secondary metabolites in medicinal plants. Plant Physiol. Biochem. 2020, 148, 80–89. [Google Scholar] [CrossRef] [PubMed]
  71. Zhu, M.Q.; Sun, R.C. Eucommia ulmoides Oliver: A Potential Feedstock for Bioactive Products. J. Agric. Food Chem. 2018, 66, 5433–5438. [Google Scholar] [CrossRef]
  72. Ramakrishna, A.; Ravishankar, G.A. Influence of abiotic stress signals on secondary metabolites in plants. Plant Signal. Behav. 2011, 6, 1720–1731. [Google Scholar] [CrossRef] [PubMed]
  73. Qian, C.; Zhang, R.; Li, J.; Huang, Z.; Liu, X.; Yu, L.; Yan, L.; Fu, Y. The characteristics of habitat, functional traits and medicinal components of Eucommia ulmoides from Guizhou. Environ. Sci. Pollut. Res. 2022, 29, 12629–12647. [Google Scholar] [CrossRef] [PubMed]
  74. Hu, W.; Yao, J.; He, Q.; Chen, J. Changes in precipitation amounts and extremes across Xinjiang (northwest China) and their connection to climate indices. PeerJ 2021, 9, e10792. [Google Scholar] [CrossRef] [PubMed]
  75. Xing, Y.-F.; He, D.; Wang, Y.; Zeng, W.; Zhang, C.; Lu, Y.; Su, N.; Kong, Y.-H.; Xing, X.-H. Chemical constituents, biological functions and pharmacological effects for comprehensive utilization of Eucommia ulmoides Oliver. Food Sci. Hum. Wellness 2019, 8, 177–188. [Google Scholar] [CrossRef]
  76. Panfeng, L.; Lu, W.; Qingxin, D.; Lanying, D. Estimation of potential suitable distribution area and the ecological characteristics of Eucommia ulmoides Oliv. in China. Acta Ecol. Sin. 2020, 40, 5674–5684. (In Chinese) [Google Scholar]
  77. Puchałka, R.; Dyderski, M.K.; Vítková, M.; Sádlo, J.; Klisz, M.; Netsvetov, M.; Prokopuk, Y.; Matisons, R.; Mionskowski, M.; Wojda, T.; et al. Black locust (Robinia pseudoacacia L.) range contraction and expansion in Europe under changing climate. Glob. Chang. Biol. 2021, 27, 1587–1600. [Google Scholar] [CrossRef] [PubMed]
  78. Yang, J.; Jiang, P.; Huang, Y.; Yang, Y.; Wang, R.; Yang, Y. Potential geographic distribution of relict plant Pteroceltis tatarinowii in China under climate change scenarios. PLoS ONE 2022, 17, e0266133. [Google Scholar] [CrossRef]
  79. Chen, I.-C.; Hill, J.K.; Ohlemüller, R.; Roy, D.B.; Thomas, C.D. Rapid Range Shifts of Species Associated with High Levels of Climate Warming. Science 2011, 333, 1024–1026. [Google Scholar] [CrossRef]
  80. Davis, M.B.; Shaw, R.G. Range Shifts and Adaptive Responses to Quaternary Climate Change. Science 2001, 292, 673–679. [Google Scholar] [CrossRef] [Green Version]
  81. Call, V.; Dilcher, D. The fossil record of Eucommia (Eucommiaceae) in North America. Am. J. Bot. 1997, 84, 798. [Google Scholar] [CrossRef]
  82. Zhang, L.; Jing, Z.; Li, Z.; Liu, Y.; Fang, S. Predictive Modeling of Suitable Habitats for Cinnamomum Camphora (L.) Presl Using Maxent Model under Climate Change in China. Int. J. Environ. Res. Pub. He. 2019, 16, 3185. [Google Scholar] [CrossRef] [Green Version]
  83. Qing, J.; Meng, Y.D.; He, F.; Du, Q.X.; Zhong, J.; Du, H.Y.; Liu, P.F.; Du, L.Y.; Wang, L. Whole genome re-sequencing reveals the genetic diversity and evolutionary patterns of Eucommia ulmoides. Mol. Genet. Genom. 2022, 297, 485–494. [Google Scholar] [CrossRef] [PubMed]
  84. Zhao, Y.; Deng, X.; Xiang, W.; Chen, L.; Ouyang, S. Predicting potential suitable habitats of Chinese fir under current and future climatic scenarios based on Maxent model. Ecol. Inform. 2021, 64, 101393. [Google Scholar] [CrossRef]
  85. Xing, Y.Y.; Wang, J.Y.; Wang, K.; Zhang, Y.; Liu, K.; Chen, X.Y.; Yuan, Y. Inhibition of Rheumatoid Arthritis Using Bark, Leaf, and Male Flower Extracts of Eucommia ulmoides. Evid. Based Complement. Altern. Med. 2020, 2020, 3260278. [Google Scholar] [CrossRef] [PubMed]
  86. Babu, K.N.; Rajesh, M.K.; Samsudeen, K.; Minoo, D.; Suraby, E.J.; Anupama, K.; Ritto, P. Randomly amplified polymorphic DNA (RAPD) and derived techniques. Methods Mol. Biol. 2014, 1115, 191–209. [Google Scholar] [CrossRef]
  87. Yuan, Y.; Tang, X.; Liu, M.; Liu, X.; Tao, J. Species Distribution Models of the Spartina alterniflora Loisel in Its Origin and Invasive Country Reveal an Ecological Niche Shift. Front. Plant Sci. 2021, 12, 738769. [Google Scholar] [CrossRef] [PubMed]
  88. Sun, S.; Zhang, Y.; Huang, D.; Wang, H.; Cao, Q.; Fan, P.; Yang, N.; Zheng, P.; Wang, R. The effect of climate change on the richness distribution pattern of oaks (Quercus L.) in China. Sci. Total Environ. 2020, 744, 140786. [Google Scholar] [CrossRef]
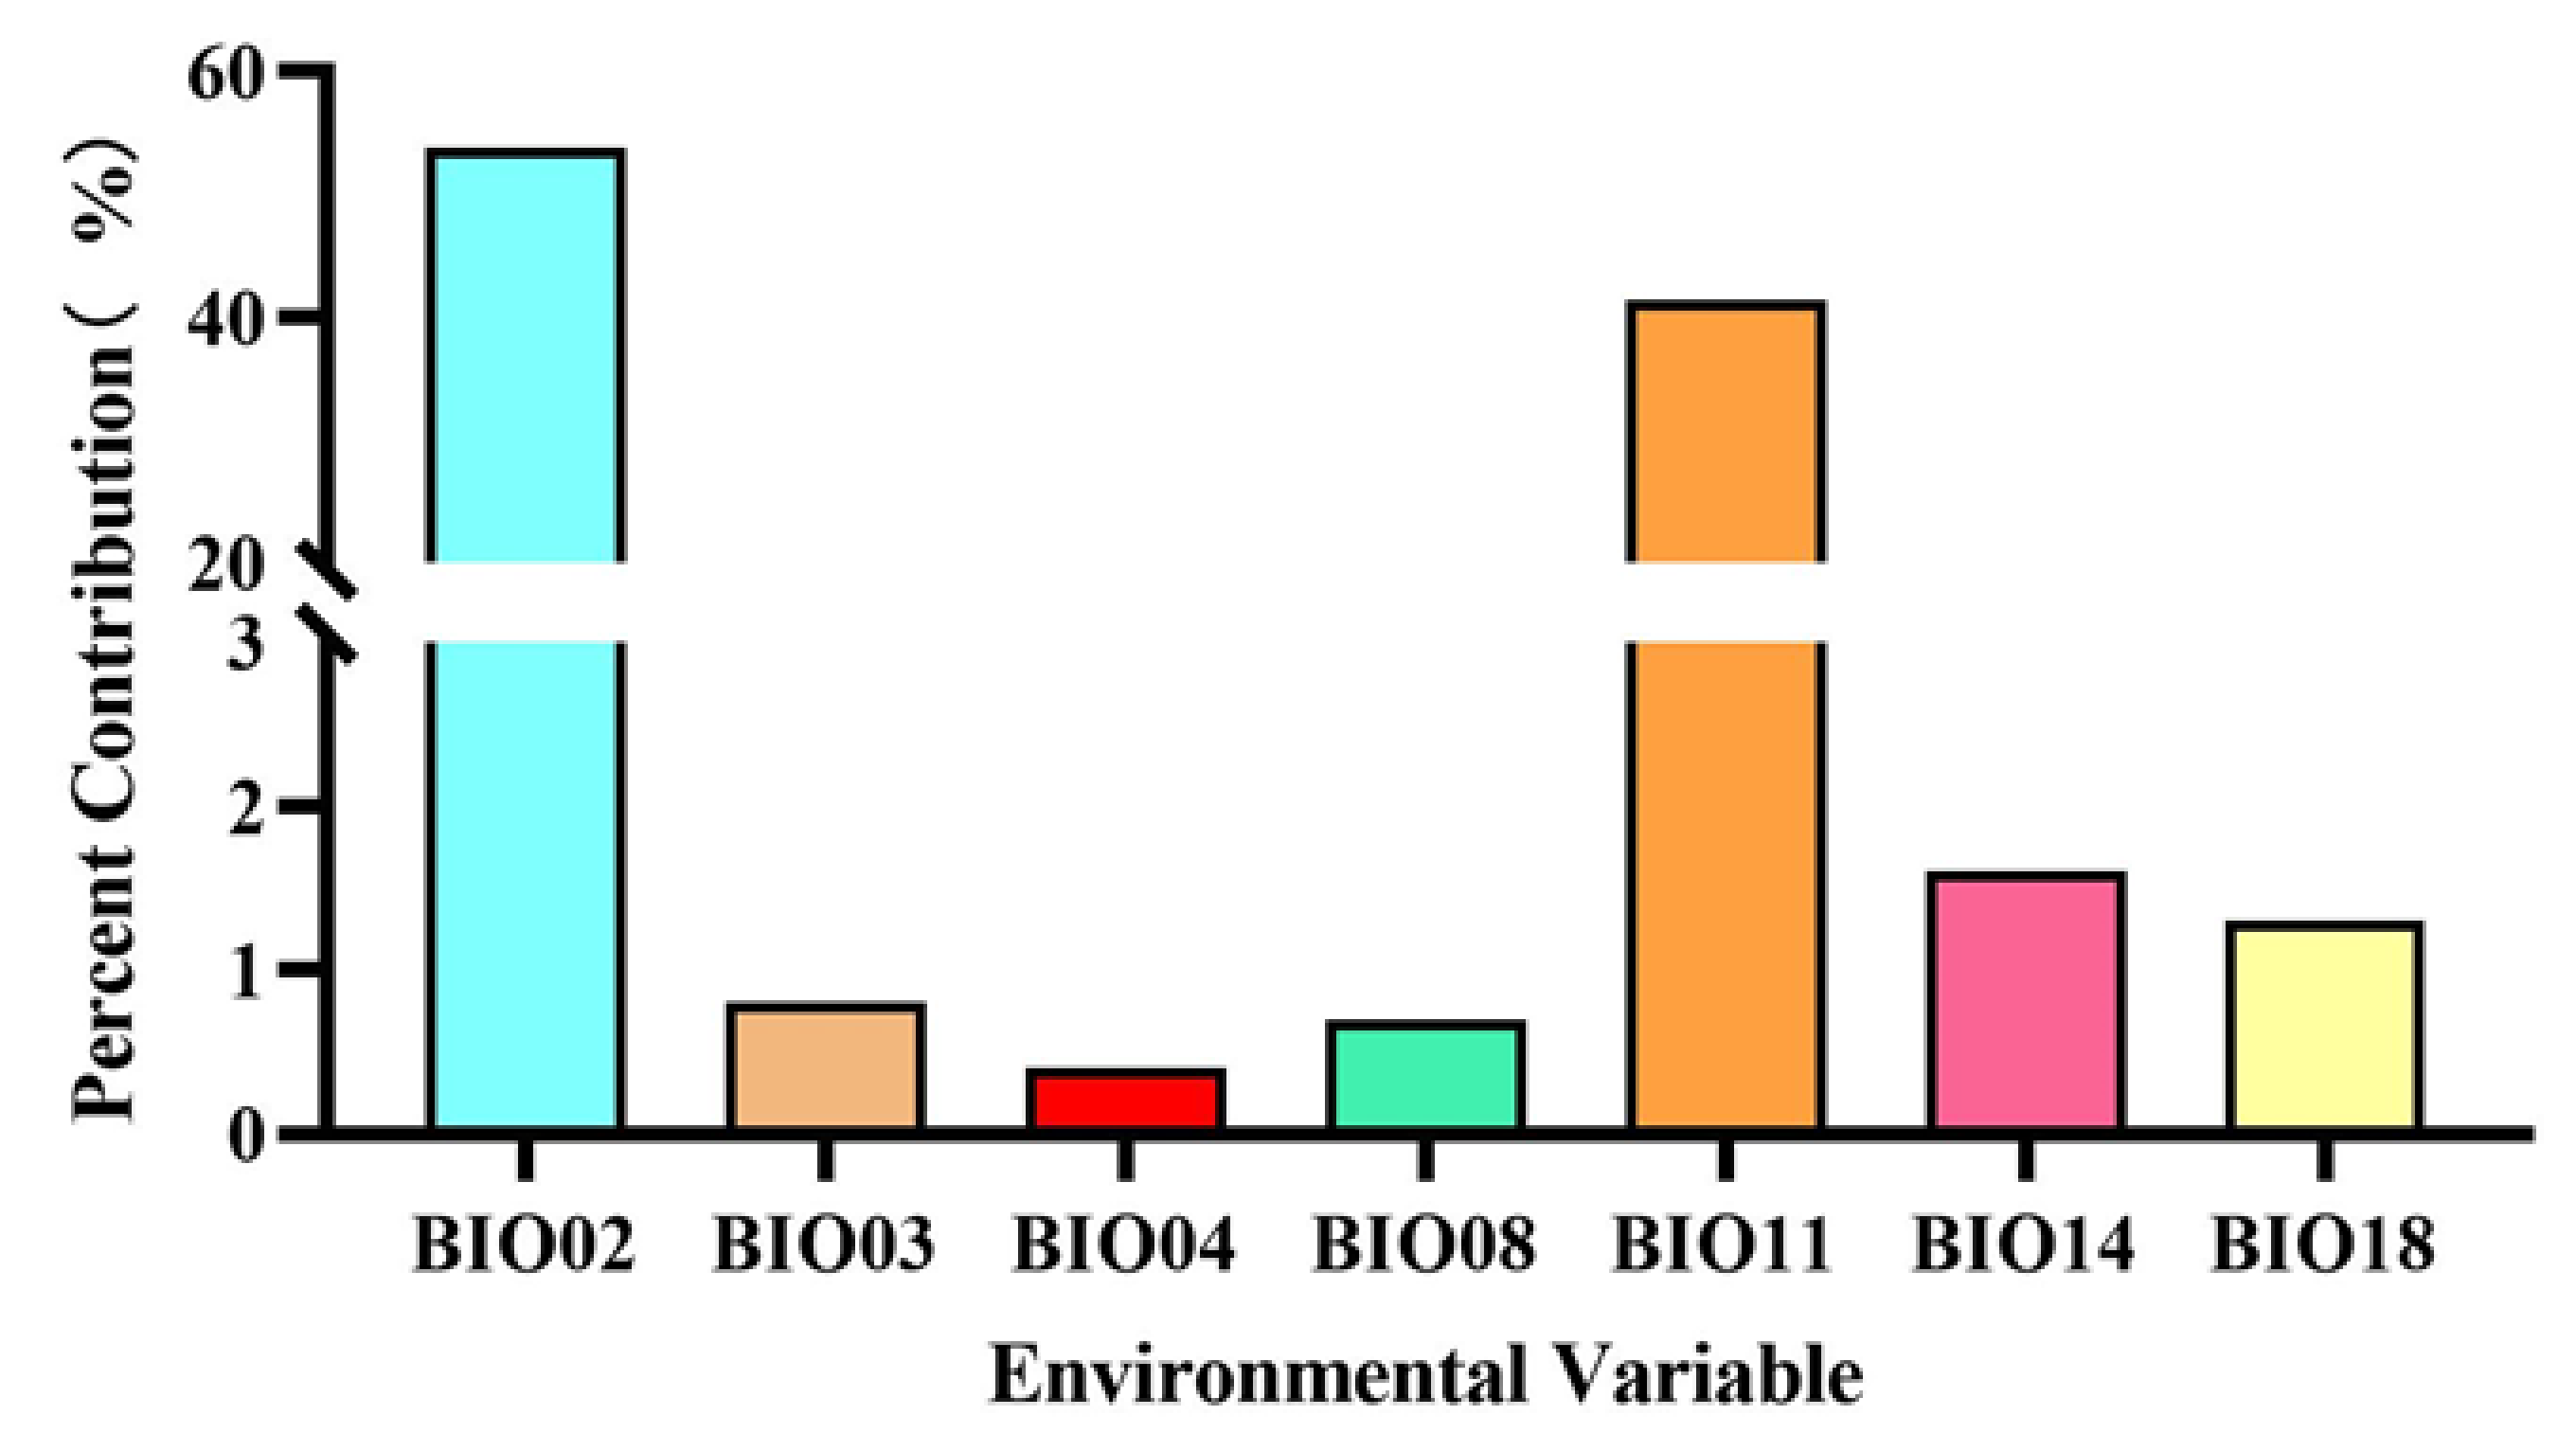
Figure 1. The occurrence data (247 points) of Eucommia ulmoides in China.
Sustainability 15 05349 g001
Figure 2. Environmental variables and their contributions.
Sustainability 15 05349 g002
Figure 3. Predicted distribution of Eucommia ulmoides in China under current climate condition.
Sustainability 15 05349 g003
Figure 4. Predicted distribution of Eucommia ulmoides in China under future (2050s–2090s) climatic scenarios.
Sustainability 15 05349 g004
Figure 5. Changes of potential suitable areas of Eucommia ulmoides from current to future climatic conditions.
Sustainability 15 05349 g005
Figure 6. Areas (a) and changes (b) of habitats of different suitability for Eucommia ulmoides at different times in China.
Sustainability 15 05349 g006
Figure 7. Composite prediction of low impact areas supported by varying numbers of shared socio-economic pathways (SSP1-2.6, SSP2-4.5, SSP3-7.0 & SSP5-8.5).
Sustainability 15 05349 g007
Figure 8. Core distribution shifts under 12 climate scenarios/years. Arrows indicate the magnitude and direction of predicted change over time.
Sustainability 15 05349 g008
Table 1. Environmental variables and their contributions and suitable value ranges.
CodeEnvironmental VariablePercent Contribution (%)
BIO02Mean diurnal range (Mean of monthly (max temp–min temp)) (°C)53.8
BIO03Isothermality0.8
BIO04Temperature seasonality (standard deviation × 100)0.4
BIO08Mean temperature of wettest quarter (°C)0.7
BIO11Mean temperature of coldest quarter (°C)41.4
BIO14Precipitation of driest month (mm)1.6
BIO18Precipitation of warmest quarter (mm)1.3
Table 2. Predicted suitable areas under current and future climatic conditions.
Decades Predicted Area (×104 km2) and % of the Corresponding Current Area
Total Suitable RegionPoorly Suitable RegionModerately Suitable RegionHighly Suitable Region
1970–2000 211.14113.6896.391.07
SSP1-2.62050s210.49156.9753.480.04
(99.69%)(138.08%)(55.48%)(3.73%)
2070s206.60155.8350.700.07
(99.69%)(138.08%)(55.48%)(3.73%)
2090s214.96160.1154.790.06
(101.81%)(140.84%)(56.84%)(5.36%)
SSP2-4.52050s212.76160.0252.680.06
(100.77%)(140.76%)(54.66%)(5.68%)
2070s204.64164.3840.240.06
(96.92%)(144.59%)(41.75%)(1.46%)
2090s197.05165.4231.620.01
(93.33%)(145.51%)(32.81%)(0.81%)
SSP3-7.02050s215.84155.5160.290.03
(102.23%)(136.80%)(62.55%)(3.08%)
2070s207.33167.7339.590.01
(98.20%)(147.55%)(41.07%)(1.14%)
2090s176.23151.0025.220.01
(83.47%)(132.83%)(26.17%)(0.81%)
SSP5-8.52050s210.40167.7442.650.02
(99.65%)(147.55%)(44.25%)(1.62%)
2070s167.59142.2525.330.01
(79.37%)(125.13%)(26.28%)(0.81%)
2090s98.8787.9910.870.01
(46.83%)(77.40%)(11.27%)(0.65%)
Table 3. Low impact areas (LIAs) under different shared socio-economic pathways (SSPs).
LIA StatisticsShared Socio-Economic Pathways (SSPs)
SSP1-2.6SSP2-4.5SSP3-7.0SSP5-8.5
Geographic area (×104 km2)192.77178.24150.3573.37
Percentage of current suitable area (%)91.3084.4271.2134.75
Percentage of SSP1-2.6 area (%)100.0092.4677.9938.06
Disclaimer/Publisher’s Note: The statements, opinions and data contained in all publications are solely those of the individual author(s) and contributor(s) and not of MDPI and/or the editor(s). MDPI and/or the editor(s) disclaim responsibility for any injury to people or property resulting from any ideas, methods, instructions or products referred to in the content.

