Article

A Second-Order Cone Programming Model of Controlled Islanding Strategy Considering Frequency Stability Constraints

1
Guangxi Key Laboratory of Power System Optimization and Energy Technology, Guangxi University, Nanning 530004, China
2
Electric Power Research Institute of Guangxi Power Grid Co., Ltd., Nanning 530023, China
*
Author to whom correspondence should be addressed.
Sustainability 2023, 15(6), 5386; https://doi.org/10.3390/su15065386
Submission received: 3 February 2023 / Revised: 11 March 2023 / Accepted: 15 March 2023 / Published: 17 March 2023
(This article belongs to the Special Issue Sustainable Power Systems and Optimization Volume II)

Abstract

:
Controlled islanding is an important defense mechanism for avoiding blackouts by dividing the system into several stable islands. Sustainable systems that incorporate a high proportion of renewable energy are prone to frequency instability or even severe blackout events due to extreme weather conditions. Thus, it is critical to investigate controlled islanding considering frequency stability constraints to reduce the risk of a sustainable system collapse in extreme weather conditions. Here, the frequency constraint of islands is derived based on the law of energy conservation, and the island connectivity constraint is proposed based on the idea of network flow. A controlled island second-order cone programming model with frequency stability constraints is proposed for the islanding strategy. The consideration of frequency constraints can help to avoid islands with too low inertia generated by the islanding strategies, ensuring that the frequency nadir of the island remains within a safe range after disturbance. Connectivity constraints can ensure connectivity within the island and no connectivity between different islands. The model also meets the reactive power balance and voltage limits in the system. Simulations of the three test systems show that this island model, which takes frequency stability into account, is effective in reducing the risk of sustainable power system collapse in extreme weather conditions.

1. Introduction

Extreme weather events, such as snowstorms and hurricanes, have caused many blackouts. Cascading events are very likely to happen in extreme weather conditions, and they are the major cause of blackouts [1]. Controlled islanding is considered a last resort measure to prevent cascading failure [2]. When the system is severely disturbed and conventional control measures cannot maintain the stability of the system, switching off a selected set of transmission lines and dividing the system into several stable islands can be used to create sustainable islands [3]. As a result, it is critical to investigate the controlled islanding strategy to avoid cascading failure, which is essential for the stable operation of sustainable power systems during catastrophic events.
A stable island should meet connectivity constraints and lessen load-generation imbalance. In addition, it should be subject to as many steady-state and transient-state constraints as possible. If islands are created by an islanding strategy that satisfies the steady-state constraints, they can reach the steady-state operating point by employing some stabilization measures (the island AGC function) [4]. Thus, this paper focuses on the steady-state constraints of the island.
Currently, commonly used methods for controlled islanding include heuristic [1,2,3,4,5,6,7] and mathematical programming [8,9,10,11,12,13,14] optimization methods. The mathematical programming method has gained popularity in recent years because it overcomes the shortcomings of the heuristic methods’ poor robustness and low probability of obtaining a global optimal solution. The majority of studies employ a mixed-integer linear programming model based on DC power flow. Essential constraints, such as voltage limits in the system, cannot be taken into consideration by the model.
The controlled islanding optimization model often takes minimizing power flow disruption [3,7] or minimal load shedding [10] as the objective function and coherency of synchronous generators with heavy inertia as the constraint to maintain rotor angle stability [15]. However, due to the development and investment of renewable energy over the past few decades, renewable energy capacity worldwide has grown rapidly [16,17].
Given the decreased system inertia in a renewable-rich network, it is difficult to prevent frequency drops following a sudden power shortage, leading to a system blackout [7]. Thus, frequency stability constraints must be considered in the optimization model.
In [18], it is assumed that the delay between load shedding and primary frequency regulation may cause a temporary load-generation imbalance, resulting in a frequency stability problem. To avoid frequency dips, a method of limiting the number of transmission switches and the high rate of change of frequency (ROCOF) of the islands is proposed. In [19], each island’s equivalent system frequency response can be considered as linear constraints under an appropriate approximation, allowing each island to maintain frequency stability.
However, the relatively balanced distribution of the synchronous generators for all islands was not considered in the above-mentioned controlled islanding method. The system has a limited number of synchronous generators with heavy inertia. If there is a large number of synchronous generators on one island, the number of synchronous generators on other islands may be insufficient, resulting in islands with too low inertia. The island is very sensitive to disturbances and may trigger an excessively high ROCOF after suffering a disturbance [7]. In the 2016 South Australian blackout, an excessively high ROCOF made it impossible to activate under-frequency load shedding (UFLS). The frequency immediately fell below the synchronous generator-tripping threshold, resulting in the synchronous generators tripping [20]. Consequently, in a renewable-rich system, avoiding the creation of islands with too low inertia is critical to the success of the islanding strategy. The system’s heavy-inertia synchronous generators should be evenly distributed among the islands.
Given this background, this paper proposes an optimization model for a controlled islanding strategy considering frequency stability constraints. Contributions are summarized as follows:
(1)
A frequency constraint for the balanced allocation of synchronous generators to the island is proposed, which takes into account the difference in inertia and the ramping rate of governors. This constraint can reasonably allocate synchronous generators and prevent the islanding strategy from generating islands with too low inertia, which significantly affects the island’s ability to maintain frequency stability after islanding;
(2)
Based on the idea of network flow, connectivity constraints are proposed to ensure the connectivity of buses within the island, and there is no connected path between different islands;
(3)
A mixed-integer second-order cone programming model of controlled islanding is proposed, which can meet the requirements for a reactive power balance and voltage limit after islanding, and is closer to the actual operation of the power system.

2. Frequency Nadir Constraint

In extreme weather conditions, the system may be disturbed more than five times per day [21]. Given the decreased system inertia in a renewable-rich network, the island that reaches a steady-state operating point is difficult to prevent frequency drops following a sudden power loss. In extreme weather conditions, such as snow storms, the load increases rapidly due to higher energy consumption for heating [22]. It is likely to cause load-generation imbalance. The system finally reaches a load-generation balance by regulating the active power output of the generator. This process will be analyzed in detail in this section.
Assuming that the island suffers from a perturbation with a predicted generation loss Ploss after islanding, the governor of the synchronous generator adjusts the generator output to reduce the power loss. Since the governor is not sufficient to make up for this power loss at once, the frequency of the island will drop from ω0 to provide inertial power. Figure 1 shows the primary frequency regulation model of the system used in this paper, where the rotor speed will reach its minimum value ω n a d i r (also the frequency nadir) at the time T n a d i r . As the rotor speed changes, the ith generator active power output P G i of the ith generator ramps due to the governor, while the load P L of the island starts to decline due to the frequency response. The generation loss of the island in the period from 0 to T n a d i r is P l o s s T n a d i r . At the same time, the energy consumed by the load will be reduced by K L ( ω 0 ω T n a d i r ) T n a d i r / 4 π due to the system load frequency response. Where K L is the load-damping constant. According to the equation of rotational kinetic energy, the kinetic energy reduced by the ith generator is J i ( ω 0 2 ω T n a d i r 2 ) / 2 , where J i is the moment of inertia of the ith generator rotor. The rotational inertia of each generator is given by
J = 2 H S B Ω 0 2
where H is the inertia time constant, S B is the rated capacity of the generator, and Ω 0 is the rated mechanical speed of the rotor.
To simplify the analysis, the constant ramp rate model proposed in [23] is used in this paper. Assuming that the generator output power ramps up at a constant rate c i during the primary frequency regulation, the added output energy of the ith generator during this period is c i T n a d i r 2 / 2 .
The primary frequency regulation process of the island during the period analyzed above follows the law of energy conservation, the energy of generation loss should be equal to the sum of the energy less consumed by the load, the kinetic energy reduced by the generator rotor, and the output energy increased by the generator. Therefore, the following equation can be obtained:
P l o s s T n a d i r = 1 4 π K L ( ω 0 ω T n a d i r ) T n a d i r + i S g 1 2 J i z i ( ω 0 2 ω T n a d i r 2 ) + i S g 1 2 c i z i T n a d i r 2
where S g represents all the generators of the system. Additionally, z i indicates whether the ith generator belongs to the island.
Notice that at the time T n a d i r , the frequency does not decline, which suggests a balance between the generation loss and the sum of the power consumed by the load reduction and the power raised by the generator output:
P l o s s = i S g c i z i T n a d i r + 1 2 π K L ( ω 0 ω T n a d i r )
The above equation can be deformed to obtain the following equation:
T n a d i r = P l o s s 1 2 π K L ( ω 0 ω T n a d i r ) i S g c i z i
Substituting (4) into (2), the following equation can be obtained,
( ω 0 2 ω T n a d i r 2 ) i S g n c i z i i = 1 n J i z i + 1 2 π K L ( ω 0 ω T n a d i r ) P l o s s = P l o s s 2
The nadir of frequency should be more than the preset value ωmin, considering the requirement of frequency stability,
ω T n a d i r ω min
Equation (5) can be transformed into the following inequality,
( ω 0 2 ω min 2 ) i S g c i z i i S g J i z i P l o s s 2 P l o s s K L 2 π ( ω 0 ω min )
In the case of sudden power loss P l o s s perturbations, (6) enables the island to maintain the frequency nadir in the vicinity ω m i n during the primary frequency regulation that ω m i n can be set by a maximum threshold for UFLS, and P l o s s can be evaluated offline based on the maximum generator capacity in the island or the power loss due to line outage.

3. Optimization Model for Controlled Islanding

To obtain islands with higher survival probability after islanding, the islands formed should have minimal power-flow disruption and satisfy the basic constraint of the power system [7].

3.1. Objective Function

In this paper, the objective function is defined as minimizing power-flow interruption, which can increase the transient stability of the islands and lessen the likelihood of overloading the transmission lines within the island [3].
min l L P l ( 1 d l )
where L represents the transmission lines of the system. l denotes the lth line in the system. d l is a binary variable used as a flag to indicate whether the line should be tripped, when the line l is trip, d l = 0 ; otherwise, d l = 1 . P l is the average of the absolute value of active power in the positive and negative directions of the line before islanding, which can be calculated as P l = | p i j | + | p j i | 2 , where p i j is the active power between the bus i and j .

3.2. Generator Coherency

The first step of controlled islanding is to obtain information about the groups of generators. The grouping of generators can be determined through coherency identification technology [15]. Synchronous generators in different coherent groups should belong to different islands, so as to maintain the stability of the power angle of the system.
Assume that the system has m groups of coherent generators, divided into m islands. Define z i , r k as whether a bus i belongs to the root node r of kth island; other generators in a coherent generator group shall be on the same island as the root node in the group, while the generators do not belong to other islands. The binary variables are given by
z i , r k = 1 , i V G k , k = 1 , 2 m
z i , r = 0 , i V G k , r R \ { r k } , k = 1 , 2 m
where V G k represents the set of generators in the group of coherent generators in the kth island, where R represents the set of root nodes on all islands.

3.3. Network Connectivity Constraints

The network connectivity constraints play an important role in the controlled islanding strategy. It acted as a way of avoiding isolated nodes in the system and obtaining the boundaries of different islands. These constraints should ensure the connectivity of buses within the island, and there is no connected path between different islands. Thus, this paper proposes a method based on the network flow model.
A set of network flow variables f l , r is used to represent the value of the network flow from the line l L to the root node r , and this variable is for tracking the transmission path from the root node to non-root nodes. In the network flow model, the root node can be considered the source of the network flow. If a non-root node has a connected path to a root node, it is assumed that the node obtains one unit of network flow from this root node. According to this assumption, it can be obtained that the sum of the network flows of all lines connected by the node should be equal to the network flow of one unit. Conversely, if it is not connected to this root node, the sum of the network flows is zero. Thus, the sum of the network flows of a node depends on whether it is connected to this root node.
l δ ( i ) f l , r = z i , r , i V \ { r } , r R
where δ ( i ) is the set of all lines connected to the bus i . V is the set of all nodes in the system.
For each root node, the sum of the network flows of branches connected by the root node should be equal to the sum of the network flows from the root node to other nodes
l δ ( r ) f l , r = i V \ { R } z i , r , r R
Isolated nodes should be avoided in the controlled islanding model, so all nodes are only attributed to a root node.
r R z i , r = 1 , i V
A set of variables y l , r is introduced to indicate whether a line l L belongs to the root node r of kth island, and if the flow to the root node in a line is not equal to 0, the line belongs to this root node. The following constraints are proposed:
y l , r | V | f l , r y l , r | V | , l L , r R
where | V | is the number of elements in the set V .
If a line belongs to the same island as a root node, then the node corresponding to that line also belongs to that island.
l δ ( v ) y l , r z v , r | δ ( v ) | , r R , v V
where δ ( v ) is the set of all lines connected to the bus v .
If a line does not belong to any islands, the line is the filtered splitting sections; d l can be formulated as follows:
d l = r R y l , r , l L

3.4. Power System Physical Constraints and Cone Relaxation

After the controlled islanding, the power balance of each island should be ensured. The power balance constraints for all islands are given by
{ P g i P d i j L i P i j = 0 Q g i Q d i j L i Q i j = 0   i V
where P g i denotes an active power output of node i , Q g i denotes a reactive power output of node i , P d i denotes an active load of node i , Q d i denotes a reactive load of node i , P i j denotes branch i j active power, Q i j denotes branch i j reactive power, L i denotes the set of the nodes that are connected to i by the branch.
The active and reactive power flow of the branch can be formulated as
P i j = g i j U i 2 U i U j ( g i j cos θ i j + b i j sin θ i j ) , i j L
Q i j = ( b i j + b i j s / 2 ) U i 2 + U i U j ( b i j cos θ i j b i j sin θ i j ) , i j L
where U i denotes the bus voltage, g i j is the branch i j conductance, b i j is the branch i j susceptance, b i j s is the branch i j grounded susceptance, θ i j is the phase angle difference between bus i and j .
The generator’s output should be limited to a range of maximum and minimum limits,
{ P g i m i n P g i P g i m a x , i S g Q g i m i n Q g i Q g i m a x , i S g
where P g i m a x and P g i m i n indicate the upper and lower limits of generator active power output, Q g i m a x and Q g i m i n indicate the upper and lower limits of generator reactive power output.
The voltage of all buses should be in the safe range.
U _ i U i U ¯ i , i V
where U ¯ i and U _ i denote the upper and lower bus voltage limits.
To avoid overloading the line, the line capacity constraint should be satisfied
P i j 2 + Q i j 2 ( S i j m a x ) 2 , i j L
where S i j m a x denotes the branch capacity.
If the above constraint is expressed in terms of line current, the constraint can be rewritten as
I i j 2 = P i j 2 + Q i j 2 U i 2 ( I i j m a x ) 2 , i j L
where I i j represents the line current, I i j m a x is the maximum branch current.
Since the origin system has become separate small systems after islanding, each island needs to set a reference bus. The phase angle of the bus is taken from the following range:
{ θ r e f = 0 π θ i π i V \ { r e f }
where { r e f } is the set of all reference buses.
However, the non-convex feasible region formed by power-flow constraints in polar coordinates causes difficulties in finding the solution. In this paper, we use the second-order cone programming (SOCP) model proposed in [24]. To linearize power flow equations, the following auxiliary variables are introduced:
{ u i = U i 2 R i j = U i U j cos θ i j F i j = U i U j sin θ i j , i V , j V , l L
The auxiliary variables satisfy the following relationships:
R i j = R j i , F i j = F j i , i j L
Since there are outage branches in the system after controlled islanding, when the branch is trip, each variable corresponding to the branch should be set to 0.
{ 0 R i j U ¯ i U ¯ j d l U ¯ i U ¯ j d l F i j U ¯ i U ¯ j d l 0 u i l ( U ¯ i ) 2 d l 0 u j l ( U ¯ j ) 2 d l 0 u i u i l ( U ¯ i ) 2 ( 1 d l ) 0 u j u j l ( U ¯ j ) 2 ( 1 d l ) l L
where u i l denotes the auxiliary variable u i value of the node i , which is connected to the branch l .
It is clear that the auxiliary variables satisfy the following relationship.
u i l u j l = R i j 2 + F i j 2 , l L
To form a convex feasible region, Equation (28) is relaxed to an inequality, which gives a second-order cone constraint.
u i l u j l R i j 2 + F i j 2 , l L
In the stabilization process of the islands, the voltage and phase angle difference return to normal operating conditions [19] (i.e., sin θ i j θ i j , U i = U j 1 ). F i j can be calculated as
F i j = θ i j = θ i θ j , i j L
After calculating the branch power using each auxiliary variable, Equations (18) and (19) are converted to
{ P i j = g i j u i l g i j R i j b i j F i j Q i j = b i j R i j u i l ( b i j + b i j s / 2 ) g i j F i j , l L
Substituting Equations (28) and (31) into Equation (23), Equation (23) will be converted to
( g i j 2 + ( b i j + b i j s / 2 ) 2 ) u i l + ( g i j 2 + b i j 2 ) u j l ( g i j 2 + b i j ( b i j + b i j s / 2 ) ) R i j + ( g i j b i j s / 2 ) F i j ( I i j max ) 2 , l L
After the substitution of auxiliary variables, Equation (21) will be written as
U _ i 2 u i U ¯ i 2 , i V
To ensure that the optimal solution of the SOCP model after relaxation remains the optimal solution of the original problem, the values of R i j increase to the maximum until Constraint (28) is satisfied [24]. The Objective Function (9) needs to be modified as follows:
min l L P l ( 1 d l ) λ i j L R i j
where λ is a constant. It is enabled to tighten Constraint (29) to (28) in the optimal solution.

3.5. Frequency Nadir Constraint

According to the frequency nadir constraint derived in Section 2, the frequency nadir constraint for all islands is written as
( ω 0 2 ω m i n 2 ) i S g c i z i , r i S g J i z i , r P l o s s , r 2 P l o s s , r 2 π K L ( ω 0 ω m i n ) , r R
where z i , r denotes whether the generator node belongs to the root node r , and P l o s s , r denotes the power loss of the island to which the root node r belongs.
In summary, a controlled islanding optimization model can be obtained.
min l L P l ( 1 d l ) λ i j L R i j s . t . { n e t w o r k   c o n n e c t i v i t y   c o n s t r a i n t s : ( 9 ) ( 16 ) t h e   c o n e   r e l a x a t i o n   o f   p o w e r   f l o w   c o n s t r a i n t s : ( 17 ) ( 26 ) ( 27 ) ( 29 ) ( 30 ) ( 31 ) o p e r a t i o n a l   c o n s t r a i n t s : ( 20 ) ( 24 ) ( 32 ) ( 33 ) f r e q u e n c y   n a d i r   c o n s t r a i n t : ( 35 )
This model is a mixed integer second-order cone programming (MISOCP) model because it contains a large number of integers. The problem is solved by calling a widely used solver, such as Gurobi, which has high computational efficiency.

4. Results

The WSCC 9 -bus system [25], New England 39 -bus system [26], IEEE 118 -bus system [27], and the Polish 2383 -bus system [28] are implemented to verify the effectiveness of the proposed optimization model in this section. Matlab 2016 is applied to calculate the active power of the branches before islanding and the ramping rate of each generator. The solver Gurobi 9.5.1 is used to solve the proposed optimization model encoded in Pyomo 6.2, and the convergence gap is set to 0.0001. Time domain simulations for islands created by the islanding strategy are performed with full dynamic models with PSAT [29] (Power System Analysis Toolbox), based on Matlab programming. All simulations are implemented on a PC with an Intel(R) Core(TM) i7-10700 CPU @ 2.90 GHz and 16.0 GB RAM.

4.1. Validation of the Basic Model for Controlled Islanding

Firstly, the IEEE 118-bus system is used to verify whether it can be partitioned as expected, through the proposed model where the frequency nadir constraint is not considered. The maximum current for all lines is 5.0 p.u. The voltage range of all buses is set to 0.95 to 1.05 p.u. The coherent grouping of the IEEE 118 bus system is shown in Table 1.
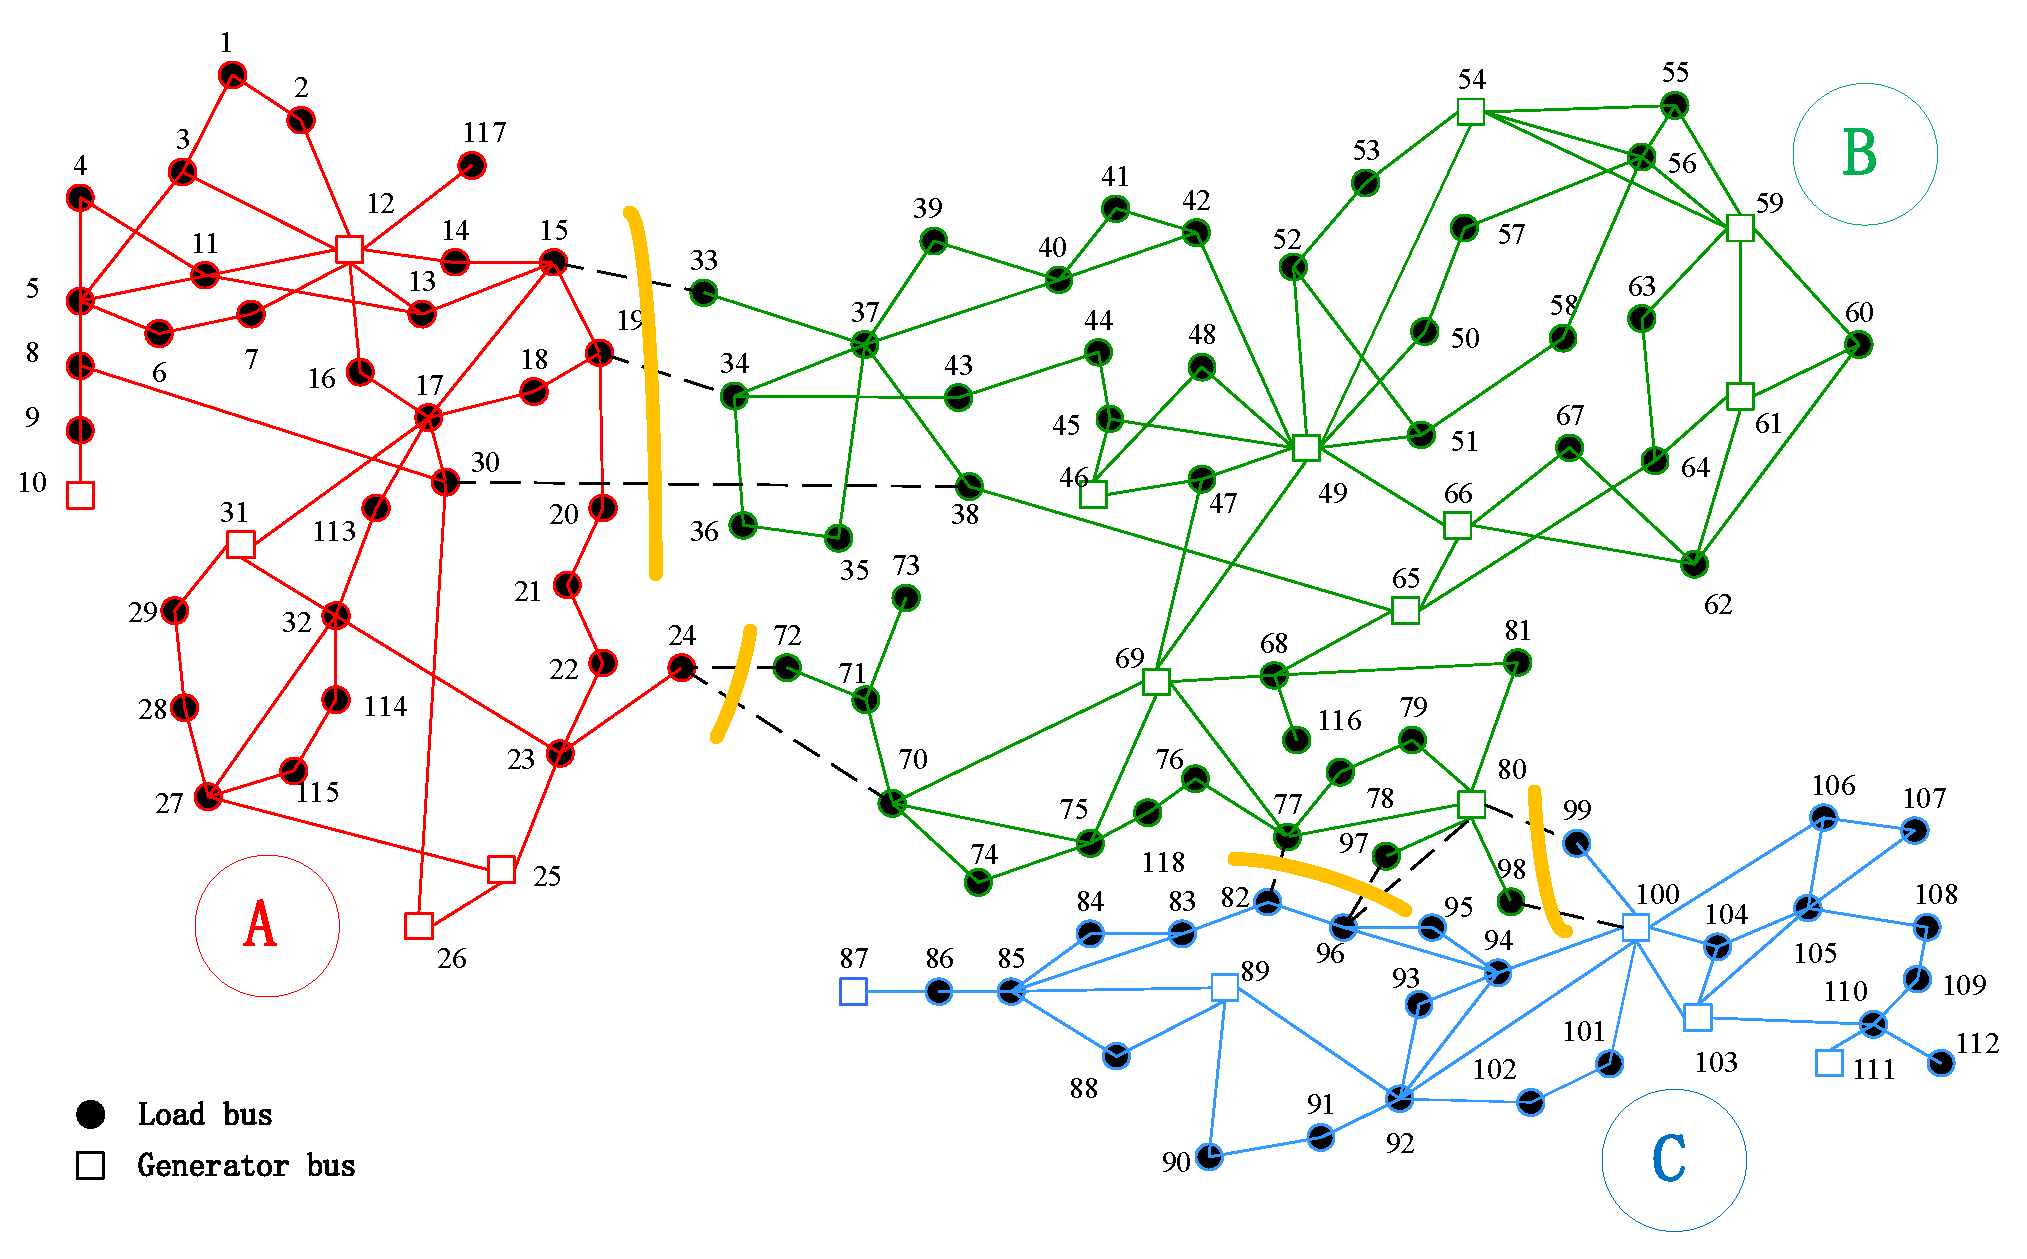
The test system is divided into three islands, A, B, and C, as shown in Figure 2 through the above model. It is observed that the system splits into three islands as expected, each island containing a corresponding group of coherent machines. No isolated nodes are generated in each island, proving that the connectivity constraint can maintain connectivity there. As the transmission lines between the three islands A, B, and C are all disconnected from each other, indicating that the connectivity constraints guarantee that there is no connectivity between the islands. As shown in Table 2, the results of cut sets are consistent with the results in [11], indicating that the basic controlled island strategy is correct.
To take advantage of the model in reactive power and voltage, a reactive load of 50 Mvar is added to bus 4 of the IEEE 118 -bus system. In addition, the maximum current limit for lines 8–9 and 26–30 is set to 2.60 p.u.
As can be seen in Table 2, the cut set created by another method (MILP and spectral clustering algorithm) has not changed in the modified test system. The active power of line 8–9 is 226.53 MW, which is within line capacity when only active power is considered. However, due to the increase in the reactive load, the reactive power of the line increases, resulting in the line current value of 2.68 p.u., which exceeds the maximum current 2.60 p.u. Thus, the islanding strategy, without considering the reactive power, violates the line capacity constraint. On the contrary, although the modified test system is still divided into three different islands by MISOCP, the splitting cut set has changed from lines 24–70 and 24–72 to lines 23–24, and the current of lines 8–9 on the optimized island was 2.55 p.u., within the maximum current range.
The islanding strategy proposed in [3,11] did not consider the reactive power. Since reactive power and voltage limits are considered, the model proposed in this paper is more realistic in the power system.

4.2. Verifying the Accuracy of the Frequency Nadir Constraint

A WSCC 3-machine 9-bus system is used to evaluate the accuracy of the frequency nadir constraint. The system frequency is initially set to 60 Hz. Time domain simulations are performed with full dynamic models to test the frequency nadir in three different active power loss scenarios. Based on time-domain simulations, the ramp rate for all the three units is estimated at 0.37 MW/s, and the load-damping constant is set to be 2 per unit. Table 3 shows the frequency nadir of the system is obtained from the time domain simulation in three power loss scenarios and Equation (6). Additionally, the system frequency, derived from the equation proposed in this paper, is closer to the generator frequency obtained from the time domain simulation in Table 3.
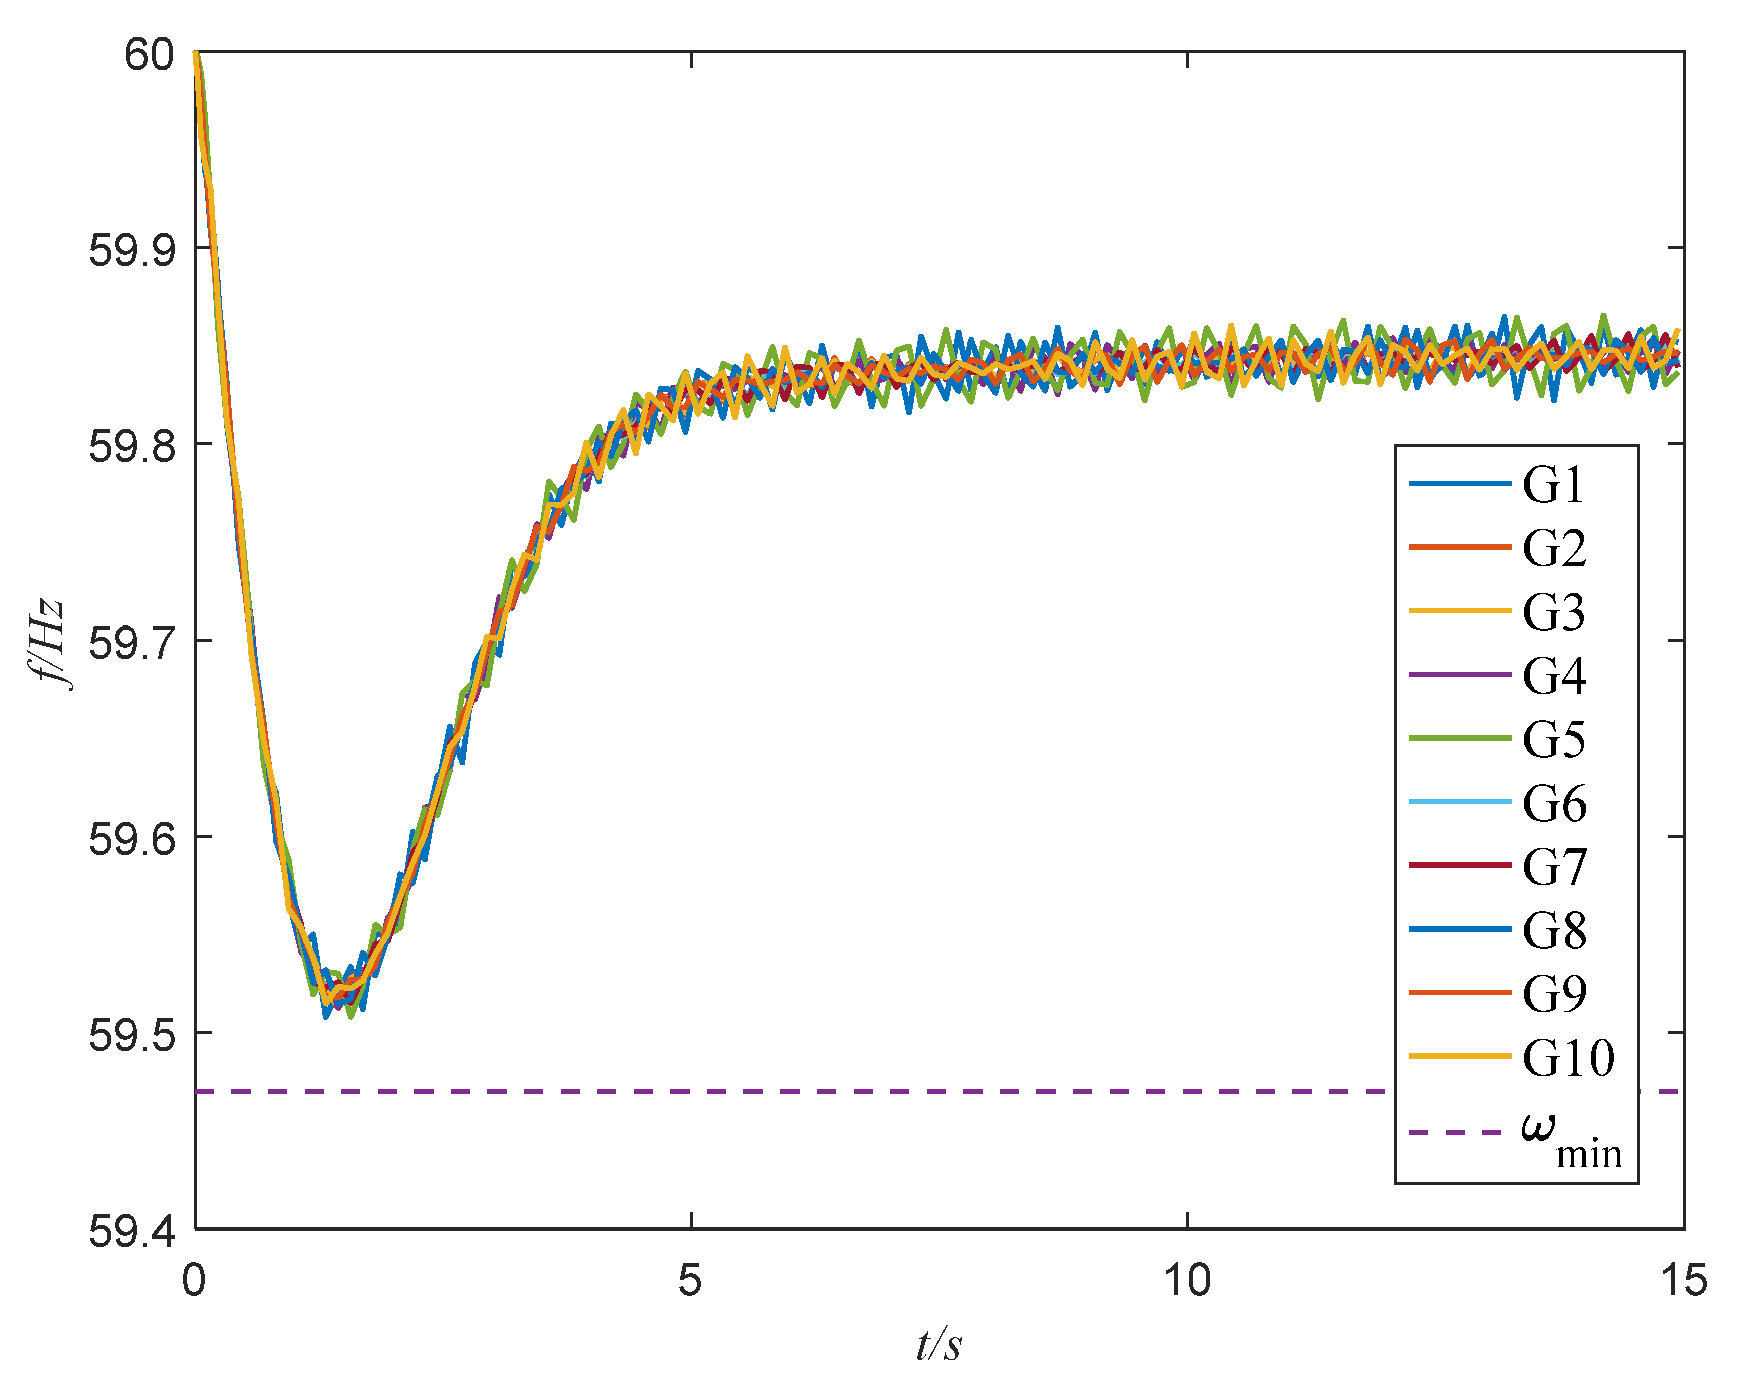
In the New England 10-machine 39-bus system for time domain simulation, the active power loss is set to 50 MW, and the frequency response curve of each generator after system perturbation is shown in Figure 3. It can be seen that the frequency nadir of the time domain simulation is 59.51 Hz, which is closer to the frequency acquired by the proposed model, which is 59.47 Hz, indicating that the proposed model is more accurate.

4.3. Validation of the Model Considering Frequency Stability Constraints for Controlled Islanding

This section verifies the effect of the frequency nadir constraint. The IEEE 118 -bus system is modified by considering the situation of a large number of renewable energy generators integrated into the system. Generators on buses 25, 31, 46, 59, and 103 are replaced by double-fed wind turbines with the same power output. It is assumed that these wind turbines are incapable of primary frequency regulation.
Suppose there are three coherent generator groups {10,12}, {49,54}, and {87,89} belonging to islands A, B, and C, respectively, and other synchronous generators, excluding coherent generator groups, are assigned to the island by the frequency nadir constraints, then the system frequency would initially be set to 60 Hz, and the frequency nadir would be set to 59.4 Hz. In this case, when the island tends to be stable, it suddenly suffers a power loss disturbance of 80 MW. The ramp rate and the moment of inertia for each unit are listed in Table 4.
The islands created by the islanding strategy without considering the frequency nadir constraint are shown in Figure 4a, while the three islands created by the islanding strategy considering the frequency nadir constraint are shown in Figure 4b.
In Figure 4a, Island B, which is the island with the heaviest inertia and is generated by the original islanding strategy, has seven synchronous generators.. On Island A, there are only three synchronous generators, and the inertia is also the lowest in the system. Island A easily collapses due to disturbances, rendering the islanding strategy ineffective. In Figure 4b, because the islanding strategy takes into account frequency constraints, the size of Island A is enlarged. The number of synchronous generators on Island A has increased from three to five compared to Figure 4a. The inertia and power supply of Island A have been improved, reducing the risk of frequency instability. Although the size of Island B has shrunk, it still has sufficient inertia and power supply due to sufficient synchronous generators. Therefore, frequency nadir constraints can rationally allocate synchronous generators and avoid generating islands with low inertia in islanding strategies.
Table 5 shows the island frequency nadir obtained in the controlled islanding model with and without frequency constraints when subjected to system disturbance. When the frequency constraint is not considered, the frequency nadir of all generators after the disturbance on Island A falls to 59.12 Hz, a serious deviation from the safe frequency range. Maintaining frequency stability is challenging for an island with too low inertia. In contrast, the frequency nadir on Island A is raised to 59.40 Hz when the frequency constraint is considered. Frequency nadir is maintained in a safe region. The table shows that the islanding strategy considering the frequency nadir constraint ensures that the frequency nadir of all islands is close to the set frequency nadir 59.4 Hz after disturbance.
The testing of the proposed model continues on the Polish 2383 bus system. The voltage range is set to 0.95–1.12 and the maximum line current is set to 10.0 p.u. The system frequency is initially set to 60 Hz and the frequency nadir is 59.4 Hz. In this case, when the island tends to be stable, it suddenly suffers a power loss disturbance of 120 MW. The ramp rate is set to 3 MW/s. The coherent grouping is shown in Table 6.
As Table 7 shows, when the frequency constraint is not considered, Islands 2 and 5 created by the model have a small number of synchronous generators, whereas islands 1, 3, and 4 have a large number of generators and sufficient inertia. Obviously, Island 5’s low inertia is likely to cause instability and invalidate the islanding strategy. When the frequency constraint is considered, the number and inertia of generators on Island 2 increase despite the fact that the number of generators on Islands 1 and 4 decreases. The number of synchronous generators on Island 5 has increased from 21 to 31, and the inertia provided by synchronous generators has increased nearly fivefold. The inertia and power supply of Island 5 have been improved, reducing the risk of frequency instability. As a result, the islanding strategy considering frequency nadir constraints can avoid generating islands with low inertia in islanding strategies, which can improve the frequency stability of the island.

4.4. Comparison of Different Test Systems

Table 8 compares the computation times of the two controlled islanding models for the three systems. It can be seen that the MISOCP model has a slight increase in computation time compared to the DC power flow model. However, reactive power and voltage limits can be considered. Therefore, it is worth sacrificing some computational efficiency for the MISOCP model-based controlled islanding method.

5. Conclusions

This paper proposes a network-flow-based approach to ensuring bus connectivity on the islands. A MISOCP model is also used to guarantee reactive power balance on the island. Voltage is also limited to a safe range. The model is closer to the actual operation of the power system.
Given the decreased system inertia in a renewable-rich network, the system is vulnerable to frequency stability problems. Frequency nadir constraints based on the law of energy conservation are proposed to maintain the frequency nadir in a safe range, and their validity is verified. The system has only a limited number of synchronous generators with heavy inertia. Islands with too low inertia may be created in the previous islanding strategy. The frequency constraint can reasonably allocate synchronous generators and prevent the islanding strategy from generating islands with too low inertia. In extreme weather conditions, an island with too low inertia is more likely to lose stability due to sudden power disturbances, which may invalidate the islanding strategy. Thus, the islanding strategy that takes frequency constraints into account can improve the probability of island survival in extreme weather conditions.
In conclusion, the islanding strategy proposed in this paper, which takes frequency constraints into account, can obtain more resilient islands in extreme weather conditions, which is critical for the stable operation of sustainable power systems during catastrophic events.
In future power systems, more renewable energy plants will replace synchronous generators. Therefore, future work must consider active power control and the inertial response of renewable energy plants in the system.

Author Contributions

Conceptualization, D.X. and P.L.; methodology, D.X. and P.L.; software, P.L., H.S. and D.X.; validation, D.X. and H.S.; resources, Z.S.; data curation, Z.S. and P.L.; writing—original draft preparation, D.X.; writing—review and editing, D.X., P.L., H.S. and Z.S.; supervision, P.L. All authors have read and agreed to the published version of the manuscript.

Funding

This research was supported in part by the National Natural Science Foundation of China under Grant no. 52267006 and 51967002, and in part by Guangxi Special Fund for Innovation-Driven Development under Grant no. AA19254034, and in part by Guangxi Key Laboratory of Power System Optimization and Energy Technology Research Grant.

Institutional Review Board Statement

Not applicable.

Informed Consent Statement

Not applicable.

Data Availability Statement

The original contributions presented in the study are available at https://tweckesser.wordpress.com/power-system-data-and-test-cases (accessed on 11 March 2023); further inquiries can be directed to the corresponding authors.

Conflicts of Interest

The authors declare no conflict of interest.

References

  1. Panteli, M.; Trakas, D.N.; Mancarella, P.; Hatziargyriou, N.D. Boosting the Power Grid Resilience to Extreme Weather Events Using Defensive Islanding. IEEE Trans. Smart Grid 2016, 7, 2913–2922. [Google Scholar] [CrossRef]
  2. Sun, K.; Zheng, D.-Z.; Lu, Q. Splitting strategies for islanding operation of large-scale power systems using OBDD-based methods. IEEE Trans. Power Syst. 2003, 18, 912–923. [Google Scholar] [CrossRef] [Green Version]
  3. Ding, L.; Gonzalez-Longatt, F.M.; Wall, P.; Terzija, V. Two-Step Spectral Clustering Controlled Islanding Algorithm. IEEE Trans. Power Syst. 2012, 28, 75–84. [Google Scholar] [CrossRef] [Green Version]
  4. Zhao, Q.; Sun, K.; Zheng, D.-Z.; Ma, J.; Lu, Q. A study of system splitting strategies for island operation of power system: A two-phase method based on OBDDs. IEEE Trans. Power Syst. 2003, 18, 1556–1565. [Google Scholar] [CrossRef] [Green Version]
  5. Senroy, N.; Heydt, G.; Vittal, V. Decision Tree Assisted Controlled Islanding. IEEE Trans. Power Syst. 2006, 21, 1790–1797. [Google Scholar] [CrossRef]
  6. Aghamohammadi, M.R.; Shahmohammadi, A. Intentional islanding using a new algorithm based on ant search mechanism. Int. J. Electr. Power Energy Syst. 2012, 35, 138–147. [Google Scholar] [CrossRef]
  7. Ding, L.; Ma, Z.; Wall, P.; Terzija, V. Graph Spectra Based Controlled Islanding for Low Inertia Power Systems. IEEE Trans. Power Deliv. 2016, 32, 302–309. [Google Scholar] [CrossRef]
  8. Huang, L.; Sun, Y.; Xu, J.; Gao, W.; Zhang, J.; Wu, Z. Optimal PMU Placement Considering Controlled Islanding of Power System. IEEE Trans. Power Syst. 2013, 29, 742–755. [Google Scholar] [CrossRef]
  9. Liu, S.; Zhang, T.; Lin, Z.; Liu, Y.; Ding, Y.; Yang, L. Controlled Islanding Strategy Considering Uncertainty of Renewable Energy Sources Based on Chance-constrained Model. J. Mod. Power Syst. Clean Energy 2022, 10, 471–481. [Google Scholar] [CrossRef]
  10. Ding, T.; Sun, K.; Huang, C.; Bie, Z.; Li, F. Mixed-Integer Linear Programming-Based Splitting Strategies for Power System Islanding Operation Considering Network Connectivity. IEEE Syst. J. 2015, 12, 350–359. [Google Scholar] [CrossRef]
  11. Kyriacou, A.; Demetriou, P.; Panayiotou, C.; Kyriakides, E. Controlled Islanding Solution for Large-Scale Power Systems. IEEE Trans. Power Syst. 2017, 33, 1591–1602. [Google Scholar] [CrossRef]
  12. Liu, Z.; Clark, A.; Bushnell, L.; Kirschen, D.S.; Poovendran, R. Controlled Islanding via Weak Submodularity. IEEE Trans. Power Syst. 2018, 34, 1858–1868. [Google Scholar] [CrossRef] [Green Version]
  13. Liu, S.; Lin, Z.; Zhao, Y.; Liu, Y.; Ding, Y.; Zhang, B.; Yang, L.; Wang, Q.; White, S.E. Robust System Separation Strategy Considering Online Wide-Area Coherency Identification and Uncertainties of Renewable Energy Sources. IEEE Trans. Power Syst. 2020, 35, 3574–3587. [Google Scholar] [CrossRef]
  14. Kamali, S.; Amraee, T.; Fotuhi-Firuzabad, M. Controlled Islanding for Enhancing Grid Resilience Against Power System Blackout. IEEE Trans. Power Deliv. 2020, 36, 2386–2396. [Google Scholar] [CrossRef]
  15. You, H.; Vittal, V.; Wang, X. Slow Coherency-Based Islanding. IEEE Trans. Power Syst. 2004, 19, 483–491. [Google Scholar] [CrossRef]
  16. Izanloo, M.; Aslani, A.; Zahedi, R. Development of a Machine learning assessment method for renewable energy investment decision making. Appl. Energy 2022, 327, 120096. [Google Scholar] [CrossRef]
  17. Mehrzad, K.; Rahim, Z.; Reza, F.; Abolfazl, A. Assessment of Renewable Energy Production Capacity of Asian Coun-tries: A Review. New Energy Exploit. Appl. 2022, 1, 25–41. [Google Scholar] [CrossRef]
  18. Amraee, T.; Saberi, H. Controlled islanding using transmission switching and load shedding for enhancing power grid resilience. Int. J. Electr. Power Energy Syst. 2017, 91, 135–143. [Google Scholar] [CrossRef]
  19. Teymouri, F.; Amraee, T.; Saberi, H.; Capitanescu, F. Toward Controlled Islanding for Enhancing Power Grid Resilience Considering Frequency Stability Constraints. IEEE Trans. Smart Grid 2017, 10, 1735–1746. [Google Scholar] [CrossRef]
  20. Yan, R.; Masood, N.-A.; Saha, T.K.; Bai, F.; Gu, H. The Anatomy of the 2016 South Australia Blackout: A Catastrophic Event in a High Renewable Network. IEEE Trans. Power Syst. 2018, 33, 5374–5388. [Google Scholar] [CrossRef]
  21. Xianzhong, D.; Sheng, S. Self-Organized Criticality in Time Series of Power Systems Fault, Its Mechanism, and Potential Application. IEEE Trans. Power Syst. 2010, 25, 1857–1864. [Google Scholar] [CrossRef]
  22. Zahedi, R.; Ghodusinejad, M.H.; Aslani, A.; Hachem-Vermette, C. Modelling community-scale renewable energy and electric vehicle management for cold-climate regions using machine learning. Energy Strat. Rev. 2022, 43, 100930. [Google Scholar] [CrossRef]
  23. Ahmadi, H.; Ghasemi, H. Security-Constrained Unit Commitment With Linearized System Frequency Limit Constraints. IEEE Trans. Power Syst. 2014, 29, 1536–1545. [Google Scholar] [CrossRef]
  24. Jabr, R. Radial Distribution Load Flow Using Conic Programming. IEEE Trans. Power Syst. 2006, 21, 1458–1459. [Google Scholar] [CrossRef]
  25. Sauer, P.W.; Pai, M. Power System Dynamics and Stability, 1st ed.; Prentice-Hall: Urbana-Champaign, IL, USA, 1998. [Google Scholar]
  26. Pai, M.A. Energy Function Analysis for Power System Stability; Kluwer Academic Publishers: Boston, MA, USA, 1989. [Google Scholar]
  27. Research on Power System Dynamics and Modeling. Available online: https://tweckesser.wordpress.com/power-system-data-and-test-cases/ (accessed on 28 January 2023).
  28. Zimmerman, R.D.; Murillo-Sanchez, C.E.; Thomas, R.J. MATPOWER: Steady-State Operations, Planning, and Analysis Tools for Power Systems Research and Education. IEEE Trans. Power Syst. 2010, 26, 12–19. [Google Scholar] [CrossRef] [Green Version]
  29. Milano, F. An Open Source Power System Analysis Toolbox. IEEE Trans. Power Syst. 2005, 20, 1199–1206. [Google Scholar] [CrossRef]
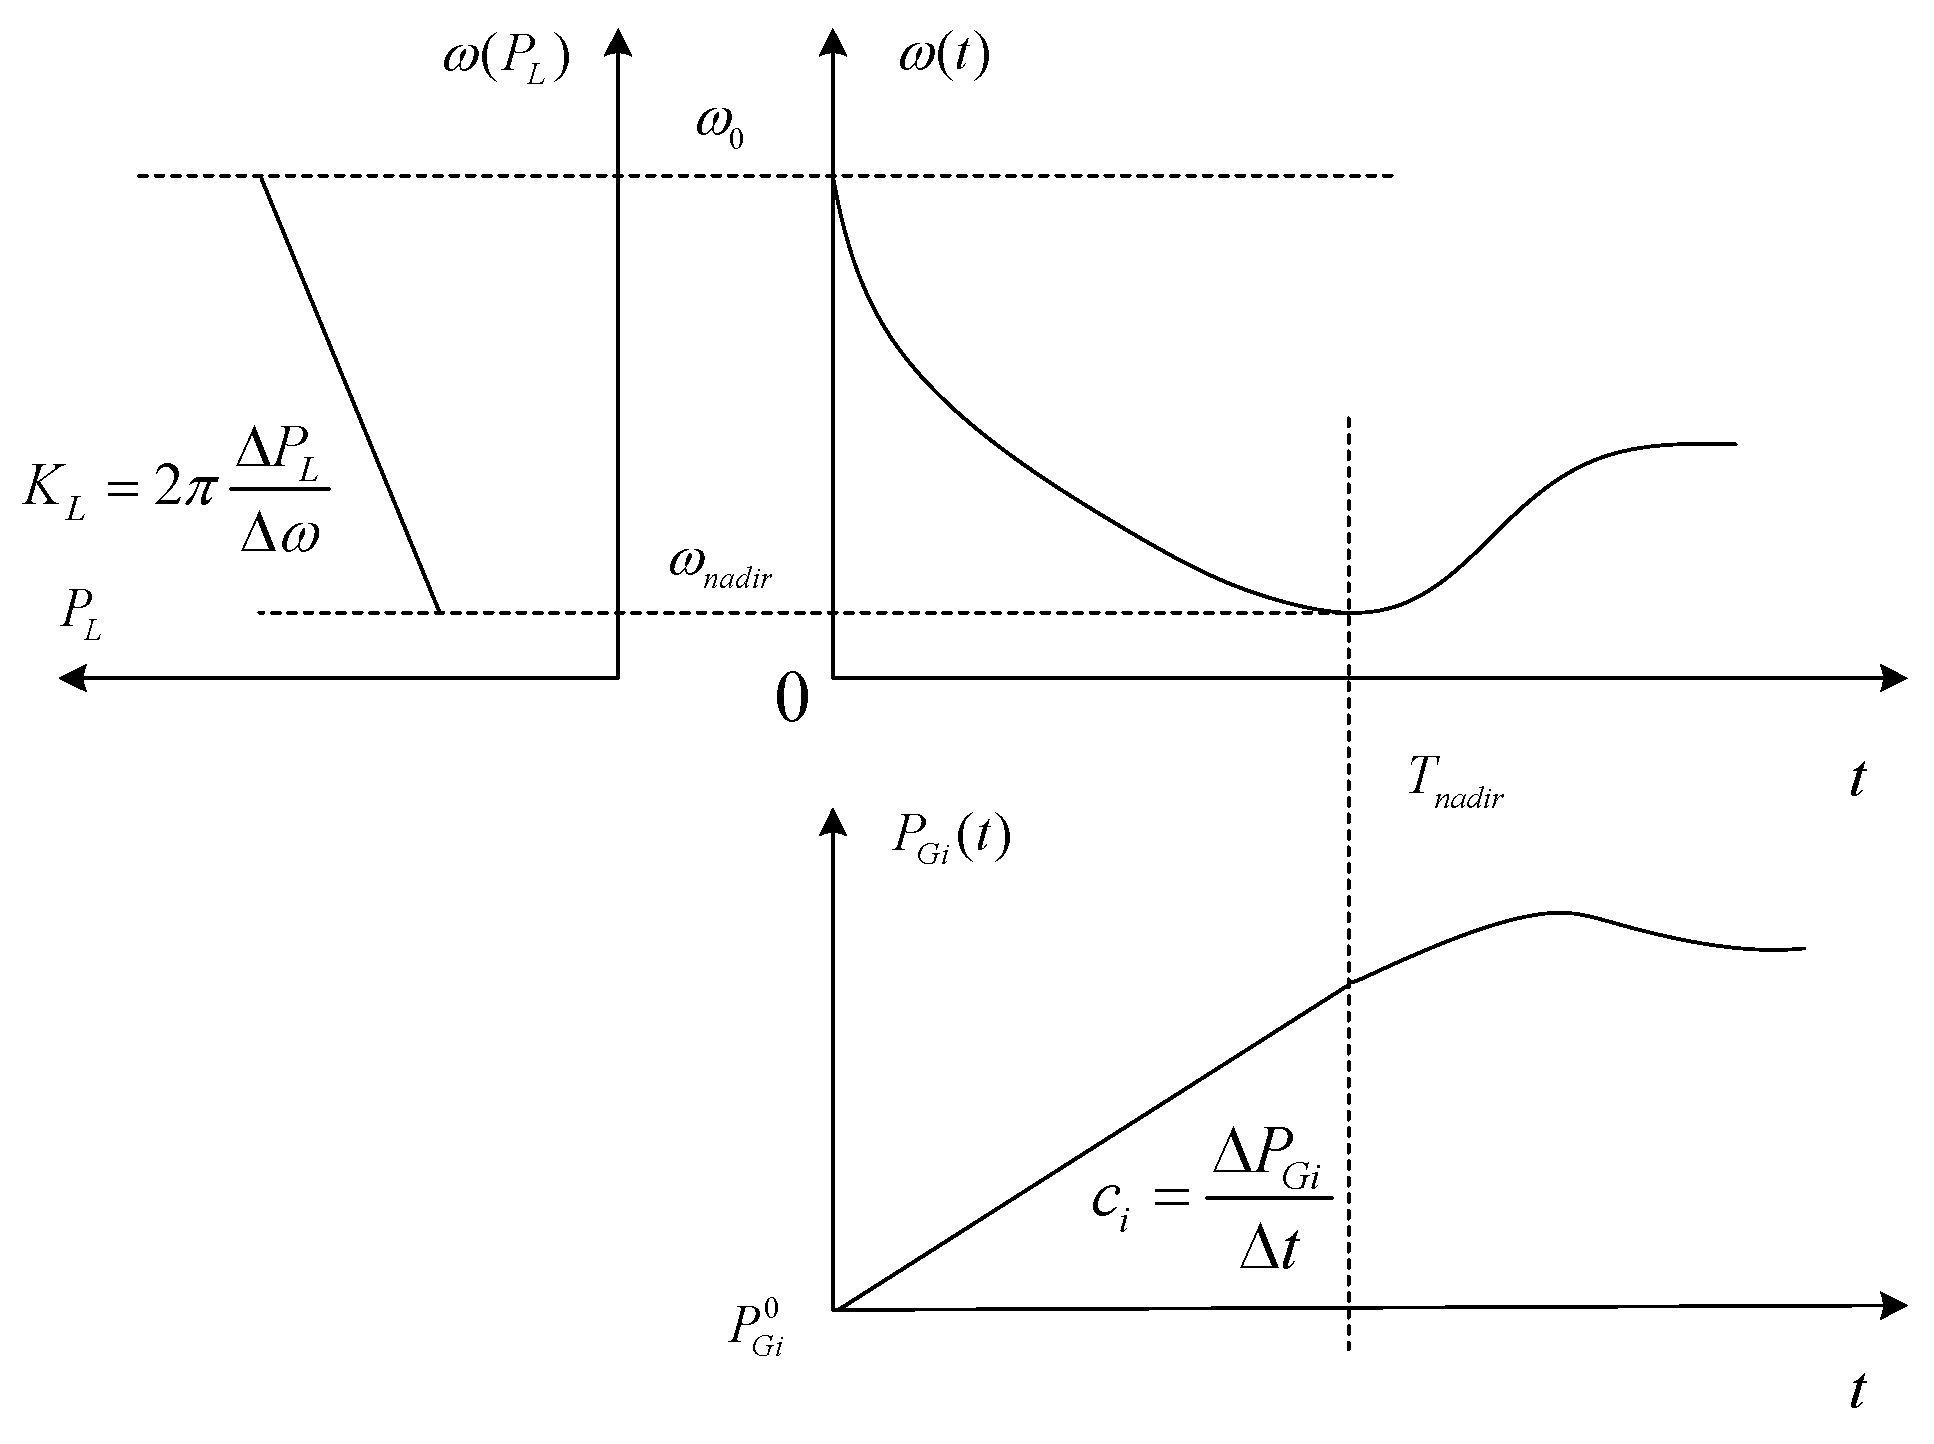
Figure 1. Primary frequency control model.
Sustainability 15 05386 g001
Figure 2. IEEE118-bus system island structure.
Sustainability 15 05386 g002
Figure 3. New England 39 bus frequency nadir comparison.
Sustainability 15 05386 g003
Figure 4. (a) The modified IEEE118 bus island structure without considering frequency nadir constraint; (b) The modified IEEE118 bus island structure considered frequency nadir constraint.
Sustainability 15 05386 g004
Table 1. The coherent grouping of the IEEE 118-bus system.
Coherent GroupGenerator Bus
110, 12, 25, 26, 31
246, 49, 54, 59, 61, 65, 66, 69, 80
387, 89, 100, 103, 111
Table 2. The comparison for the cut set of the IEEE 118-bus system.
MethodCut Set of Original SystemCut Set of Modified System
MISOCP15–33, 19–34, 30–38, 24–70, 24–72, 77–82, 80–96, 80–99, 96–97, 98–10015–33, 19–34, 30–38, 23–24, 77–82, 80–96, 80–99, 96–97, 98–100
MILP [11]15–33, 19–34, 30–38, 24–70, 24–72, 77–82, 80–96, 80–99, 96–97, 98–10015–33, 19–34, 30–38, 24–70, 24–72, 77–82, 80–96, 80–99, 96–97, 98–100
Spectral Clustering Algorithm [3]15–33, 19–34, 30–38, 23–24, 77–82, 80–96, 80–99, 96–97, 98–10015–33, 19–34, 30–38, 23–24, 77–82, 80–96, 80–99, 96–97, 98–100
Table 3. 9 bus frequency nadir comparison.
Ploss (MW)Time-Domain Simulation (Hz) ω T n a d i r (Hz)
Generator 1Generator 2Generator 3
1059.5959.5959.5959.63
1559.3959.3859.3959.40
2059.1859.1859.1859.21
Table 4. The ramp rate and the moment of inertia of generators in the modified 118-bus system.
UnitBusc (MW/s)J (kg·m²)
G1105.1112,120
G2121.710,350
G3264.586,480
G4493.445,473
G5544.96920
G6612.231,081
G7655.695,793
G8665.695,793
G9693.2112,121
G10805.15112,121
G11873.764830
G12898.7255,832
G131003.545,470
G141117.66920
Table 5. Frequency nadir comparison for generators in different islands.
IslandFrequency Nadir Considering Frequency Nadir Constraint (Hz)Frequency Nadir without Considering Frequency Nadir Constraint (Hz)
A59.4059.12
B59.3559.67
C59.4559.45
Table 6. The coherent grouping of the Poland 2383-bus system.
Coherent GroupGenerator Bus
110, 16, 17, 18, 264, 269, 277, 278, 279, 281, 282, 289, 294, 382, 383, 385, 390, 395, 404, 426, 444, 451, 482, 492, 493, 494, 514, 515, 525, 536, 537, 615, 784
231, 41, 45, 181, 556, 580, 584, 585, 607, 613, 623, 639, 651, 654, 664, 670, 674, 688, 692, 699, 712, 730, 732, 735, 740, 744, 754, 755, 760, 766, 1359, 1393, 1469
367, 83, 84, 85, 86, 93, 95, 97, 103, 104, 105, 109, 110, 180, 184, 185, 196, 790, 795, 798, 814, 834, 878, 884, 892, 895, 901, 910, 911, 912, 914, 917, 919, 920, 929, 959, 968, 993, 994, 995, 996, 997, 1024, 1027, 1028, 1029, 1053, 1054, 1105, 1106, 1107, 1138, 1141, 1175, 1182, 1183, 1184, 1191, 1192, 1201, 1202, 1203, 1232, 1233, 1244, 1247, 1250, 1268, 1316, 1325, 1349, 1356, 1403, 1416, 1417, 1418, 1426, 1429, 1475, 1504, 1514, 1534, 1537, 1538, 1543, 1550, 1566, 1587, 1600, 1620, 1635, 1638, 1710, 1717, 1730, 1734, 1742, 1749, 1793, 1799, 1844, 1871, 1875, 1932, 1947, 1966, 1977
4131, 132, 139, 140, 1603, 1609, 1617, 1627, 1630, 1664, 1669, 1673, 1674, 1679, 1683, 1685, 1686, 1698, 1700, 1706, 1712, 1719, 1726, 1728, 1735, 1739, 1758, 1760, 1761, 1763, 1764, 1768, 1788
5176, 2139, 2153, 2159, 2164, 2167, 2168, 2171, 2213, 2268, 2293, 2296, 2307, 2323, 2328, 2330, 2380, 2381
Table 7. Comparison of results on Poland 2383-bus system.
IslandThe Model without Considering Frequency Nadir ConstraintsThe Model Considering Frequency Nadir Constraints
Amounts of GeneratorsSynchronous Generator Inertia (kg·m²)Amounts of GeneratorsSynchronous Generator Inertia (kg·m²)
1624,032,475583,953,116
239821,44740841,879
31193,713,4011193,713,401
4864,050,519793,236,963
521204,607311,077,090
Table 8. Results comparison of different test systems.
Test SystemsNO. of IslandsPower-Flow Disruption (MW)SOCP Model Times (s)DC Power Flow Model Times (s)
New England 39 bus system2222.120.170.09
IEEE 118 bus system3138.490.380.25
Polish 2383 bus system53383.04129.02102.71
Disclaimer/Publisher’s Note: The statements, opinions and data contained in all publications are solely those of the individual author(s) and contributor(s) and not of MDPI and/or the editor(s). MDPI and/or the editor(s) disclaim responsibility for any injury to people or property resulting from any ideas, methods, instructions or products referred to in the content.