Abstract
Erosion by water reduces soil quality and hence crop yield. Understanding the response of crop yields to soil erosion is vital in assessing agriculture’s vulnerability to erosion. However, these effects are difficult to quantify. The study presents a quantitative relationship between soil erosion and soil quality and productivity of rainfed wheat (Triticum aestivum) by comparing field plots with different degrees of erosion in some sub-tropical alfisols in the Doon Valley region of India. By comparing the topsoil depth with the reference site as the control, erosion severity was classified into different phases such as slight, moderate, severe, and very severe. A quantitative, weighted additive model was used to evaluate soil quality for different phases of erosion using soil clay content, water holding capacity, soil aggregate, soil organic carbon, pH, CEC, total N, available P, and available K. The synthesis of long-term experimental data revealed that the mean soil erosion rate varied from 5.5 Mg ha−1 yr−1 in slightly eroded plots to 33.4 Mg ha−1 yr−1 in very severely eroded plots. Compared with the reference forest, the soil organic carbon (SOC) declined by 81.4% and water holding capacity by 31% in severely eroded soils. A substantial loss of total N, extractable P, and available K was also observed. Water stable aggregates (WSA) decreased from 86% to 12.6%, and the cation exchange capacity (CEC) from 25 to 12.6 c mol(+) kg−1. The soil quality index was 0.7 in slightly eroded compared with 0.4 in severely eroded soil. Similarly, the sustainable yield index for wheat was 0.9 and 0.6 for slightly and severely eroded soils, respectively. Thus, there is a strong need to identify land management systems that reduce erosion risks, restore eroded soils, and enhance soil quality.
1. Introduction
Accelerated soil erosion degrades soil quality, and severe degradation of soils has been responsible for the collapse of numerous historic and once thriving civilizations [1,2,3,4]. Furthermore, land misuse and soil mismanagement caused by indiscriminate agricultural expansion [5] can undermine agricultural productivity and environmental quality [6,7]. Erosion-induced soil and environmental degradation have plagued humanity since the dawn of settled agriculture about 10–12 millennia ago [6,8], adversely affecting a large proportion of the world’s arable land [9]. The global soil erosion rate from cropland is estimated at 10.2 Mg ha−1 y−1, which is more than 24 times the estimated average natural erosion rate (0.42 Mg ha−1 y−1) [10]. The problem is more severe for soils of the tropics, which are highly prone to erosion and other degradation processes [4,11].
Erosion depletes topsoil depth (TSD), soil organic carbon (SOC) concentration and stock, and nutrient status. It strongly impacts soil texture and structure, available water holding capacity (WHC), and water retention and transmission characteristics [12], which moderate soil quality and determine crop yield [13]. Soil erosion exacerbates the depletion of N, P, and K, and reduces the cation exchange capacity or CEC [14,15]. It aggravates chemical and nutritional constraints [16,17] on crop production. Specifically, it decreases AWC [18] and SOC concentration [19,20] and increases soil bulk density [7,21].
Erosion-induced changes in soil properties have been documented through simulated erosion by desurfacing [22,23,24,25,26,27] and comparing soil properties and crop yield on different phases of erosion [28,29,30,31,32,33,34]. However, there is a large variability and often an overestimation of the adverse effects because of inconsistent approaches and methodologies [1,35].
Some soils are more vulnerable than others, and the degradative effects are specific to soils, ecoregions, and crops, depending on the management and environmental factors [36]. The north-west Himalayan region of India is one of the hot spots of erosion-induced soil degradation [37,38]. Further, adverse impacts of soil erosion may be aggravated by climate change and the attendant increase in frequency and intensity of extreme events [39]. Thus, there exists large uncertainty about the impacts of future erosion on agronomic productivity and environmental quality [1]. Despite widespread awareness of the severity of erosion and its adverse impacts [40,41,42], quantitative information about the effects of past or future erosion on soil quality and agricultural productivity is scanty, especially for the vulnerable region of the western Himalayas. Thus, this study aimed to quantify the relationship between the severity of erosion and soil quality and productivity of rainfed wheat (Triticum aestivum) in north-western Himalayan India. How much soil erosion would be having what extent of damage to soil quality has been studied by minimizing the confounding effect of landscape on crop yield. Unless the erosion phases are carefully selected within a landscape position, the interaction effects of the landscape position and soil erosion phase make it challenging to establish a cause–effect relationship between soil erosion and crop productivity via alteration of soil quality. This study offers observational evidence from a series of erosional phases to answer the following research questions:
- (i)
- Can the magnitude of past soil erosion be assessed in comparison with the uneroded phase as the reference point?
- (ii)
- Does progressive soil erosion significantly impact soil quality and crop yield in a sloping landscape?
2. Materials and Methods
2.1. Soils and Site Description
The present study was conducted for 25 years on four contiguous runoff plots (60 × 7 m) with different degrees of erosion in the Doon Valley region of the lower Himalayas. The Doon valley is located in the Shiwalik Himalayas between latitudes 29°55′ and 30°30′ N and longitudes 77°35′ and 78°24′ E. It is a saucer-shaped valley about 25 km wide and 80 km long. The valley is a longitudinal, intermontane, synclinal depressed bouldery [43,44] filled with coarse clastic fan and gravel of the late Pleistocene and Holocene [45,46]. Geomorphologically, the landforms in the region are formed by variable erosion, deposition, and tectonic activity over time and space [43,47]. The deep alluvium is derived from sedimentary rocks, including shale, sandstone, limestone, siltstone, and conglomerate. The study region as a whole is characterized by a humid subtropical climate. The soil of the study site is alfisol as per the USDA taxonomic classification. The soil texture class of the experimental erosion plots is sandy loam and the reference site texture is sandy clay loam. The average annual rainfall is 1625 mm received over 78 rainy days, and the mean evaporation is 1092.7 mm [48]. Surface runoff is 40 to 50 percent of the total rainfall from the land with an 8-percent slope and 30 to 45 percent for 4-percent slope [48]. Rainfall exceeds evapotranspiration from June to October while water deficit prevails for the other months. The reference site was selected in an undisturbed forest close to the experimental location.
2.2. Experiment
The experimental layout of contiguous runoff plots is shown in Figure 1. Runoff plots were established on a landscape with a natural slope gradient of 0.5, 2.5, 4.5, and 9.5%, causing minimal soil disturbance. Different phases of erosion (e.g., slightly, moderately, severely, and very severely) were created naturally over time for the chosen land slopes. By comparing the topsoil depth with the reference site as control, erosion severity was classified into different phases: slight, moderate, severe, and very severe. Based on the cumulative loss of topsoil depth, the loss of topsoil was estimated at 5%, 13%, 29%, and 41%, respectively, in slight, moderate, severe, and very severe phases. Thus, soil properties under different erosional phases were compared by taking three composite samples as pseudo-replicates within each runoff plot. Maize (Zea mays) and wheat (Triticum aestivum) were grown on each erosional plot under rainfed conditions. Each plot was bermed with earth to prevent outside run-on and facilitate farm operations. Each runoff plot was equipped with a flume, a Coshocton-type runoff sampler [49] which samples 1% of the total flow, and a collection tank that retains runoff and sediment. Runoff was measured for every erosive event, and measurements were made daily during heavy and continuous rains. Runoff was expressed as the equivalent depth of water for the plot. Suspended sediment concentrations were determined gravimetrically using the filtration method [49]. Soil loss (the product of runoff volume and sediment concentration) was expressed as Mg per hectare. Soil loss and runoff data for each sampled runoff event were summed to obtain the annual losses. Soil samples (0–15 cm depth) were collected from each erosion phase as well as from the reference site for the analyses of physical (clay content. WHC, and water stable aggregates or WSA) and chemical properties (pH, CEC, SOC, total N, Olsen P, and available K) and texture. To determine WSA, the soils were sieved using the wet sieving technique [50]. WSA was assessed according to methods described by Cambardella and Elliott [51] and expressed as aggregates > 1.0 mm. A separate set of composite samples were ground and sieved through a 2 mm sieve, and 50 g of the sieved soil was used for particle size analysis (clay content) by the hydrometer method [52]. The remaining soils were used for the determination of water holding capacity [50], soil pH in a 1:2.5 soil: water suspension (Thomas, 2001), SOC by the method of Walkley and Black [53], CEC [54], soil nitrogen by the Kjeldahl method [55], available P [56], and available K [57].
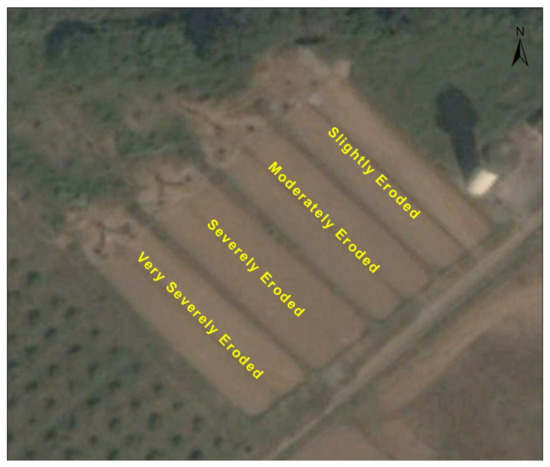
Figure 1.
Study area with experimental runoff plots.
Conventional tillage was performed using a mould board plow as preparatory tillage, followed by a seed driller for wheat sowing. Wheat variety UP 2572 was sown using a 100 kg ha−1 seed rate at 22.5 cm row spacing to a 5–6 cm soil depth in late September every year. The crop was fertilized with 60 kg N, 13 kg P, and 16 kg K. Half of the N and the total amount of P and K were applied at the sowing time. The remaining quantity of N was applied at the booting stage of the crop. For the control of wheat rust, whenever the appearance of the disease was noticed, propiconazole (tilt) was sprayed with the recommended dose. The hand harvest method was used for wheat yield determination by taking replicate samples (1 × 1 m) at crop harvest. Wheat grain yield was recorded at 12% moisture content.
The sustainability yield index ‘SYI’ of treatment over a period of ‘n’ years was derived by the equation: SYI = (Yt − σ)/Ymax [38], where Yt is the treatment mean, σ is the overall standard deviation, and Ymax is the maximum attainable yield in the experiment during the reporting period.
2.3. Soil Quality Evaluation
Soil removal alters soil’s physical and chemical properties and changes overall soil quality. A quantitative, weighted additive model was used to evaluate soil quality for different phases of erosion [58]. The key 9 soil parameters, namely, clay content, WHC, WSA, SOC, pH, CEC, total N, available P, and available K, were converted to unit-less scores (0–1 scale) using appropriate membership functions, and each of these values were multiplied by respective weights. In an erosional landscape, the crop yields are related to erosion-induced differences in soil properties. The most important soil properties are WHC, WSA, SOC, CEC, clay content, and nutrients (pH, N, P, and K). This weighted additive model provides an overall measure of soil quality. A synthesis assessment index was developed to evaluate the soil quality index (SQI) [59]. The SQI represents erosion-related factors on soil quality in one number. The SQI is expressed as follows (Equation (1)):
where Wi = Weights of the indicators, and Si = the score of the indicators; thus, the 9 indicators (measured soil attributes) were combined into an SQI.
SQI = ∑Wi Si
The evaluation involves combined fuzzy analysis and the analytic hierarchy process (AHP) methods [60,61,62]. The fuzzy analysis was used to calculate the membership functions for each evaluation factor, following the methods suggested by many researchers [58,63,64,65]. Soil parameters were transformed using the following two types of fuzzy membership functions: upper limit function and peak limit function in terms of their relationship with soil functionality. Soil functionality is the evaluation approach that involves properties and processes relating to its ability to function effectively [66,67].
Upper limit function (Equation (2))
where yi is the value of the membership function, ai is a constant, ui is the measured value of the evaluation factor, uoi is the optimum (or upper) value of the evaluation factor, uli is the lower limit value of the evaluation factor, and the subscript I denotes the ith value of the factor in the range from 1 to m. This function was chosen for WHC, SOC, WSA, CEC, N, available P, and available K.
The peak function (Equation (3)) is as follows:
where ul1 and ul2 are the lower and upper limits for ui. This function was used for clay content and pH.
Parametric values for the above two membership functions for the 9 measured soil attributes are listed in Table 1 and Table 2.

Table 1.
Upper limit membership functions and parameters used for various soil attributes.
Table 2.
Peak membership function and parameters used for various soil attributes.
The AHP was adopted to evaluate weight objectively and accurately. Further, quantitative and qualitative analyses are adequately integrated into a model to assess soil quality. This integration involves analysis, judgment, and the synthesis process. Specifically, a complex problem is partitioned into several layers corresponding to specific dominating factors. These factors were then prioritized based on their relative importance. Different weights were then decided by sensitivity analysis, their maximum eigenvalues, and the consistency test [68]. The model establishment is an iterative process, and both Si and Wi were finalized through model calibrations and validations. Because the focus is to assess the impact of erosion on soil quality, a hierarchy of those factors is established, which have a direct relationship between erosion and soil properties and crop productivity. The judgment matrices and the consistency ratio outcomes are shown in Table 3 and Table 4. In the final calibrated and validated model, the total consistency ratio (CR) is 1.531 × 10⁻¹⁶ (=2.22 × 10⁻¹⁶/1.45), which is less than 0.1. Therefore, the consistency test is satisfied [61,69,70]. The consistency test for hierarchy sorting was done by the method of Zhang et al. [60] and Alam et al. [71]. Additional information on the distribution of hierarchy and weights of attributes is available elsewhere [67,69,70]. Relative weights of different soil parameters derived through AHP were in the order of 0.34, 0.17, 0.07, 0.11, 0.06, 0.09, 0.06, 0.04, and 0.06 for WHC, SOC, WSA, CEC, clay content, pH, N, P, and K, respectively.
Table 3.
Judgment matrix of various soil parameters used.
Table 4.
Range and mean values of runoff and soil loss in different phases of soil erosion.
2.4. Statistical Analysis
All data were subjected to analysis of variance (ANOVA) using a statistical package (SAS 9.3) to assess the impact of erosion on soil quality. The statistical significance of each attribute was assessed using Fisher’s least significant difference (LSD) at the p < 0.05 level. Regression analysis was done between SQI and SYI to evaluate their quantitative relationship.
3. Results and Discussion
3.1. Soil Quality Indicators
The distribution of the soils under the natural ecosystems in the region is generally influenced by the geological substrate and landscape positions. However, several characteristics of the soils in the study region are also affected by erosion and management practices, including land use.
In the present study, soil loss by water erosion was the highest in the very severe erosional phase, and relatively less soil loss occurred in the slight erosion phase (Figure 2). The data presented in Table 5 revealed that the mean runoff varied between 153.5 mm and 465.5 mm in the slight and very severe erosion phases, respectively. There were significantly higher water losses through runoff with the progressive increase in slope gradient. Compared to the slight erosion phase (5.5 Mg ha−1), the sediment loss was significantly higher in the severe (22.7 Mg ha−1) and very severe erosion phases (33.4 Mg ha−1) than in other phases and reference sites. Excessive sediment loss and overland flow are of particular concern in Indian Himalayas [11,71]. Being located in high rainfall areas, soil erosion is further aggravated in such fragile terrain. The average soil loss was well below the tolerance level in the case of the slight and moderate phases of erosion. However, the magnitude of soil erosion was about 1.8 times and 2.7 times more in the severe and very severe erosion phases, respectively. Despite the higher erosion rate in the very severe eroded phase, the clay content is similar to that of the reference site. Higher clay content in sub-surface soils than in surface soil is the reason behind this. Because of the relatively larger drop size, tropical rains are characterized by high energy and intensity [6]; thus, a high water infiltration capacity is critical in reducing soil erosion risks.
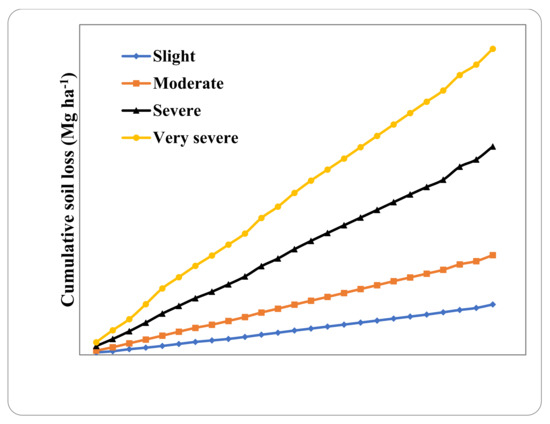
Figure 2.
Cumulative soil erosion in different phases of soil erosion.
Table 5.
Range and mean values of soil parameters in different erosional phases.
Data in Table 5 show the range and mean values of the physical and chemical indicators of soil quality for different erosional phases within the same landscape environment. An increase in the severity of erosion (from slight to very severe) decreased the WHC, WSA, SOC, CEC, total N, extractable P, and available K, but increased the clay content and pH. Clay content varied from 17% to 26%, with mean values of 18.4% to 23.0% in the slight and severe erosion phases, respectively (Table 5). The significant difference in clay content among the erosional phases may be due to a steeper slope gradient, more accelerated erosion, and less plant cover in the moderate, severe, and very severe phases than in the reference and slight erosional phases. In addition, the transportation of lighter fractions is relatively less in the slight phase. Shaver et al. [72] related differences in the soil physical properties to the differences in landscape slope gradient and land use management. Low clay concentration in the severe phase (because coarse silt and sand fractions are deposited, while clay fractions are carried with runoff) has been reported by Lal [1]. Li and Lindstrom [73] also observed a linear decrease in clay content and a corresponding increase in silt content due to the selective removal of finer particles by water. Preferential removal may also explain the low clay content in steeply sloping lands [74].
The WHC is relatively lower in the severe (40–45%) and very severe (35–40%) than in the slight (44–52%) and moderate (42–50%) erosional phases (Table 5). The average WHC was 48.6%, 45.8%, 42.8%, and 36.6% in the slight, moderate, severe, and very severe phases, respectively, whereas the average WHC was 53% in the reference site. Therefore, a decrease in WHC with an increase in the severity of erosion may be due to a decline in SOC concentration, as was also reported by Bakker et al. [1] and Sun et al. [75]. Further, the relative proportion of the coarse fraction increases with an increase in the severity of erosion [48]. In the reference site, significantly higher values of SOC and WHC are observed, probably because of less movement of clay and organic matter due to the lower steepness of the slope, rapid recovery of the natural vegetation, less erosion, and slower oxidation of the new organic material [41,76,77].
The WSA ranged from 86% to 22.6% (Table 5), and the largest percentage of WSA (86%) was observed in the reference site. The SOC concentration ranged from 0.3% to 2.3%, and a low SOC concentration was observed in the severe (0.6%) and very severe (0.4%) phases. Thus, a higher WSA in the reference site may be due to more SOC concentration and better root biomass production, which act as binding agents between particles [78]. Similar findings were reported by Motavalli and McConnell [79] and Riezebos and Loerts [80]. A strong decrease in SOC concentration and WSA in the severe erosional phases indicates that the erosional process is the principal determinant of the changes in the surface soil properties in erosion-prone landscapes, affecting soil functions that support plant growth, water retention, and availability [81,82]. The decline in the soil physical quality of sloping lands in the tropics is a major issue. Whereas the plant nutrients can be replenished by applying fertilizers and manures, drastic adverse changes in the soil physical quality and water retention capacity cannot be quickly restored by routine soil management options [13]. Further, the SOC concentration strongly affects the WHC, WSA tilth, and soil biodiversity [83,84]. The rapid decline in the SOC concentration in cultivated soils of the tropics may be due to the continuously high temperatures, severe erosion, and depletion of plant nutrients. A severe loss of SOC concentration degrades the soil structure (WSA) and hydrological parameters and increases soil erodibility [7,15,35].
Soil pH ranged from 5.5 to 6.3 (Table 5) and differed significantly among the erosional phases. Soil pH increased with an increase in the severity of erosion. However, pH did not differ considerably among the slight and moderate erosional phases. A more significant change in pH was recorded with the further severity of erosion. Surprisingly, the soil pH of the reference site with minimum soil erosion was 6.2. This trend indicates that some pedological and edaphological processes are responsible for such a trend. Soil acidification may have occurred in the slight and moderate erosional phases. Erosion appears to expose the sub-surface material containing bases which increased the pH by 1 unit in the soil of the severe and very severe erosion phases [48]. An increase in soil pH with the severity of erosion was also reported by Cihacek and Swan [85], where soil erosion exposed the calciferous horizon.
The data in Table 5 show that the mean value of CEC followed this order: reference site (25 c mol(+)kg−1) > slight eroded (15.2 c mol(+)kg−1) > moderate (14.5 c mol(+)kg−1) > severe (13.4 c mol(+)kg−1) > very severe erosional phases (12.7 c mol(+)kg−1). On average, significantly more CEC was observed in the reference site soil than in the slight, moderate, severe, and very severe erosional phases. These trends in CEC may be in accord with the SOC concentrations. Total N followed trends similar to those of CEC. Extractable P was lower in the reference site, and available K decreased with an increase in the severity of erosion. Average values of available K (kg ha−1) were 221.1, 197.2, 171.2, and 151 in the slight, moderate, severe, and very severe erosional phases, respectively. Pimentel et al. [9] and Mandal et al. [15] also observed that soil erosion causes the loss of basic plant nutrients such as N, P, K, and Ca.
3.2. Soil Quality and Erosional Phases
Mean values of key soil properties (clay content, WHC, WSA, SOC, pH, CEC, total N, available P, and available K) were used to assess soil quality (Table 5). By using the combined fuzzy-AHP scoring technique, overall soil quality was compared among erosional phases (Table 6). The data show that SQI values ranged from 0.7 in the slight to 0.4 in the very severe erosional phase (Table 6), and it was better in the slight erosion phrase and had a higher weighted additive score than the other erosional phases. Compared to the erosional phases, the reference site had the highest SQI value of 0.9, as expected. In other words, the reference site had a better SQI than that for the erosional phases. The direction and degree of the change in soil quality depend on exogenous (climate and land use) and endogenous soil properties. In general, severe progressive soil erosion increases the magnitude of soil-related constraints to agronomic production [14]. Excessive erosion can drastically reduce soil quality, adversely affect agronomic yield [86,87,88,89], and severely jeopardize agricultural production. Soil degradation can render agriculture unsustainable [90], necessitating the conversion to restorative land use and adoption of best management practices (BPMs) [70].
Table 6.
Soil quality index, sustainable yield index, and their relationship in various erosional phases.
3.3. Wheat Yield and Sustainable Yield Index
The grain yield of wheat was compared in different phases of erosion, and it decreased with an increase in the severity of erosion. Grain yield was significantly higher in slight erosion with a mean yield of 3.6 Mg ha−1 than the other treatments (Figure 3). The lowest yield with a mean value of 2.6 Mg ha−1 was recorded in the very severe eroded phase. Differences in crop yield among the erosion phases may be due to the differences in WHC and available nutrient content of the soil. Very severely eroded soil had significantly lower WHC, available P, and available K than the slight and moderate erosion phases [15].
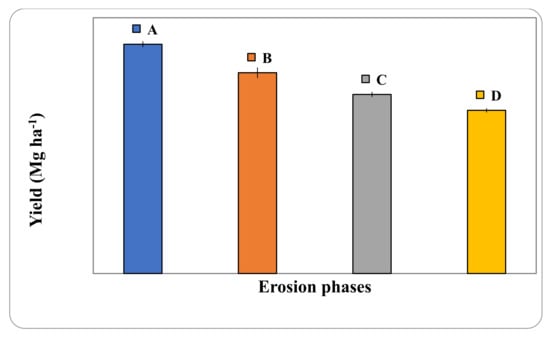
Figure 3.
Wheat yield in different phases of erosion. Different letters (A,B,C,D) represent significant difference at Pb0.05.
The data on wheat yield for the different erosion phases (Figure 3 and Table 6) indicate that SYI was more slight (0.9) than the other erosional phases. Thus, the grain yield of wheat is more sustainable in the less eroded or uneroded than in severely eroded soils. Regression analysis showed that SYI is significantly (R2 = 0.8) correlated with SQI and that an increase in the severity of erosion decreases SQI and SYI. Further, the increase in erosion severity similarly decreased both SQI and SYI. Although many researchers [91] did not find a significant relationship between SQI and crop yield, our study found a strong relationship between them. Our results are in agreement with Nakajima et al. (2016). Soil erosion under agricultural land use has also been viewed as an important driver impacting soil quality by Nosrati and Collins [92].
4. Conclusions
This study offers observational evidence from a series of erosional phases having different magnitudes of cumulative soil erosion. Based on the cumulative past soil erosion, the loss of topsoil was estimated at 5%, 13%, 29%, and 41%, respectively, in the slight, moderate, severe, and very severe erosion phases. The severe erosion phase had about three times more water loss and six times more soil loss than the slight erosion phase.
Our results showed that soils in the slight and moderate erosional phases were characterized by less variation in soil properties (e.g., WSA, pH, CEC, total N, available P, and available K). The severe erosional phase had significantly lower WHC, WSA, and SOC concentrations than those for the moderate or slight erosional phases. The severity of soil erosion also affected the pH and available nutrients. This study indicates that progressive erosion had a significant impact on SQI. SQI was higher in the reference site soil than in the slight, moderate, severe, and very severe erosional phases. Thus, accelerated soil erosion decreases the magnitude of one or more soil functions. Compared with the reference site, the SQI typically declined by 22.2% and 55.5%, respectively, in the slightly eroded and very severely eroded phases. Accelerated soil erosion had a strong impact on wheat productivity. Wheat productivity significantly reduced with the increase in erosion. However, the results obtained in the study need to be verified in a long-term experiment “with and without” nutrient application, as fertilizer has a masking effect on soil quality. A direct relationship was observed between SQI and SYI in different phases of erosion in the north-western Himalayan region. Further, this study provides a reference for the targeted soil conservation measures and land management techniques so that soil quality can be improved in the north-western Himalayan region of India.
Author Contributions
Conceptualization D.M., N.K.S. and S.P.; formal analysis, D.M., N.K.S., S.P. and R.L.; investigation, D.M., N.K.S., N.M.A. and S.P.; resources, D.M., N.K.S., S.P. and R.L.; data curation, D.M., N.K.S., S.P., N.M.A., C.J. and R.L.; writing—original draft preparation, D.M., N.K.S., S.P.; writing—review and editing, D.M., N.K.S., S.P., C.J., N.M.A. and R.L.; visualization, D.M., N.K.S., S.P. and R.L.; supervision, D.M., N.K.S. and S.P.; project administration D.M. and N.K.S.; funding acquisition, D.M. All authors have read and agreed to the published version of the manuscript.
Funding
This research received no external funding.
Institutional Review Board Statement
The study was conducted in accordance with the approved by the Institutional Review Board (or Ethics Committee) of ICAR-Indian Institute of Soil and Water Conservation through IRC Reference No. NRMAIISWCCOL201500700093.
Informed Consent Statement
Not applicable.
Data Availability Statement
Not applicable.
Acknowledgments
We thank all the scientists of ICAR-Indian Institute of Soil and Water Conservation, Dehradun, who have directly or indirectly contributed to ensuring the timely completion of this study. Financial support provided by the institute is also thankfully acknowledged.
Conflicts of Interest
The authors declare no conflict of interest.
Abbreviations
| AHP | Analytic Hierarchy Process (AHP) |
| CEC | Cation Exchange Capacity (CEC) |
| SOC | Soil Organic Carbon (SOC) |
| SQI | Soil Quality Index |
| SYI | Sustainable Yield Index |
| TSD | Topsoil Depth (TSD) |
| WHC | Water Holding Capacity (WHC) |
| WSA | Water Stable Aggregate |
References
- Bakker, M.M.; Govers, G.; Jones, R.A.; Rounsevell, M.D.A. The Effect of Soil Erosion on Europe’s Crop Yields. Ecosystems 2007, 10, 1209–1219. [Google Scholar] [CrossRef]
- Flenley, J.; Bahn, P. The Enigmas of Easter Island; Oxford University Press: New York, NY, USA, 2004. [Google Scholar]
- Lal, R. The soil-peace nexus: Our common future. Soil Sci. Plant Nutr. 2015, 61, 566–578. [Google Scholar] [CrossRef]
- Mandal, D.; Giri, N. Soil erosion and policy initiatives in India. Curr. Sci. 2021, 120, 1007–1012. [Google Scholar] [CrossRef]
- He, X.; Zhou, J.; Zhang, X.; Tang, K. Soil erosion response to climatic change and human activity during the Quaternary on the Loess Plateau, China. Reg. Environ. Chang. 2006, 6, 62–70. [Google Scholar] [CrossRef]
- Lal, R. Why Carbon Sequestration in Soil? In Agricultural Practices and Policies for Carbon Sequestration in Soil, Proceedings of the An International Symposium, WexnerCenter for the Arts, The Ohio State University, Columbus, OH, USA, 19–23 July 1999; Lewis Publishers: Boca Raton, FL, USA, 1999. [Google Scholar]
- González-Rosado, M.; Parras-Alcántara, L.; Aguilera-Huertas, J.; Lozano-García, B. Soil Productivity Degradation in a Long-Term Eroded Olive Orchard under Semiarid Mediterranean Conditions. Agronomy 2021, 11, 812. [Google Scholar] [CrossRef]
- Morgan, R.P.C. Sensitivity of European Soils to Ultimate Physical Degradation. In Scientific Basis for Soil Protection in the European Community; Barth, H., L’Hermitage, P., Eds.; Elsevier: Amsterdam, The Netherlands, 1987; pp. 147–157. [Google Scholar]
- Pimentel, D.; Harvey, C.; Resosudarmo, P.; Sinclair, K.; Kurz, D.; MnCair, M.; Crist, S.; Shpritz, L.; Fitton, L.; Saffouri, R.; et al. Environmental and economic costs of soil erosion and conservation benefits. Science 1995, 267, 1117–1123. [Google Scholar] [CrossRef]
- Zhide, Z.; Yuling, T. Sediment in Rivers—Origin and Challenge. Stockh. Water Front. 2010, 4, 8–10. [Google Scholar]
- Sharda, V.N.; Mandal, D. Prioritization and Field Validation of Erosion risk areas for combating land degradation in north western Himalayas. Catena 2018, 164, 71–78. [Google Scholar] [CrossRef]
- Pimentel, D.; Burgess, M. Soil Erosion Threatens Food Production. Agriculture 2013, 3, 443–463. [Google Scholar] [CrossRef]
- Lal, R. Soil erosion impact on agronomic productivity and environment quality. Crit. Rev. Plant Sci. 1998, 4, 319–464. [Google Scholar] [CrossRef]
- Lal, R. Monitoring Soil Erosion’s Impact on Crop Productivity. In Soil Erosion Research Methods; Lal, R., Ed.; Soil and Water Conservation Society: Ankeny, IA, USA, 1988; pp. 187–200. [Google Scholar]
- Mandal, D.; Chandrakala, M.; Alam, N.M.; Roy, T.; Mandal, U. Assessment of soil quality and productivity in different phases of soil erosion with the focus on land degradation neutrality in tropical humid region of India. Catena 2021, 204, 105440. [Google Scholar] [CrossRef]
- Lal, R. Soil degradation by erosion. Land Degrad. Dev. 2001, 12, 519–539. [Google Scholar] [CrossRef]
- Lobo, D.; Lozanoand, Z.; Delgado, F. Water erosion risk assessment and impact on productivity of a Venezuelan soil. Catena 2005, 6, 297–306. [Google Scholar] [CrossRef]
- Nizeyimana, E.; Olson, K.R. Chemical, mineralogical, and physical property differences between moderately and severely eroded Illinois soils. Soil Sci. Soc. Am. J. 1988, 52, 1740–1748. [Google Scholar] [CrossRef]
- Rhoton, F.E.; Tyler, D.D. Erosion induced changes in soil properties of a fragipan soil. Soil Sci. Soc. Am. J. 1990, 54, 223–228. [Google Scholar] [CrossRef]
- Carter, M.R. Soil quality for sustainable land management: Organic matter and aggregation interactions that maintain soil functions. Agron. J. 2002, 94, 38–47. [Google Scholar] [CrossRef]
- Frye, W.W.; Ebelhar, S.A.; Mudorck, L.W.; Blevis, R.L. Soil erosion effects on properties and productivity of two Kentucky soils. Soil Sci. Soc. Am. J. 1982, 46, 1051–1055. [Google Scholar] [CrossRef]
- Mbagwu, J.S.C.; Lal, R.; Scott, T.W. Effects of desurfacing of Alfisols and Ultisols in Southern Nigeria I. Crop performance. Soil Sci. Soc. Am. J. 1984, 48, 828–833. [Google Scholar] [CrossRef]
- Dormaar, J.F.; Lindwall, C.W.; Kozub, G.C. Restoring productivity to an artificially eroded dark brown chernozemic soil under dryland conditions. Can. J. Soil Sci. 1986, 66, 273–285. [Google Scholar] [CrossRef]
- Gollany, H.T.; Schumacher, T.E.; Lindstrom, M.J.; Evenson, P.D.; Lemme, G.D. Topsoil depth and desurfacing effects on properties and productivity of a typic Argiustoll. Soil Sci. Soc. Am. J. 1992, 56, 220–225. [Google Scholar] [CrossRef]
- Malhi, S.S.; Izaurralde, R.C.; Nyborg, M.; Solberg, E.D. Influence of topsoil removal on soil fertility and barley growth. J. Soil Water Conserv. 1994, 49, 96–101. [Google Scholar]
- Tanaka, D.L. Spring wheat straw production and composition as influenced by topsoil removal. Soil Sci. Soc. Am. J. 1995, 59, 649–654. [Google Scholar] [CrossRef]
- Larney, F.J.; Olson, B.M.; Janzen, H.H.; Lindwall, C.W. Early impacts of topsoil removal and soil amendments on crop productivity. Agron. J. 2000, 92, 948–956. [Google Scholar] [CrossRef]
- Bramble-Brodahl, M.; Fosberg, M.A.; Walker, D.J.; Falen, A.L. Changes in Soil Productivity Related to Changing Topsoil Depth on Two Idaho Palouse Soils. In Erosion and Soil Productivity; American Society of Agricultural Engineers: New Orleans, LA, USA, 1984. [Google Scholar]
- Busacca, A.J.; McCool, D.K.; Papendick, R.I.; Young, D.L. Dynamic Impacts of Erosion Processes on Productivity of Soils in the Palouse. In Erosion and Soil Productivity; American Society of Agricultural Engineers: New Orleans, LA, USA, 1984; pp. 152–169. [Google Scholar]
- White, A.W.; Bruce, R.R.; Thomas, A.W.; Langdale, G.W.; Perkins, H.F. Characterizing Productivity of Eroded Soils in the Southern Piedmont. In Erosion and Soil Productivity; American Society of Agricultural Engineers: New Orleans, LA, USA, 1984. [Google Scholar]
- Mielke, L.N.; Schepers, J.S. Plant response to topsoil thickness on an eroded loess soil. J. Soil Water Conserv. 1986, 41, 59–63. [Google Scholar]
- Olson, K.R.; Carmer, S.G. Corn yield and plant population differences between eroded phases of Illinois soils. J. Soil Water Conserv. 1990, 45, 562–566. [Google Scholar]
- Kosmas, C.; Gerontidis, S.; Marathianou, M.; Detsis, B.; Zafiriou, T.; Muysen, W.; Govers, G.; Quine, T.; Vanoost, K. The effects of tillage displaced soil on soil properties and wheat biomass. Soil Tillage Res. 2001, 58, 31–44. [Google Scholar] [CrossRef]
- Bakker, M.M.; Govers, G.; Rounsevell, M.D.A. The crop productivity—Erosion relationship: An analysis based on experimental work. Catena 2004, 57, 55–76. [Google Scholar] [CrossRef]
- Borrelli, P.; Alewell, C.; Alvarez, P.; Anache, J.A.A.; Baartman, J.; Ballabio, C.; Bezak, N.; Biddoccu, M.; Cerdà, A.; Chalise, D.; et al. Soil erosion modelling: A global review and statistical analysis. Sci. Total Environ. 2021, 780, 55–76. [Google Scholar] [CrossRef]
- Wolman, M.G. Soil Erosion and Crop Productivity: A Worldwide Perspective. In Soil Erosion and Crop Productivity; Follet, R.F., Stewart, B.A., Eds.; American Society of Agronomy: Madition, WI, USA, 1985; pp. 9–21. [Google Scholar]
- Singh, R.P.; Das, S.K.; Rao, U.M.B.; Reddy, M.N. CRIDA Report; CRIDA: Hyderabad, India, 1990; p. 106. [Google Scholar]
- Bhandari, D.; Joshi, R.; Regmi, R.R.; Awasth, N. Assessment of Soil Erosion and Its Impact on Agricultural Productivity by Using the RMMF Model and Local Perception: A Case Study of Rangun Watershed of Mid-Hills, Nepa. Appl. Environ. Soil Sci. 2021, 10, 5747138. [Google Scholar] [CrossRef]
- Pruski, F.; Nearing, M. Climate-induced changes in erosion during the 21st century 5 for eight US locations. Water Resour. Res. 2002, 38, 986. [Google Scholar] [CrossRef]
- Sharda, V.N.; Dogra, P.; Prakash, C. Assessment of production losses due to water erosion in rainfed areas of India. J. Soil Water Conserv. 2010, 65, 79–91. [Google Scholar] [CrossRef]
- Mandal, D.; Singh, R.; Dhyani, S.K.; Dhyani, B.L. Landscape and land use effects on soil resources in a Himalayan watershed. Catena 2010, 81, 203–208. [Google Scholar] [CrossRef]
- Mandal, D.; Sharda, V.N. Appraisal of soil erosion risk in the eastern Himalayan region of India for soil conservation planning. Land Degrad. Dev. 2013, 24, 430–437. [Google Scholar] [CrossRef]
- Thakur, V.C.; Pandey, A.K. Late Quaternary tectonic evolution of Doon in fault bend/propagated fold system, Garhwal Sub-Himalaya. Curr. Sci. 2004, 87, 1567–1576. [Google Scholar]
- Kumar, R.; Suresh, N.; Sangode, S.J.; Kumaravel, V. Evolution of the quaternary alluvial fan system in the Himalayan foreland basin: Implications for tectonic and climatic decoupling. Quat. Int. 2007, 159, 6–20. [Google Scholar] [CrossRef]
- Puri, G.S. Soil pH and forest communities in the Sal (Shorearobusta) forests of the Dehradun valley, U.P. India. Indian For. 1950, 76, 292–303. [Google Scholar]
- Singh, A.K.; Parkash, B.; Mohindra, R.; Thomas, J.V.; Singhvi, A.K. Quaternary alluvial fan sedimentation in the Dehradun piggyback Basin, NW Himalaya: Tectonic and paleoclimatic implications. Basin Res. 2001, 13, 449–471. [Google Scholar] [CrossRef]
- Thakur, V.C. Geology of Dun Valley Garhwal Himalaya: Netectonics and coeval deposition with fault propagation folds. J. Himal. Geol. 1995, 6, 1–8. [Google Scholar]
- Mandal, D.; Dadhwal, K.S. Land Evaluation and Soil Assessment for Conservation Planning and Enhanced Productivity; Central Soil and Water Conservation Research and Training Institute: Dehradun, India, 2012; p. 90. [Google Scholar]
- Brakensiek, D.L.; Osborn, H.B.; Rawls, W.J. Field Manual for Research in Agricultural Hydrology; Agriculture Handbook, U.S. Govermental Print Office; Department of Agriculture, Science and Education Administration: Washington, DC, USA, 1979; p. 224. [Google Scholar]
- Esterfan, G.; Summer, R.; Ryan, J. Methods of Soil, Plant and Water Analysis: A Manual for the West Asia and North Africa Region; International Centre for Agricultural Research in Dry Areas: Beirut, Lebanon, 2013. [Google Scholar]
- Cambardella, C.A.; Elliott, E.T. Carbon and nitrogen distribution in aggregates from cultivated and native grassland soils. Soil Sci. Soc. Am. J. 1993, 57, 1071–1076. [Google Scholar] [CrossRef]
- Gee, G.W.; Or, D. Particle Size Analysis. In Methods of Soil Analysis, Part 4, Physical Methods; Dane, J.H., Topp, C., Eds.; Soil Science Society of America Book Series; Soil Science Society of America: Madison, WI, USA, 2001. [Google Scholar]
- Nelson, D.W.; Sommers, L.E. Total Carbon, Organic Carbon and Organic Matter. In Methods of Soil Analysis, Part 3, Chemical Methods; Sparks, D.L., Page, A.L., Helmke, P.A., Loeppert, R.H., Eds.; Soil Science Society of America Book Series; Soil Science Society of America: Madison, WI, USA, 2001; pp. 961–1010. [Google Scholar]
- Sumour, M.E.; Miller, W.P. Cation Exchange Capacity and Exchange Coefficients. In Methods of Soil Analysis, Part 3, Chemical Methods; Sparks, D.L., Page, A.L., Helmke, P.A., Loeppert, R.H., Eds.; Soil Science Society of America Book Series; Soil Science Society of America: Madison, WI, USA, 2001; pp. 1201–1230. [Google Scholar]
- Bremner, J.M. Nitrogen Total. In Methods of Soil Analysis, Part 3, Chemical Methods; Sparks, D.L., Page, A.L., Helmke, P.A., Loeppert, R.H., Eds.; Soil Science Society of America Book Series; Soil Science Society of America: Madison, WI, USA, 2001; pp. 1085–1122. [Google Scholar]
- Shiou, K. Phosphorus. In Methods of Soil Analysis, Part 3, Chemical Methods; Sparks, D.L., Page, A.L., Helmke, P.A., Loeppert, R.H., Eds.; Soil Science Society of America Book Series; Soil Science Society of America: Madison, WI, USA, 2001; pp. 869–921. [Google Scholar]
- Bashour, I.I.; Sayegh, A.H. Methods of Analysis for Soils of Arid and Semi Arid Regions; FAO: Rome, Italy, 2007. [Google Scholar]
- Mandal, D.; Dadhwal, K.S.; Khola, O.P.S.; Dhyani, B.L. Adjusted T valuesfor conservation planning in Northwest Himalayas of India. J. Soil Water Conserv. 2006, 61, 391–397. [Google Scholar]
- Karlen, D.L.; Stott, D.E. A Framework for Evaluating Physical and Chemical Indicators of Soil Quality. In Defining Soil Quality for a Sustainable Environment; Doran, J.W., Ed.; No. 35. SSSA; SSSA Special Publication: Madison, WI, USA, 1994; pp. 53–72. [Google Scholar]
- Zhang, B.; Zhang, Y.; Chen, D.; White, R.E.; Li, Y. A quantitative evaluation system of soil productivity for intensive agriculture in China. Geoderma 2004, 123, 319–331. [Google Scholar] [CrossRef]
- Wu, Q.; Wang, M. A framework for risk assessment on soil erosion by water using an integrated and systematic approach. J. Hydrol. 2007, 337, 11–21. [Google Scholar] [CrossRef]
- Rahman, M.R.; Shi, Z.H.; Chongfa, C. Soil erosion hazard evaluation—An integrated use of remote sensing GIS and statistical approaches with biophysical parameters towards management strategies. Ecol. Model. 2009, 220, 1724–1734. [Google Scholar] [CrossRef]
- Burrough, P.A.; MacMillan, R.A.; Van Deursen, W. Fuzzy classification methods for determining land suitability from soil profile observations and topography. J. Soil Sci. 1992, 43, 193–210. [Google Scholar] [CrossRef]
- McBratney, A.B.; Odeh, I.O.A. Application of fuzzy sets in soil science: Fuzzy logic, fuzzy measurements, and fuzzy decisions. Geoderma 1997, 77, 85–113. [Google Scholar] [CrossRef]
- Tang, X. Fuzzy comprehensive evaluation of the productivity of purple soil in Shichuan Province, China. Adv. Soil Res. 1997, 28, 107–109. (In Chinese) [Google Scholar]
- Costantini, E.A.C.; Branquinho, C.; Nunes, A.; Schwilch, G.; Stavi, I.; Valdecantos, A.; Zucca, C. Soil indicators to assess the effectiveness of restoration strategies in dryland ecosystems. Solid Earth Discuss. 2015, 7, 3645–3687. [Google Scholar] [CrossRef]
- Muñoz-Rojas, M.; Erickson, T.E.; Martini, D.; Dixon, K.W.; Merritt, D.J. Soil physicochemical and microbiological indicators of short, medium and long term post-fire recovery in semi-arid ecosystems. Ecol. Indic. 2016, 63, 14–22. [Google Scholar] [CrossRef]
- Saaty, T.L. The Analytic Hierarchy Process; McGraw-Hill: New York, NY, USA, 1980. [Google Scholar]
- Saaty, T.L. Fundamentals of Decision Making and Priority Theory, 2nd ed.; RWS Publications: Pittsburgh, PA, USA, 2000. [Google Scholar]
- Cheng, E.W.L.; Li, H. Information Priority-Setting for Better Resource Allocation Using Analytic Hierarchy Process (AHP). Inf. Manag. Comput. Secur. 2001, 9, 61–70. [Google Scholar] [CrossRef]
- Alam, N.M.; Jana, C.; Mandal, D.; Meena, S.K.; Shrimali, S.S.; Mandal, U.; Mitra, S.; Kar, G. Applying an Analytic Hierarchy Process for Identifying Best Management Practices in Erosion Risk Areas of Northwestern Himalayas. Land 2022, 11, 832. [Google Scholar] [CrossRef]
- Shaver, T.M.; Petrson, L.R.; Ahuja, D.G.; Westfall, L.A. Surface soil physical properties after twelve years of dry land no-till management. Soil Sci. Soc. Am. J. 2002, 66, 1296–1303. [Google Scholar] [CrossRef]
- Li, Y.; Lindstrom, M.J. Evaluating soil quality-soil redistribution relationships on terraces and steep hillslope. Soil Sci. Soc. Am. J. 2001, 65, 1500–1508. [Google Scholar] [CrossRef]
- Barbosa, F.T.; Bertol, I.; Luciano, R.V.; Paz-Ferreiro, J. Sediment size and organic carbon content in runoff and soil under two crops and two seed row directions. Rev. Bras. Ciência Solo 2010, 34, 1701–1710. [Google Scholar] [CrossRef]
- Sun, S.; Zhang, G.; He, T.; Song, S.; Chu, X. Effects of Landscape Positions and Landscape Types on Soil Properties and Chlorophyll Content of Citrus in a Sloping Orchard in the Three Gorges Reservoir Area, China. Sustainability 2021, 13, 4288. [Google Scholar] [CrossRef]
- Sojka, R.E.; Upchurch, D.R. Reservations regarding the soil quality concept. Soil Sci. Soc. Am. J. 1999, 63, 1039–1054. [Google Scholar] [CrossRef]
- Seybold, C.A.; Herrick, J.E.; Brejda, J.J. Soil resilience, a fundamental component of soil quality. Soil Sci. 1999, 164, 224–234. [Google Scholar] [CrossRef]
- Islam, K.R.; Weil, R.R. Land-use effects on soil quality in a tropical forest ecosystem of Bangladesh. Agric. Ecosyst. Environ. 2000, 7, 9–16. [Google Scholar] [CrossRef]
- Motavalli, P.D.; McConnell, J. Land use and soil nitrogen status in a tropical pacific island environment. J. Environ. Qual. 1998, 1, 119–123. [Google Scholar] [CrossRef]
- Riezebos, H.T.; Loerts, A.C. Influence of land use change and tillage practice on soil organic matter in southern Brazil and eastern Paraguay. Soil Tillage Res. 1998, 49, 271–273. [Google Scholar] [CrossRef]
- Gracia-Oliva, F.; Sanford, R.L., Jr.; Kelly, E. Effects of slash and burn management on soil aggregate organic C and N in a tropical deciduous forest. Geoderma 1999, 88, 1–12. [Google Scholar] [CrossRef]
- Wauriu, M.; Lal, R. Soil organic carbon in relation to cultivation and topsoil removal on sloping lands of Kolombangara. Solomon Islands. Soil Tillage Res. 2003, 70, 19–27. [Google Scholar] [CrossRef]
- Lal, R. A soil suitability guide for different tillage systems in the tropics. Soil Tillage Res. 1985, 5, 179–196. [Google Scholar] [CrossRef]
- Lal, R. Urban Ecosystems and Climate Change. In Carbon Sequestration in Urban Ecosystems; Lal, R., Augustin, B., Eds.; Springer: Dordrecht, The Netherlands, 2012. [Google Scholar]
- Cihacek, L.J.; Swan, J.B. Effects of erosion on soil chemical properties in the north central region of the United States. J. Soil Water Conserv. 1994, 49, 259–265. [Google Scholar]
- Saragih, B. Farm Modeling to Increase Farmer’s Income in the Citanduy Watershed, Indonesia; Farm Management Notes for Asia and the Fareast Maliwan Mansion; FAO: Rome, Italy, 1989. [Google Scholar]
- Lal, R.; Eckert, D.J.; Fausey, N.R.; Edwards, W.M. Conservation Tillage in Sustainable Agriculture. In Sustainable Agricultural System; Edwards, C.A., Lal, R., Madden, P., Miller, R.H., House, G., Eds.; Soil and Water Conservation Society: Ankeny, IA, USA, 1990. [Google Scholar]
- Kaihura, F.B.S.; Kullaya, I.K.; Kilasara, M.; Aune, J.B.; Singh, B.R.; Lal, R. Soil quality effects of accelerated erosion and management systems in three eco-regions of Tanzania. Soil Tillage Res. 1999, 53, 59–70. [Google Scholar] [CrossRef]
- Bünemann, E.K.; Bongiorno, G.; Bai, Z.G.; de Goede, R.; Mäder, P.; Sukkel, W.; Brussaard, L. Soil quality—A review. Soil Biol. Biochem. 2018, 120, 105–125. [Google Scholar] [CrossRef]
- Sugino, T.; Hutagaol, P. Policy Framework for Poverty Reduction by Realizing Sustainable Diversified Agriculture Through the Development of Secondary Crops; Palawija News The UNESCAR-CAPSA Newsletter; UNESCAP-CAPSA Publication Section: Bogor, Indonesia, 2004; pp. 1–6. [Google Scholar]
- Ashworth, A.J.; Allen, F.L.; Saxton, A.M.; Tyler, D.D. Long-term corn yield impacted by cropping rotations and bio-covers under no-tillage. Agron. J. 2016, 108, 1495–1502. [Google Scholar] [CrossRef]
- Nosrati, K.; Collins, A.L. A soil quality index for evaluation of degradation under land use and soil erosion categories in a small mountainous catchment, Iran. J. Mt. Sci. 2019, 16, 2577–2590. [Google Scholar] [CrossRef]


Disclaimer/Publisher’s Note: The statements, opinions and data contained in all publications are solely those of the individual author(s) and contributor(s) and not of MDPI and/or the editor(s). MDPI and/or the editor(s) disclaim responsibility for any injury to people or property resulting from any ideas, methods, instructions or products referred to in the content. |
© 2023 by the authors. Licensee MDPI, Basel, Switzerland. This article is an open access article distributed under the terms and conditions of the Creative Commons Attribution (CC BY) license (https://creativecommons.org/licenses/by/4.0/).