Article

Biomass–Coal Hybrid Fuel: A Route to Net-Zero Iron Ore Sintering

1
Chemistry Engineering Materials Environment Group (CEMEG), Faculty of Science and Engineering, Swansea University, Swansea SA1 8EN, UK
2
Tata Steel UK Ltd., Port Talbot, Swansea SA13 2NG, UK
*
Author to whom correspondence should be addressed.
Sustainability 2023, 15(6), 5495; https://doi.org/10.3390/su15065495
Submission received: 22 February 2023 / Revised: 14 March 2023 / Accepted: 18 March 2023 / Published: 21 March 2023
(This article belongs to the Section Sustainable Materials)

Abstract

:
The global steel industry uses fossil fuels to produce millions of tonnes of iron ore sinter each year. Sintering is an energy-intensive process that fuses iron ore and flux to produce material that balances a high mechanical strength at a sufficient particle size to ensure a macroporous burden in the blast furnace to enable rapid gas flow. As significant CO2 greenhouse emissions are emitted, the defossilisation of these CO2 emissions is vital to net-zero carbon targets. Two iterations of a new biomass–coal hybrid fuel (ecoke®(A) and ecoke®(B)) were compared with coke breeze and an anthracite coal using oxygen bomb calorimetry, simultaneous thermal analysis (STA) combining thermogravimetry and differential scanning calorimetry, and isoconversional kinetic modelling and pyrolysis–GCMS to study the volatile matter. The calorific values of both ecoke®(A) and (B) were marginally higher than that of the coke breeze: 27.9 MJ/kg and 27.8 MJ/kg, respectively, compared with 26.5 MJ/kg for the coke breeze. A proximate analysis revealed both ecoke® samples to have higher volatile matter contents (ca. 12–13%) than the coke breeze (7.4%), but less than the anthracite coal (ca. 14%). The thermogravimetric analysis of the burnout kinetics of the fuels heated up to 1000 °C, at heating rates from 5 to 25 °C/min, showed that that the coke breeze and anthracite coal had higher ignition and burnout temperatures than the ecoke® samples. Kinetic analysis using the Freidman and Ozawa methods found that the ecoke® samples showed comparable maximum mass loss rates to the coke breeze but lower activation energies. From these results, both ecoke® samples have the potential to replace some of the coke breeze in the sintering process or EAF processes to help achieve net zero by offsetting up to 30% of the CO2 emissions.

1. Introduction

Solid fuels have been used to process and smelt iron and steel for centuries [1], but there is an ever-increasing demand for blast furnace steelmaking to decarbonise [2]. Therefore, sustainable fuels need to be developed and tested to make a net-zero steelmaking process a reality [3,4,5]. Nicol et al. [6] produced an in-depth review of work investigating the formation of the structure of sinter. They found that sustained temperatures of over 1100 °C were required to form the strong but reduceable structure that performs well in the blast furnace. In their work, Lu et al. [7] compared charcoal and coke breezes as sintering fuels by substituting 25, 50 and 100% of the coke with charcoal. The data showed a need to increase the overall fuel rate when substituting charcoal and found that the coke breeze produced a slightly stronger sinter. Although the thermocouples recorded a similar maximum temperature to 100% coke breeze runs, the sinter FeO levels indicated a lower maximum temperature. This was thought to be due to the lower packing density in the bed, leading to more heat being removed by the flue gas.
Therefore, there are a large number of variables to consider when selecting a fuel to form high-quality sinter. However, firstly, a fuel must be known to release sufficient energy to achieve the required temperatures. In this context, thermogravimetry is a highly developed technique to characterise fuels, with 8100 recent citations related to fuel production and characterisation using thermogravimetry [8,9]. The kinetic analysis of thermogravimetric analysis (TGA) data calculates the parameters: the activation energy (Ea) and pre-exponential factor (A). Traditionally, this has been performed by fitting the data to a predefined model, which is known as the model-fitting method. Vyazovkin and Wight [10] found that this method works well for isothermal data but produces inaccurate values from nonisothermal data. This has led to the development of the isoconversional method, which does not assume a reaction model. This removes any errors occurring from the assumption of the wrong model. Additionally, due to not assuming the consistency of the Eact and A, a plot of the change in the Eact and A versus conversion can be made [11].
Looking at the thermal analysis of alternate fuels using thermogravimetry, Gerassimidou et al. [12] reviewed the literature for plastics and biomass, showing that the components decomposed at temperatures of 200–580 °C and 200–400 °C, respectively, with corresponding peak derivative mass loss (dTG) temperatures of 420–490 °C and 355–370 °C, respectively. Skreiberg et al. [13] investigated the combustion of wood, demolition wood, coffee grounds and paper, as well as blends of each, at heating rates of 5, 25 and 100 °C/min up to 900 °C. They observed mass loss due to lignin decomposition and char oxidation occurring at a maximum temperature of 490 °C. Yorulmaz and Atimtay [14] investigated the combustion and kinetic properties of untreated and treated pine wood at heating rates of 10, 20 and 30 °C/min. They found that the peak mass loss occurred at 358–371 °C, and that the required activation energy was 123–136 kJ/mol. Ni et al. [15] investigated charcoal made from 70% bamboo and 30% wood in a TGA, and they found that, depending on the heating rates for each of the three stages (preheating, primary pyrolysis and carbonisation) of pyrolysis, the produced charcoal had differing combustion and kinetic properties. For heating rates of 1, 3 and 5 °C/min for primary pyrolysis, the peak mass loss temperatures and average activation energies ranged from 480 to 500 °C and from 139.6 to 133.1 kJ/mol, respectively. The minimum activation energy for the optimisation of each stage was 98.8 kJ/mol at heating rates of 5 °C/min, 1 °C/min and 5 °C/min, respectively. In contrast to this, Azam et al. [16] found that the peak mass loss for a low-rank coal from the Punjab province of Pakistan occurred at 562–610 °C with solid waste, consisting of mostly (56%) biodegradable food waste, being lower at 301–329 °C. Following on from their analysis of combustion temperatures, the isoconversional methods Flynn–Wall–Ozawa, Friedman, Kissinger–Akahira–Sunnose and Vyazovkin were used to find the activation energy. The Friedman method was found to be inconsistent with the rest of the methods for coal, but it was in line with the others for waste. The values of the activation energy were ~155 kJ/mol for the coal. Overall, the increasing coalification of materials from biomass and waste through charcoal to coal results in a fuel with not only higher combustion temperatures, but also equally higher activation energies. Sintering requires a high temperature to produce sufficient melt, but large activation energies result in wasted energy igniting the fuel and a slower burn. The move to increased biomass, charcoal addition will help offset carbon emissions, reduce the ignition energy and increase productivity.
The central issue of decarbonisation is that coal is the product of an ancient (or “fossil”) biomass that has undergone coalification on a geological timescale. So how can this be replicated without taking millions of years [17]? A study by Jiang et al. [18] examined increasing coal ranks with X-ray diffraction (XRD), Fourier transform infrared (FTIR) spectroscopy and Raman spectroscopy. They found that higher-ranked coal mined at greater depths had greater numbers of aromatic rings, fewer aliphatic side chains and a more ordered coal structure, resulting in greater fixed carbon and lower volatile matter. Work has also shown that biomass has higher oxygen, nitrogen and hydrogen contents, and that these elements are usually associated with the volatile matter content [19], which is undesirable in blast furnace ironmaking processes. However, volatile matter can be driven off using high temperatures under an inert atmosphere in processes such as pyrolysis and torrefaction. For example, Bridgeman et al. [20] found that the torrefaction of biomass reduced the proportion of oxygen and hydrogen and increased the temperature at which volatiles were released during combustion. Yang et al. [21] found that the pyrolysis of lignin at 600 °C reduced the O/C and H/C ratios from 0.41 to 0.18 and from 1.28 to 0.36, respectively, indicating the formation of a more conjugated ring structure, similar to that found in coal.
In this paper, the calorific values and isoconversional kinetics of four potential ironmaking sinter fuels were compared within the context of partial fuel switching fossil fuel carbon for biomass-related carbon. As such, the thermodynamic and kinetic properties of coke breeze were characterised as a baseline of the current effective sintering fuel. These were compared with those of an anthracite coal (Coal A) and two iterations of a novel 30% biomass–70% coal hybrid, ecoke®(A) and (B), which have not yet been fully used in the industry. Thus, we believe that this will be the first academic paper to reference this new material. The current industrial interest in ecoke® is due to its potential application to electric arc furnace steelmaking as a fossil fuel carbon alternative. It was found to have the potential to displace the currently used ancient carbon being added to the process, thereby reducing the process’s carbon footprint by 30% [22]. As the industry moves to decarbonise, tax incentives to offset carbon emissions encourage biomass use, and increased industrial interests pave the way for new applications, such as iron ore sintering and further fossil carbon reduction.

2. Materials and Methods

The coal–biomass hybrids ecoke®(A) and ecoke®(B) were supplied by CPL Industries, Immingham (https://cplindustries.co.uk/ (accessed on 13 March 2023)), and they were compared with fossil fuels supplied by the Tata Steel integrated steel works at Port Talbot, South Wales: namely, a higher-volatile-matter (VM) low-ash coke breeze (PT breeze) and an anthracite coal (Coal A). Coke breeze is the <5 mm fraction from the coking process, in which raw anthracite coals, such as Coal A, are subjected to high temperatures under an inert atmosphere to remove volatile matter. Approximately 1.5 kg of each was sampled from the Port Talbot stockpiles and combined to provide representative samples. Both ecoke®(A) and ecoke®(B) contain 30% (w/w) biomass material, but they differ in the binder used to manufacture them into briquettes. Samples of ecoke®(A) and (B) briquettes were taken directly from the production line. Multiple briquettes were used to provide representative samples.
Sintering fuels are added on a dry basis, with the moisture content carefully controlled; therefore, the calorific values were also measured on a dry basis. Thus, all the bomb calorimetry samples were dried at 100 °C in a Genlab MINO drying oven, crushed using a pestle and mortar and finally passed through a 1mm screen so as to achieve full combustion while avoiding displacement during ignition. For the TGA experiments, dry samples with a small particle size were needed to minimize the thermal lag [23]. Therefore, after curing in the oven at 100 °C, the TGA samples were also ball-milled in a Retsch planetary ball mill at 350 rpm for 1 min and passed through a 50 μm screen.

2.1. Thermal Analysis

Each preground sample (ca. 10 mg) was loaded into a 90 μL alumina crucible and placed into a LABSYS evo STA 1600 (Setaram). A second empty crucible within the STA enabled the measurement of the heat flow within the sample. The STA heated the samples to 110 °C to ensure dryness, after which the temperature was ramped to 1000 °C, at heating rates of 5, 10, 15, 20 and 25 °C/min in an air atmosphere, to measure the burnout kinetics. The combustion temperatures were found using an academically accepted [24,25,26] graphical method (Figure 1) that relates the mass loss (TG) and derivative mass loss (dTG) signals. A vertical line (L1) was drawn at the peak of the dTG signal until it intersected the TGA signal. A tangential line (L2) to the TGA signal was then drawn from this point. After this, two horizontal lines were drawn parallel to the maxima (L3) and minima (L4) of the TG. The intersection of L1 and L2 is the temperature at which the maximum rate of mass loss occurs (T1), the intersection of L2 and L3 is the burnout temperature (Tb) and the intersection of L2 and L4 is the ignition temperature (Ti).
The conversion of each fuel was standardised using Equation (1) to enable an easy comparison of the combustion temperatures and rates of reaction, where m0 is the initial mass, mT is the mass at temperature (T) and m is the final mass [27]:
m 0 m T m 0 m
To assess the overall ignition and combustion characteristics and enable a clear comparison of each fuel, two indexes were used: the comprehensive combustion characteristic index (S) and the ignition index (C). The calculations of these indexes are as shown in Equations (2) and (3), respectively, where Rmax is the maximum rate of reaction, Rav is the average rate of reaction, Ti is the ignition temperature and Tb is the burnout temperature [28].
S = R m a x R a v T i 2 T b
C = R m a x T i 2
Kinetic analysis is important, as the ignition time can be optimised based on the activation energy, thus increasing the efficiency of the process. The kinetic parameters were calculated using AKTS thermokinetics software from the mass loss (TG) and differential mass loss (dTG) data according to the method described in [11]. The model-free differential isoconversional methods of Friedman and Ozawa–Flynn–Wall were used, as they are reliable methods of calculating the activation energy and enable analysis over the entire range of conversion [10]. These model-free differential isoconversional methods calculated the kinetic parameters using the Arrhenius Equation (4), where α is the fractional conversion, β is the heating rate, A is the pre-exponential factor, Eact is the activation energy, R is the universal gas constant and T is the temperature at time (t). The basis of the differential isoconversional method is that the kinetic parameters are independent of the heating rate:
d α d t = A e x p E a c t R T t f α
The model-free methods used did not assume a reaction model or consistent value for the Eact or A, but instead manipulated Equation (4) to calculate the kinetic parameters [16]. For example, the Friedman method [29] plotted ln(dα/dt) against 1/T for a set of heating rates (β). At each conversion, a straight line was plotted with a gradient of Eact/R and an intercept of A, as per Equation (5). The Flynn–Wall–Ozawa method [30,31] plotted ln(β) against 1/T for different heating rates, as per Equation (6). Using this plot, straight lines at a constant α, gave the activation energy (the Eact from the gradient and the Arrhenius constant (A) from the intercept):
l n [ β i d α d t α , i ] = l n E a c t R T α , i f α A
ln β i = l n A α E a c t R g ( α ) 5.331 1.0516 E a c t R T α i

2.2. Calorific Values

Gross calorific values (3 replicates) were measured on a Model 6100 Compensated Jacket Calorimeter (Parr Instruments Ltd., Moline, IL, USA). Dry ground samples (0.25 g) were added to the bomb reactor with 5 mL of deionised water, and 2 L of tap water was added to the jacket. The bomb was sealed and pressurised with 400 psi of oxygen prior to ignition.

2.3. Proximate Analysis

Proximate analyses were measured on a LABSYS evo STA 1600 (Setaram) using a prepared sample (ca. 10 mg). The temperature was ramped to 100 °C at 5 °C/min and held for 5 min. Then, the temperature was ramped to 900 °C at 40 °C/min and held for 30 min. The values of volatile matter (VM), fixed carbon (FC) and ash (A) were calculated from the mass loss and retained mass [32]. A standard method of calculating the proximate (ISO 17246:2010) was also used [33]. To determine volatiles, a crushed sample dried at 110 °C was weighed and placed into a furnace preheated to 900 °C in the absence of air for 7 min, and the sample was then taken out and weighed again. Ash was found by placing a fresh sample in a furnace at room temperature, heating to 500 °C in air over 60 min and holding for 30 min, before proceeding to heat to 815 °C and holding for 60 min, and after cooling, the sample was then weighed. Fixed carbon was found throughout the calculation from the percentages of ash and volatiles. Table 1 shows the proximate analysis of the different fuels. The data show the highest fixed carbon and lowest volatile matter for the coke breeze. This is in line with the method of coke production that pyrolyzes coal blends in the absence of air to drive off volatile matter as coke oven gas. The anthracite coal (Coal A) showed the lowest fixed carbon, and the highest volatile matter and ash. These are inherent to the material itself, which had not undergone any processing. Both ecoke®(A) and ecoke®(B) are two new fuels that contain a 70:30 (w:w) mix of coal and thermally upgraded secondary biomass. Secondary biomass has many different sources, but one of the most abundant is forestry residues, such as bark and sawdust [34]. Both iterations of ecoke® have similar values of fixed carbon, volatile matter and ash. Interestingly, while their fixed carbon and ash contents are slightly lower than those of coke breeze, the volatile matter is higher, the potential impacts of which will be discussed later. Whilst the coal component of ecoke® will make its own contribution to these values, the processing of the biomass component is likely to drive off volatile matter and break down the biopolymers, such as lignin, forming conjugated ring structures, such as those contained in coke [21].

2.4. Volatile Matter Analysis

The volatile matter of ecoke®(A) and (B) was characterized and compared with that of PT breeze, as a fossil fuel control sample, using a CDS 5200 HPR Pyroprobe (Analytix Ltd., Tyne & Wear, UK) connected to an HP6890 GC (Agilent, Craven Arms, UK) and a Pegasus BT time-of-flight mass spectrometer (Leco, Stockport, UK) in a hyphenated GC–TOFMS. This is denoted as py-GCMS (pyrolysis GCMS) in this paper. Ground TGA samples were loaded into quartz pyrolysis tubes packed at both ends with silica wool and placed inside the platinum coil within the pyroprobe. The Pt coil was heated at a rate of 20 °C/ms to 800 °C, almost instantaneously pyrolysing the samples (i.e., within 40 ms) in an atmosphere of 99.999% helium. A temperature of 800 °C was used as proximate analysis indicated the release of all volatile matter before this temperature. The produced gas was trapped before passing through the GC–TOFMS to separate the produced volatiles into distinct peaks. The chromatographs and associated mass spectral data were then analysed by Leeco ChromaTOF [35] software, which compared the MS data to the NIST mass spectral database to identify the chemical species.

3. Results

3.1. Calorific Values

Table 1 shows the calorific values (CV) measured by bomb calorimetry for the various samples. The anthracite coal (Coal A) showed the highest CV fuel, with an average value of 29.9 MJ/kg. The ecoke®(A) and ecoke®(B) performed similarly, with values of 27.8 MJ/kg and 27.9 MJ/kg, respectively, which were similar but slightly higher than the value for the PT coke breeze (26.5 MJ/kg). These values for ecoke®(A) and ecoke®(B) not only reflect the combination of coal and thermally processed biomass, but they are also promising in the context of the use of this material as a sinter fuel because significant thermal energy is required to heat the raw materials to temperatures in excess of 1100 °C to fuse them into effective blast furnace sinter. Additionally, the presence of 30% biomass in ecoke®(A) and (B) is attractive because it offers the potential to offset fossil fuel emissions from this process by 30%, which is a significant step towards net-zero iron ore sintering.
The ideal here would be the direct use of the biomass without thermal processing because the only CO2 emissions that are not reabsorbed through regrowth would be those from harvesting and transport. However, bomb calorimetry tests of three hardwoods (teak, oak and walnut) show calorific values in a range of 17.5–18.5 MJ/kg (Table A2), which are much lower values than those of both ecoke® samples, which contain thermally processed biomass. Demirbaş reported that the CV of biomass correlates with its lignin content, and therefore biomass sources with higher lignin contents, such as wood, are preferred [36]. In addition to this, the volatile content is known to be higher in raw biomass, which likely reduces the combustion temperatures. While this could reduce the sintering efficiency, an additional issue is that unburnt volatiles could pose a safety risk if they recondense in the emission management system, potentially leading to fires.
Figure 2 shows the heat flow, measured between an empty reference crucible and the crucible containing the sample, from the same series of samples measured across the main combustion process at different ramp rates (from 5 to 25 °C/min). Firstly, there is a significant difference in the energy values measured by the STA method (1.8–3.5 MJ/kg) compared with those measured by bomb calorimetry. In part, this can be explained by the fact that the STA values relate to only the most rapid part of combustion, whilst the bomb calorimetry includes the whole process. However, it also reflects the fact that STA measures the heat released from the sample using a thermocouple located beneath the alumina sample holder, whereas the bomb calorimeter is entirely surrounded by a water-filled jacket, which means that every photon of infrared radiation (i.e., all the heat) released contributes to the CV data. As such, whilst STA data are very useful for understanding which thermal ranges heat is released in, bomb calorimetry provides more accurate data on the total heat released. Alternatively, if the quantum yield of the infrared radiation harvesting within the bomb calorimeter is close to 100% because of the high efficiency of the heat absorption of water, then the quantum yield within the STA is somewhere between 10 and 15%. The efficiency of the heat absorption by water relates to the change in the dipoles of the water molecules during the transition, which makes this a high-probability process. This is also why water is such an efficient greenhouse gas. Interestingly, Figure 2 shows lower heat flow for the anthracite sample at 15–25 °C/min ramp rates, despite having the highest CV. The increase in the heat flow observed with increasing ramp rate is normal for DSC-based measurements, in which the heat-flow measurement is based on the differences in temperature between the sample and reference, which are both held in the same furnace. Thus, a faster furnace ramp rate heats the sample faster and, therefore, any exothermic or endothermic event takes place more rapidly, which creates a larger temperature difference between the sample and reference, resulting in a larger heat flow. A combination of heat flow and dTG can be seen in Figure A1.

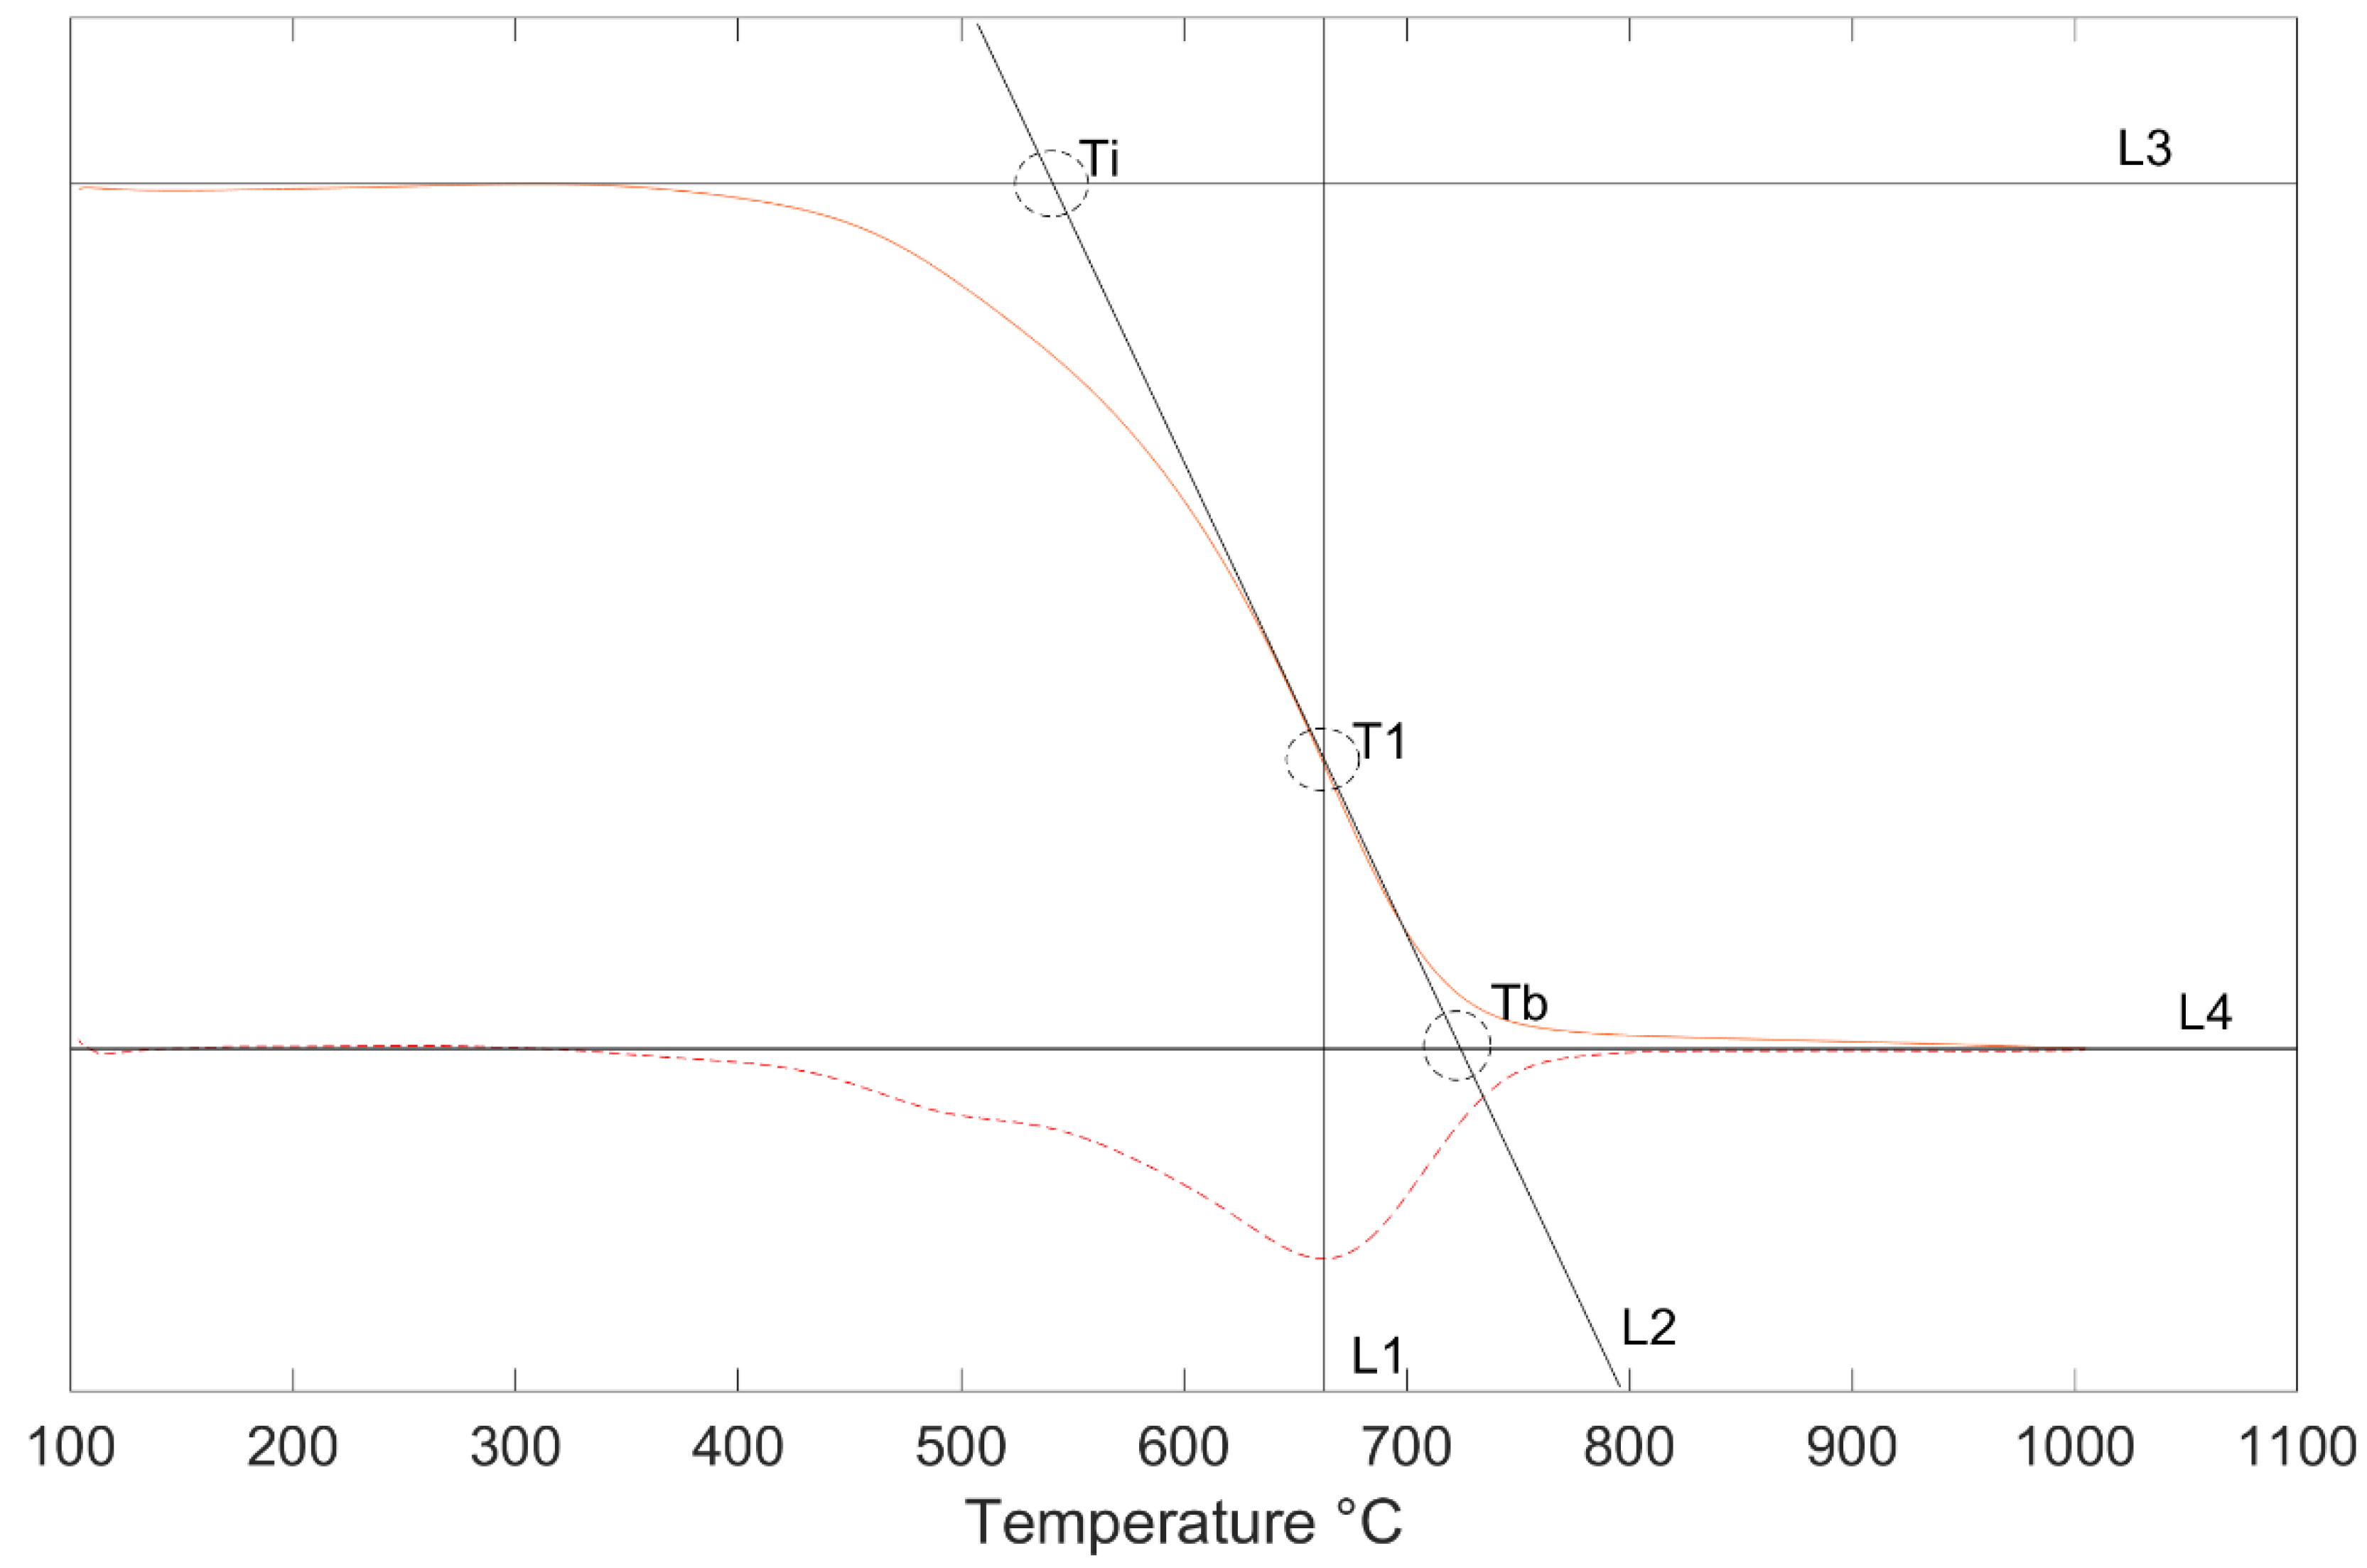
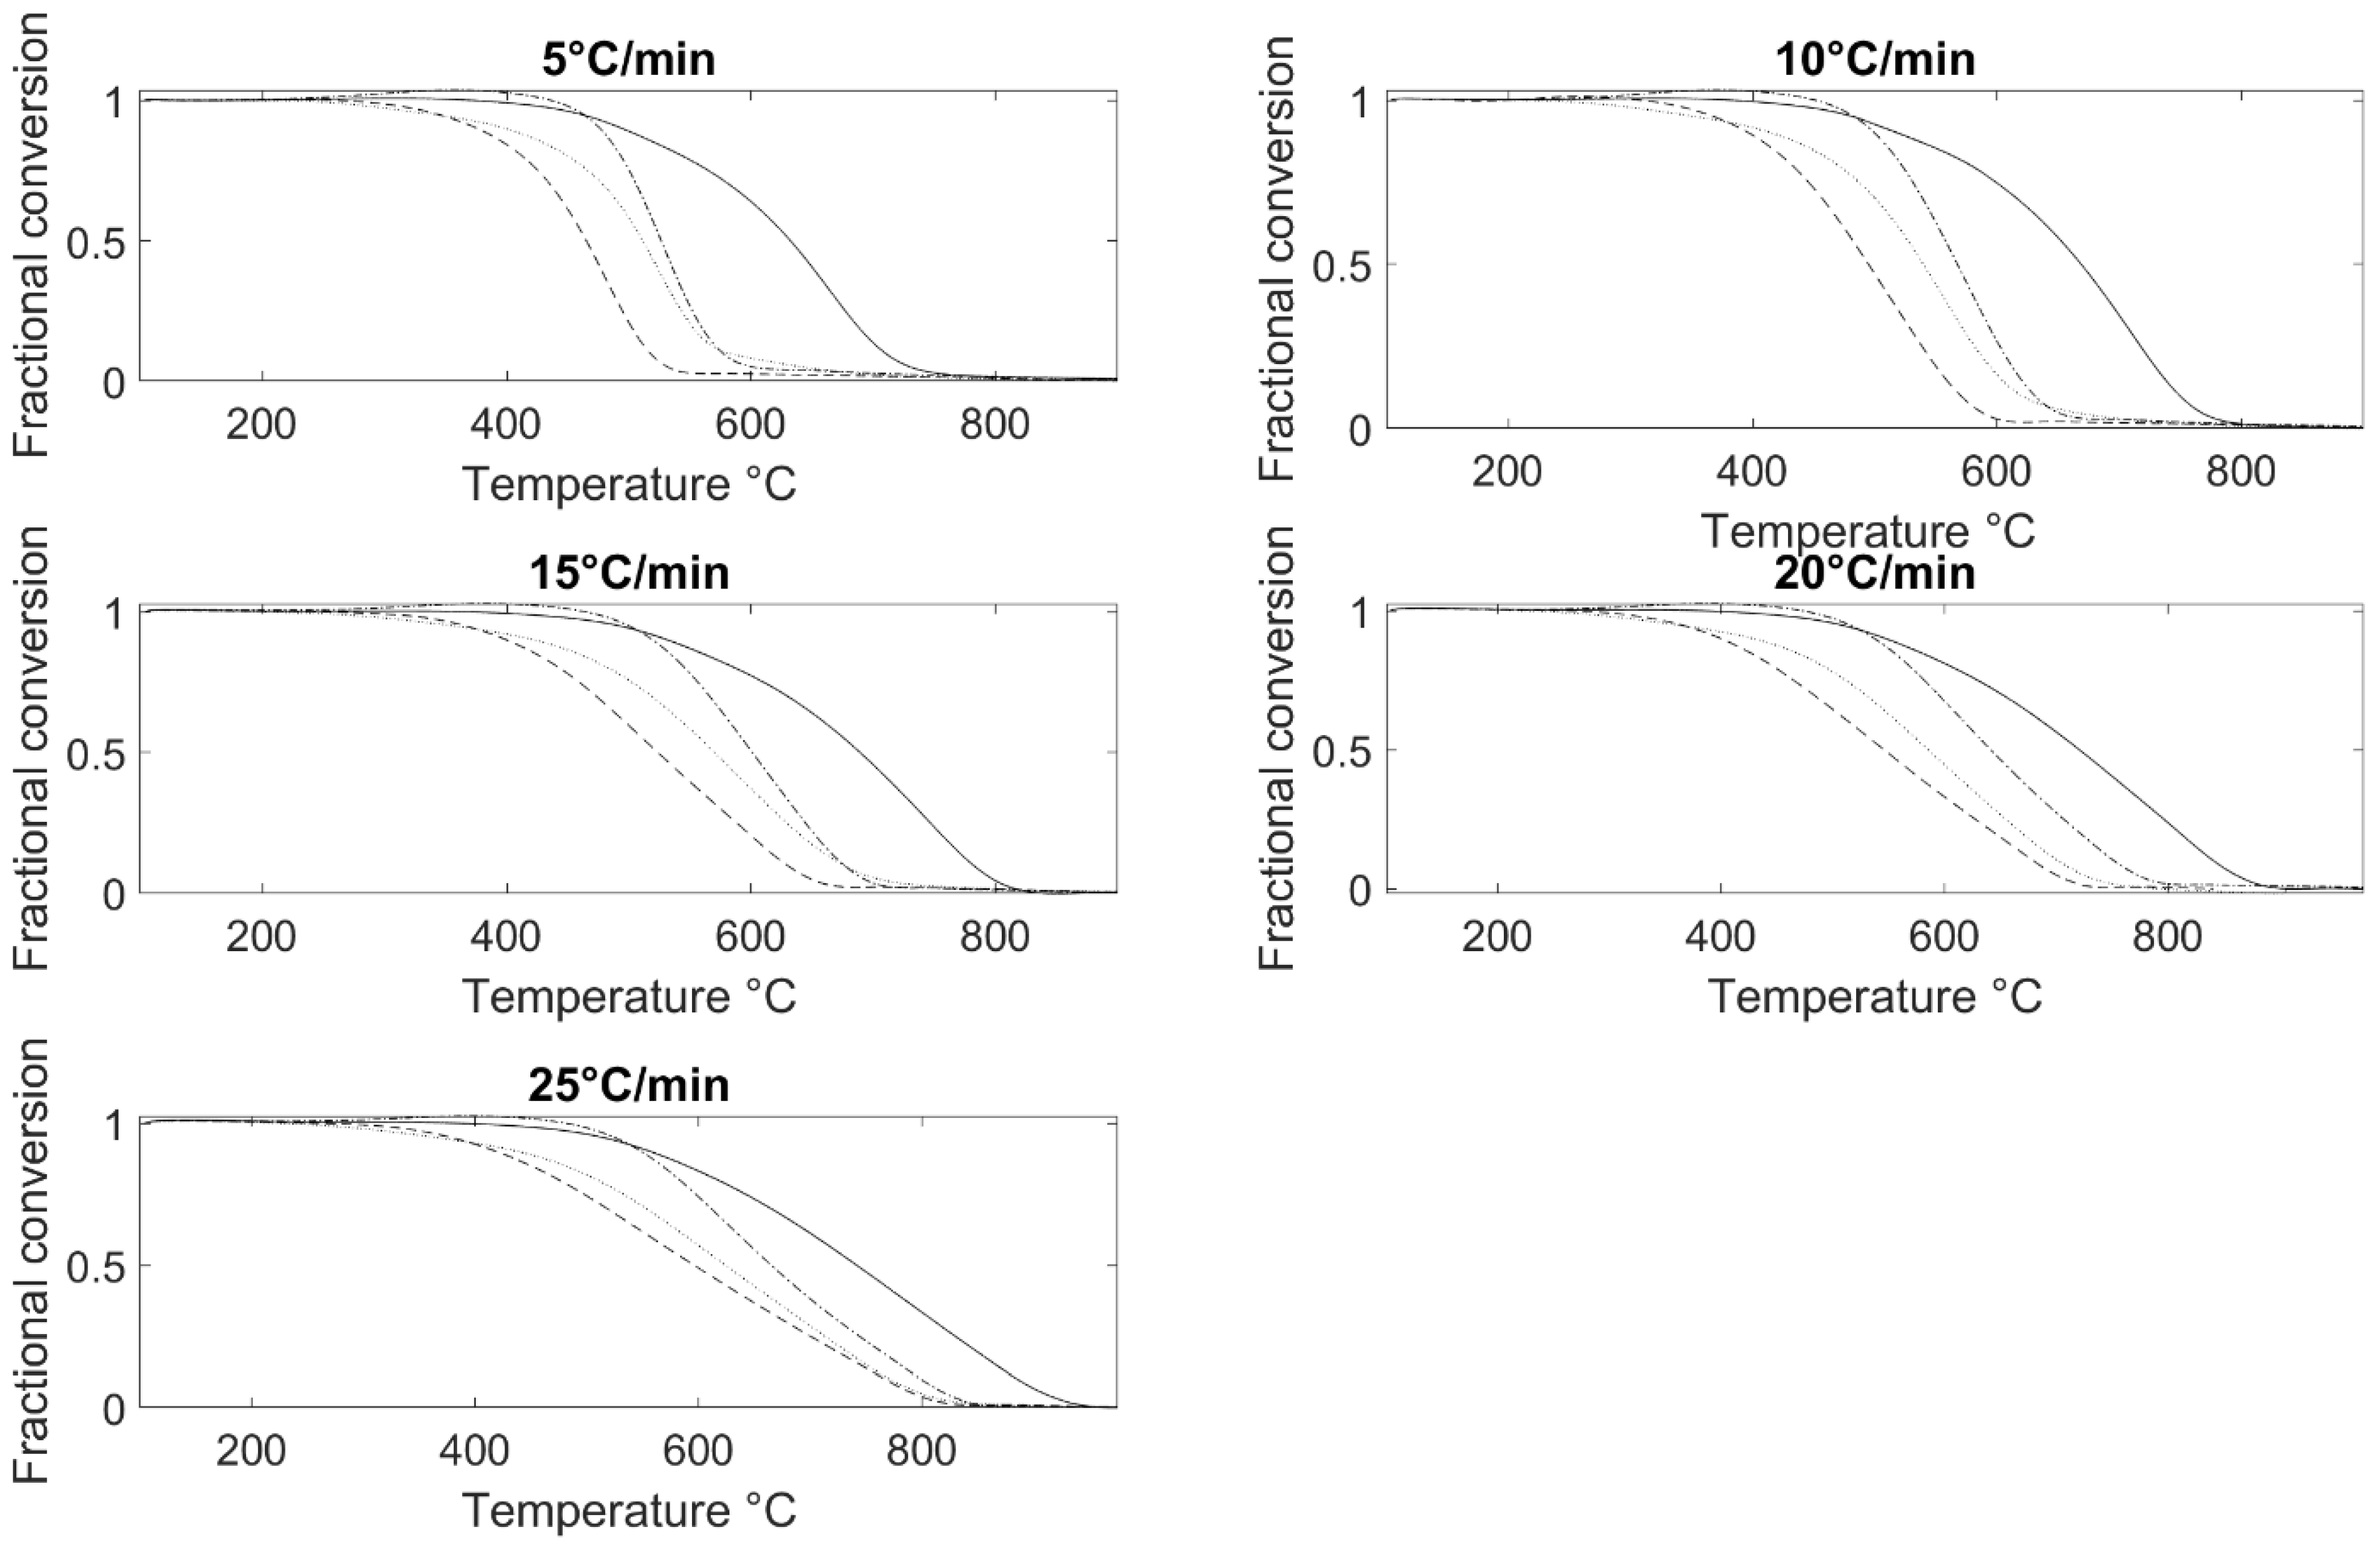
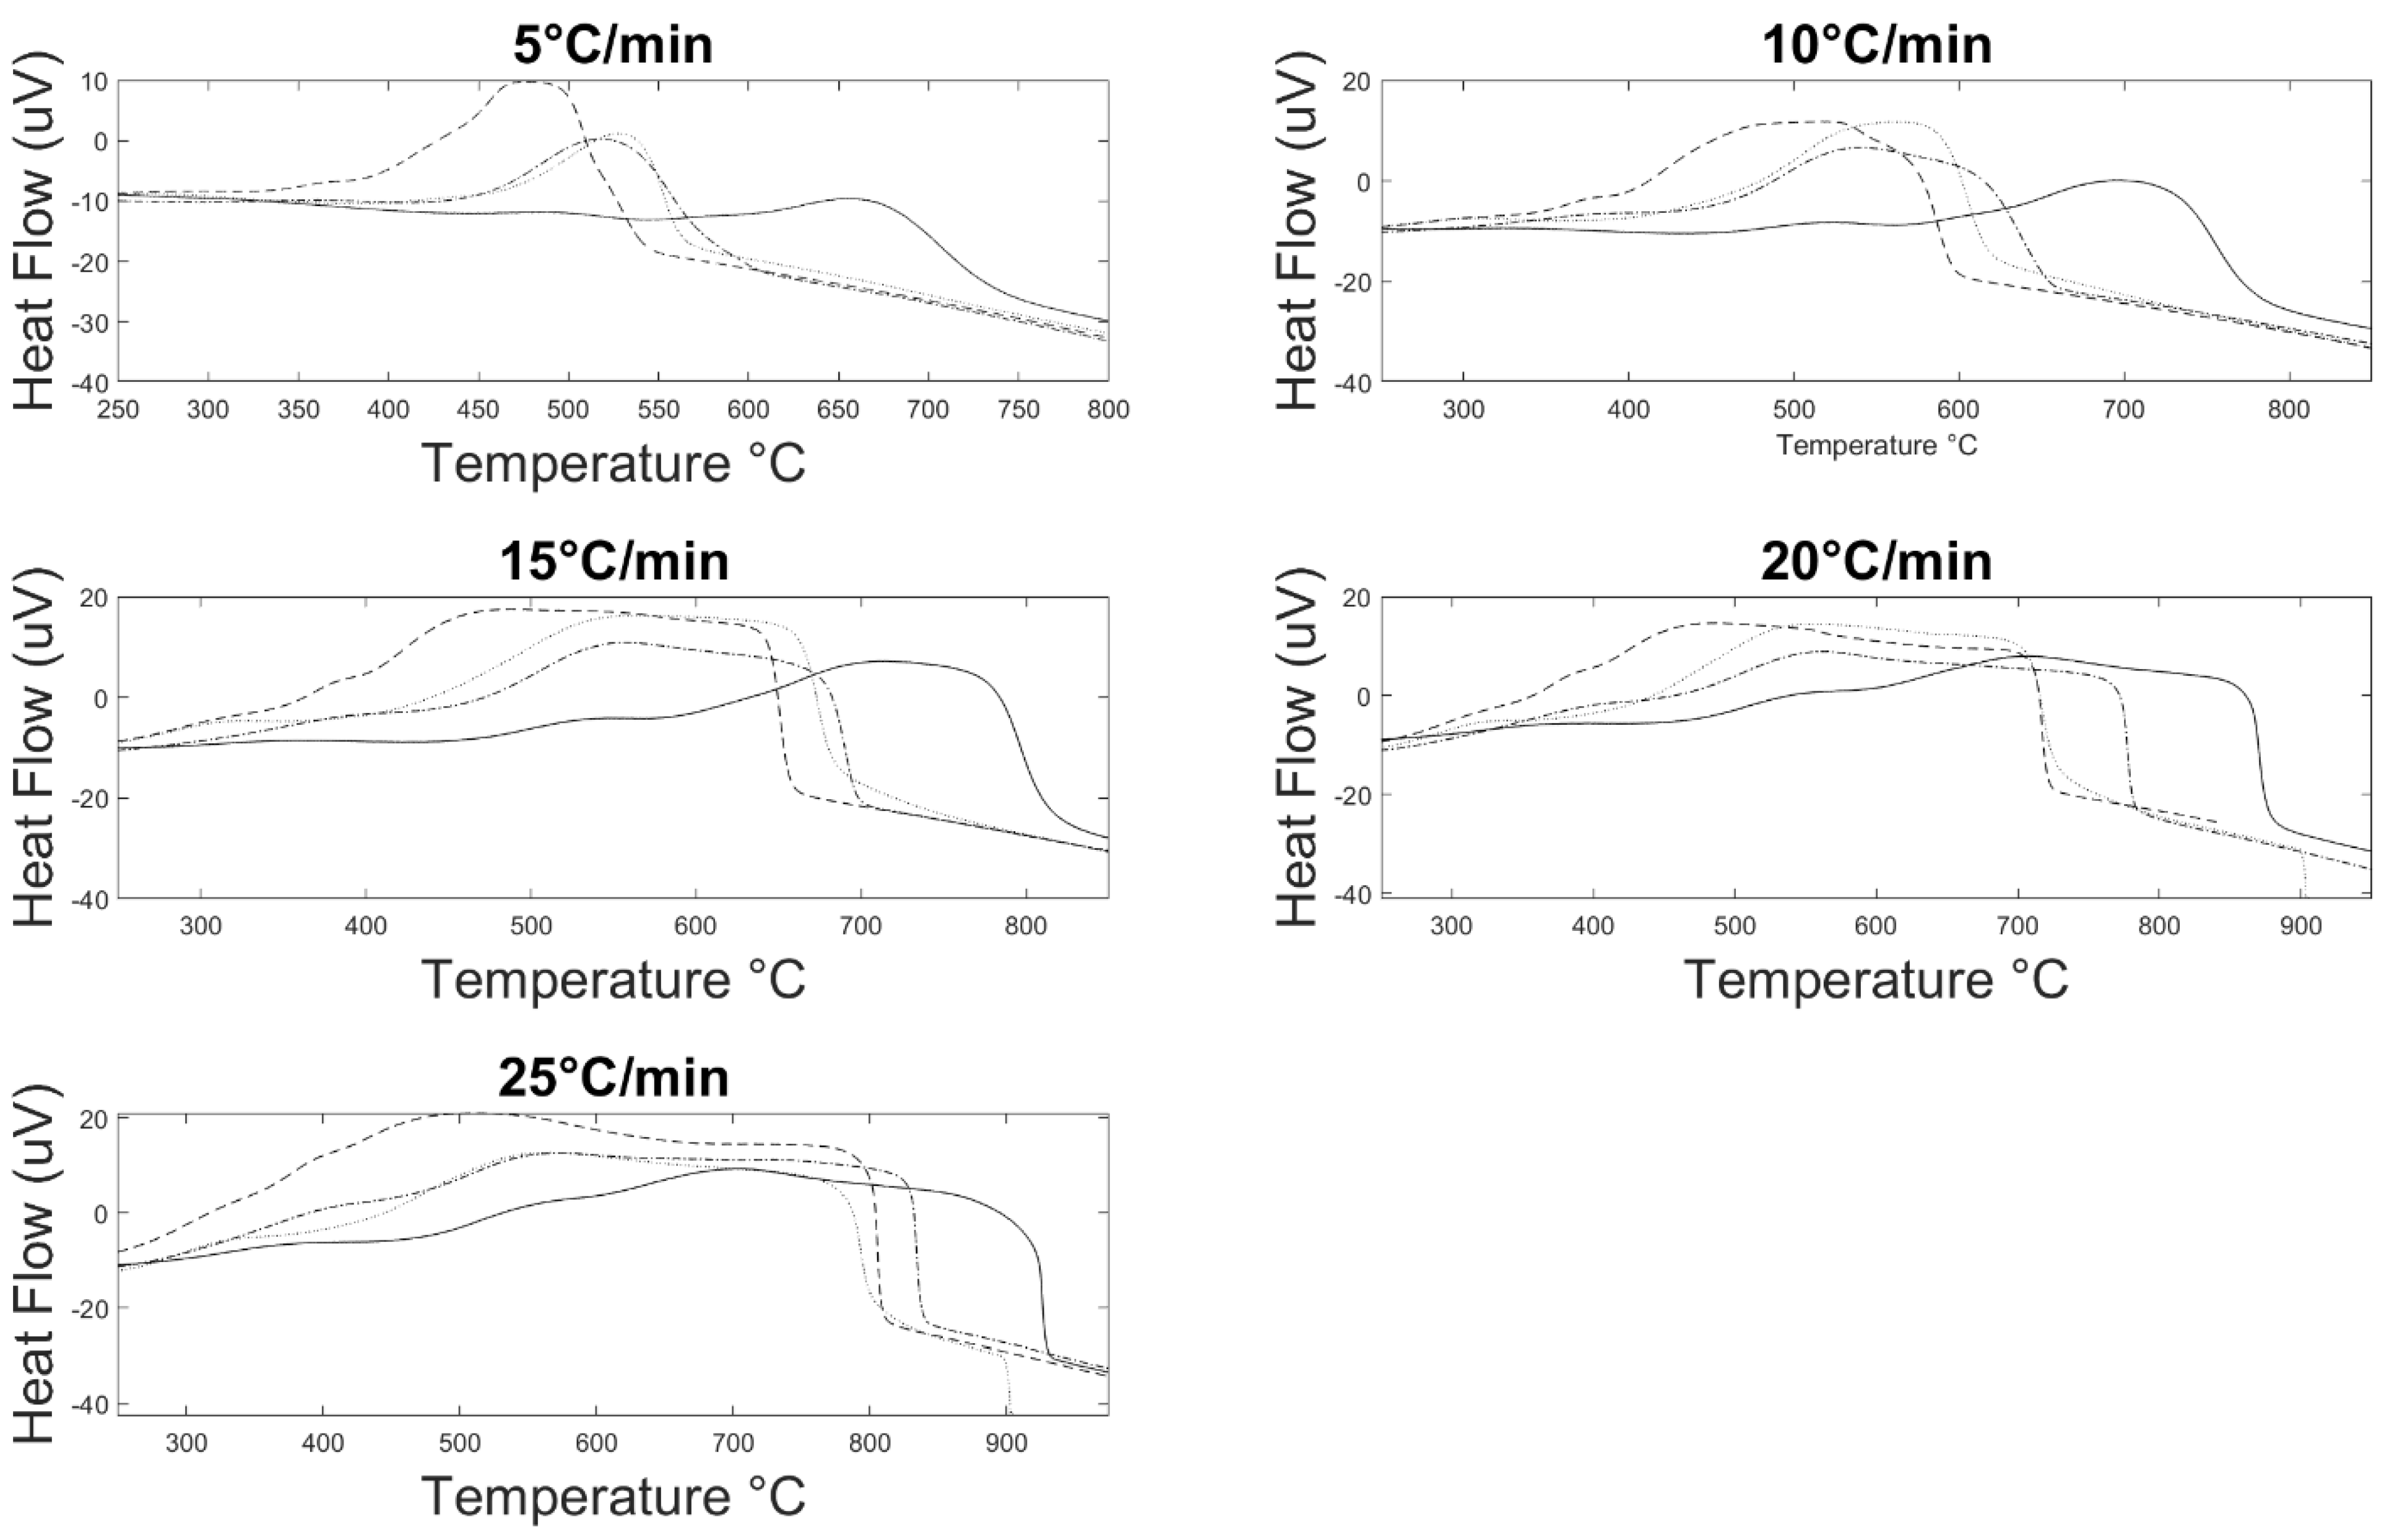
3.2. Burnout Kinetics

Figure 3, Figure 4 and Figure 5 show the plots of conversion, dTG and heat flow versus temperature for each of the fuels at 5, 10, 15, 20 and 25 °C/min, respectively. Looking first at the ignition temperatures (Ti) in Table 2, the analysis of the TGA plots using the graphical method shown in the methods section shows that PT breeze required a temperature in the range of 550–580 °C to ignite, whereas Coal A ignited in the range of 500–525 °C. By comparison, ecoke®(A) and ecoke®(B) ignited between 390 and 405 °C and between 450 and 462 °C, respectively. The temperature (T1) at which the maximum rate of combustion (Rmax) occurred followed a broadly similar trend, with the highest T1 values for PT breeze (i.e., 662 °C at 5 °C/min) and the lowest T1 values for ecoke®(A) (i.e., 478 °C at 5 °C/min), but for T1, ecoke®(B) and Coal A showed more similar values (518 and 525 °C, respectively). Analysis of the dTG data (Figure 3) shows that PT breeze, ecoke®(A) and ecoke®(B) had similar Rmax values: 0.63, 0.61 and 0.53 mg/min, respectively, whereas Coal A was 35% higher at 0.85 mg/min. The average rates of combustion for PT breeze, ecoke®(A) and ecoke®(B) over the range of heating rates were 0.236, 0.185 and 0.198 mg/min, respectively, with Coal A being 0.287 mg/min. For the burnout temperatures (Tb), whilst PT breeze consistently had the highest Tb, regardless of the ramp rate, the values for ecoke®(B) and Coal A had similar Tb values across the ramp rates measured, with ecoke®(A) showing the lowest burnout temperatures. Then, looking at the trends across the various temperature markers used, as the heating rate increased, T1 and Tb shifted to higher values, whereas Ti remained stable. This is thought to have occurred because of the low thermal conductivities of the fuels, which caused the combustion to lag behind the heating rate at higher values [23]. Overall, the ease of ignition was in the following order: ecoke®(A) > Coal A > ecoke®(B) > PT breeze. The combustion parameter (S) showed overall combustibility and had a marginally different order: Coal A > ecoke®(A) > ecoke®(B) > PT breeze. This was due to PT breeze having a lower rate of reaction than Coal A, but a higher ignition and burnout than the ecoke® samples. For sintering, an easy-to-ignite fuel will reduce the ignition energy requirements, and a faster combusting fuel has been shown to increase the yield.
The heat-flow curves (Figure 4) show an exothermic reaction for all the fuels tested. Whilst the data show that the ecoke®(A) produced the highest peak values and the PT coke breeze the lowest, the coke breeze curve is broader and peaks at a higher temperature, in line with a similar energy output overall, as discussed earlier and shown in Figure 1. Interestingly, these data show that the ecoke®(A) had the highest heating value across these heat-flow peaks at 3 MJ/kg, whilst the coke breeze, Coal A and ecoke®(B) had values that were 0.5 MJ/kg lower. The data also show that the coke breeze showed reduced heat output at a lower heating rate, whilst the ecoke®(A) and Coal A showed more consistent heat flows, regardless of the heating rate.

3.3. Volatile Matter Analysis

Figure 6 shows the py-GCMS data for the ecoke®(A) and (B) and PT breeze pyrolysed up to 800 °C in ca. 40 ms. The gas chromatographs are shown in a stacked form on the same axis for a qualitative comparison of the rapid volatile matter release from each sample. The context here is that this is the volatile matter that will be released during the initial stages of a thermal event; for example, an ignition process within the sinter bed, or if the material is to be added to an electric arc furnace to undergo very rapid heating and devolatilisation. Both ecoke® chromatograms have many more and higher intensity peaks than the PT Breeze chromatogram at retention times less than ca. 700 s. This was expected, partly because lower-boiling-point compounds were expected to elute from the GC column earlier aligned with the overall higher volatile content of ecoke®. By comparison, the PT breeze chromatogram shows fewer peaks at shorter residence times that are in line with the higher fixed carbon and lower volatile matter content compared with ecoke®. Interestingly, there are also some extra peaks in the ecoke® samples at retention times of ca. 1980 s for ecoke® A, and at 1600–1700 s and 1980 s for ecoke® B. These compounds are expected to remain in the material after the initial devolatilization and are thus expected to be part of the fixed carbon in these materials. Looking at ecoke® B, the peaks from 1600 to 1700 s are not well resolved, but the mass spectrometry suggests the presence of heneicosane (C21H44—long-chain alkane wax), 1-heptacosanol and 1-pentacontanol (C27H56O and C50H102O, respectively—long-chain fatty alcohols) and acenaphthylene (C12H8—a cyclopentadiene fused to naphthalene). The GC data for ecoke® A and B also show a peak at 1930 s, which the MS suggests is triacontane (C30H62—long-chain alkane wax). By comparison, PT breeze shows an extra peak at 1710 s, which the MS suggests is triphenyl-cyclohexane (C24H24—an aromatic-derivatised cycloalkane). In between retention times of 700 and 1500 s, the chromatograms of the ecoke® samples and PT breeze showed strong similarities, which is in line with the fossil fuel subcomponent of ecoke®. Furthermore, this suggests that these materials should behave in similar ways during either iron oxide sintering or electric arc furnace processing. Tables S1–S3 show the full list of compounds identified from the MS analysis for each chromatogram in Figure 6.

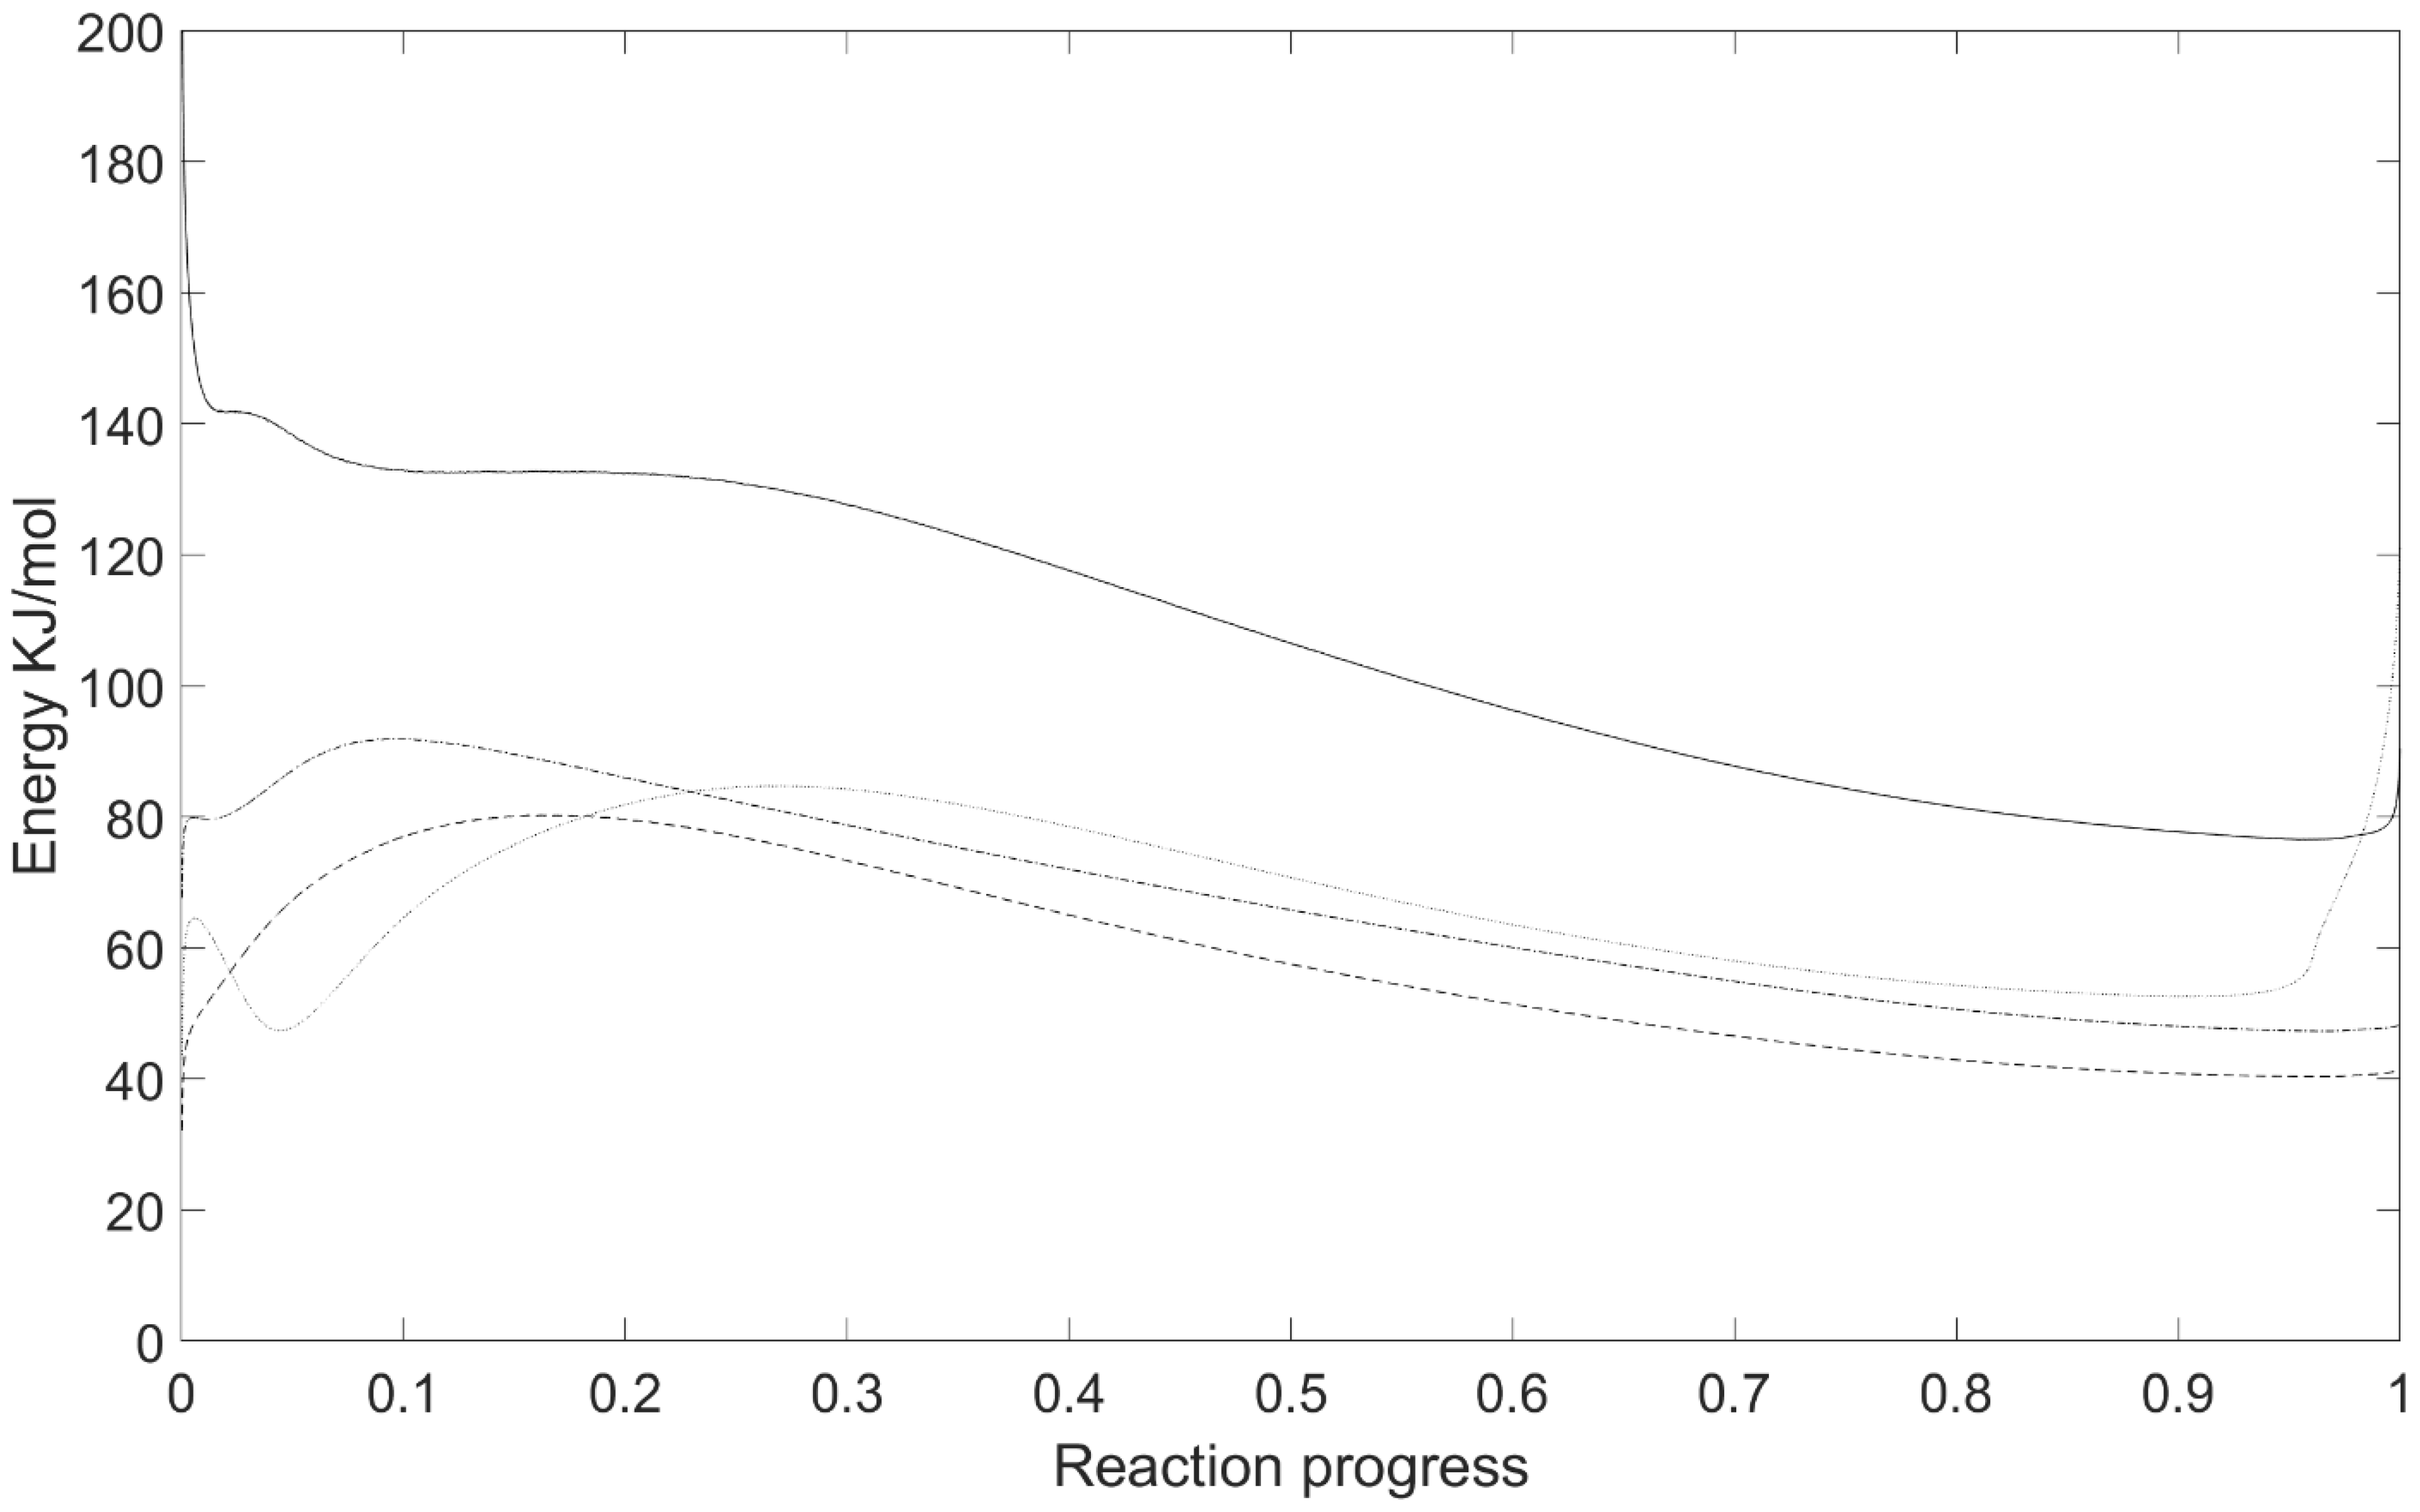
3.4. Isoconversional Kinetic Analysis

The TGA data from the varying heating rates were then analysed using model-free differential isoconversional methods based on the methods of either Friedman or Ozawa–Flynn–Wall (Figure 7 and Figure 8). These models calculated the kinetic parameters (Table 3) (e.g., activation energy, pre-exponential factor). The data show that the PT breeze by far had the highest activation energy at 138–141 kJ/mol, compared with 80–93 kJ/mol for the other fuels. The pre-exponential factor followed the same trend as the activation energy, with a much higher value (i.e., ca. double) for PT breeze compared with the other fuels. Interestingly, using both the Friedman and Ozawa methods, ecoke®(B) showed an initial activation energy (60–70 kJ/mol) and then a drop at ca. 3–4% conversion to the Eact (30–45 kJ/mol), before returning to a similar value at ca. 10% conversion.

4. Discussion

During the sintering process, the fuel is mixed with the other raw materials and tipped onto a conveyor belt to form a bed. This bed is ignited from the top using a natural gas burner to create a flame front, which combusts downwards from the top to the bottom whilst air is drawn through this bed of material to sustain the combustion. For efficient sintering, the height of the bed, speed of the conveyor belt and rate of combustion are coordinated so that the flame front not only exceeds 1100 °C, but also reaches the bottom of the bed by the end of the conveyor belt so that fully sintered material falls from the end of the conveyor. This means that the rate of fuel combustion is also key to successful sintering and, hence, as part of any fuel switching strategy away from fossil fuels, the burnout kinetics need to be measured for the replacement fuel. Furthermore, in their review on the application of biomass in sintering, Jha and Soren [37] listed the important aspects of any fuel to be commercially viable, which are, namely, a high heating value, low levels of impurities, low moisture/ash and clean burning. For commercial viability, the fuel must also be easily and continually available in sufficient quantity, affordable and transportable (high energy density and low flammability). In addition to the high temperatures needed to produce high-quality sinter, the reactivity of the fuel is critical to sintering, as the reactivity determines how long the sinter mixture is subjected to high temperatures. Therefore, the reactivity is directly linked to the yield of the strand, as productivity and quality are both affected.
Coke breeze is the undersized material from coke production that cannot be used in the blast furnace. Instead, it is used for sintering to reduce waste. Here, the PT breeze had the lowest values of C and S for the fuels tested, indicating its high combustion temperatures and low reactivity respectively. The reactivity was established from the maximum rate of mass loss, as well as from the kinetic parameter activation energy and pre-exponential factor, which were 0.6 mg/min, 167 kJ/mol and 13.9, respectively. All these properties set a benchmark for potential fuels to match or exceed, as PT breeze is known to produce quality sinter on an industrial scale.
Coal A is a high-quality anthracite coal. It has the highest S value, as its reactivity is much higher (0.85 mg/min compared with 0.63 mg/min). Due to this, if it is substituted for PT breeze in the sinter pot, then similar combustion temperatures but a much faster flame front speed can be expected. Previous studies have shown that higher reactivities can have a negative effect on the quality of the sinter if not managed correctly [3,38]. Techniques to adjust the flame front speed include changing the particle size [3], coating of particles in SiO2 and B2O3 [39] and the blending of fuels [5] have been reported to control this. Therefore, it is likely that mixtures of coke breeze and Coal A could work for sintering a denser sinter bed, as they would increase the flame front speed to counteract the lower bed permeability. However, Coal A is still a fossil fuel, and so it does not address the CO2 emission issue.
Biomass is known to have higher O/C and H/C ratios than fossil fuels, which can reduce their CV and indicates higher volatile contents compared with coke breeze, which is predominantly fixed carbon, which can be problematic to the sintering process [37,40]. Hence, without any treatment of biomass, it is unlikely that it would be a direct replacement for coke breeze in the sintering process. So here, we studied ecoke®(A) and (B), which comprise 70% fossil fuel, with the remainder made up of thermally upgraded secondary biomass. The upgrading process drives off volatiles and breaks apart the biopolymers, such as lignin, forming conjugated ring structures, such as those contained in coke [21]. When comparing the kinetics, ecoke®(A) has an activation energy of 80.0 kJ/mol, although this varies between methods, with the Friedman and Ozawa methods giving 79.8 and 80.2 kJ/mol, respectively, but the ASTM giving 87.0 kJ/mol. This is considerably lower than the PT breeze, which has a value of 167.0 kJ/mol; therefore, ecoke®(A) will ignite easier than PT Breeze. The ignition temperatures of the ecoke® samples were ca. 100 °C lower than those of the PT breeze and Coal A samples, and this is ascribed to the presence of a binder component within these samples. So, whilst PT breeze and Coal A consist of carbonaceous material that is fused together either within a coke oven or during coalification within a coal seam, the ecoke® samples are produced as briquettes by mixing fuel with a binder component that is cured to produce the final material. Given that the other components of the ecoke® samples include fossil fuel and thermally treated biomass, the ignition data suggest that the binder component may be the reason for these lower ignition temperatures. This is confirmed in the value of C, which, on average, is 122% higher than that of PT breeze. The ecoke®(B) system has a different binder composition to that of ecoke®(A) to increase the mechanical strength of the briquettes. T1 and Tb for both ecoke® samples were similar, indicating that the added binder burns off quickly, leaving the remaining material to combust. Interestingly, ecoke®(B) had an initial Eact of 64.0–65.8 kJ/mol, with a secondary value of 84.6–87.4 kJ/mol, which was a similar value to that of ecoke®(A). This is another indication that the binder ignites before the fixed carbon, which could mean that the ignition time could be reduced with the use of ecoke®(B).
The py-GCMS data shown in Figure 6 from ecoke®(A) and ecoke®(B) show very few differences, as expected, as all the same raw materials are present, except the addition of a binder in ecoke®(B). Acetic acid was detected in the ecoke®(B) sample after pyrolysis to 800 °C. This was not unexpected, as wood vinegar is a common by-product of wood pyrolysis and ecoke® contains 30% wood-derived biomass. The ecoke®(B) data also show sulphur compounds (e.g., dimethyl sulphide and carbon disulphide) that do not appear within ecoke®(A). Reduced sulphur compounds are in line with organic material that has experienced anaerobic conditions, which suggests the (CH3)2S and CS2 were derived from the fossil fuel material in ecoke®(B). This is further supported by the presence of sulphur dioxide in the fossil fuel PT breeze (Table S3).
A key issue for all energy-intensive industries, such as steelmaking, is how to decarbonise. This paper addresses the concept of fuel switching by a partial (30%) displacement of fossil fuel coal/coke for biomass in ecoke®. The data show that PT breeze, ecoke®(A) and (B), have similar calorific values, fixed carbon and rates of burnout. However, both ecoke® samples have higher volatile matter and lower combustion temperatures and activation energies than PT breeze. The pyrolysis–GCMS analysis of the volatile matter showed mainly lower-molecular-weight (i.e., <C5) hydrocarbons in the ecoke® samples, with some O-heteroatom compounds (e.g., furan, acetone), which are expected for biomass-derived material. It is this volatile matter that is believed to ignite first and give rise to the lower combustion temperatures and activation energies at a low reaction conversion (i.e., <20% conversion). Whilst there are some differences between ecoke® and coke breeze in the higher-molecular-weight compounds that would be expected to make up the fixed carbon in these samples, these would not be expected to substantially change how the fixed carbon behaves during reaction.
As such, volatile matter appears to be a key parameter for fuel switching away from high-fixed-carbon, low-volatile-matter fossil fuel. Looking at this issue for two different steelmaking processes, in a sinter plant, air is rapidly drawn through the sinter bed. If the volatile matter combusts within the sinter bed itself, then it releases heat there and only combusted by-products leave. However, if the volatile matter does not combust fast enough and leaves the sinter bed, then it can cause problems in the exhaust stream. This suggests that ecoke® requires further treatment to reduce the volatile matter content. Experiments using isothermal programmes in the TGA coupled with py-GCMS could identify an optimal temperature and residence time to reduce the volatile matter to more acceptable levels. However, during electric arc furnace operation, carbon is added to the melt to increase slag foaming, and so here the volatile matter is less likely to be an issue, as the amount of volatiles and the rate at which they are released are key factors in the formation of a foamed slag layer. Once again, the critical aspect of using a biomass-containing fuel, such as ecoke®, is the displacement of CO2 emissions and inspiring change.

5. Conclusions

Fuel switching away from fossil fuels to sustainable alternatives is key to achieving net-zero carbon objectives within iron ore sintering. The data reported here illustrate some of the key parameters that influence fuel switching. Thus, while PT breeze, ecoke®(A) and (B) all have similar calorific values, fixed carbon and rates of burnout, both biomass-containing ecoke® samples have higher volatile matter contents and lower combustion temperatures and activation energies. Analysis of the different carbon species released during volatilisation shows more low-molecular-weight compounds being released in the ecoke®, and these are believed to initiate combustion. Interestingly, however, the majority of organic compounds released by the ecoke® are similar to those released by the PT breeze, indicating that much of the fixed carbon is similar. As such, the ecoke® samples performed well despite lower combustion temperatures, as the heat released was higher than PT breeze in both the calorimetry and TGA tests. This resulted in a fuel that required less energy to ignite while having a larger calorific value, thus having the potential to produce higher temperatures in the sinter mix despite having lower combustion temperatures. Based on this, ecoke® does show promise for further sinter testing and represents a potentially important step forward in decarbonisation using existing steelmaking infrastructures because it offsets CO2 emissions by up to 30% using existing processes and equipment. However, the main issue from these data is the higher volatile matter for the ecoke®(A) and (B). For iron ore sintering, it would therefore be preferable to reduce the volatile matter, although this is probably less of an issue if the material is to be used in an electric arc furnace scenario due to the different process conditions.

Supplementary Materials

The following supporting information can be downloaded at: https://www.mdpi.com/article/10.3390/su15065495/s1, Table S1: pyGCMS data for ecoke®(A) at 800 °C green and brown text indicate a match and no match to table S2 respectively. Table S2: pyGCMS data for ecoke®(B) at 800 °C green and brown text indicate a match and no match to Table S1, respectively. Table S3: Pyrolysis-GCMS data for PT coke Breeze at 800 °C. Green and brown text indicate a match and no match to Tables S1 and S2, respectively.

Author Contributions

Conceptualization, S.R. and P.J.H.; methodology S.R.; validation, P.J.H. and C.M.; formal analysis, S.R. and E.J.; investigation, S.R. and E.J.; resources, P.J.H. and C.M.; data curation, P.J.H.; writing—original draft preparation, S.R. and E.J.; writing—review and editing, P.J.H. and C.M.; visualization, S.R. and E.J.; supervision, P.J.H. and C.M.; funding acquisition, P.J.H. and C.M. All authors have read and agreed to the published version of the manuscript.

Funding

We gratefully thank the EPSRC and Tata Steel for co-sponsoring an iCASE PhD studentship (Grant number: 2610332) (Voucher # 20000176) for S.R., the EPSRC for funding the Sustain Hub (EP/S018107/1) for P.J.H., the HEFCW for the funding capital grant for the STA and the Welsh Govt Circular Economy Capital Fund (Grant # 243) for funding the bomb calorimeter. We also thank Peter Warren for feedback on this manuscript.

Institutional Review Board Statement

Not applicable.

Data Availability Statement

The data presented in this study are available in “Biomass Coal Hybrid Fuel: A route to Net Zero Iron Ore Sintering” and its supplementary material. Please contact the corresponding author for further explanation.

Acknowledgments

Tata Steel UK Ltd. and CPL Industries for providing samples, and the Steel and Metals Institute at Swansea University for their help.

Conflicts of Interest

The authors declare no conflict of interest. The funders had no role in the design of the study; in the collection, analyses, or interpretation of data; in the writing of the manuscript; or in the decision to publish the results.

Appendix A

Table A1. EDS analysis of selected fuels.
Weight %
Elementecoke® Aecoke® BCoal APT Breeze
C K86.3286.5890.591.83
O K11.1710.656.83-
Na K0.26--0.12
Al K0.160.210.862.94
Si K0.230.621.023.11
S K0.540.390.460.6
Cl K0.110.190.21-
K K0.340.51-0.35
Ca K0.350.71-0.33
Fe K0.510.150.120.4
Ti K---0.28
Mg K---0.04
Table A2. Wood sawdust calorific values.
SampleCalorific Value (MJ/kg)
Ash Sawdust17.58 (0.5)
Walnut Sawdust18.24 (0.5)
Teak Sawdust18.14 (0.7)
Figure A1. Heat flow (red) and dTG (black) data from each fuel at increasing heating rates versus temperature for each fuel. Dashed line: ecoke®(A); dotted line: ecoke®(B); solid line: PT breeze; dotted dashed line: Coal A.
Sustainability 15 05495 g0a1

References

  1. Babich, A.; Senk, D. 13—Coke in the iron and steel industry. In New Trends in Coal Conversion; Suárez-Ruiz, I., Diez, M.A., Rubiera, F., Eds.; Woodhead Publishing: Sawston, UK, 2019; pp. 367–404. [Google Scholar]
  2. UK Goverment. COP26-Presidency-Outcomes-The-Climate-Pact. 2021. Available online: https://ukcop26.org/wp-content/uploads/2021/11/COP26-Presidency-Outcomes-The-Climate-Pact.pdf (accessed on 14 September 2022).
  3. Cheng, Z.; Yang, J.; Zhou, L.; Liu, Y.; Wang, Q. Characteristics of charcoal combustion and its effects on iron-ore sintering performance. Appl. Energy 2016, 161, 364–374. [Google Scholar] [CrossRef]
  4. Suopajärvi, H.; Umeki, K.; Mousa, E.; Hedayati, A.; Romar, H.; Kemppainen, A.; Wang, C.; Phounglamcheik, A.; Tuomikoski, S.; Norberg, N.; et al. Use of biomass in integrated steelmaking—Status quo, future needs and comparison to other low-CO2 steel production technologies. Appl. Energy 2018, 213, 384–407. [Google Scholar] [CrossRef] [Green Version]
  5. Zandi, M.; Martinez-Pacheco, M.; Fray, T.A.T. Biomass for iron ore sintering. Miner. Eng. 2010, 23, 1139–1145. [Google Scholar] [CrossRef]
  6. Nicol, S.; Chen, J.; Pownceby, M.; Webster, A. A review of the chemistry, structure and formation conditions of silico-ferrite of calcium and aluminum (‘SFCS’) phases. ISIJ Int. 2018, 58, 1111–1112. [Google Scholar] [CrossRef] [Green Version]
  7. Lu, L.; Adam, M.; Kilburn, M.; Hapugoda, S.; Somerville, M.; Jahanshahi, S.; Mathieson, J.G. Substitution of Charcoal for Coke Breeze in Iron Ore Sintering. ISIJ Int. 2013, 53, 1607–1616. [Google Scholar] [CrossRef] [Green Version]
  8. Science, W. 2022 Thermogravimetric Analysis: Document Search. Available online: https://www.webofscience.com/wos/woscc/basic-search (accessed on 14 September 2022).
  9. Nyakuma, B.B.; Wong, S.L.; Oladokun, O.; Bello, A.A.; Hambali, H.U.; Abdullah, T.A.T.; Wong, K.Y. Review of the fuel properties, characterisation techniques, and pre-treatment technologies for oil palm empty fruit bunches. Biomass Convers. Biorefinery 2020, 13, 471–497. [Google Scholar] [CrossRef]
  10. Vyazovkin, S.; Wight, C.A. Model-free and model-fitting approaches to kinetic analysis of isothermal and nonisothermal data. Thermochim. Acta 1999, 340–341, 53–68. [Google Scholar] [CrossRef]
  11. AKTS. Thermokinetics Software Thermal Analysis Isoconversional Model Fitting Dsc-Tg Detailed Description. Available online: https://www.akts.com/tk/thermokinetics-software-thermal-analysis-isoconversional-model-fitting-dsc-tg-detailed-description/ (accessed on 4 November 2022).
  12. Gerassimidou, S.; Velis, C.A.; Williams, P.T.; Komilis, D. Characterisation and composition identification of waste-derived fuels obtained from municipal solid waste using thermogravimetry: A review. Waste Manag. Res. 2020, 38, 942–965. [Google Scholar] [CrossRef]
  13. Skreiberg, A.; Skreiberg, Ø.; Sandquist, J.; Sørum, L. TGA and macro-TGA characterisation of biomass fuels and fuel mixtures. Fuel 2011, 90, 2182–2197. [Google Scholar] [CrossRef]
  14. Yorulmaz, S.Y.; Atimtay, A.T. Investigation of combustion kinetics of treated and untreated waste wood samples with thermogravimetric analysis. Fuel Process. Technol. 2009, 90, 939–946. [Google Scholar] [CrossRef]
  15. Ni, L.; Feng, Z.; Zhang, T.; Gao, Q.; Hou, Y.; He, Y.; Su, M.; Ren, H.; Hu, W.; Liu, Z. Effect of pyrolysis heating rates on fuel properties of molded charcoal: Imitating industrial pyrolysis process. Renew. Energy 2022, 197, 257–267. [Google Scholar] [CrossRef]
  16. Azam, M.; Ashraf, A.; Jahromy, S.S.; Raza, W.; Khalid, H.; Raza, N.; Winter, F. Isoconversional nonisothermal kinetic analysis of municipal solid waste, refuse-derived fuel, and coal. Energy Sci. Eng. 2020, 8, 3728–3739. [Google Scholar] [CrossRef]
  17. Ruyter, H.P. Coalification model. Fuel 1982, 61, 1182–1187. [Google Scholar] [CrossRef]
  18. Jiang, J.; Yang, W.; Cheng, Y.; Liu, Z.; Zhang, Q.; Zhao, K. Molecular structure characterization of middle-high rank coal via XRD, Raman and FTIR spectroscopy: Implications for coalification. Fuel 2019, 239, 559–572. [Google Scholar] [CrossRef]
  19. Chiodo, V.; Zafarana, G.; Maisano, S.; Freni, S.; Urbani, F. Pyrolysis of different biomass: Direct comparison among Posidonia Oceanica, Lacustrine Alga and White-Pine. Fuel 2016, 164, 220–227. [Google Scholar] [CrossRef]
  20. Van der Stelt, M.J.C.; Gerhauser, H.; Kiel, J.H.A.; Ptasinski, K.J. Biomass upgrading by torrefaction for the production of biofuels: A review. Biomass Bioenergy 2011, 35, 3748–3762. [Google Scholar] [CrossRef]
  21. Yang, H.; Dong, Z.; Liu, B.; Chen, Y.; Gong, M.; Li, S.; Chen, H. A new insight of lignin pyrolysis mechanism based on functional group evolutions of solid char. Fuel 2021, 288, 119–719. [Google Scholar] [CrossRef]
  22. Group, L.S. LIBERTY Steel UK Launches Ecoke—A New Method of Electric Steelmaking to Reduce CO2 Emissions; Liberty Steel Group: London, UK, 2022. [Google Scholar]
  23. Ma, Z.; Wang, J.; Yang, Y.; Zhang, Y.; Zhao, C.; Yu, Y.; Wang, S. Comparison of the thermal degradation behaviors and kinetics of palm oil waste under nitrogen and air atmosphere in TGA-FTIR with a complementary use of model-free and model-fitting approaches. J. Anal. Appl. Pyrolysis 2018, 134, 12–24. [Google Scholar] [CrossRef]
  24. Lu, J.-J.; Chen, W.-H. Investigation on the ignition and burnout temperatures of bamboo and sugarcane bagasse by thermogravimetric analysis. Appl. Energy 2015, 160, 49–57. [Google Scholar] [CrossRef]
  25. Liu, Z.; Quek, A.; Hoekman, S.K.; Srinivasan, M.P.; Balasubramanian, R. Thermogravimetric investigation of hydrochar-lignite co-combustion. Bioresour. Technol. 2012, 123, 646–652. [Google Scholar] [CrossRef]
  26. Li, X.G.; Lv, Y.; Ma, B.G.; Jian, S.W.; Tan, H.B. Thermogravimetric investigation on co-combustion characteristics of tobacco residue and high-ash anthracite coal. Bioresour. Technol. 2011, 102, 9783–9787. [Google Scholar] [CrossRef]
  27. Cai, J.; Xu, D.; Dong, Z.; Yu, X.; Yang, Y.; Banks, S.W.; Bridgwater, A.V. Processing thermogravimetric analysis data for isoconversional kinetic analysis of lignocellulosic biomass pyrolysis: Case study of corn stalk. Renew. Sustain. Energy Rev. 2018, 82, 2705–2715. [Google Scholar] [CrossRef] [Green Version]
  28. Luthfi, N.; Ohkoshi, T.; Tamaru, Y.; Fukushima, T.; Takisawa, K. Investigation into the combustion kinetics and spontaneous ignition of sweet sorghum as energy resource. Bioresour. Bioprocess. 2022, 9, 49. [Google Scholar] [CrossRef]
  29. Friedman, H.L. Kinetics of thermal degradation of char-forming plastics from thermogravimetry. Application to a phenolic plastic. J. Polym. Sci. Part C Polym. Symp. 1964, 6, 183–195. [Google Scholar] [CrossRef]
  30. Flynn, J.H.; Wall, L.A. General treatment of the thermogravimetry of polymers. J. Res. Natl. Bur. Stand. Sect. A Phys. Chem. 1966, 70, 487–523. [Google Scholar] [CrossRef] [PubMed]
  31. Ozawa, T. A new method of analyzing thermogravimetric data. Bull. Chem. Soc. Jpn. 1965, 38, 1881–1886. [Google Scholar] [CrossRef] [Green Version]
  32. ASTM D7582-15; Standard Test Methods for Proximate Analysis of Coal and Coke by Macro Thermogravimetric Analysis. ASTM International: West Conshohocken, PA, USA, 2016. Available online: https://www.astm.org/d7582-15.html (accessed on 12 March 2023).
  33. ISO 17246:2010; Coal—Proximate Analysis. International Standards Organisation: Geneva, Switzerland, 2010. Available online: https://www.iso.org/standard/55946.html (accessed on 12 March 2023).
  34. Di Gruttola, F.; Borello, D. Analysis of the EU Secondary Biomass Availability and Conversion Processes to Produce Advanced Biofuels: Use of Existing Databases for Assessing a Metric Evaluation for the 2025 Perspective. Sustainability 2021, 13, 7882. [Google Scholar] [CrossRef]
  35. LECO. ChromaTOF Software. Available online: https://www.leco.com/product/chromatof-software (accessed on 15 November 2022).
  36. Demirbaş, A. Relationships between lignin contents and heating values of biomass. Energy Convers. Manag. 2001, 42, 183–188. [Google Scholar] [CrossRef]
  37. Jha, G.; Soren, S. Study on applicability of biomass in iron ore sintering process. Renew. Sustain. Energy Rev. 2017, 80, 399–407. [Google Scholar] [CrossRef]
  38. Zhou, H.; Liu, Z.; Cheng, M.; Liu, R.; Cen, K. Effect of flame-front speed on the pisolite-ore sintering process. Appl. Therm. Eng. 2015, 75, 307–314. [Google Scholar] [CrossRef]
  39. Gan, M.; Li, Q.; Ji, Z.Y.; Fan, X.H.; Lv, W. Influence of surface modification on combustion characteristics of charcoal and its performance on emissions reduction in iron ore sintering. ISIJ Int. 2017, 57, 420–428. [Google Scholar] [CrossRef] [Green Version]
  40. Stewart, D.J.C.; Scrimshire, A.; Thomson, D.; Bingham, P.A.; Barron, A.R. The chemical suitability for recycling of zinc contaminated steelmaking by-product dusts: The case of the UK steel plant. Resour. Conserv. Recycl. Adv. 2022, 14, 200073. [Google Scholar] [CrossRef]
Figure 1. Graphical method for calculating combustion temperatures from TG and dTG data.
Sustainability 15 05495 g001
Figure 2. Calculated CVs from heat flow obtained from STA measurements versus heating rate for ecoke®(A)—light grey; ecoke®(B)—mid grey; coke breeze—dark grey; anthracite—black. Calculated error of 1.02% for each run.
Sustainability 15 05495 g002
Figure 3. Conversion data for each fuel at increasing heating rates versus temperature for each fuel. Dashed line: ecoke®(A); dotted line: ecoke®(B); solid line: PT breeze; dotted dashed line: Coal A.
Sustainability 15 05495 g003
Figure 4. dTG data for each fuel at increasing heating rates versus temperature for each fuel. Dashed line: ecoke®(A); dotted line: ecoke®(B); solid line: PT breeze; dotted dashed line: Coal A.
Sustainability 15 05495 g004
Figure 5. Heat-flow data for each fuel at increasing heating rates versus temperature for each fuel. Dashed line: ecoke®(A); dotted line: ecoke®(B); solid line: PT breeze; dotted dashed line: Coal A.
Sustainability 15 05495 g005
Figure 6. py-GCMS spectrum obtained at heating rate from 20 °C/ms to 800 °C. Dashed line is ecoke®(A), dotted line is ecoke®(B) and solid line is PT breeze.
Sustainability 15 05495 g006
Figure 7. Graphs showing (top) activation energy and (bottom) pre-exponential factor versus reaction progress calculated using Freidman method. Dashed line: ecoke®(A); dotted line: ecoke®(B); solid line: PT breeze; dotted dashed line: Coal A.
Sustainability 15 05495 g007
Figure 8. Graph showing activation energy versus reaction progress calculated using Ozawa method. Dashed line: ecoke®(A); dotted line: ecoke®(B); solid line: PT breeze; dotted dashed line: Coal A.
Sustainability 15 05495 g008
Table 1. Proximate analysis and calorific value of each fuel.
SampleProximate Analysis (% by Mass)Calorific Value (MJ/kg)
Fixed CarbonVolatile MatterAsh
ecoke®(A)78.7 13.3 8.9 27.9
ecoke®(B)77.0 12.4 11.2 27.8
PT Breeze83.47.49.226.5
Coal A73.214.412.429.9
Table 2. Burnout properties for fuels at increasing heating rates (Ti: ignition temperature; T1: temperature at maximum combustion rate; Tb: burnout temperature; Rmax: maximum combustion rate; Rav: average combustion rate; C: ignition index; S: combustion index).
ecoke®(A)ecoke®(B)PT BreezeCoal A
5  °C/min
Ti406454545476
T1478518662525
Tb523588724577
Rmax0.420.280.250.46
Rav0.100.080.090.12
C (×10−6)2.551.360.842.03
S (×10−10)5.021.781.024.29
10  °C/min
Ti401462579494
T1506555707574
Tb643614769637
Rmax0.490.440.450.71
Rav0.140.130.200.29
C (×10−6)3.052.061.342.91
S (×10−10)6.824.303.4913.02
15  °C/min
Ti401455585511
T1512575743601
Tb643688809687
Rmax0.530.50.530.77
Rav0.200.160.220.32
C (×10−6)3.302.421.552.95
S (×10−10)10.415.514.2113.74
20  °C/min
Ti388450582519
T1550573802615
Tb702716879759
Rmax0.590.530.580.8
Rav0.370.300.160.23
C (×10−6)3.922.621.712.97
S (×10−10)20.8210.863.088.88
25  °C/min
Ti399451580522
T1545596797628
Tb791793926800
Rmax0.610.540.590.85
Rav0.360.260.320.48
C (×10−6)3.832.651.753.12
S (×10−10)17.248.846.1418.76
Table 3. Kinetic parameters for fuels at increasing heating rates (EactF: activation energy from Friedman method; AF: pre-exponential factor for Friedman method; EactO: activation energy from Ozawa method).
Parameterecoke®(A)ecoke®(B)PT BreezeCoal (A)
EactF (kJ/mol)79.865.8/87.4138.094.0
AF6.64.0/6.413.96.9
EactO80.264.0/84.6141.591.2
Disclaimer/Publisher’s Note: The statements, opinions and data contained in all publications are solely those of the individual author(s) and contributor(s) and not of MDPI and/or the editor(s). MDPI and/or the editor(s) disclaim responsibility for any injury to people or property resulting from any ideas, methods, instructions or products referred to in the content.

