Abstract
The purpose of this research is to study the communication network among the participants in a construction project. The proposed approach contains the solving of the following tasks: identification of the key factors that affect the communication quality; calculation of the “communication quality” indicator between each pair of participants using fuzzy logic; and evaluation of the key measures of centrality using the tools of a Social Network Analysis. Solving the set tasks can help break the problem of the low level of efficiency of construction project deliveries. This study was conducted when the design stage was already complete and the construction project had 17 participants. We used the following factors influencing communication quality: timeliness, understanding, bidirectionality, use of IT tools in communication acts and adequacy. The use of fuzzy logic tools can minimise the subjectivity of the qualitative data obtained from the questionnaires. The analysis of five centrality measures showed that “Project manager”, “Chief engineer”, “Construction site manager”, “Construction works manager” and “Architect” had the greatest values in comparison with other network participants. On the one hand, this organisational structure of communication can be considered correct because the main information flows through the project managers, who make the decisions. On the other hand, this indicates a significant dependence of the construction project on these participants and, in the event of certain risk events, may lead to a decrease in the efficiency of its implementation. The methods presented in this article can be used in project management to analyse a real communication network.
1. Introduction
The delivery of construction projects is described by task complexity, high uncertainty and connectedness between participants, which makes communication even more important [1]. In addition, the importance of communication increases even more due to its decentralised nature and the different timing of participants joining the project [2,3]. For successful management, each project should have effective communication support. This means that specialists have to receive the necessary information on time through optimal communication links. Miscomprehension of the importance of this process is one of the most common sources of error in project and people management. People often misinterpret incoming information.
The project team needs complete, accurate and timely information about all aspects of the project. Adequate information assists in making the right decisions, which contributes to the successful delivery of construction projects. The communication system must connect all participants to ensure a smooth exchange of information in the project. Using a communication system, project participants can exchange information and communicate with each other to achieve the goals. An effective system of communication plays an important role in the project, since it transmits a significant amount of information to numerous participants throughout the project duration [4].
The quality of communication between construction project participants is of paramount importance and has a significant impact on the basic factors of effective teamwork, which, in turn, are reflected in the results of construction projects [5]. Consequently, the timely transmission of adequate information contributes to the construction project’s delivery within the established timeframe and budget [6]. An ineffective communication system often leads to more rework, which involves lengthening the duration, increasing costs and a decline in quality [7]. Communication provides the effective integration of the project participants and reduces the likelihood of conflicts [8]. Project participants collect, analyse and convey information in real time to provide early warnings of deviations from plans and a timely implementation of the appropriate actions [9]. In addition, effective communication creates a strong relationship between construction project participants and improves motivation, performance and team collaboration [10]. Thus, an effective project communication system provides fast and accurate conveyance of technical information, which serves as the basis for consensus decision-making. This can improve teamwork, reduce conflicts, adhere to timeframes and budgets and contribute to the success of the project.
Despite vast scientific research on construction project communication, not enough attention is paid to the factors affecting the quality of communication between team members. The factors influencing the quality of communication between project participants are the primary causes of problems in project delivery and can be critical to the effectiveness of an entire project.
As a rule, influencing factors are determined on the basis of a project participant questionnaire and evaluated using qualitative criteria. The important limitation of the communication quality calculation is the uncertainty associated with the exact ranges of acceptable values, since these intervals are subjective and depend on the opinion of a particular person [11,12]. The influence of this limitation can be mitigated by using fuzzy logic (FL) tools. The main advantage of fuzzy set theory is the use of linguistic variables instead of quantitative ones and fuzzy logic instead of binary logic to formally represent imprecise categories. Thus, the use of FL makes it possible to perform a quantitative calculation of the quality of the communication indicator for each pair of project participants.
In turn, use of the SNA method, which is based on graph theory and uses its mathematical apparatus, allows for the calculation of a significant number of indicators and, accordingly, the acquisition of additional important data and knowledge.
Thus, this article is an interdisciplinary research paper that: (1) integrates knowledge about the factors that influence the quality of communication; (2) uses fuzzy logic to solve the problem of the subjectivity of the opinion of a particular person; and (3) uses Social Network Analysis tools to calculate various measures of centrality that reflect the level of influence of the project participant. The systematisation and integration of these methods are the main scientific and practical novelties of this research.
The object of this research was the communication system of the construction project. The following tasks were identified:
- (1)
- Identification of the key factors that affect the communication quality between participants in a construction project;
- (2)
- Calculation of the indicator “communication quality” between each pair of participants in the construction project using fuzzy logic;
- (3)
- On the basis of the indicator “communication quality”, evaluation and analysis of the key measures of centrality, which reflect the value of the participant in the project.
Solving the set tasks can help break the problem of increasing the level of efficiency of construction project deliveries.
In summary, the results of this study will help practitioners and researchers in the construction industry to establish effective communication between project participants.
Figure 1 shows the block diagram of the research. The blue boxes represent the stages of the study, while the green pentagons show the output of each stage.
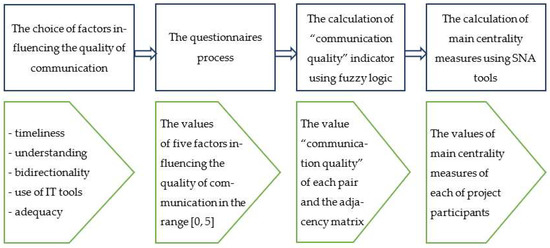
Figure 1.
The block diagram of the research.
2. Background
2.1. The Factors Influencing Communication Quality
Thomas et al. [13] noted that having methods for assessing the quality of communication is a necessary element for improving communication in a project. Currently, there are different approaches and definitions for analysing communication efficiency and key communication factors [14,15]. Armstrong and Taylor [16] said that increasing the number of project participants from different geographic regions reduces the quality of communication. A similar approach was taken by Nam et al. [17], who argued that great cultural diversity negatively affects communication efficiency. An accurate understanding of the project scope and objectives was identified as one of the vital factors affecting the communication quality of the project [18]. Senescu et al. [19] noted the relationship between the level of communication complexity and its quality and observed that communication is often distorted as the complexity level increases.
One of the first extensive studies was the article by Mohr and Sohi [20]. The authors confirmed the idea that the norms of information exchange within the framework of relationships are largely related to the communication flows within those relationships. They developed a model that assumes that communication flows (frequency, bidirectionality and formality) are largely related to the final judgements regarding the quality of communication. In addition, the authors concluded that the communication quality covers only those communication aspects that can be assessed in terms of the judgements of the stakeholders.
The factors influencing communication quality that can be assessed from the point of view of the judgements of the direct participants in the acts of communication are presented in Table 1.

Table 1.
Factors influencing communication quality.
Xie et al. [21] studied the impact of supply chain partnerships on the multilateral communication of a construction project. In their study, a triangulation was developed with three sets of variables related to team cooperation and applied to analyse the overlap of communication issues and problems in a construction project. The authors suggested using accuracy, information flow, barriers, gatekeeping, procedures, completeness, timeliness, overload, underload, distortion and understanding as variables affecting communication.
Aubert, Hooper and Schnepel [23] identified communication quality as one of the key success factors to consider when implementing an Enterprise Resource Planning (ERP) system. The authors studied nine aspects that affect the quality of communication. The results showed that different quality communication factors influence different aspects of a project’s success. Some criteria of the project’s success were not affected by the quality of the communication. In addition, it was found that, for those aspects of the project’s success that are influenced by the communication quality, the communication form and content are equally important.
Sonnenwald [24] conducted extensive research on the impact of the integration of specialised knowledge and the differences between specialists on the design process. To solve the problem, the communication system was investigated, and four factors affecting communication were proposed: understanding, timeliness, overload and underload.
Thomas, Tucker and Kelly [25] classified communication assessment factors into six categories and measured communication effectiveness. The category weights were established to reflect the relative importance of the core issues in measuring communication efficiency. The six categories are scored based on responses to the questionnaire by summing and normalising the data on a scale from 0 to 10. The weighted category scores are summed up to obtain an overall rating for project communications.
Kwofie, Aigbavboa and Baiden-Amissah [26] explored opportunities to improve communication performance in project teams. The authors conducted a questionnaire survey among 52 experienced construction practitioners and established the following factors that influence communication: accuracy, procedures, barriers, understanding, timeliness, completeness, overload, underload, gatekeeping and reliability.
Hosseini et al. [22] motivated the importance of research by the need to identify and define metrics to assess the quality of communication between construction project members. One of the results was the definition of 12 indicators that could be used to assess the quality of communication in construction teams. In our opinion, it is necessary to pay attention to the articles in which the authors studied the relationship between the improvement in the quality of communication and the use of Information and Communication Technology (ICT) in a construction project. The use of ICT creates additional benefits in the communication system, which include increased efficiency of processes and better coordination and collaboration [27]. Recently, more and more construction projects have included various information exchange technologies aimed at improving communication efficiency [28,29]. The decision to use ICT in a construction project should be based on an understanding of the potential communication efficiency of this tool [30].
Analysing Table 1, it can be seen that the authors most often use the factors of timeliness, accuracy, understanding, completeness, barriers and reliability. In our opinion, considering the arguments given in [28,29,31], it is necessary to additionally take into account whether ICT tools were used in pair communication to assess the quality of communication.
2.2. Fuzzy Logic
The concept and mathematical methods of fuzzy set theory proposed by Zadeh [32,33] are often used to solve various problems associated with the implementation of construction projects. Researchers have used fuzzy set theory to solve complex and uncertain problems due to the incompleteness and inaccuracy of information characterising real systems [34]. Baykasoglu et al. [35] proposed an analytical model for solving the problem of choosing a project team taking into account several factors. The authors used fuzzy concepts such as triangular fuzzy numbers and linguistic variables due to the imprecise nature of the problem. The proposed model was a fuzzy multiple optimisation model with fuzzy objectives and crisp constraints. In the subsequent article, the authors used fuzzy logic models to manage partnerships in construction projects [36]. Since many of the partnership’s parameters are qualitative (for example, maintaining established standards and adhering to the rules of conduct in relation to cooperation), the use of fuzzy set theory was justified. Gajzler and Zima [37] presented a multi-criteria model for evaluating construction projects from a client’s point of view. The proposed model allowed for a comparison of different options based on the 11 factors identified. The use of fuzzy logic made it possible to describe the analysed phenomenon when the exact parameters of the project at the planning stage were unknown. In the study, the authors analysed the problem of supplier selection for a construction company using two multi-criteria decision-making methods: fuzzy AHP and fuzzy TOPSIS [38]. The authors prefer fuzzy methods because the nature of the problem is uncertain and because of the ambiguity of expert opinions.
2.3. Social Network Analysis
Researchers often use Social Network Analysis (SNA) methods and tools to study the network of relationships among construction project participants. One of the first articles focused on the study of communication between the principal members of the project [39]. Abbsaian-Hosseini et al. [40] analysed the relationship between the degree of centrality and the effectiveness of the work of construction teams. Pryke et al. [41] analysed the self-organisation networks of the project in the delivery of the infrastructure project. Among recent research, two articles can be noted in which the authors analysed a network of construction project members. Using network analysis to study this network allowed them to understand and identify some project problems [42]. Later, the authors discovered an anomaly in communication between project participants and proposed an optimisation method to improve the efficiency of communication in the network [43].
Lu et al. [44] used SNA to study the impact of Building Information Modelling (BIM) on the construction project organisation. The use of SNA tools for project analysis showed that BIM contributes to organisational change, improved communication efficiency and the organisation of collaboration processes by transferring much of the communication between different professions to earlier stages. Tai et al. [45] studied the key factors influencing the application of BIM. Social Network Analysis was used to model the relationship between the factors. Du et al. [46] used SNA to compare the differences between BIM and non-BIM projects. The results showed that BIM projects have more direct connections and shorter paths between project participants, making it easier and faster to exchange information between people. Jafari et al. [47] applied SNA to the change order process, extracting huge amounts of change order data.
3. Overview of the Proposed Method
3.1. Data and Information Collection
The communication network of participants in the project for the construction of two residential buildings with a total area of 8000 m2 located in Rivne, Ukraine, was studied. The construction started in February 2020, and its completion was scheduled for September 2022. In May 2022, due to the aggression of the Russian Federation against Ukraine, construction work was stopped. The new planned construction completion date is uncertain. This study was carried out between March and July 2021, when the design stage was already complete and earthworks began.
The primary task at the stage of data collection was the identification of the communication links between project participants. We used a questionnaire in which respondents were asked to provide the names of the project participants they communicated with and to assess the communication quality. Question 1 in the questionnaire required respondents to select from a drop-down list the participants with whom they communicated. If the answer to the first question was positive, the respondents were asked to assess the factors that influenced the quality of their communication.
We analysed the information in Table 1 and proposed the following factors influencing communication quality: timeliness, understanding, bidirectionality, use of IT tools in communication acts and adequacy. Thus, in this study, “communication quality” is considered a variable that depends on the five factors mentioned above.
Timeliness is the speed or promptness with which a message is conveyed or received. It is important to communicate in a timely manner because delays can cause miscommunication, misunderstandings, and even missed opportunities. Timely communication is critical for making informed decisions, resolving issues and staying competitive.
Understanding refers to the process of comprehending or making sense of the message being conveyed. It is the ability to accurately interpret and perceive the message and to be aware of its intended meaning, tone and context. It is not enough to simply transmit a message; the recipient must also be able to understand and interpret it correctly. When understanding is achieved, communication can lead to mutual agreement, conflict resolution and strengthened relationships.
Bidirectionality in communication refers to the exchange of information or messages between two or more parties in a reciprocal and interactive way. It means that communication is not a one-way process where only one party sends a message and the other simply receives it. Rather, bidirectional communication involves a back-and-forth exchange of information, where each party sends and receives messages and has the opportunity to respond and contribute to the conversation.
The adequacy factor is a cumulative indicator that covers such characteristics of information as accuracy, completeness and reliability. The respondents chose the degree of influence of each factor on a scale from 0 to 5. By communication, the authors mean communication between project participants using various forms of communication: verbal form, telephone, IT systems, e-mail, etc. This study was conducted when the design stage was already complete and the construction project had 17 participants. After completing the questionnaire process, we collected information from the project participants: the individuals (the person responsible for the technical supervision of the construction, the project manager, etc.) and the entities (design offices, contracting construction companies, etc.). The main problem at the stage of data collection was the lack of a unified communication system in the project.
3.2. Calculation of the “Communication Quality” Indicator Using Fuzzy Logic
Fuzzy logic methods provide a necessary tool for studying both individual aspects and the entire system in the case of the dominance of qualitative elements over quantitative ones. This tool can be useful when it is necessary to describe technical systems and processes where there is uncertainty, which in turn makes it difficult or even excludes the use of traditional quantitative methods.
In this study, the most significant aspect is the uncertainty associated with the factors influencing communication quality, since they are the qualitative indicators. This makes it impossible to give them exact ranges of acceptable values, since the intervals are very subjective and depend on the opinion of a particular person.
Fuzzy logic represents the processes of making decisions and evaluating situations by a specialist. This process has three steps: fuzzification, aggregation and defuzzification. At the fuzzification stage, clear numerical data are assigned the degree of their membership using the membership function. The type of membership function is determined by the properties of the modelling object.
The triangular membership function can be expressed in the form:
where a is the minimum possible value, b is the most expected value and c is the maximum possible value.
Aggregation produces the resulting membership functions for each of the output variables. The rule base, an inference algorithm and a set of membership functions for each of the output variables are included in this system. The rule base consists of rules that describe causal relationships between inputs and outputs. The fuzzy aggregation process combines all the basic concepts of the theory of fuzzy sets: membership functions, linguistic variables and fuzzy logical operations.
At the stage of defuzzification, a reduction in clarity occurs, and based on the membership function, the values of the output variables (“communication quality”) are calculated. The adjacency matrix is created in the next stage of the study. The value “communication quality” indicates the degree of communication between project participants.
3.3. The Calculation Methods of the Main Measures of Centrality
SNA is based on the methods of graph theory. The project network is an undirected graph , where V is a set of nodes and E is a set of pairs that form where are edges of a graph, and u and v are nodes of a graph. The project network is presented as a graph in which the participants are represented by graph nodes and the connections between participants are represented by the graph edges.
Table 2 shows some of the centrality measures of nodes that were calculated in this study.
Table 2.
The main centrality measures.
If we represent the communication network of the project in the form of a connected graph, then the nodes of the graph represent the participants in the project, and the edges of the graph indicate communication links between the participants. The calculation of the main measures of the centrality of nodes is based on the value of the “communication quality” index between the nodes of the network (Table 2). The measure of communication is displayed by the indicator “communication quality”, and a higher value of this indicator corresponds to a higher level of communication.
4. Results
4.1. Calculation of the Indicator “Communication Quality” Using Fuzzy Logic
The authors collected questionnaires from 17 project participants and cross-checked them to minimise the likelihood of data inconsistencies.
The following input linguistic variables were used in this study: timeliness, understanding, bidirectionality, use of IT tools in communication acts and adequacy. Five variables were described by three terms: low (L), medium (M) and high (H).
We used the Fuzzy Logic Toolbox from Matlab R2015b for the calculations of the “communication quality”. A triangular membership function based on the Mamdani method can be used to fuzz input variables (Figure 2) [53]. The Mamdani method uses a centroid defuzzification method in which the output of the predicted value is determined by the centre of weight of the output fuzzy set.
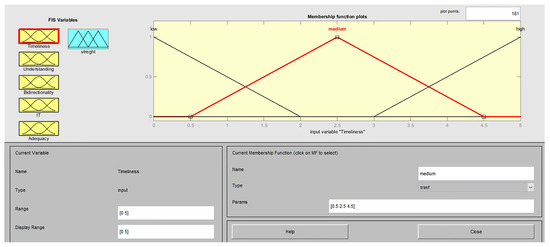
Figure 2.
The triangular membership function.
The system matches each linguistic variable using rules and converts input variables into linguistic output data. The next step in fuzzy inference is the aggregation of rule outputs. In the case of fuzzy inference, a large number of rules are processed at the same time, with their further aggregation into the final solution. The set of rules for our system includes 21 rules (Figure 3).
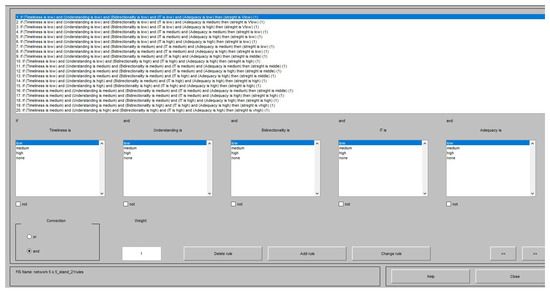
Figure 3.
The Fuzzy rule.
At the system’s output, the linguistic variable “communication quality” can take one of five values: very low (VL), low (L), medium (M), high (H) or very high (VH) (Figure 4).
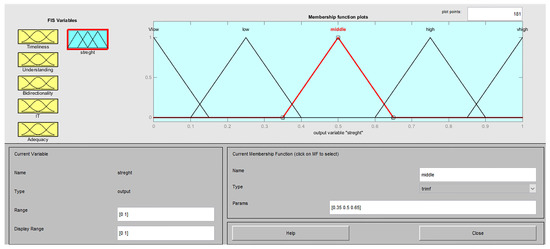
Figure 4.
The five values of the output linguistic variable.
The defuzzification is the final stage, when the fuzzy linguistic output data are changed to exact numbers. Figure 5 shows an example of a defuzzification step. For example, given the input numeric variables whose values are: 3, 3, 4, 5 and 5, the value of the output variable “communication quality” is 0.841.
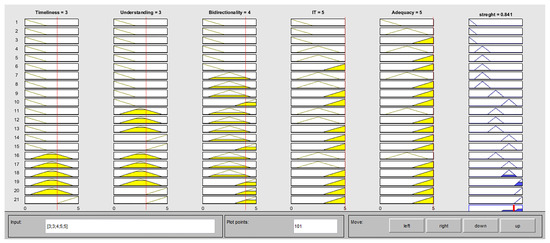
Figure 5.
An example of defuzzification.
The variable “communication quality” was calculated for all the communication pairs using fuzzy logic tools and systematised in the form of an adjacency matrix (Appendix A). The adjacency matrix contains the “communication quality” values for each pair of project participants. For example, the communication pair “Construction site manager” and “Safety Engineer” has a maximum value of 0.953, and the pair “Construction site manager” and “Estimate office” has a value of 0.000, which indicates no communication.
4.2. The Calculation of Main Centrality Measures
After forming the adjacency matrix, the next step was the calculation of the main centrality measures of the nodes. This was made using the Python programming language and the Numpy and NetworkX libraries. The visualisation of the communication project network was made using the Fruchterman–Reingold force algorithm [54].
Figure 6 shows an example of a visualisation of the Degree Centrality measure. The nodes in green are the project members that had a low Degree Centrality; the nodes in orange are the project members that had the greatest Degree Centrality.
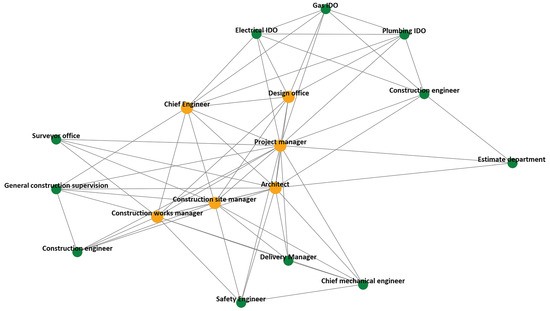
Figure 6.
An example of a visualisation of the Degree Centrality measure.
Table 3 shows the results of the calculation of centrality measures. The five project members that had the highest centrality measures are in italics. For example, the simplest measure of node centrality is Degree Centrality, which is calculated as the sum of the values of all edges that are connected with a given node. Thus, the Degree Centrality of the “General construction supervision” node was calculated as the sum of the “communication quality” values of the nodes connected with it (0.399 + 0.399 + 0.450 + 0.750 + 0.841 + 0.591 = 3.430) (Appendix A).
Table 3.
The calculation of main centrality measures of nodes.
The analysis of Degree Centrality values showed high degrees for “Construction site manager”, “Project manager”, “Architect”, “Chief engineer” and “Construction works manager”. The lowest value of the measure was recorded in the “Estimate office”. Additionally, the value of the Degree Centrality measure of the participant in the “Surveyor department” was low, which seems strange because the analysis of the project communication network was carried out at the same time as the beginning of the earthworks.
The measure of Betweenness Centrality shows the level of influence of a network participant on communication. Members who have a high value for the indicator can have a significant positive or negative impact on the communication process [55].
“Project manager”, “Construction site manager”, “Chief engineer”, “Architect” and “Construction works manager” had high values of the Betweenness Centrality measure, which positively affects project delivery because communication flows through the project managers.
The network’s participants with a high level of Degree Centrality also have a high degree of Closeness Centrality. The first five network participants in the Degree Centrality measure completely coincide with the first five in the Closeness Centrality measure.
The next two measures, Eigenvector Centrality and PageRank, indicate the level of importance of a node in the network. The calculation of both measures showed similar results (Table 3).
A node can have a significant level of importance if it has:
- -
- Many neighbours who have a minor impact level on the network;
- -
- Few neighbours who have a major impact level on the network.
In addition, it is necessary to pay attention to the high level of all the centrality measures of the participants “Project manager”, “Chief engineer”, “Construction site manager”, “Construction works manager” and “Architect”. In fact, we have a situation where these nodes, which have the greatest load in the number of communication relations (Degree Centrality), are also the most brokerage nodes (Betweenness Centrality) and, at the same time, have the greatest influence on the network (Eigenvector Centrality).
5. Discussion and Conclusions
A classic approach to assessing the level of communication in construction projects is to conduct a survey among project participants. Hossain [56] studied the centrality measures and relations between the project members. The input data were collected through a questionnaire, and the participants were asked to identify the position of the leader. Pryke et al. [41] analysed self-organisation networks of the construction project. Data were collected using questionnaires among 60 project participants. On the next stage of the study, the main centrality measures (Degree Centrality, Eigenvector Centrality and Betweenness Centrality) were calculated. Śladowski et al. [42] conducted a questionnaire among 28 participants in a construction project. The relationships between project participants were calculated using SNA. Ali et al. [57] used the questionnaire to reveal the opinions of 180 project participants on the impact of various skills on the quality of communication. Next, the authors created an artificial neural network model to predict the quality of interpersonal communication. In our opinion, a significant limitation of studies based on the collection of data using questionnaires is the high level of influence of the factor of subjectivity in the expert’s assessment. The use of fuzzy logic can minimise this negative impact.
The focus of this study was the communication network of the construction project participants. On the basis of the conducted literature review, the key factors (timeliness, understanding, bidirectionality, use of IT tools and adequacy) that affect the communication quality between participants in a construction project were identified.
On the next step of the study, the indicator “communication quality” between each pair of participants in the construction project was calculated using fuzzy logic. The use of fuzzy logic can mitigate the negative impact of the uncertainty associated with the exact ranges of acceptable values, since these intervals are subjective and depend on the opinion of a particular expert. On the last step of the study, the main centrality measures that reflect the value of the participant in the project were calculated. Summarising the performed calculations and analyses of the measures of centrality, it is necessary to emphasise the following: The centrality measures “Project manager”, “Chief engineer”, “Construction site manager”, “Construction works manager” and “Architect” were the greatest in comparison with other network participants across all four measures. On the one hand, this organisational structure of communication can be considered correct because the main information flows through the project managers, who make the decisions. On the other hand, this indicates a significant dependence of the construction project on these participants and, in the event of certain risk events, may lead to a decrease in the efficiency of its implementation. In addition, large values of centrality measures indicate a significant information load, which can lead to communication overload. Communication overload is a situation where the subject of communication receives more content than it can control. It is recommended to analyse the project’s communication network several times, starting from the initial stages of the project’s implementation. When identifying various kinds of dysfunctions and deviations (low values of the centrality of nodes when these indicators should be high, or vice versa), the project manager needs to thoroughly analyse the causes and their possible impact on the success of the project.
Author Contributions
Conceptualisation, R.T. and O.K. (Oleksandr Khomenko); methodology, Y.T., M.D., O.K. (Oleksandr Khomenko), N.K. and R.T.; software, H.P., D.P., O.K. (Oleksii Kulikov), G.R., O.O. and N.K.; validation, H.P., M.D., D.P., O.K. (Oleksii Kulikov), G.R., O.K. (Oleksandr Khomenko), O.O. and N.K.; formal analysis, Y.T. and M.D.; investigation, Y.T., M.D., H.P., R.T. and N.K.; resources, D.P., G.R., O.K. (Oleksandr Khomenko), O.O. and N.K.; data curation, Y.T., H.P., R.T. and O.K. (Oleksii Kulikov); writing—original draft preparation, Y.T. and O.O.; writing—review and editing, R.T.; visualisation, H.P., D.P., O.K. (Oleksii Kulikov), G.R. and L.S; supervision, H.P., M.D., D.P., O.K. (Oleksii Kulikov), G.R., O.K. (Oleksandr Khomenko), O.O. and N.K.; funding acquisition Y.T, R.T., D.P., O.K. (Oleksii Kulikov), G.R. and O.K. (Oleksandr Khomenko). All authors have read and agreed to the published version of the manuscript.
Funding
This research received no external funding.
Institutional Review Board Statement
Not applicable.
Informed Consent Statement
Not applicable.
Data Availability Statement
The datasets generated and analysed during the current study are available from the authors upon reasonable request.
Conflicts of Interest
The authors declare no conflict of interest.
Appendix A
Table A1.
The adjacency matrix of indicator “communication quality” of construction project participants.
Table A1.
The adjacency matrix of indicator “communication quality” of construction project participants.
| # of Project Member | 1 | 2 | 3 | 4 | 5 | 6 | 7 | 8 | 9 | 10 | 11 | 12 | 13 | 14 | 15 | 16 | 17 |
|---|---|---|---|---|---|---|---|---|---|---|---|---|---|---|---|---|---|
| 1 | 0.000 | 0.399 | 0.399 | 0.450 | 0.750 | 0.841 | 0.591 | 0.000 | 0.000 | 0.000 | 0.000 | 0.000 | 0.000 | 0.000 | 0.000 | 0.000 | 0.000 |
| 2 | 0.399 | 0.000 | 0.950 | 0.659 | 0.659 | 0.277 | 0.723 | 0.723 | 0.450 | 0.591 | 0.277 | 0.659 | 0.659 | 0.944 | 0.944 | 0.723 | 0.659 |
| 3 | 0.399 | 0.950 | 0.000 | 0.944 | 0.341 | 0.500 | 0.841 | 0.950 | 0.659 | 0.659 | 0.953 | 0.791 | 0.000 | 0.000 | 0.000 | 0.000 | 0.000 |
| 4 | 0.450 | 0.659 | 0.944 | 0.000 | 0.944 | 0.659 | 0.723 | 0.399 | 0.277 | 0.659 | 0.750 | 0.659 | 0.000 | 0.000 | 0.000 | 0.000 | 0.000 |
| 5 | 0.750 | 0.659 | 0.341 | 0.944 | 0.000 | 0.591 | 0.000 | 0.000 | 0.000 | 0.000 | 0.000 | 0.000 | 0.000 | 0.000 | 0.000 | 0.000 | 0.000 |
| 6 | 0.841 | 0.277 | 0.500 | 0.659 | 0.591 | 0.000 | 0.953 | 0.944 | 0.450 | 0.500 | 0.591 | 0.841 | 0.659 | 0.841 | 0.000 | 0.000 | 0.000 |
| 7 | 0.591 | 0.723 | 0.841 | 0.723 | 0.000 | 0.953 | 0.000 | 0.659 | 0.000 | 0.000 | 0.000 | 0.000 | 0.000 | 0.000 | 0.953 | 0.277 | 0.500 |
| 8 | 0.000 | 0.723 | 0.950 | 0.399 | 0.000 | 0.944 | 0.659 | 0.000 | 0.000 | 0.000 | 0.000 | 0.000 | 0.000 | 0.000 | 0.500 | 0.950 | 0.791 |
| 9 | 0.000 | 0.450 | 0.659 | 0.277 | 0.000 | 0.450 | 0.000 | 0.000 | 0.000 | 0.000 | 0.953 | 0.723 | 0.000 | 0.000 | 0.000 | 0.000 | 0.000 |
| 10 | 0.000 | 0.591 | 0.659 | 0.659 | 0.000 | 0.500 | 0.000 | 0.000 | 0.000 | 0.000 | 0.000 | 0.000 | 0.000 | 0.000 | 0.000 | 0.000 | 0.000 |
| 11 | 0.000 | 0.277 | 0.953 | 0.750 | 0.000 | 0.591 | 0.000 | 0.000 | 0.953 | 0.000 | 0.000 | 0.000 | 0.000 | 0.000 | 0.000 | 0.000 | 0.000 |
| 12 | 0.000 | 0.659 | 0.791 | 0.659 | 0.000 | 0.841 | 0.000 | 0.000 | 0.723 | 0.000 | 0.000 | 0.000 | 0.000 | 0.000 | 0.000 | 0.000 | 0.000 |
| 13 | 0.000 | 0.659 | 0.000 | 0.000 | 0.000 | 0.659 | 0.000 | 0.000 | 0.000 | 0.000 | 0.000 | 0.000 | 0.000 | 0.791 | 0.000 | 0.000 | 0.000 |
| 14 | 0.000 | 0.944 | 0.000 | 0.000 | 0.000 | 0.841 | 0.000 | 0.000 | 0.000 | 0.000 | 0.000 | 0.000 | 0.791 | 0.000 | 0.723 | 0.944 | 0.500 |
| 15 | 0.000 | 0.944 | 0.000 | 0.000 | 0.000 | 0.000 | 0.953 | 0.500 | 0.000 | 0.000 | 0.000 | 0.000 | 0.000 | 0.723 | 0.000 | 0.450 | 0.591 |
| 16 | 0.000 | 0.723 | 0.000 | 0.000 | 0.000 | 0.000 | 0.277 | 0.950 | 0.000 | 0.000 | 0.000 | 0.000 | 0.000 | 0.944 | 0.450 | 0.000 | 0.841 |
| 17 | 0.000 | 0.659 | 0.000 | 0.000 | 0.000 | 0.000 | 0.500 | 0.791 | 0.000 | 0.000 | 0.000 | 0.000 | 0.000 | 0.500 | 0.591 | 0.841 | 0.000 |
Table A2.
The numbering of construction project participants.
Table A2.
The numbering of construction project participants.
| Project Member | # of Project Member |
|---|---|
| General construction supervision | 1 |
| Project manager | 2 |
| Construction site manager | 3 |
| Construction works manager | 4 |
| Construction engineer | 5 |
| Architect | 6 |
| Chief Engineer | 7 |
| Design office | 8 |
| Chief mechanical engineer | 9 |
| Surveyor department | 10 |
| Safety Engineer | 11 |
| Delivery Manager | 12 |
| Estimate office | 13 |
| Construction engineer | 14 |
| Electrical installation design office | 15 |
| Plumbing installation design office | 16 |
| Gas installation design office | 17 |
References
- Badir, Y.F.; Büchel, B.; Tucci, C.L. A Conceptual Framework of the Impact of NPD Project Team and Leader Empowerment on Communication and Performance: An Alliance Case Context. Int. J. Proj. Manag. 2012, 30, 914–926. [Google Scholar] [CrossRef]
- Trach, R.; Lendo-Siwicka, M.; Pawluk, K.; Bilous, N. Assessment of the Effect of Integration Realisation in Construction Projects. Teh. Glas. 2019, 13, 254–259. [Google Scholar] [CrossRef]
- Trach, R.; Pawluk, K.; Lendo-Siwicka, M. The Assessment of the Effect of BIM and IPD on Construction Projects in Ukraine. Int. J. Constr. Manag. 2020, 22, 1844–1851. [Google Scholar] [CrossRef]
- Trach, R.; Polonski, M.; Hrytsiuk, P. Modelling of Efficiency Evaluation of Traditional Project Delivery Methods and Integrated Project Delivery (IPD). IOP Conf. Ser. Mater. Sci. Eng. 2019, 471, 112043. [Google Scholar] [CrossRef]
- Martin, H.; Lewis, T.M.; Fifi, J. Centralized versus Decentralized Construction Project Structure—Easing Communication Difficulties. Int. J. Constr. Manag. 2014, 14, 156–170. [Google Scholar] [CrossRef]
- Men, L.R.; Stacks, D. The Effects of Authentic Leadership on Strategic Internal Communication and Employee-Organization Relationships. J. Public Relat. Res. 2014, 26, 301–324. [Google Scholar] [CrossRef]
- Motawa, I.; Almarshad, A. Case-Based Reasoning and BIM Systems for Asset Management. Built Environ. Proj. Asset Manag. 2015, 5, 233–247. [Google Scholar] [CrossRef]
- Kennedy, D.M.; McComb, S.A.; Vozdolska, R.R. An Investigation of Project Complexity’s Influence on Team Communication Using Monte Carlo Simulation. J. Eng. Technol. Manag. 2011, 28, 109–127. [Google Scholar] [CrossRef]
- Järvenpää, A.-T.; Pavlik, A.; Gustavsson, T.K. Contextual Communicative Competence in Multinational Infrastructure Projects. Buildings 2021, 11, 403. [Google Scholar] [CrossRef]
- Kapogiannis, G.; Sherratt, F. Impact of Integrated Collaborative Technologies to Form a Collaborative Culture in Construction Projects. Built Environ. Proj. Asset Manag. 2018, 8, 24–38. [Google Scholar] [CrossRef]
- Trach, R.; Pawluk, K.; Lendo-Siwicka, M. Causes of Rework in Construction Projects in Ukraine. Arch. Civ. Eng. 2019, 65, 61–74. [Google Scholar] [CrossRef]
- Trach, R.; Lendo-Siwicka, M. Centrality of a Communication Network of Construction Project Participants and Implications for Improved Project Communication. Civil Eng. Environ. Syst. 2021, 38, 145–160. [Google Scholar] [CrossRef]
- Thomas, S.R.; Tucker, R.L.; Kelly, W.R. Critical Communications Variables. J. Constr. Eng. Manag. 1998, 124, 58–66. [Google Scholar] [CrossRef]
- Porter, T.W.; Lilly, B.S. The Effects of Conflict, Trust, and Task Commitment on Project Team Performance. Int. J. Confl. Manag. 1996, 7, 361–376. [Google Scholar] [CrossRef]
- Trach, R.; Trach, Y.; Lendo-Siwicka, M. Using ANN to Predict the Impact of Communication Factors on the Rework Cost in Construction Projects. Energies 2021, 14, 4376. [Google Scholar] [CrossRef]
- Armstrong, M.; Taylor, S. A Handbook of Human Resource Management Practices; Kogan Page Limited: London, UK, 2003. [Google Scholar]
- Nam, C.S.; Lyons, J.B.; Hwang, H.-S.; Kim, S. The Process of Team Communication in Multi-Cultural Contexts: An Empirical Study Using Bales’ Interaction Process Analysis (IPA). Int. J. Ind. Ergon. 2009, 39, 771–782. [Google Scholar] [CrossRef]
- Mortaheb, M.M.; Rahimi, M. Interface Management in Mega Oil Refinery Projects. In Proceedings of the 6th International Project Management Conference, Tehran, Iran, 16 January 2010; pp. 26–27. [Google Scholar]
- Senescu, R.R.; Aranda-Mena, G.; Haymaker, J.R. Relationships between Project Complexity and Communication. J. Manag. Eng. 2013, 29, 183–197. [Google Scholar] [CrossRef]
- Mohr, J.J.; Sohi, R.S. Communication Flows in Distribution Channels: Impact on Assessments of Communication Quality and Satisfaction. J. Retail. 1995, 71, 393–415. [Google Scholar] [CrossRef]
- Xie, C.; Wu, D.; Luo, J.; Hu, X. A Case Study of Multi-team Communications in Construction Design under Supply Chain Partnering. Supply Chain. Manag. Int. J. 2010, 15, 363–370. [Google Scholar] [CrossRef]
- Hosseini, M.R.; Zavadskas, E.K.; Xia, B.; Chileshe, N.; Mills, A. Communications in Hybrid Arrangements: Case of Australian Construction Project Teams. Eng. Econ. 2017, 28, 290–300. [Google Scholar] [CrossRef]
- Aubert, B.; Hooper, V.; Schnepel, A. Revisiting the Role of Communication Quality in ERP Project Success. Am. J. Bus. 2013, 28, 64–85. [Google Scholar] [CrossRef]
- Sonnenwald, D.H. Communication Roles That Support Collaboration during the Design Process. Des. Stud. 1996, 17, 277–301. [Google Scholar] [CrossRef]
- Thomas, S.R.; Tucker, R.L.; Kelly, W.R. Compass: An Assessment Tool for Improving Project Team Communications. Proj. Manag. J. 1999, 30, 15–24. [Google Scholar] [CrossRef]
- Kwofie, T.E.; Aigbavboa, C.; Baiden-Amissah, A. Ontology of the Communication Performance Prospects of Building Information Modelling Adoption among Project Teams in Construction Project Delivery. J. Constr. Dev. Ctries. 2020, 25, 21–43. [Google Scholar] [CrossRef]
- Ma, X.; Li, X.; Yuan, H.; Huang, Z.; Zhang, T. Justifying the Effective Use of Building Information Modelling (BIM) with Business Intelligence. Buildings 2022, 13, 87. [Google Scholar] [CrossRef]
- El-Saboni, M.; Aouad, G.; Sabouni, A. Electronic Communication Systems Effects on the Success of Construction Projects in United Arab Emirates. Adv. Eng. Inform. 2009, 23, 130–138. [Google Scholar] [CrossRef]
- Davies, K.; McMeel, D.J.; Wilkinson, S. Making Friends with Frankenstein: Hybrid Practice in BIM. ECAM 2017, 24, 78–93. [Google Scholar] [CrossRef]
- Bråthen, K.; Moum, A. Bridging the Gap: Bringing BIM to Construction Workers. ECAM 2016, 23, 751–764. [Google Scholar] [CrossRef]
- Becerik-Gerber, B.; Gerber, D.J.; Ku, K. The Pace of Technological Innovation in Architecture, Engineering, and Construction Education: Integrating Recent Trends into the Curricula. J. Inf. Technol. Constr. 2011, 16, 411–432. [Google Scholar]
- Goguen, J.A. L. A. Zadeh. Fuzzy Sets. Information and Control, Vol. 8 (1965), pp. 338–353.—L. A. Zadeh. Similarity Relations and Fuzzy Orderings. Information Sciences, Vol. 3 (1971), pp. 177–200. J. Symb. Log. 1973, 38, 656–657. [Google Scholar] [CrossRef]
- Zadeh, L.A. Is There a Need for Fuzzy Logic? Inf. Sci. 2008, 178, 2751–2779. [Google Scholar] [CrossRef]
- Trach, R.; Trach, Y.; Kiersnowska, A.; Markiewicz, A.; Lendo-Siwicka, M.; Rusakov, K. A Study of Assessment and Prediction of Water Quality Index Using Fuzzy Logic and ANN Models. Sustainability 2022, 14, 5656. [Google Scholar] [CrossRef]
- Baykasoglu, A.; Dereli, T.; Das, S. Project Team Selection Using Fuzzy Optimization Approach. Cybern. Syst. 2007, 38, 155–185. [Google Scholar] [CrossRef]
- Radziszewska-Zielina, E.; Szewczyk, B. Controlling Partnering Relations in Construction Operations Using Fuzzy Reasoning. Arch. Civ. Eng. 2015, 61, 89–104. [Google Scholar] [CrossRef]
- Gajzler, M.; Zima, K. Evaluation of Planned Construction Projects Using Fuzzy Logic. Int. J. Civ. Eng. 2017, 15, 641–652. [Google Scholar] [CrossRef]
- Rahim, A.A.; Musa, S.N.; Ramesh, S.; Lim, M.K. Development of a Fuzzy-TOPSIS Multi-Criteria Decision-Making Model for Material Selection with the Integration of Safety, Health and Environment Risk Assessment. Proc. Inst. Mech. Eng. Part L J. Mater. Des. Appl. 2021, 235, 1532–1550. [Google Scholar] [CrossRef]
- Loosemore, M. Social Network Analysis: Using a Quantitative Tool within an Interpretative Context to Explore the Management of Construction Crises. Eng. Constr. Archit. Manag. 1998, 5, 315–326. [Google Scholar] [CrossRef]
- Abbsaian-Hosseini, S.A.; Liu, M.; Hsiang, S.M. Social Network Analysis for Construction Crews. Int. J. Constr. Manag. 2019, 19, 113–127. [Google Scholar] [CrossRef]
- Pryke, S.; Badi, S.; Almadhoob, H.; Soundararaj, B.; Addyman, S. Self-Organizing Networks in Complex Infrastructure Projects. Proj. Manag. J. 2018, 49, 18–41. [Google Scholar] [CrossRef]
- Śladowski, G.; Radziszewska-Zielina, E.; Kania, E. Analysis of Self-Organising Networks of Communication Between the Participants of a Housing Complex Construction Project. Arch. Civ. Eng. 2019, 65, 181–195. [Google Scholar] [CrossRef]
- Radziszewska-Zielina, E.; Śladowski, G.; Kania, E.; Sroka, B.; Szewczyk, B. Managing Information Flow in Self-Organising Networks of Communication Between Construction Project Participants. Arch. Civ. Eng. 2019, 65, 133–148. [Google Scholar] [CrossRef]
- Lu, W.; Xu, J.; Söderlund, J. Exploring the Effects of Building Information Modeling on Projects: Longitudinal Social Network Analysis. J. Constr. Eng. Manag. 2020, 146, 04020037. [Google Scholar] [CrossRef]
- Tai, S.; Wang, Y.; Anumba, C. A Survey on Communications in Large-scale Construction Projects in China. Eng. Constr. Archit. Manag. 2009, 16, 136–149. [Google Scholar] [CrossRef]
- Du, J.; Zhao, D.; Issa, R.R.A.; Singh, N. BIM for Improved Project Communication Networks: Empirical Evidence from Email Logs. J. Comput. Civ. Eng. 2020, 34, 04020027. [Google Scholar] [CrossRef]
- Jafari, P.; Mohamed, E.; Lee, S.; Abourizk, S. Social Network Analysis of Change Management Processes for Communication Assessment. Autom. Constr. 2020, 118, 103292. [Google Scholar] [CrossRef]
- Freeman, L.C. Centrality in Social Networks Conceptual Clarification. Soc. Netw. 1978, 1, 215–239. [Google Scholar] [CrossRef]
- Bonacich, P. Power and Centrality: A Family of Measures. Am. J. Sociol. 1987, 92, 1170–1182. [Google Scholar] [CrossRef]
- Freeman, L.C. A Set of Measures of Centrality Based on Betweenness. Sociometry 1977, 40, 35–41. [Google Scholar] [CrossRef]
- Trach, Y.; Trach, R.; Kalenik, M.; Koda, E.; Podlasek, A. A Study of Dispersed, Thermally Activated Limestone from Ukraine for the Safe Liming of Water Using ANN Models. Energies 2021, 14, 8377. [Google Scholar] [CrossRef]
- Page, L.; Brin, S.; Motwani, R.; Winograd, T. The PageRank Citation Ranking: Bringing Order to the Web. Available online: http://ilpubs.stanford.edu:8090/422/ (accessed on 30 April 2021).
- Mamdani, E.H. Application of Fuzzy Algorithms for Control of Simple Dynamic Plant. Proc. Inst. Electr. Eng. 1974, 121, 1585–1588. [Google Scholar] [CrossRef]
- Fruchterman, T.M.J.; Reingold, E.M. Graph Drawing by Force-Directed Placement. Softw. Pract. Exp. 1991, 21, 1129–1164. [Google Scholar] [CrossRef]
- Kadushin, C. Understanding Social Networks: Theories, Concepts, and Findings; Oxford University Press: Cary, NC, USA, 2012; ISBN 978-0-19-537947-1. [Google Scholar]
- Hossain, L. Communications and Coordination in Construction Projects. Constr. Manag. Econ. 2009, 27, 25–39. [Google Scholar] [CrossRef]
- Rahimian, A.; Hosseini, M.R.; Martek, I.; Taroun, A.; Alvanchi, A.; Odeh, I. Predicting Communication Quality in Construction Projects: A Fully-Connected Deep Neural Network Approach. Autom. Constr. 2022, 139, 104268. [Google Scholar] [CrossRef]


Disclaimer/Publisher’s Note: The statements, opinions and data contained in all publications are solely those of the individual author(s) and contributor(s) and not of MDPI and/or the editor(s). MDPI and/or the editor(s) disclaim responsibility for any injury to people or property resulting from any ideas, methods, instructions or products referred to in the content. |
© 2023 by the authors. Licensee MDPI, Basel, Switzerland. This article is an open access article distributed under the terms and conditions of the Creative Commons Attribution (CC BY) license (https://creativecommons.org/licenses/by/4.0/).