Article

A Universal Aquaculture Environmental Anomaly Monitoring System

National Engineering Research Center for Marine Aquaculture, Zhejiang Ocean University, Zhoushan 316022, China
*
Author to whom correspondence should be addressed.
Sustainability 2023, 15(7), 5678; https://doi.org/10.3390/su15075678
Submission received: 27 February 2023 / Revised: 15 March 2023 / Accepted: 20 March 2023 / Published: 24 March 2023

Abstract

:
The current aquaculture environment anomaly monitoring system is limited in function, making it difficult to provide overall technical support for the sustainable development of aquaculture ecosystems. This paper designs a set for an IoT-based aquaculture environment monitoring device. The device is capable of collecting five aquaculture environment factors such as water temperature, pH, salinity, dissolved oxygen and light intensity throughout the day by wireless data transmission via 4G DTU with a communication success rate of 92.08%. A detection method based on time series sliding window density clustering (STW-DBSCAN) is proposed for anomaly detection, using the confidence interval distance radius of slope to extract subsequence timing features and identify the suspected abnormal subsequences and then further determine the anomalous value by the DBSCAN clustering method. The detection results show that the algorithm can accurately identify abnormal subsequences and outliers, and the accuracy, recall and F1-Score are 87.71%, 82.58% and 85.06%, respectively, which verifies the usability of the proposed method. Further, a fuzzy control algorithm is adopted to specify the warning information, and a software platform is developed based on data visualization. The platform uses WebSocket technology to interact with the server, and combined with the surveillance camera, it can monitor the aquaculture environment and perform data monitoring and analysis in a real-time, accurate and comprehensive manner, which can provide theoretical reference and technical support for sustainable development of aquaculture.

1. Introduction

The survey data released by the Food and Agriculture Organization of the United Nations (FAO) shows that aquaculture is one of the fastest-growing food production areas in the world. By 2014, world aquaculture production had surpassed fishery catch production [1]. However, the current small-scale aquaculture cannot meet the production supply, and the pursuit of too intensive culture environment will inevitably deteriorate water quality, which will lead to fish mortality, environmental degradation, and other adverse effects [2]. In addition, the aquaculture ecological environment in many countries has long been marginalized, fragmented and subordinated, lacking a shared level of aquaculture major research database, research data and research results. The support capacity to respond to the sustainable development of the aquaculture environment and adjustable demand is weak [3]. The wireless monitoring system has been the mainstream of development, where the wireless sensor network incorporates sensing technology, embedded computing technology, modern network technology, wireless communication technology and distributed intelligent information processing technology, etc., to work in a long-term unattended state [4]. Therefore, many aquaculture monitoring systems have been designed and developed, with the advantages of low cost [5], multi-perception [6], convenient deployment [7], durable endurance [8], intelligent parameter prediction [9] and long sensor life [10], which help aquaculture farmers understand enough environmental information [11].
The various monitoring methods or technologies mentioned in the above aquaculture monitoring systems are avant-garde to an extent, but the abnormal monitoring of water quality monitoring systems and how to deal with effective early warnings brought by data anomalies are less studied. The current common form of monitoring and warning is issuing a water quality parameter outside the set range after the alarm [12]. The actual situation is that during the experiment, the process of transmitting data from the sensor to the processor will consume a certain amount of time, resulting in random delays. In addition, due to system software and hardware failure and other reasons, the sensor or transmission network will be disturbed by noise, resulting in certain abnormal data and missing data, which causes certain difficulties in monitoring and analysis [13]. Therefore, it is particularly important to detect outliers in the collected data. Currently, the feature extraction methods of time series are mainly based on statistical features, prediction models, feature transformation and sequence segmentation [14]. The Sliding Time Window (STW) method belongs to sequence segmentation, which divides the data into multiple time windows in time order; each time window contains multiple time points and selects the data in the current time window as the analysis data set [15]. The principle of this one is easy to understand, and the calculation is simple compared with other ones, which reduces the time complexity. Moreover, it enables the online detection of time series anomalies by statically dynamic data streams [14]. In the process of aquaculture, owing to factors such as the environmental weather, fish behavior and human intervention, water quality changes continuously and in real-time and has uncertainties. Moreover, in the early warning analysis, a normal sensor should not fail to collect data many times in a time window, so the density-based clustering algorithm can better identify the outliers. The clustering algorithm DBSCAN has fast detection speed, does not need to specify the number of clusters, and is suitable for anomaly detection of water quality data in larger data sets [16]. In addition, it is also very important to make decisions after finding abnormal water quality data. Fuzzy control is a control strategy that uses language to induct operators. It does not need to establish an accurate mathematical model of the controlled object but only requires that the experience and data of on-site operators are summarized into relatively complete linguistic control rules to control the controlled object with uncertainty, nonlinearity, time-variability and noise [17]. It is widely used in weather forecasting [18], investment analysis [19] and mechanical control [20]. The warning system can calculate the warning score through the fuzzy control strategy when abnormal points are detected [21].
Therefore, in this study, a real-time visual monitoring system is designed for the aquaculture environment. The system uses STM32F407 as the control module and a combination of RS-232, RS-485 and TCP/IP for data transmission, and it stores aquaculture environmental information on the Ali cloud server. Meanwhile, the client is built with the Browser/Server (B/S) architecture, and real-time data are transmitted through WebSocket two-way communication technology, thus realizing the functions of automatic monitoring, digital management, intelligent warning and online query and analysis. The goal of this system is to maximize the solution to aquaculture issues such as not being able to monitor the water quality in real-time, the analysis of changes in water quality parameters, early warning difficulties and other aquaculture difficulties. The system can help by allowing aquaculture industry personnel to obtain accurate, real-time data, significantly reduce the workload of manual inspection and testing, improve the timeliness of equipment control, effectively save energy, reduce losses and maintain the sustainable development of aquaculture. In addition, the system uses solar photovoltaic power generation to form a continuous output of clean energy on the water and high-quality aquatic products underwater, providing a new development space for aquaculture with clean, low-carbon and efficient features. Unlike previous studies on aquaculture environmental monitoring systems, the main novelty of this study is that a detection method based on STW-DBSCMAN is proposed based on abnormal data. Meanwhile, a fuzzy control strategy is used to monitor the early warning indicators in real time and establish a comprehensive early warning model to solve the problem that the early warning mechanism of the current aquaculture environmental monitoring system is too brief to make more specific judgments or decisions in response to the early warning information.
The rest of this paper is organized as follows. The materials and methods of the detection system are described in Section 2; in particular, the hardware, software and algorithms are specified and demonstrated. Section 3 tests the usability and stability of the system and discusses the limitation of this work. Finally, Section 4 concludes about the design of the study.

2. Materials and Methods

2.1. Monitoring Devices Based on the Internet of Things

The monitoring equipment designed in this paper mainly includes the control module, the energy supply module, the wireless transmission module and the sensor module. The main hardware equipment is shown in Figure 1.
The figure shows a complete picture of the hardware device, especially zooming in on the main components, including the solar panel, the microcontroller (STM32F407), the sensor module, the 4G data transmission unit (USR-G780 V2), the solar controller and the lithium battery. To meet the needs of both freshwater and marine aquaculture and the functional requirements of the monitoring system, and considering the cost of hardware equipment and other factors, the design selects hardware equipment with good versatility, durability and corrosion resistance. The hardware devices used are shown in Table 1.

2.1.1. Control Module

The control module is the core of the hardware, which provides the interfaces for normal operations of the energy supply module, the sensor module, and the wireless transmission module. It mainly consists of the STM32F407 chip combined with the RS-232 and the RS-485 interfaces. The microcontroller STM32F407 simplifies the hardware design and the development environment for easy system programming. Its remote data transmission part fully utilizes the characteristics of Ethernet, such as high bandwidth, strong scalability, simple structure and low cost, which can realize multi-sensor remote real-time monitoring [22]. RS-485 makes up for the limited transmission distance of RS-232. Its transmission distance is up to 1200 m, and the maximum transmission speed can reach 10 Mb/s. Moreover, it can be networked on the bus to achieve multi-machine communication, and multiple transceivers are allowed to be hung on the bus, with strong anti-interference capability [23]. In the process of real-time water quality monitoring, the module provides data transmission and computing functions for system time setting of the lower computer, remote parameter setting of the upper computer, remote control of equipment and hardware and software interactions, while DMA transmission ensures the effectiveness and accuracy of the lower computer to transmit aquaculture environmental data.

2.1.2. Energy Supply Module

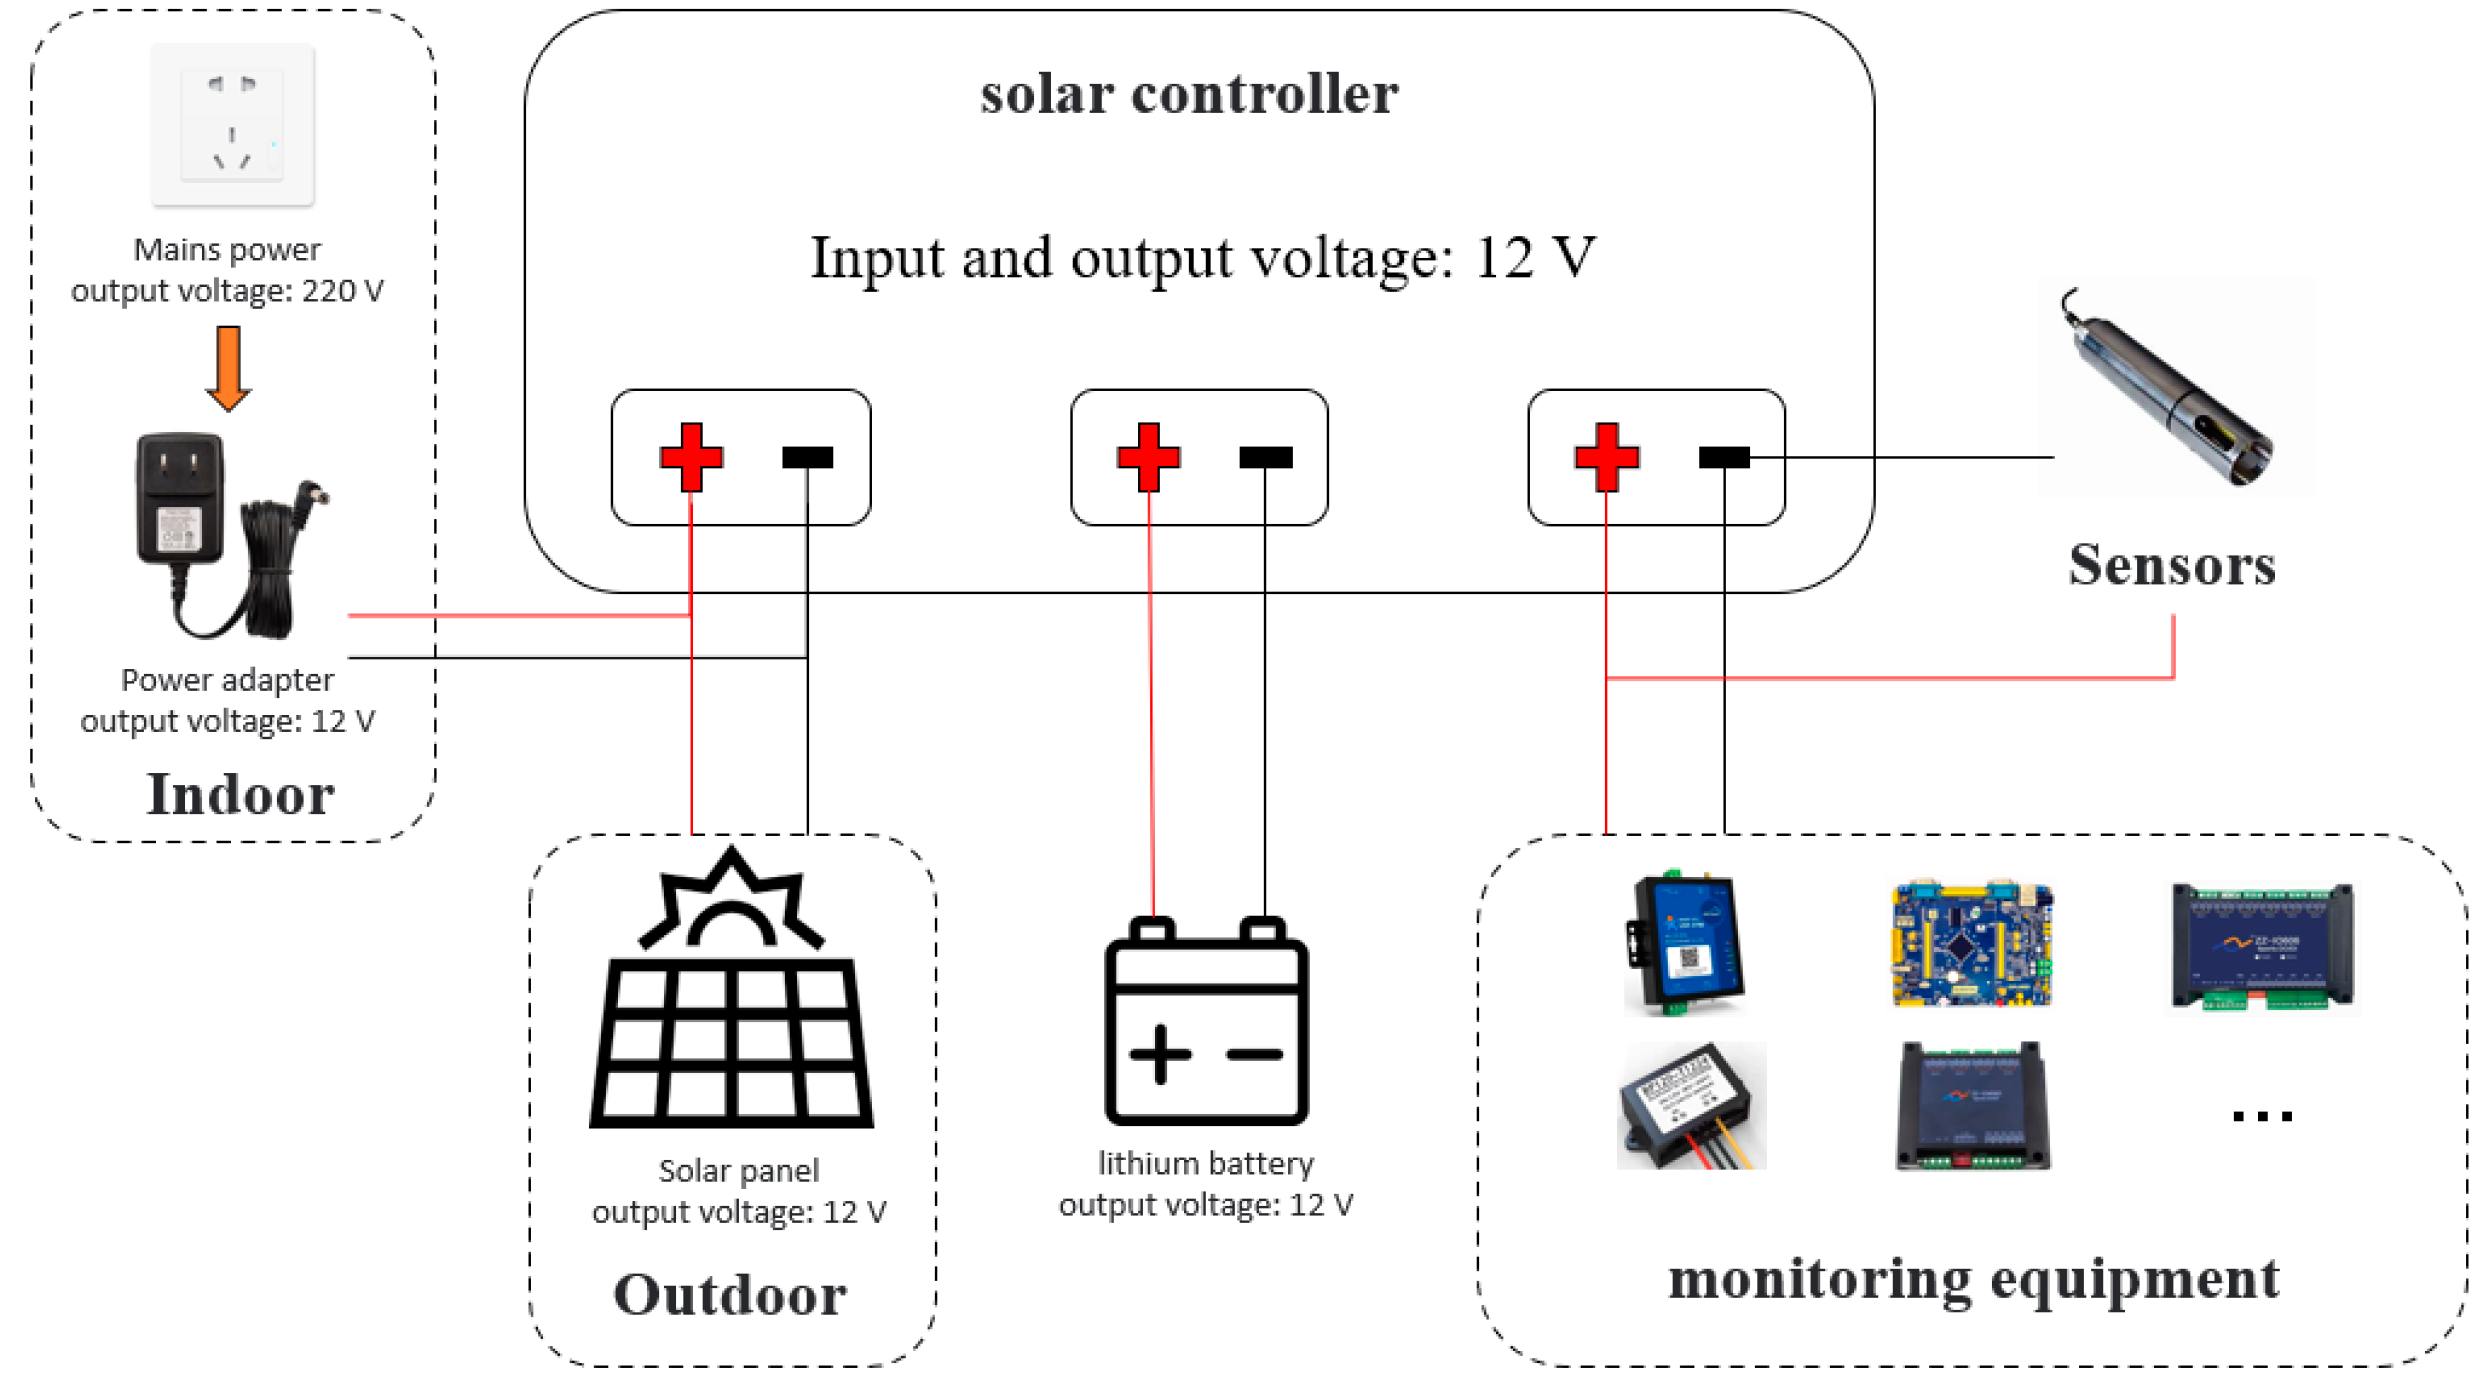
The energy supply module mainly consists of a solar panel, a 12 V lithium battery, dual power automatic switches, a 12 V switching power supply, a solar controller and a six-way controller. Four types of energy supply modes are supported: 220 V AC charging power, 220 V AC power, solar panel charging power and 220 V AC power combined with solar panel charging power. The solar panel can hardly provide electricity on non-sunny days and other low-light conditions, and the voltage and current provided by solar energy under strong light are large and need to be converted by solar controllers before use. The lithium battery can store solar energy better owing to its high thermal capacity and low self-discharge rate, and it is easy to replace and repair [24]. The 12 V adapter is generally used to connect to the 220 V power supply to charge power to the equipment indoors, and the solar charging power is used outdoors. In the actual aquaculture environment monitoring scenario, the use of a lithium battery can prevent the lack of power supply caused by indoor power outages or weak outdoor sunlight, etc. The diagram of the equipment’s power supply is shown in Figure 2.

2.1.3. Wireless Transmission Module

The wireless transmission module in this design adopts USR-G780 V2 (edge acquisition 4G DTU), and it has the advantages of edge computing, data penetration and automatic positioning. This 4G DTU is responsible for long-distance wireless communication between devices and remote computers. Its communication process is based on 4G wireless communication technology, which only requires a wireless network card to be plugged into the device and be in a fixed base station coverage area to connect to other modules via RS-232 for data transmission. In the data transmission process, the control module forms messages from the collected aquaculture environmental data and forwards them to the wireless transmission module through the RS-232 interface. The wireless transmission module acts as a TCP client and connects to the Tencent cloud server for data transmission via the TCP/IP protocol, and then the cloud server parses the data and stores them in the MySQL database.

2.1.4. Sensor Module

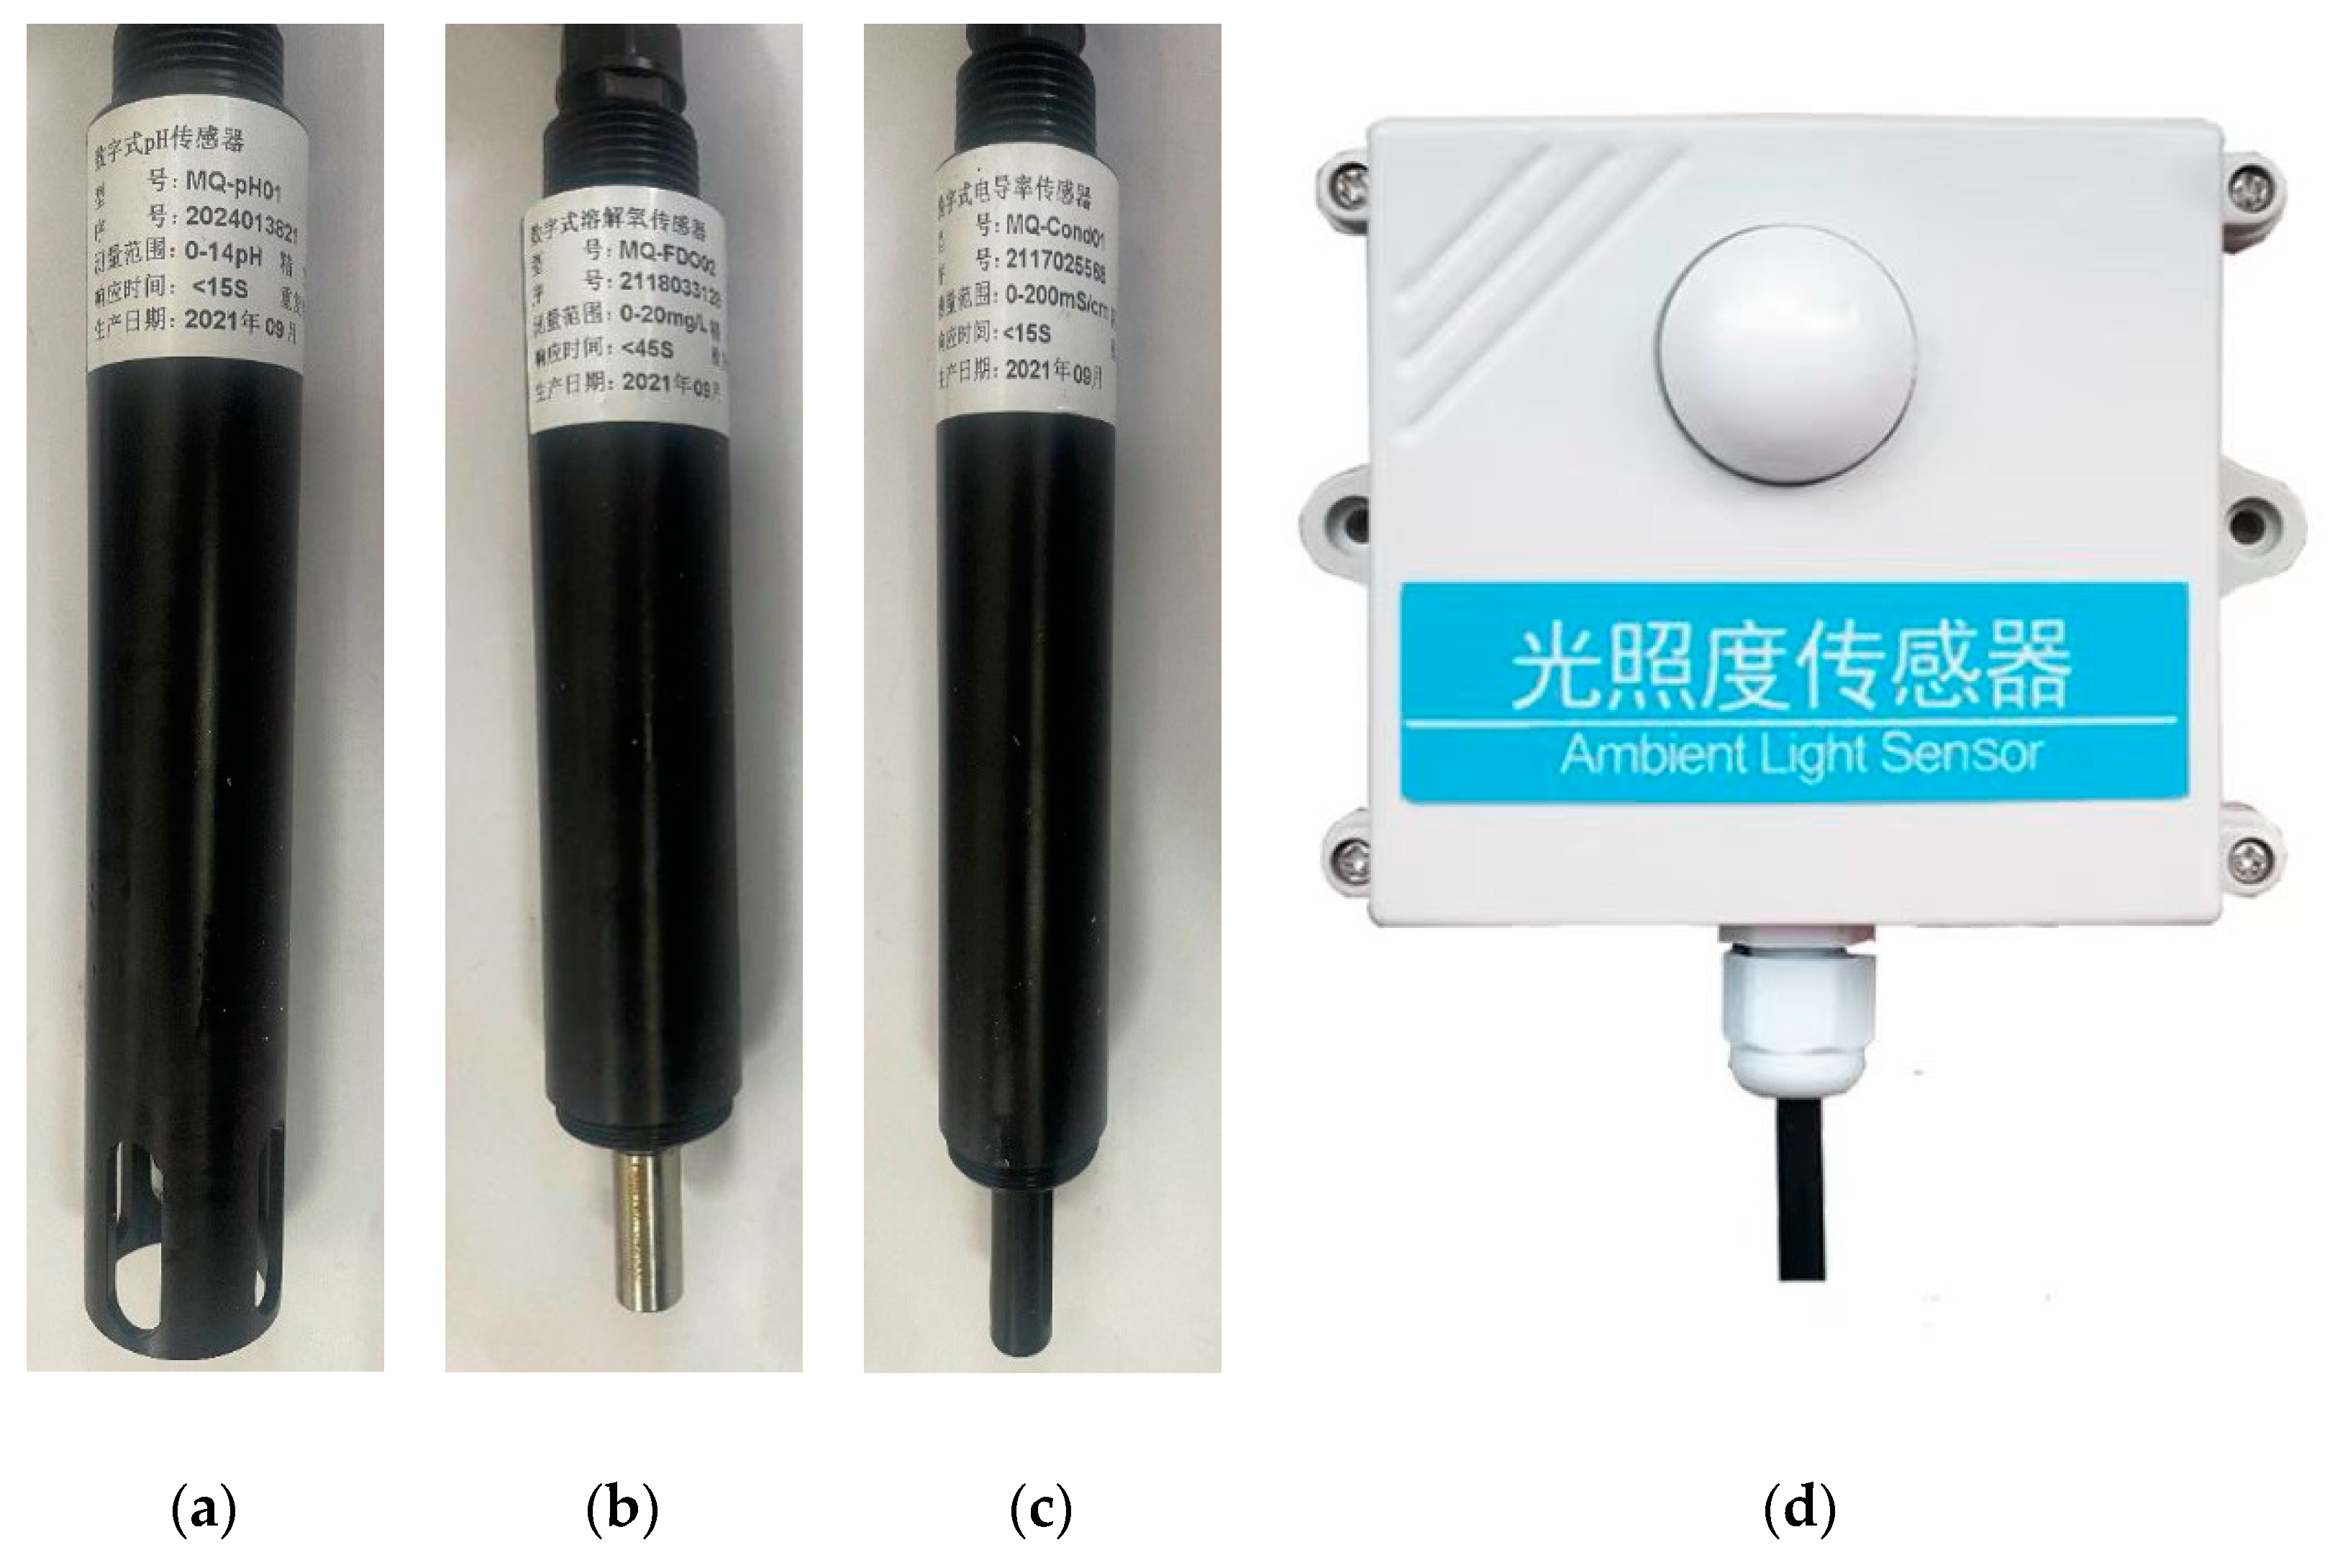
The sensor module includes a pH sensor, a dissolved oxygen sensor, a conductivity sensor and a light sensor, which are shown in Figure 3.
The pH sensor MQ-pH01, the dissolved oxygen sensor MQ-FDO01 and the conductivity sensor MQ-Cond01 all adopt the RS-485 communication interface and the standard Modbus protocol with corrosion-resistant housing for various harsh working environments. The pH sensor has a built-in PT1000 temperature sensor, the corresponding compensation algorithm, with an accuracy of ±0.1 °C. The reference electrode of the pH sensor is designed with double salt bridges, with a long electrode life; the dissolved oxygen sensor uses the optical method, so there is no need to replace the dissolved oxygen membrane, with the advantages of no electrolytes, short polarization time, fast response time, etc.; the electrode of the conductivity sensor has constant stability, automatic compensation for surface contact resistance and resistance to pollution. According to the relationship between salinity and Total Dissolved Solids (TDS), conductivity can be extended to measure salinity parameters in the water temperature range of 0~40 °C [25], and the conversion formula is shown in Equation (1):
s = 1.3888   ×   c 0.02478   ×   c   ×   t     6171.9
where s is the salinity value (calculated by NaCl in ppm); c is the electrical conductivity value in μs/cm; t is the current water temperature in °C.

2.1.5. Data Acquisition Method and Process

The hardware system in this design adopts the Modbus RTU protocol, which is the standard communication protocol in the industry, and the Modbus master–slave mode is used for data acquisition and equipment start-up and shutdown. The control module (STM32F407) is used as the host, and the sensor module and the controller are used as the slave. The slave is controlled by the host with a clear structure level. The slave information is presented in Table 2. The address of the digital pH sensor slave is 1; the address of the digital conductivity sensor slave is 2; the address of the digital dissolved oxygen sensor slave is 3; the address of the 485-type light level transmitter slave is 4; the address of the RS-485 four-way controller slave is 5, and the address of the RS-485 six-way controller slave is 6. The above checksum is CRC; the transmission type is “Float” or “Long”, and the storage mode is “small-end mode”.
The specific steps of data collection are as follows:
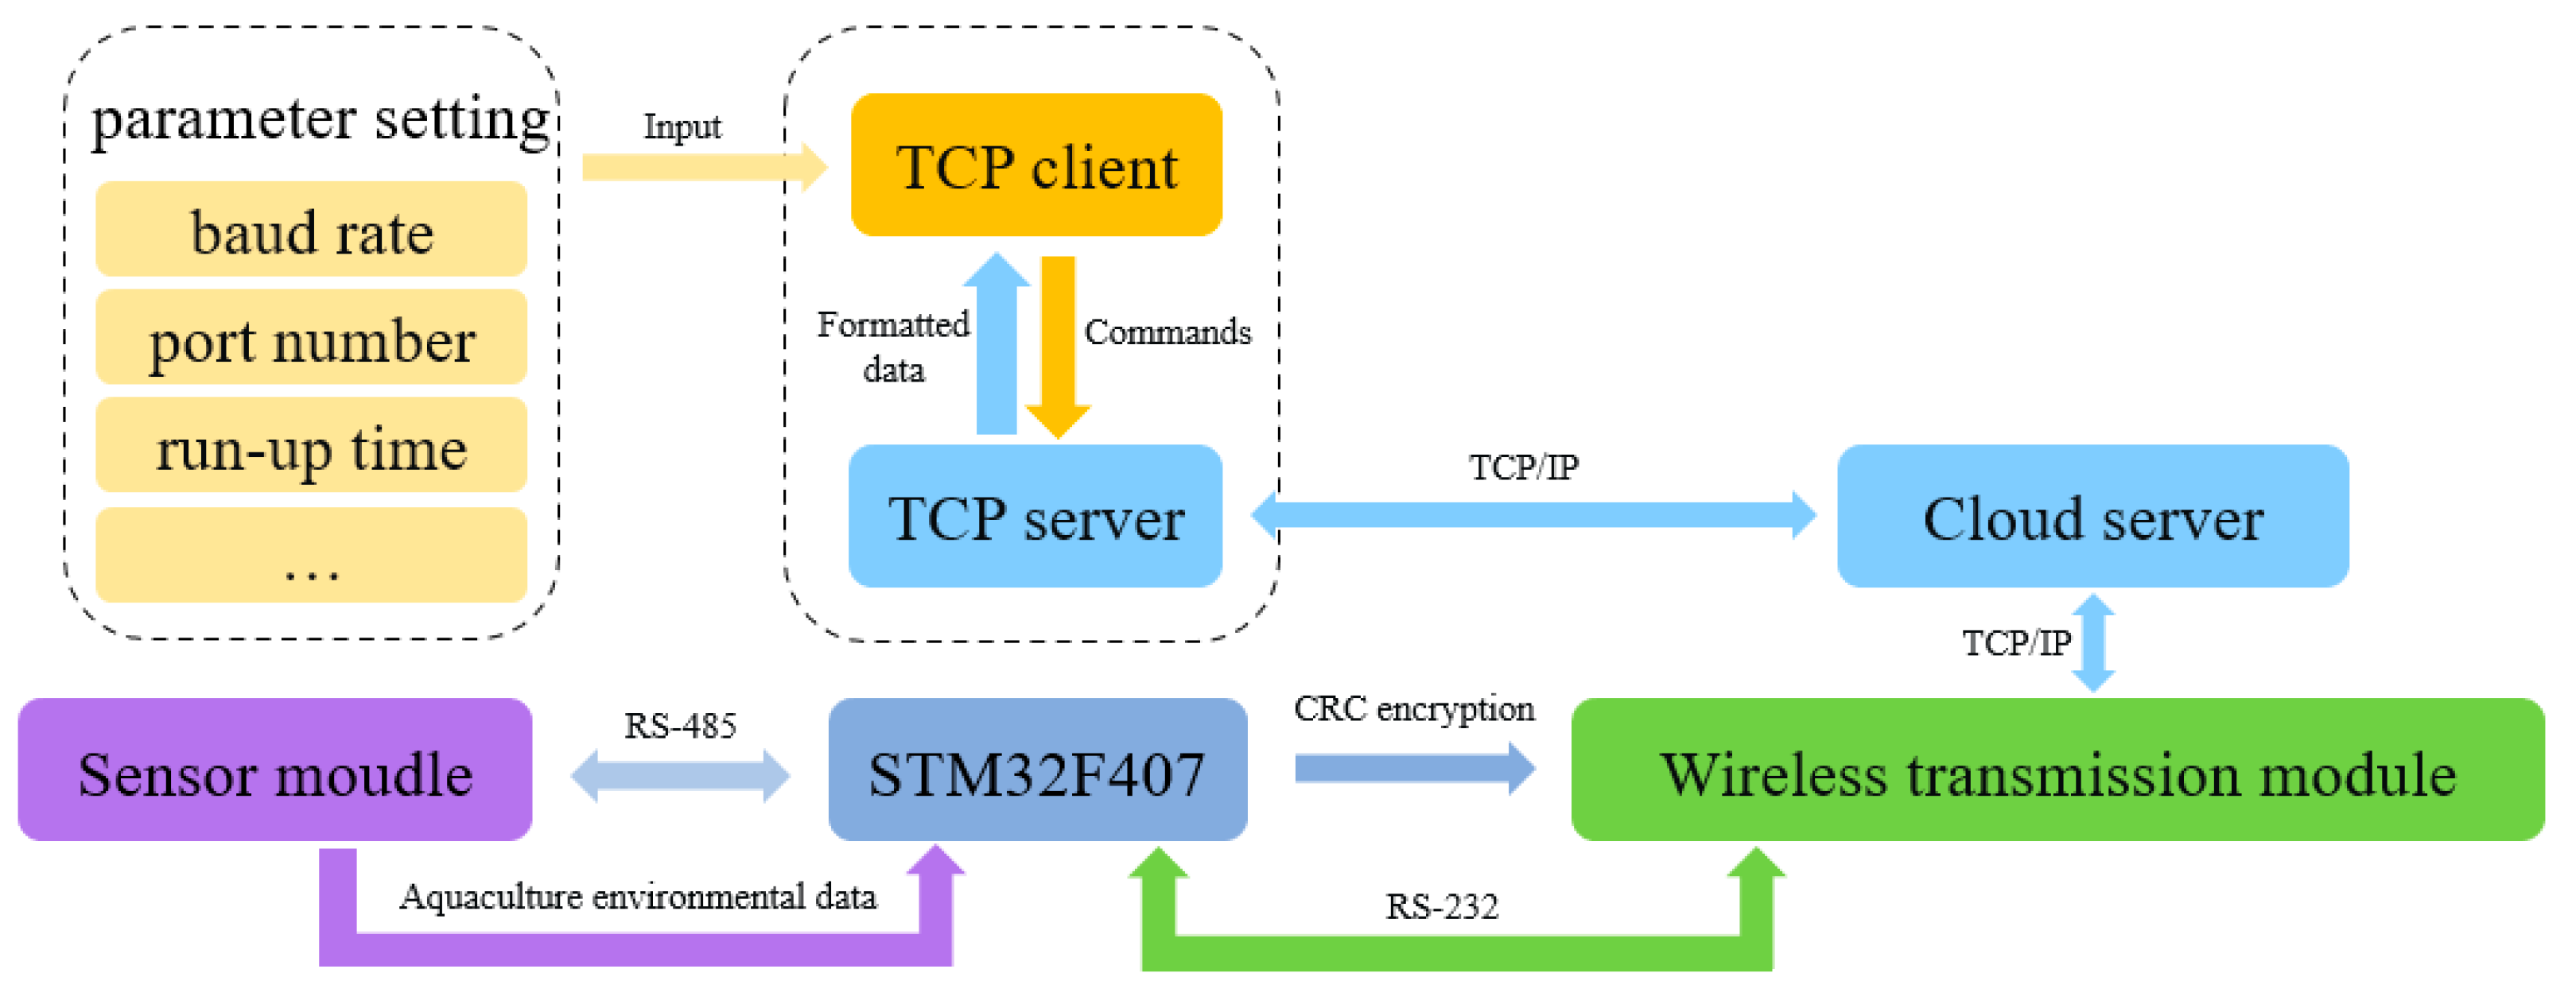
Step 1: The client sends a request to the server to collect data, and the request is transmitted to the host through the cloud server and the wireless sensor module. The request content are the Modbus host program parameters of STM32F407, such as baud rate, port number, start time, etc. At this time, the host (STM32F407) enters a cyclic state.
Step 2: When the RTC clock reaches the start time t, the host sends data acquisition signals to the sensor module one by one at an interval of 10 s. After a round of data acquisition of all sensors is completed, the data are encrypted into packets through the CRC low 16-bit verification.
Step 3: The host first sends the collected aquaculture environmental data to the wireless transmission module via the RS-232 interface, and then the messages are transmitted to the TCP server for data parsing via the wireless transmission module and the cloud server. The parsed formatted data are returned to the client for use.
The data transmission between the wireless transmission module, cloud server and client is realized through the TCP/IP protocol, where data from the client and hardware modules are forwarded by the cloud server, as shown in Figure 4.

2.2. Anomaly Detection Based on the STW-DBSCAN

In an aquaculture environment time series V of time length n, V(ti) is the aquaculture environment data collected by the sensor at the time ti(1 ≤ i ≤ n), and the time series is divided into m subseries W using a sliding time window, W = V1, V2, …, Vm−1, and the window size is l. The data slope-based approach is able to express the structural features of the subseries, but the slope information is distributed randomly, while the confidence interval is able to estimate the interval where the overall data are located with a certain degree of reliability [26,27].Therefore, this design partitions the time series into several subsequences and subsequently extracts the contaminant subsequence features using the confidence interval distance radius of the slope; it initially screens the anomalous subsequences by setting a threshold and finally uses the density-based clustering algorithm DBSCAN to identify the anomalous points in the anomalous subsequences. The specific operation process is as follows.
Input: time series V of an indicator of aquaculture environment, abnormal subsequence judgment threshold τ, sliding window length l.
Output: information about the abnormal value of this time series V.
Step 1: Select a certain subsequence Vj (1 ≤ j ≤ m) after sliding window segmentation, and calculate the slope ki between two adjacent points in the subsequence according to Equation (2).
k i = V j i     V j i     1 t i     t i     1 , 2 i l
Step 2: Based on step 1, l − 1 slope values are obtained, and then the confidence interval distance radius dj of the slope is calculated using Equation (3) to represent the characteristics of the time series in the current window.
d j = θ ¯ j     θ _ j 2
where | | is the absolute value operation; θ ¯ j is the upper confidence limit, which is calculated as shown in Equation (4); θ _ j is the lower confidence limit, which is calculated as shown in Equation (5).
θ ¯ j = s ¯ j + σ j l Z α 2
θ _ j = s ¯ j     σ j l Z α 2
where s ¯ j is the mean value of the slope of the jth subsequence; σ j is the mean squared error of the jth subsequence Vj; the random variable Z satisfies a normal distribution of N (0, 1); α is the confidence level, take α = 0.05.
Step 3: Set the judgment threshold, and compare the confidence interval distance radius dj of the slope of the current window subsequence Vk with the judgment threshold τ. When dj > τ, the sequence is considered to be an abnormal subsequence; that is, there are suspected anomalies in the window.
Step 4: Set the clustering parameters E and M of DBSCAN, and randomly select an initial object p in the window considered to have suspected anomalies and other objects in the window as unmarked points. Then, calculate the distance dp between point p and other objects, and obtain the domain range NE(p) of object p based on the clustering parameters E. When the number of objects in the neighborhood range of point p is not less than M, add point p to the core point set and create a new cluster C1.
Step 5: Select the data p^ that is closest to the distance of point p and has not been tagged, and query and calculate the distance d^(p^) between other untagged objects and p^ in the neighborhood range. If there are more than M values with the distance d^(p^) from p^ in the domain range, then the neighboring points of point p^ are density reachable objects of point p, and add all density reachable objects to cluster C1.
Step 6: Repeat the above steps 5~6, when no object can be added to the existing clusters, if the selected points do not belong to the core set of points and do not belong to any of the clusters, and there are no density reachable objects, then the points are considered anomalies so that the current window clustering ends; continue to detect the next set of data.
Step 7: Repeat the above steps until all the currently collected data are processed. The flow chart of the algorithm is shown in Figure 5.
The dataset used for anomaly detection includes normal samples and anomalous samples, of which anomalous samples account for a small percentage and are able to be used as identification objects for the detection algorithm. In order to verify the effectiveness of the anomaly detection model, the detection results are evaluated by three indicators of accuracy P, recall R and F1-Score, with the following equations.
P = T h e   a c t u a l   n u m b e r   o f   o u t l i e r s   t h a t   a r e   d e t e c t e d T h e   d e t e c t i o n   r e s u l t   i s   t h e   t o t a l   n u m b e r   o f   d a t a   p o i n t s   t h a t   a r e   a b n o r m a l
R = T h e   a c t u a l   n u m b e r   o f   o u t l i e r s   t h a t   a r e   d e t e c t e d T h e   t o t a l   n u m b e r   o f   a c t u a l   o u t l i e r s
F 1 = 2     P     R P   +   R

2.3. Abnormal Warning Based on Fuzzy Control

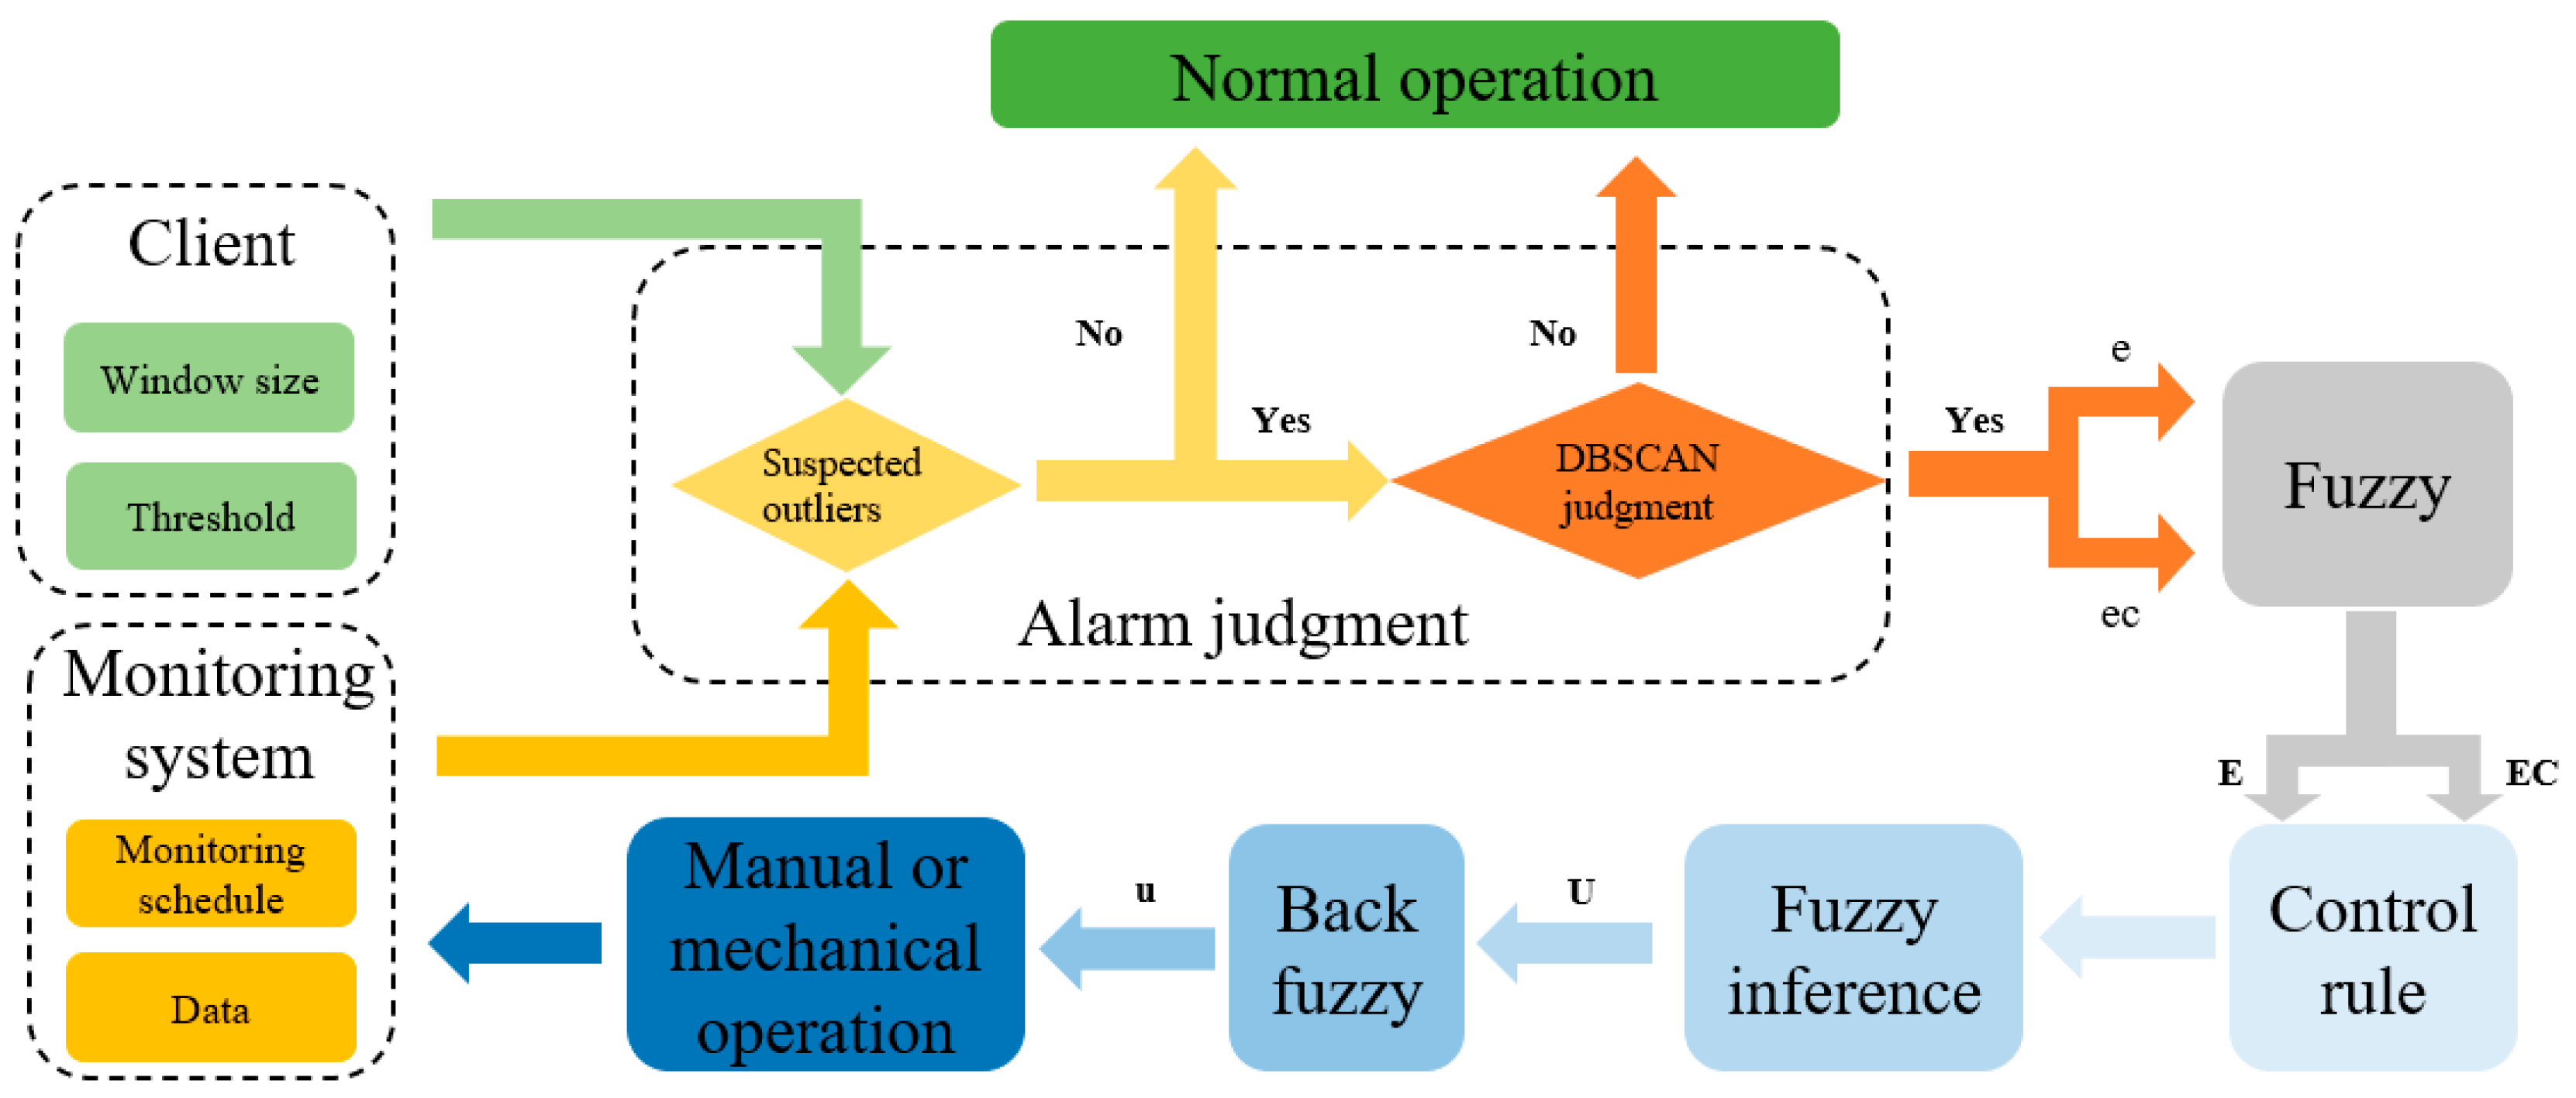
The process of calculating the early warning score is shown in Figure 6, where the input sources are two objects, namely the client and the monitoring system. The client input contains the window size and judgment threshold, and the monitoring system input contains the system monitoring time point and monitoring data. After the input source is obtained, the segment window is judged by STW-DBSCAN to determine whether it meets the conditions to trigger an alarm. If it does not meet the conditions, it is judged as normal transmission data without any alarm processing; otherwise, the warning score is calculated by the fuzzy control algorithm. The type of fuzzy control in this application is multiple input/single-output (MISO), and the specific process is to first fuzzify the input clear variable deviation e and deviation rate of change ec to obtain the deviation fuzzy value E and deviation rate of change fuzzy value EC. Then, the fuzzy linguistic variables with two values of E and EC are obtained by fuzzy control rules, and fuzzy inference is performed. The inference process uses the “if A and B then C” rule in the rule base for comparison to obtain the fuzzy linguistic variable U of the output value and then uses the center of gravity method for inverse fuzzification to obtain the clear value of the output u. Finally, the warning score of the corresponding environmental parameter is calculated.
Here, dissolved oxygen is taken as an example to further elucidate the application of fuzzy control algorithms in aquaculture environmental monitoring. Supposing that the optimal dissolved oxygen level for grass carp culture in a fishery is 5 mg/L and the range of dissolved oxygen is 0~15 mg/L, then the range of deviation e is −10~5 mg/L, and the range of deviation rate of change ec is −15~15 mg/L. The output value for the dissolved oxygen warning score is set to −10~10, and a larger absolute value of the score indicates a higher warning level:
  • When the score ∈ [−10, 0), it represents a low dissolved oxygen interval.
  • When the score = 0, it represents a suitable dissolved oxygen interval.
  • When the score ∈ (0, 10], it represents a high dissolved oxygen interval.
The fuzzy domain of both dissolved oxygen deviation fuzzy value E and deviation change rate fuzzy value EC is set to [−6, 6], and the relationship between clear and fuzzy values is presented in Equations (9) and (10).
E = 0.8 × e   +   2
EC = 0.4 × ec
where E and EC are variable fuzzy values; e and ec are variable clear values. In fuzzification, the fuzzy values of variables are calculated from the clear values of variables and then brought into the algorithm for fuzzy reasoning.
In this example, seven fuzzy language variables are used for the system warning: NB (negative large), NM (negative medium), NS (negative small), ZO (zero), PS (positive small), PM (positive medium) and PB (positive large), and the triangular affiliation function (membership function) is adopted as the affiliation function of E, EC and u, as shown in Figure 7a–c [28,29]. Meanwhile, according to the experience of aquaculture, fuzzy rules are formulated, and the rules are summarized in Table 3 [30], and then the early warning score of dissolved oxygen is output by the inverse fuzzy controller. Figure 7d shows the 3D plot of the warning score output through the simulation experimental system.

2.4. Software Platform Based on Data Visualization

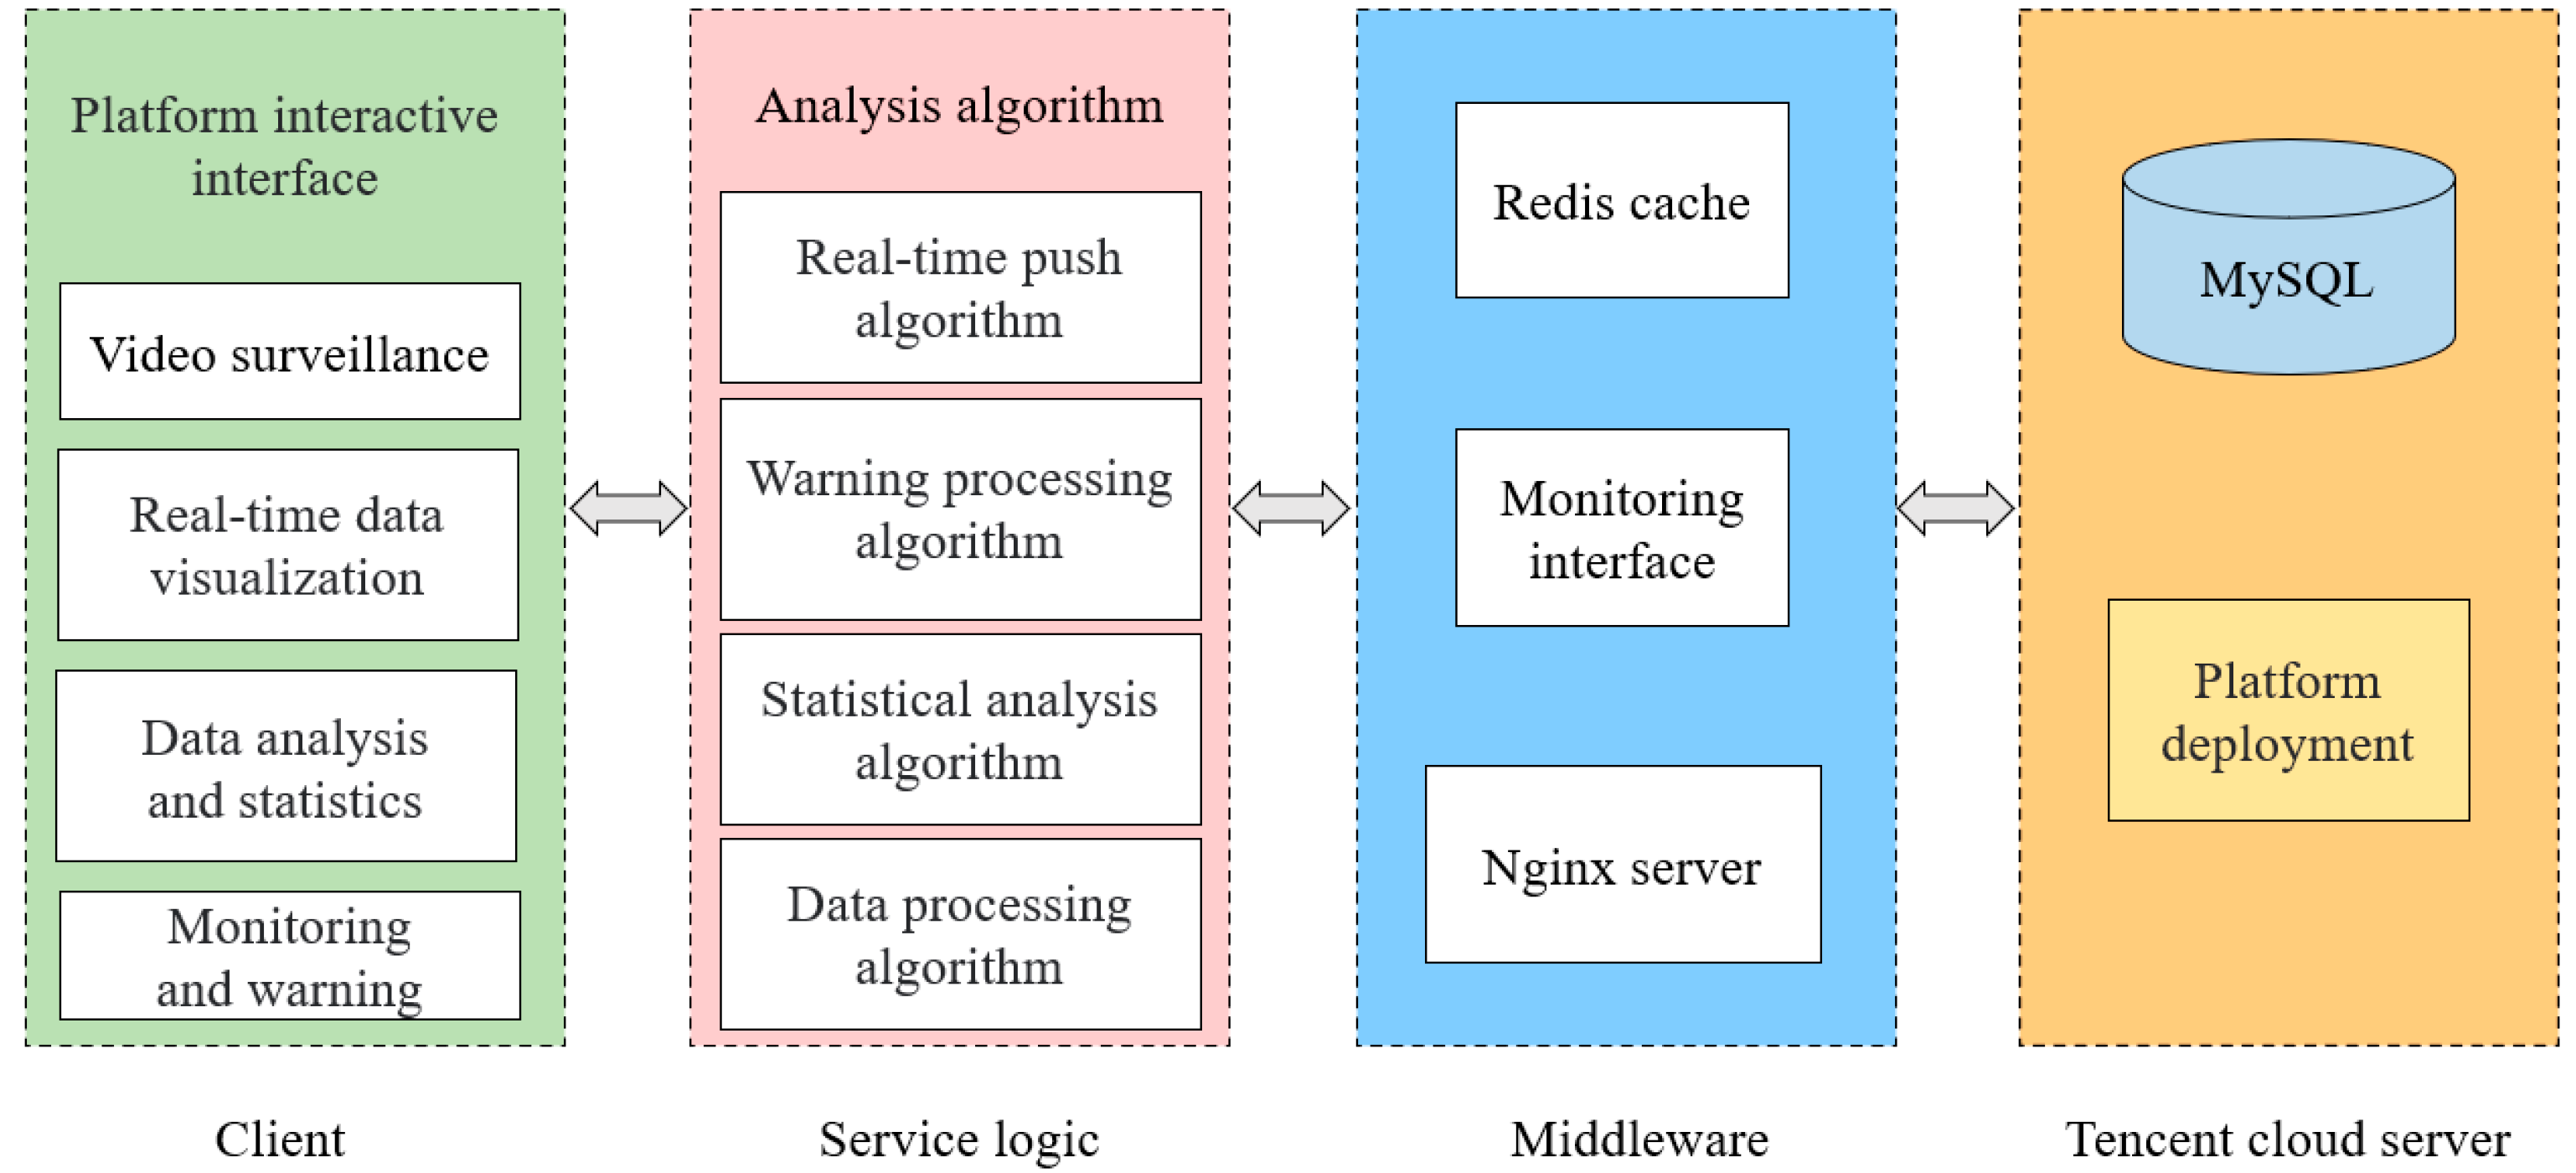
The software platform of this design adopts the B/S architecture with separated front and back ends. Figure 8 shows the architecture of the software platform. The interface function of the platform is comprehensively deployed, and the back end only needs to provide the data interface. Meanwhile, a middleware is deployed to reduce the coupling of the platform, which has good portability [31]. The platform functions include viewing video surveillance and real-time data, querying historical statistical analysis values and monitoring alerts, etc. The business logic is implemented in Python and JavaScript. The data read from the database need to be processed by various analysis algorithms and then returned to the above function calls. The hardware–software interaction part parses the sensor data messages into usable data and stores them directly in the database. When the client initiates a data request, it first reads data from the Redis cache. If the data does not exist in the Redis cache, it will read data into the database and update the Redis cache, which will improve the reading and writing speed of water-quality data and alleviate the load of the MySQL database in the cloud server for real-time transmission of water quality monitoring data [32]. Furthermore, Nginx servers are combined with cloud servers to deploy the platform to the public network to meet the demand for concurrent multi-user access [33]. Based on the need to view real-time monitoring data to observe changes in water quality when abnormal conditions arise, the platform uses WebSocket technology to automatically send the collected data from the server to the client and refresh dynamically. In this way, users can make timely and accurate judgments, analysis and decisions [34]. In addition, the monitoring and warning function is based on the STW-DBSCAN algorithm and fuzzy control strategy, which helps monitor the aquaculture environment accurately and efficiently.
In this paper, the visualization library AE (Apache ECharts) is adopted to visualize and map the water quality data of the aquaculture environment, including real-time display and historical data analysis display. This design employs different asynchronous interaction technology according to the requirements of the application scenario. The real-time display uses WebSocket technology, and the client first initiates an interactive request and communicates with the server in a duplex. Thereafter, when the hardware obtains the monitoring screen and monitoring data, the server analyzes and calculates the data, and the obtained results are automatically sent to the client, thus completing the visualization function. For the historical data analysis function that does not require frequent interactions using Ajax polling technology, users can choose different water quality parameters and query time to access the collected data and minimize resource consumption. AE is an open-source visualization library implemented in JavaScript, and it is used to render line chart tables in this subsystem, thus providing a powerful interactive charting and data visualization library for web browsers, mobile applications and other front- and back-end programs [35].
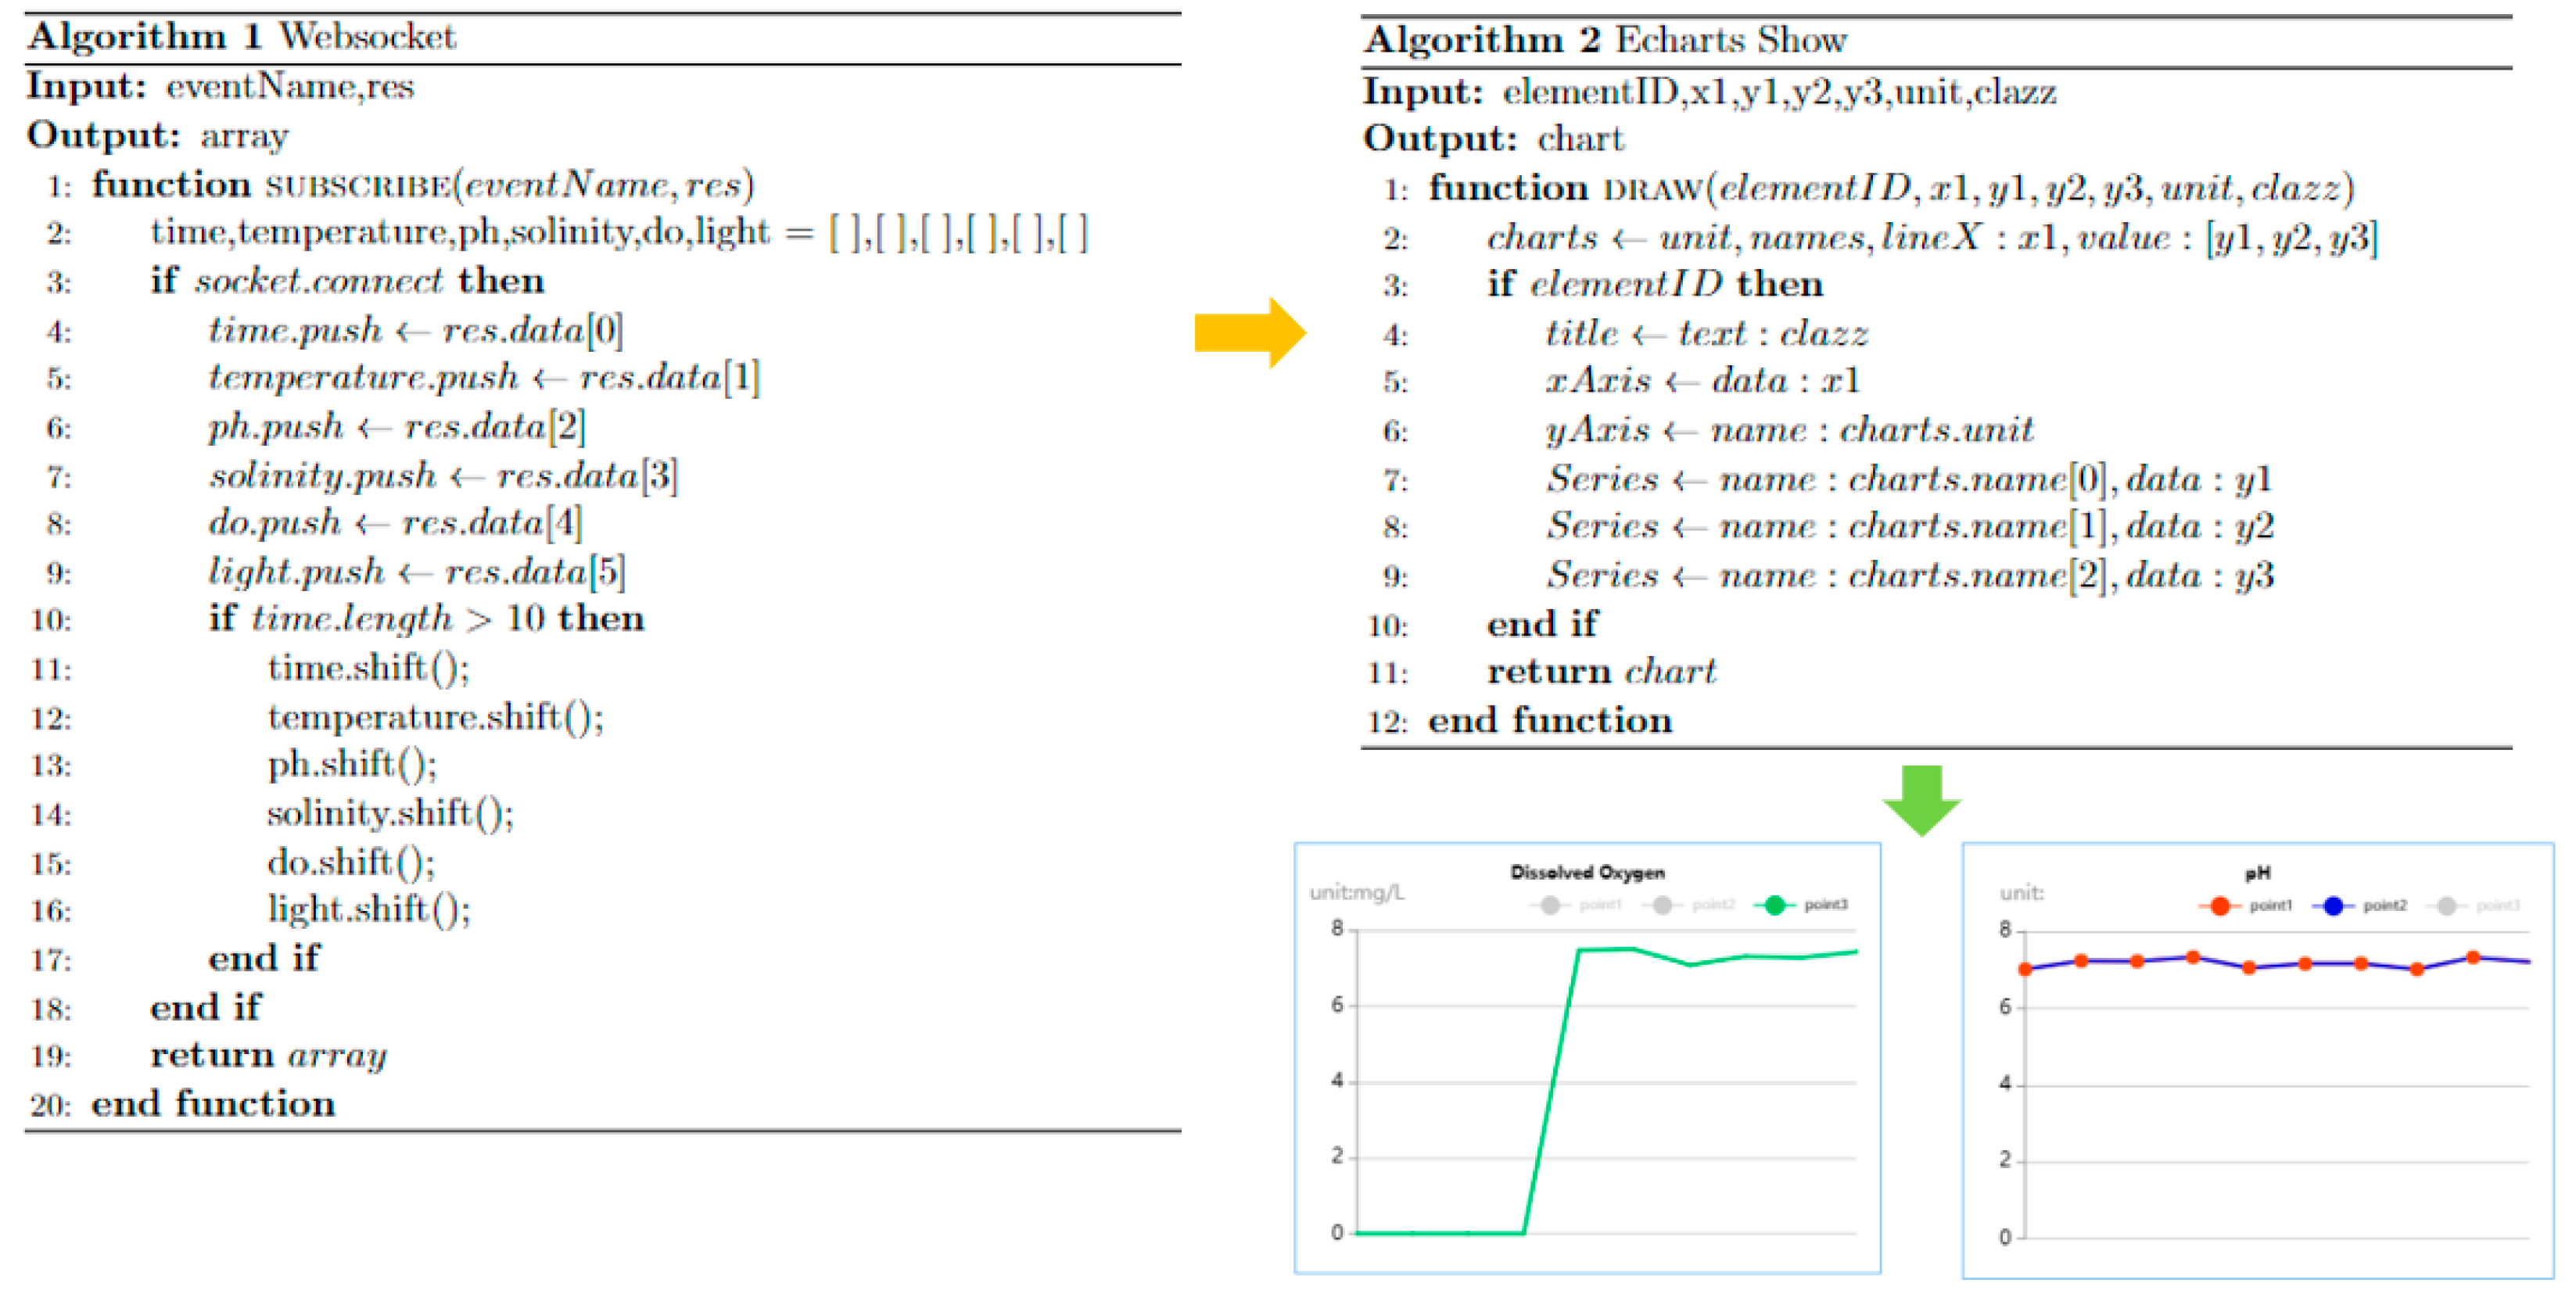
Figure 9 shows the visualization process of real-time monitoring, and the logic of passing data to the client using WebSocket technology is shown in Algorithm 1. In Algorithm 2, the data set obtained from Algorithm 1 is presented in the horizontal and vertical axes of the display chart through the form parameters x1 and y1. Users can analyze the needs of actual application scenarios and combine various rendering attributes provided by AE to realize real-time data visualization.
Fully automatic monitoring is the main approach of platform intelligence, including not only data monitoring but also video monitoring. The monitoring system depends on the call to the Fluorite cloud platform API to obtain a monitoring screen; meanwhile, the real-time monitoring of water quality data and automatic feedback of the user warning information are realized through the early warning logic algorithm for analysis and calculation. Video surveillance includes viewpoint control, surveillance video recording and photo shooting, which help support comprehensive monitoring. When the water quality faces deterioration, video monitoring can grasp the condition of the breeding site in time to prevent losses from fish diseases and environmental disasters. Thereafter, the users receive the warning information; they can view the warning value and real-time water quality change curve and determine whether the breeding constitutes a hazard combined with the camera monitoring screen. Meanwhile, users can control water quality, including the manipulation of machine operation or manual intervention in two aspects, and pre-set the machine (oxygenator, heating pump, etc.) operation strategy for water quality optimization according to different warning scores. In addition, users can carry out manual intervention to control the water quality parameters within the standard aquaculture range. After the event ends, the exception data and alert messages are stored on a static page on the Nginx server.

3. Test and Discussion

3.1. Hardware

This research design was tested for one week in a laboratory culture pond at the National Engineering Research Center for Marine Aquaculture of Zhejiang Ocean University, China, and the system was operated normally under a utility power supply. Since the system needs to meet the universal demand, the nearshore marine aquaculture area is an outdoor environment; the sea area is open, and the water salinity in this area is corrosive, which is relatively bad compared with other aquaculture environments. Therefore, the outdoor test was selected to conduct in the rhubarb culture area of the inshore fishing row of ChangZhi West Road, Dinghai District, Zhoushan City, Zhejiang Province, China (Figure 10a). The duration of the trial was one week, and the field test is shown in Figure 10b. In this section, the functionality and performance of the system are tested.
For the equipment, three time periods are selected to set different continuous collection times as samples. The device is set to read data once every 10 s with 2 reads each time. In the water quality monitoring system, the lower computer uses the tick timer in STM32F407 to collect data regularly, with a maximum continuous collection period of 30 min. Since the lower computer uses an internal clock to set the time, there is an error within a few seconds between the time of the upper computer and the time of the lower computer, so the pause time of 1 minute is reserved in the middle to avoid data duplication in two cycles; that is, 58 minutes of data are collected every hour, and the theoretical amount of data collected should be 16704. The test results are shown in Table 4. The results show that under the condition of high acquisition frequency, the average packet loss rate is 7.92%, and the communication success rate is 92.08%.
In the experiment, two water quality monitoring equipment are taken for comparison, in which the NB-IoT adopted in Huan [36] is used for network transmission; the upload cycle of the sensor nodes is set to 30 min; about 1500 pieces of data should be collected, and the average packet loss rate is 0.42%. Wan [37] uses Wi-Fi for data communication, and within the communication range of 200 meters, the packet loss rate of network transmission is less than 9%. This study finds that there will be some differences in the packet loss rate, owing to different network data transmission modes and the distance from the node to the gateway and other objective factors, but it can satisfy the actual application demand. The power consumption time of equipment condition monitoring is 24 h a day. The adjustable power supply detects that the current consumption of this equipment is 0.37 A, and the power consumption is 24 × 0.37 × 12 = 106.56 Wh. In this state, the adjustable power supply detects that the current of the equipment’s operation monitoring load is 0.57 A, and the consumed power is (58/60) × 24 × (0.57 − 0.37) × 12 = 55.68 Wh. Therefore, the power consumption of the device for one day of operation is 106.56 + 55.68 = 162.24 Wh. The battery capacity consists of a 50 Ah 12 V lithium battery with a battery capacity of 50 × 12 = 600 Wh. Thus, the monitoring equipment can run for 600/162.24 = 3.7 days with only battery power.
The power generation efficiency of solar panels is mainly determined by the intensity of solar light. The available light time in a day is about 6 h, and the power generation conversion efficiency is about 20% on continuous sunny days. The power generation efficiency is about 1% when the weather is cloudy and rainy for a long time. The power generation conversion efficiency is about 10% on alternating sunny and rainy days, which is often the case. According to the three weather conditions, the working time of the solar panel and the lithium battery are calculated respectively.
(1)
Continuous sunny day: in this case, the power generation efficiency of the solar panel is 20%; the power generation in one day is about 150 × 6 × 20% = 180 Wh, and the daily power generation is greater than the daily power consumption. Under this condition, the equipment can be kept running.
(2)
Long-term rain: in this case, the power generation efficiency of the solar panel is 1%; the power generation in one day is about 150 × 6 × 1% = 9 Wh, and the daily power consumption is greater than the daily power generation. Under this condition, the device consumes 162.24 − 9 = 153.24 Wh and can run for 600/153.24 = 3.92 days.
(3)
Alternative sunny days and cloudy days: in this case, the power generation efficiency of the solar panel is 10%; the power generation in one day is about 150 × 6 × 10% = 90 Wh, and the daily power consumption is greater than the daily power generation. Under this condition, the system consumes 162.24 − 90 = 72.24 Wh and can run for 600/72.24 = 8.3 days.

3.2. Software

Figure 11 shows the main interface of the aquaculture environment monitoring platform, which contains real-time video monitoring, the change curves of five environmental parameters and the information summary of the farming base. The platform requires user registration and the consent of the base administrator to access the information with permission.
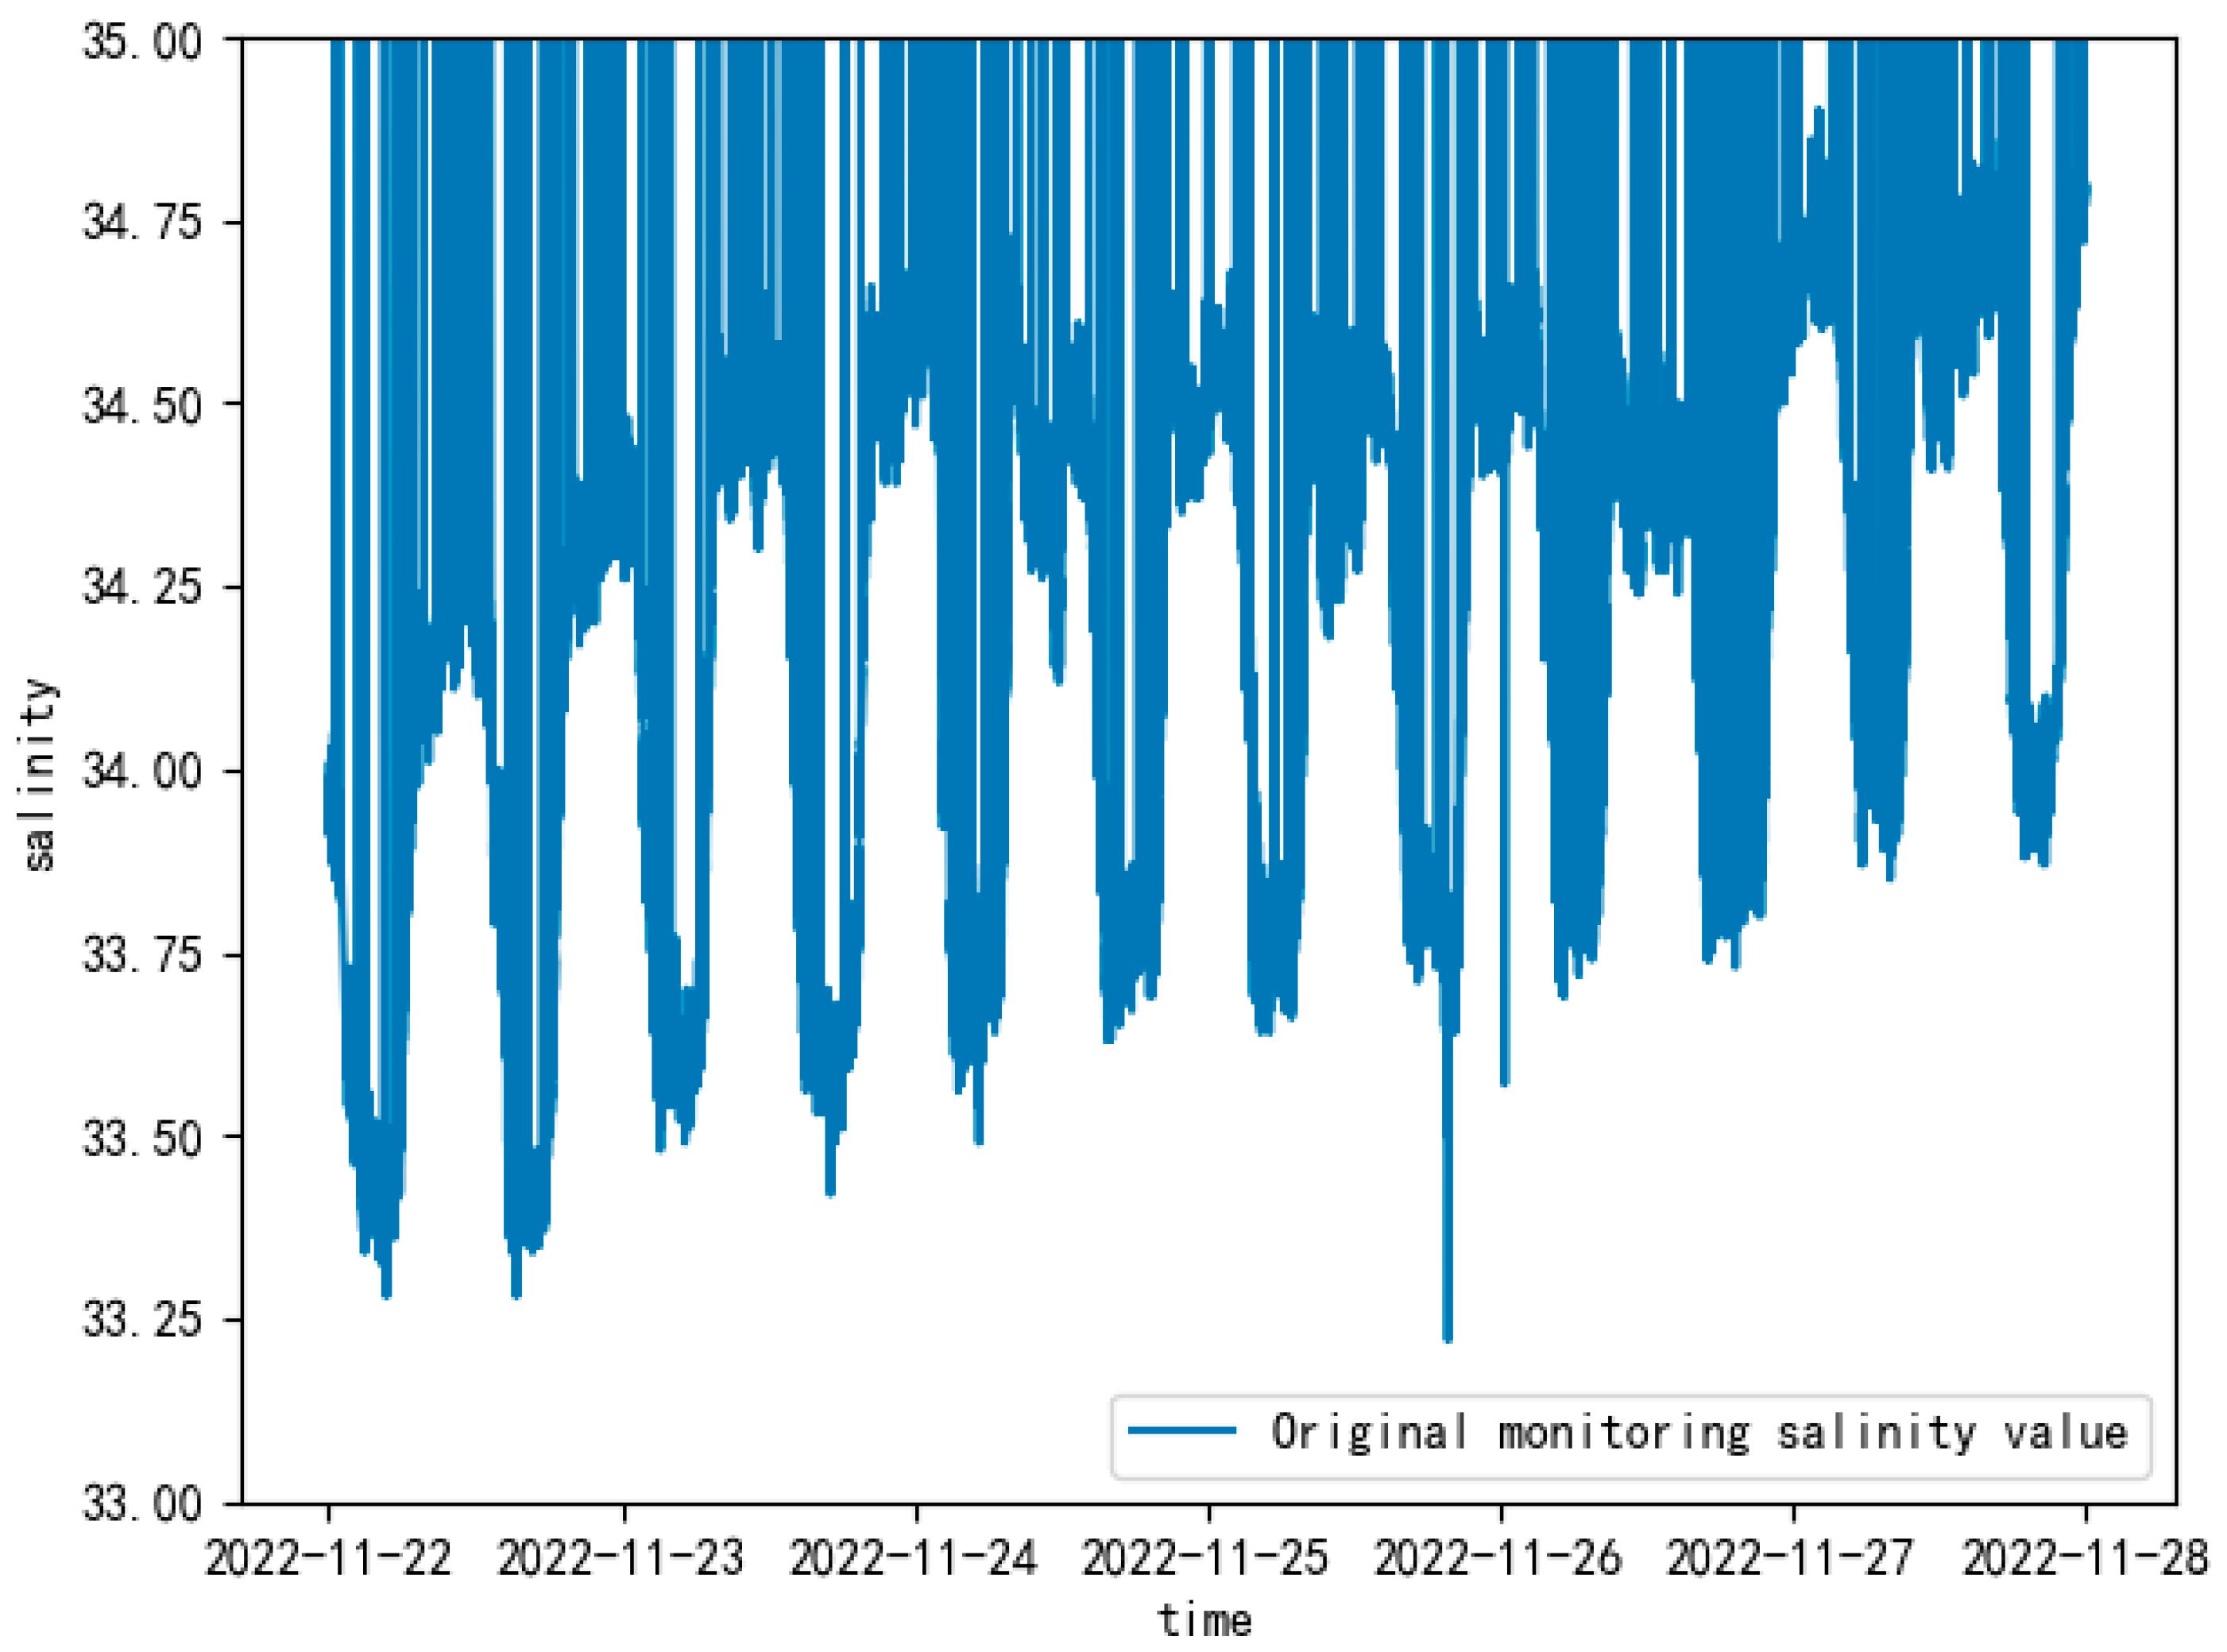
In the outlier detection, 92,569 data from 22 November 2022 to 27 November 2022 were selected as the dataset. Taking salinity as an example, 90,218 valid data (not null value) were collected, and the missing rate was 2.54%. The effective monitoring original data are shown in Figure 12.
The observation data of Zhoushan Fishery in 2013 showed that the surface salinity of this sea area ranged from 21.85 to 34.34 in winter [38]. According to the fluctuation of the collected data, the judgment threshold is set to 0.05, and the window size is set to 12 (the amount of data collected within one min). Since the acquisition time is relatively close, the time series acquisition interval is set to 1, then the DBSCAN radius E is 1 + 0.05 ² , and the minimum point in the adjacent area is 2. The detection results of different algorithms are measured using accuracy, recall, F1 metrics and execution time and compared by the original DBSCAN algorithm (method II), STW-RCE (method III) and traditional confidence interval threshold (method IV) with the algorithm in this paper. Among them, the initial screening method of method III is the same as this paper; the robust covariance estimation (RCE) method is replaced in the anomalous self-series detection; method IV does not perform the initial screening, and the confidence interval threshold is judged directly and without any detection algorithm. The experimental test environment is Intel (R) Core (TM) i5-10400F CPU @ 4.30 GHz; the operating system is Window 10, and the programming language is python3.66. The experimental results are shown in the Table 5.
In the initial anomaly identification of the time series within the window, the algorithm uses the radius of the confidence interval distance of the slope of the subsequence as the structural feature of the subsequence. It can better reflect the change characteristics of the sequence, while the original DBSCAN algorithm does not consider the intrinsic characteristics of the time series. Therefore, the accuracy and recall of this algorithm are slightly higher than the original DBSCAN algorithm. Robust covariance estimation (Method III) performs anomaly detection from the perspective of statistical analysis of data, which can avoid the influence of outliers on the detection results, but it is based on the assumption that the data set obeys Gaussian distribution. In contrast, the DBSCAN algorithm can achieve clustering of data sets of arbitrary shapes and correctly distinguish normal and abnormal values. Therefore, the evaluation indexes of the algorithm in this paper are all better than the robust covariance estimation test. Finally, the traditional confidence interval thresholds only consider the points with large outlier radius in the time series, which cannot represent the structural changes and characteristics of the subseries well and therefore cannot meet the needs of actual aquaculture environmental anomaly monitoring.
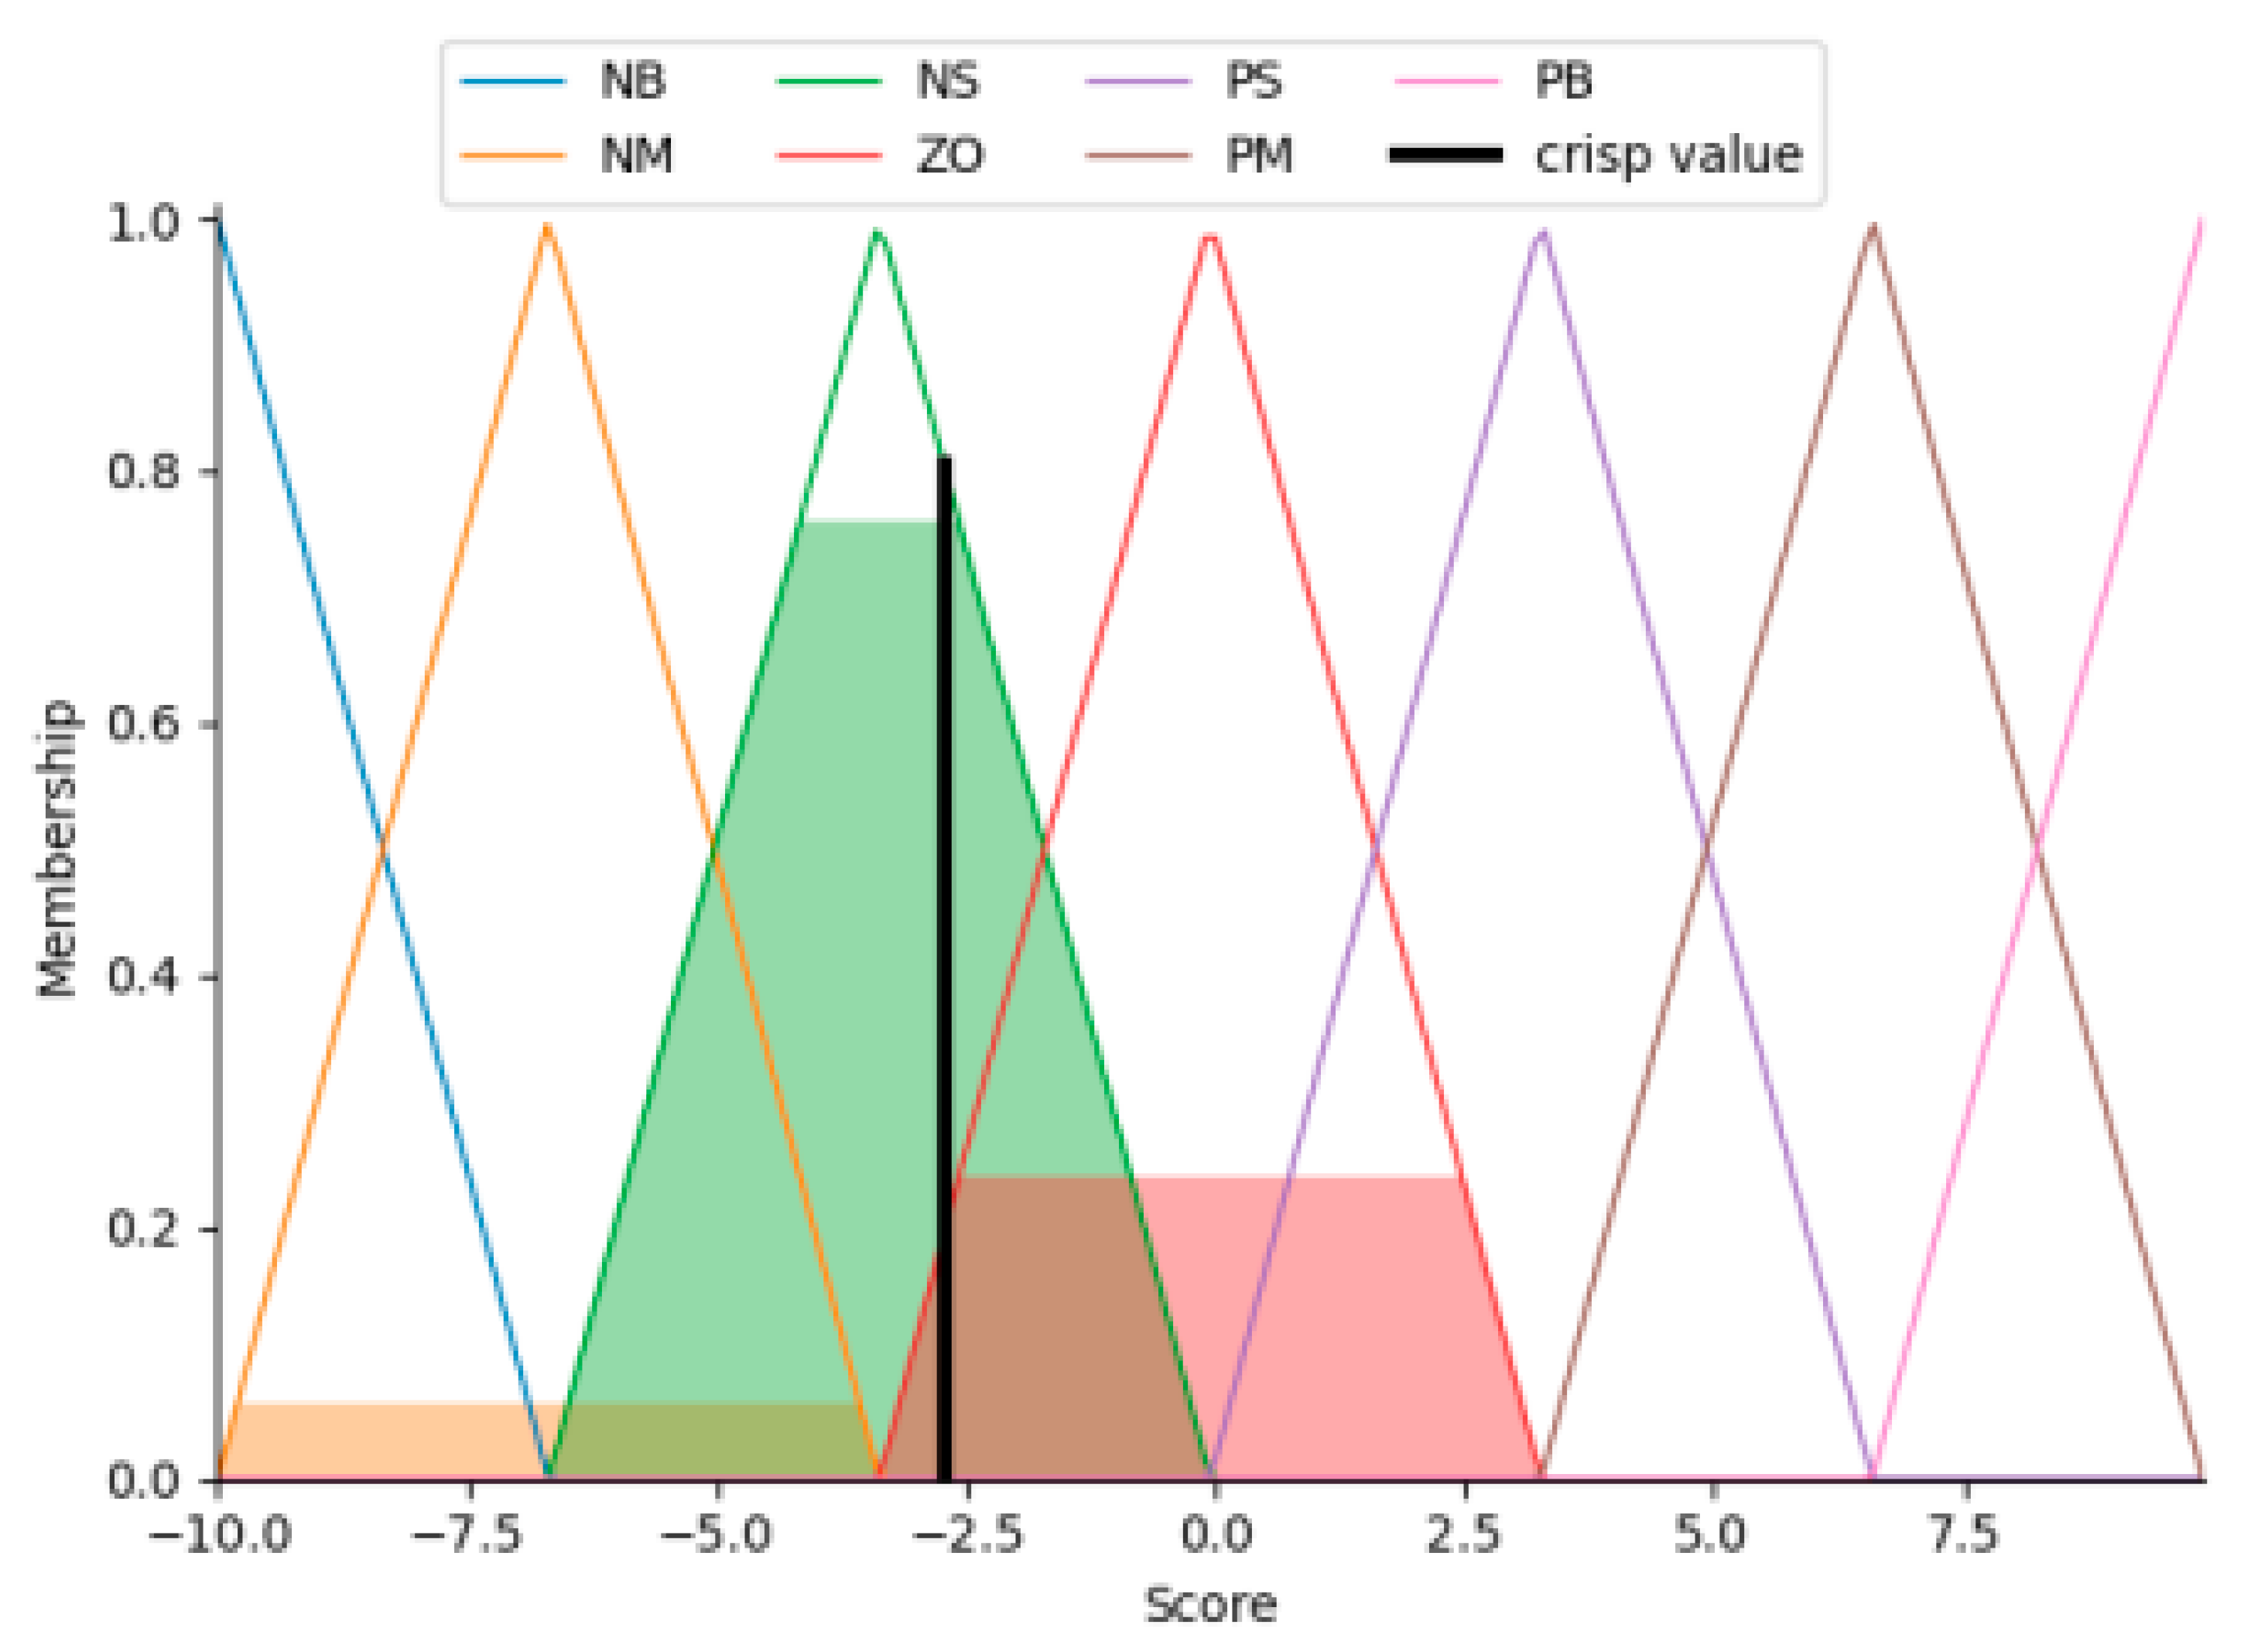
In the early warning system, taking dissolved oxygen as an example for monitoring and warning simulation, the dissolved oxygen content was 3.8 mg/L at the time of 9:51:20 and 3.7 mg/L at the time of 9:51:30; at this time, the dissolved oxygen was monitored to show that the point was an abnormal point; the dissolved oxygen warning score was −2.7 at that moment through the fuzzy control algorithm processing, and the expected analysis results are shown in Figure 13.
The relevant explanations of the fuzzy linguistic variables (NB, NM, NS, ZO, PS, PM and PB) are shown in Section 2.3. The sizes of the shaded areas with different colors represent the weights of the fuzzy-derived results in the corresponding fuzzy linguistic variables. After obtaining this warning score, the oxygenator starts to execute the operation strategy (specific working time and working power) for automatic optimization of water quality if it is in a closed culture water (pond) or container (culture pond). In mariculture areas, farmers can use the early warning score for stage analysis and adjust the culture strategy, such as rotating sea areas and improving feeding methods. Through the above strategies, the water quality parameters are controlled within the range suitable for fish growth so as to stabilize the water quality and maintain a good aquaculture environment.

3.3. The Limitation of the Work

On the basis of the above research, there are still many shortcomings that need to be further improved:
(1)
At present, this study only focuses on the detection of a single measurement point in the fishing ground, while most fishing grounds require multiple devices to work together, thus forming multi-source data analysis.
(2)
The device is limited by 4G base stations, which may cause it to not work properly in remote waters, and the communication success rate of it is in the middle of the range compared with the aquaculture monitoring system designed by other scholars.
(3)
In this study, the method used to deal with missing and abnormal data was the screening method, which failed to restore the original data. Moreover, part of the fuzzy control-based water quality control system could be used with autonomous regulation function, but this paper only stays in at the stage of providing regulation guidance theory.

4. Conclusions

In this study, an aquaculture environment visualization and monitoring system is designed for aquaculture environment monitoring, which integrates technologies such as the Internet of Things, artificial intelligence, remote control and Web Development. The main work is concluded as follows.
(1)
A set of aquaculture environment monitoring equipment is built based on IOT, which adopts various power supply modes and can collect aquaculture environment information uninterruptedly all day long. It can work stably for a long time, and the communication success rate reaches 92.08%.
(2)
It is based on the STW-DBSCAN algorithm to monitor the abnormal data of aquaculture environment and use the confidence interval distance radius of sub-series slope for the initial screening of abnormal time periods, which not only has higher evaluation index but also can save data processing time compared with other current aquaculture abnormality identification methods.
(3)
Through the fuzzy control strategy to quantify the warning events, aquaculturists can take machine control or manual intervention to keep the aquaculture environment in a relatively stable state according to the quantified warning scores.
(4)
A human–computer interaction platform based on B/S architecture is built, and WebSocket duplex communication technology is used for data pushing to meet the demand of real-time monitoring visualization and persistent monitoring. The system is fully functional in visualization, highly portable and has good robustness.
The above work fulfills the universal requirements of existing aquaculture environmental monitoring systems and enables aquaculturists to maintain more efficient production levels, while being able to help them maintain the ecology of their farmed waters, further increasing aquaculture production in a sustainable manner.

Author Contributions

Methodology, H.Z.; Conceptualization, Funding acquisition, Resources, Writing—review and editing, X.Y.; Software, H.Z. and Y.L.; Hardware, Y.L.; Conceptualization, Funding acquisition, Resources, F.G. All authors have read and agreed to the published version of the manuscript.

Funding

This research was funded by the National Key Research and Development Project of China under grant number 2020YFE0200100, Key Research and Development Program of Zhejiang Province under grant number 2023C02029, Science and Technology Innovation 2025 Major Project of Ningbo City under grant number 2020Z076, and Zhoushan Science and Technology Projects under grant number 2022C01003.

Institutional Review Board Statement

Not applicable.

Informed Consent Statement

Not applicable.

Data Availability Statement

Not applicable.

Acknowledgments

The authors would like to thank all the reviewers who participated in the review.

Conflicts of Interest

The authors declare no conflict of interest.

References

  1. Moffitt, C.M.; Cajas-Cano, L. Blue growth: The 2014 FAO state of world fisheries and aquaculture. Fisheries 2014, 39, 552–553. [Google Scholar] [CrossRef]
  2. Edwards, P. Aquaculture environment interactions: Past, present and likely future trends. Aquaculture 2015, 447, 2–14. [Google Scholar] [CrossRef]
  3. Aryai, V.; Abbassi, R.; Abdussamie, N.; Salehi, F.; Garaniya, V.; Asadnia, M.; Baksh, A.A.; Penesis, I.; Karampour, H.; Draper, S.; et al. Reliability of multi-purpose offshore-facilities: Present status and future direction in Australia. Process Saf. Environ. Prot. 2021, 148, 437–461. [Google Scholar] [CrossRef] [PubMed]
  4. Miorandi, D.; Sicari, S.; De Pellegrini, F.; Chlamtac, I. Internet of things: Vision, applications and research challenges. Ad Hoc Netw. 2012, 10, 1497–1516. [Google Scholar] [CrossRef] [Green Version]
  5. Simbeye, D.S.; Zhao, J.; Yang, S. Design and deployment of wireless sensor networks for aquaculture monitoring and control based on virtual instruments. Comput. Electron. Agric. 2014, 102, 31–42. [Google Scholar] [CrossRef]
  6. Parra, L.; Sendra, S.; García, L.; Lloret, J. Design and deployment of low-cost sensors for monitoring the water quality and fish behavior in aquaculture tanks during the feeding process. Sensors 2018, 18, 750. [Google Scholar] [CrossRef] [Green Version]
  7. Schmidt, W.; Raymond, D.; Parish, D.; Ashton, I.G.C.; Miller, P.I.; Campos, C.J.A.; Shutler, J.D. Design and operation of a low-cost and compact autonomous buoy system for use in coastal aquaculture and water quality monitoring. Aquac. Eng. 2018, 80, 28–36. [Google Scholar] [CrossRef]
  8. Jamroen, C.; Yonsiri, N.; Odthon, T.; Wisitthiwong, N.; Janreung, S. A standalone photovoltaic/battery energy-powered water quality monitoring system based on narrowband internet of things for aquaculture: Design and implementation. Smart Agric. Technol. 2023, 3, 100072. [Google Scholar] [CrossRef]
  9. Lu, H.Y.; Cheng, C.Y.; Cheng, S.C.; Cheng, Y.H.; Lo, W.C.; Jiang, W.L.; Nan, F.H.; Chang, S.H. A low-cost AI buoy system for monitoring water quality at offshore aquaculture cages. Sensors 2022, 22, 4078. [Google Scholar] [CrossRef]
  10. Chen, C.H.; Wu, Y.C.; Zhang, J.X.; Chen, Y.H. IoT-based fish farm water quality monitoring system. Sensors 2022, 22, 6700. [Google Scholar] [CrossRef]
  11. Ferreira, N.C.; Bonetti, C.; Seiffert, W.Q. Hydrological and water quality indices as management tools in marine shrimp culture. Aquaculture 2011, 318, 425–433. [Google Scholar] [CrossRef]
  12. Syu, W.J.; Chang, T.K.; Pan, S.Y. Establishment of an automatic real-time monitoring system for irrigation water quality management. Int. J. Environ. Res. Public Health 2020, 17, 737. [Google Scholar] [CrossRef] [PubMed] [Green Version]
  13. Ding, J.; Sun, S.; Ma, J.; Li, N. Fusion estimation for multi-sensor networked systems with packet loss compensation. Inf. Fusion 2019, 45, 138–149. [Google Scholar] [CrossRef]
  14. Hu, M.; Ji, Z.; Yan, K.; Guo, Y.; Feng, X.; Gong, J.; Zhao, X.; Dong, L. Detecting anomalies in time series data via a meta-feature based approach. IEEE Access 2018, 6, 27760–27776. [Google Scholar] [CrossRef]
  15. Wang, L.; Wu, C. Dynamic imbalanced business credit evaluation based on Learn++ with sliding time window and weight sampling and FCM with multiple kernels. Inf. Sci. 2020, 520, 305–323. [Google Scholar] [CrossRef]
  16. Yu, Z.; Hua, X.; Sun, X.; Xue, Y.; Tian, Y. Study on density clustering based anomaly detection for aquaculture water. In Proceedings of the 2021 7th International Conference on Computing and Artificial Intelligence, Tianjin, China, 23–26 April 2021; pp. 227–232. [Google Scholar]
  17. Hamed, S.B.; Hamed, M.B.; Sbita, L.; Bajaj, M.; Blazek, V.; Prokop, L.; Misak, S.; Ghoneim, S.S. Robust Optimization and Power Management of a Triple Junction Photovoltaic Electric Vehicle with Battery Storage. Sensors 2022, 22, 6123. [Google Scholar] [CrossRef]
  18. Aisjah, A.S.; Arifin, S. Maritime weather prediction using fuzzy logic in Java Sea for shipping feasibility. Int. J. Artif. Intell. 2013, 10, 112–122. [Google Scholar]
  19. Dourra, H.; Siy, P. Investment using technical analysis and fuzzy logic. Fuzzy Sets Syst. 2002, 127, 221–240. [Google Scholar] [CrossRef]
  20. Ding, S.; Zhao, T.; Gao, F.; Tang, Z.; Jin, B. Research on a motion-inhibition fuzzy control method for moored ship with multi-robot system. Ocean Eng. 2022, 248, 110795. [Google Scholar] [CrossRef]
  21. Ali, F.; El-Sappagh, S.; Kwak, D. Fuzzy ontology and LSTM-based text mining: A transportation network monitoring system for assisting travel. Sensors 2019, 19, 234. [Google Scholar] [CrossRef] [Green Version]
  22. Li, T.; Luan, F.; Wang, M.; Song, Q.; Shi, Z. Design of Remote Monitoring System Based on STM32F407 Microcontroller. In Proceedings of the 2019 IEEE International Conference on Power, Intelligent Computing and Systems (ICPICS), Shenyang, China, 12–14 July 2019; IEEE: New York, NY, USA; pp. 304–307. [Google Scholar]
  23. Saboya, N. Normas de Comunicación en Serie: RS-232, RS-422 y RS-485. Rev. Ingenio Libre 2012, 9, 86–94. [Google Scholar]
  24. Akkurt, N. Investigation of the effect of aspect ratio in an enclosure filled with phase change materials and its effect on thermal management of lithium-ion batteries: Applicable for storing solar energy. J. Power Sources 2022, 539, 231606. [Google Scholar] [CrossRef]
  25. Lewis, E.L.; Perkin, R.G. Salinity: Its definition and calculation. J. Geophys. Res. Ocean. 1978, 83, 466–478. [Google Scholar] [CrossRef]
  26. Baydogan, M.G.; Runger, G.; Tuv, E. A bag-of-features framework to classify time series. IEEE Trans. Pattern Anal. Mach. Intell. 2013, 35, 2796–2802. [Google Scholar] [CrossRef] [PubMed]
  27. Hazra, A. Using the confidence interval confidently. J. Thorac. Dis. 2017, 9, 4125. [Google Scholar] [CrossRef] [Green Version]
  28. Zhang, C.; Huang, J.; Cheng, F. Monitoring of feeding rate and online control of parameters in primary processing of Tilapia. Trans. Chin. Soc. Agric. Eng. 2021, 37, 46–54. (In Chinese) [Google Scholar]
  29. Alves de Araujo Junior, C.A.; Mauricio Villanueva, J.M.; Almeida, R.J.S.D.; Azevedo de Medeiros, I.E. Digital Twins of the Water Cooling System in a Power Plant Based on Fuzzy Logic. Sensors 2021, 21, 6737. [Google Scholar] [CrossRef]
  30. Liu, Y.; Li, Z.; Cao, S.; Wang, Y. Design of intelligent monitoring system for aquaculture environment based on fuzzy control. Fish. Mod. 2020, 47, 25–32. (In Chinese) [Google Scholar]
  31. Ma, Z.; Wang, S.; Shen, J.; Li, S.; Shi, Y. Design of multi-energy joint optimization dispatching system for regional power grids based on B/S architecture. Energy Procedia 2019, 158, 6236–6241. [Google Scholar] [CrossRef]
  32. Lee, J.; Lee, E. Concerto: Dynamic Processor Scaling for Distributed Data Systems with Replication. Appl. Sci. 2021, 11, 5731. [Google Scholar] [CrossRef]
  33. Dymora, P.; Mazurek, M.; Sudek, B. Comparative Analysis of Selected Open-Source Solutions for Traffic Balancing in Server Infrastructures Providing WWW Service. Energies 2021, 14, 7719. [Google Scholar] [CrossRef]
  34. Nurwarsito, H.; Christian, R.D. River Water Pollutant Level Monitoring System using Websocket Protocol and LoRa Communication Module. In Proceedings of the 2021 2nd International Conference on ICT for Rural Development (IC-ICTRuDev), Virtual, 27–28 October 2021; pp. 1–6. [Google Scholar]
  35. Lin, Q.; Lin, B.; Zhang, D.; Wu, J. Web-based prototype system for flood simulation and forecasting based on the HEC-HMS model. Environ. Model. Softw. 2022, 158, 105541. [Google Scholar] [CrossRef]
  36. Huan, J.; Li, H.; Wu, F.; Cao, W. Design of water quality monitoring system for aquaculture ponds based on NB-IoT. Aquac. Eng. 2020, 90, 102088. [Google Scholar] [CrossRef]
  37. Wan, S.; Zhao, K.; Lu, Z.; Li, J.; Lu, T.; Wang, H. A Modularized IoT Monitoring System with Edge-Computing for Aquaponics. Sensors 2022, 22, 9260. [Google Scholar] [CrossRef] [PubMed]
  38. Hou, W.; Yu, C.; Chen, X. The Salinity Distribution in Zhoushan Fishing Ground. J. Zhejiang Ocean Univ. (Nat. Sci. Ed.) 2013, 32, 388–392. (In Chinese) [Google Scholar]
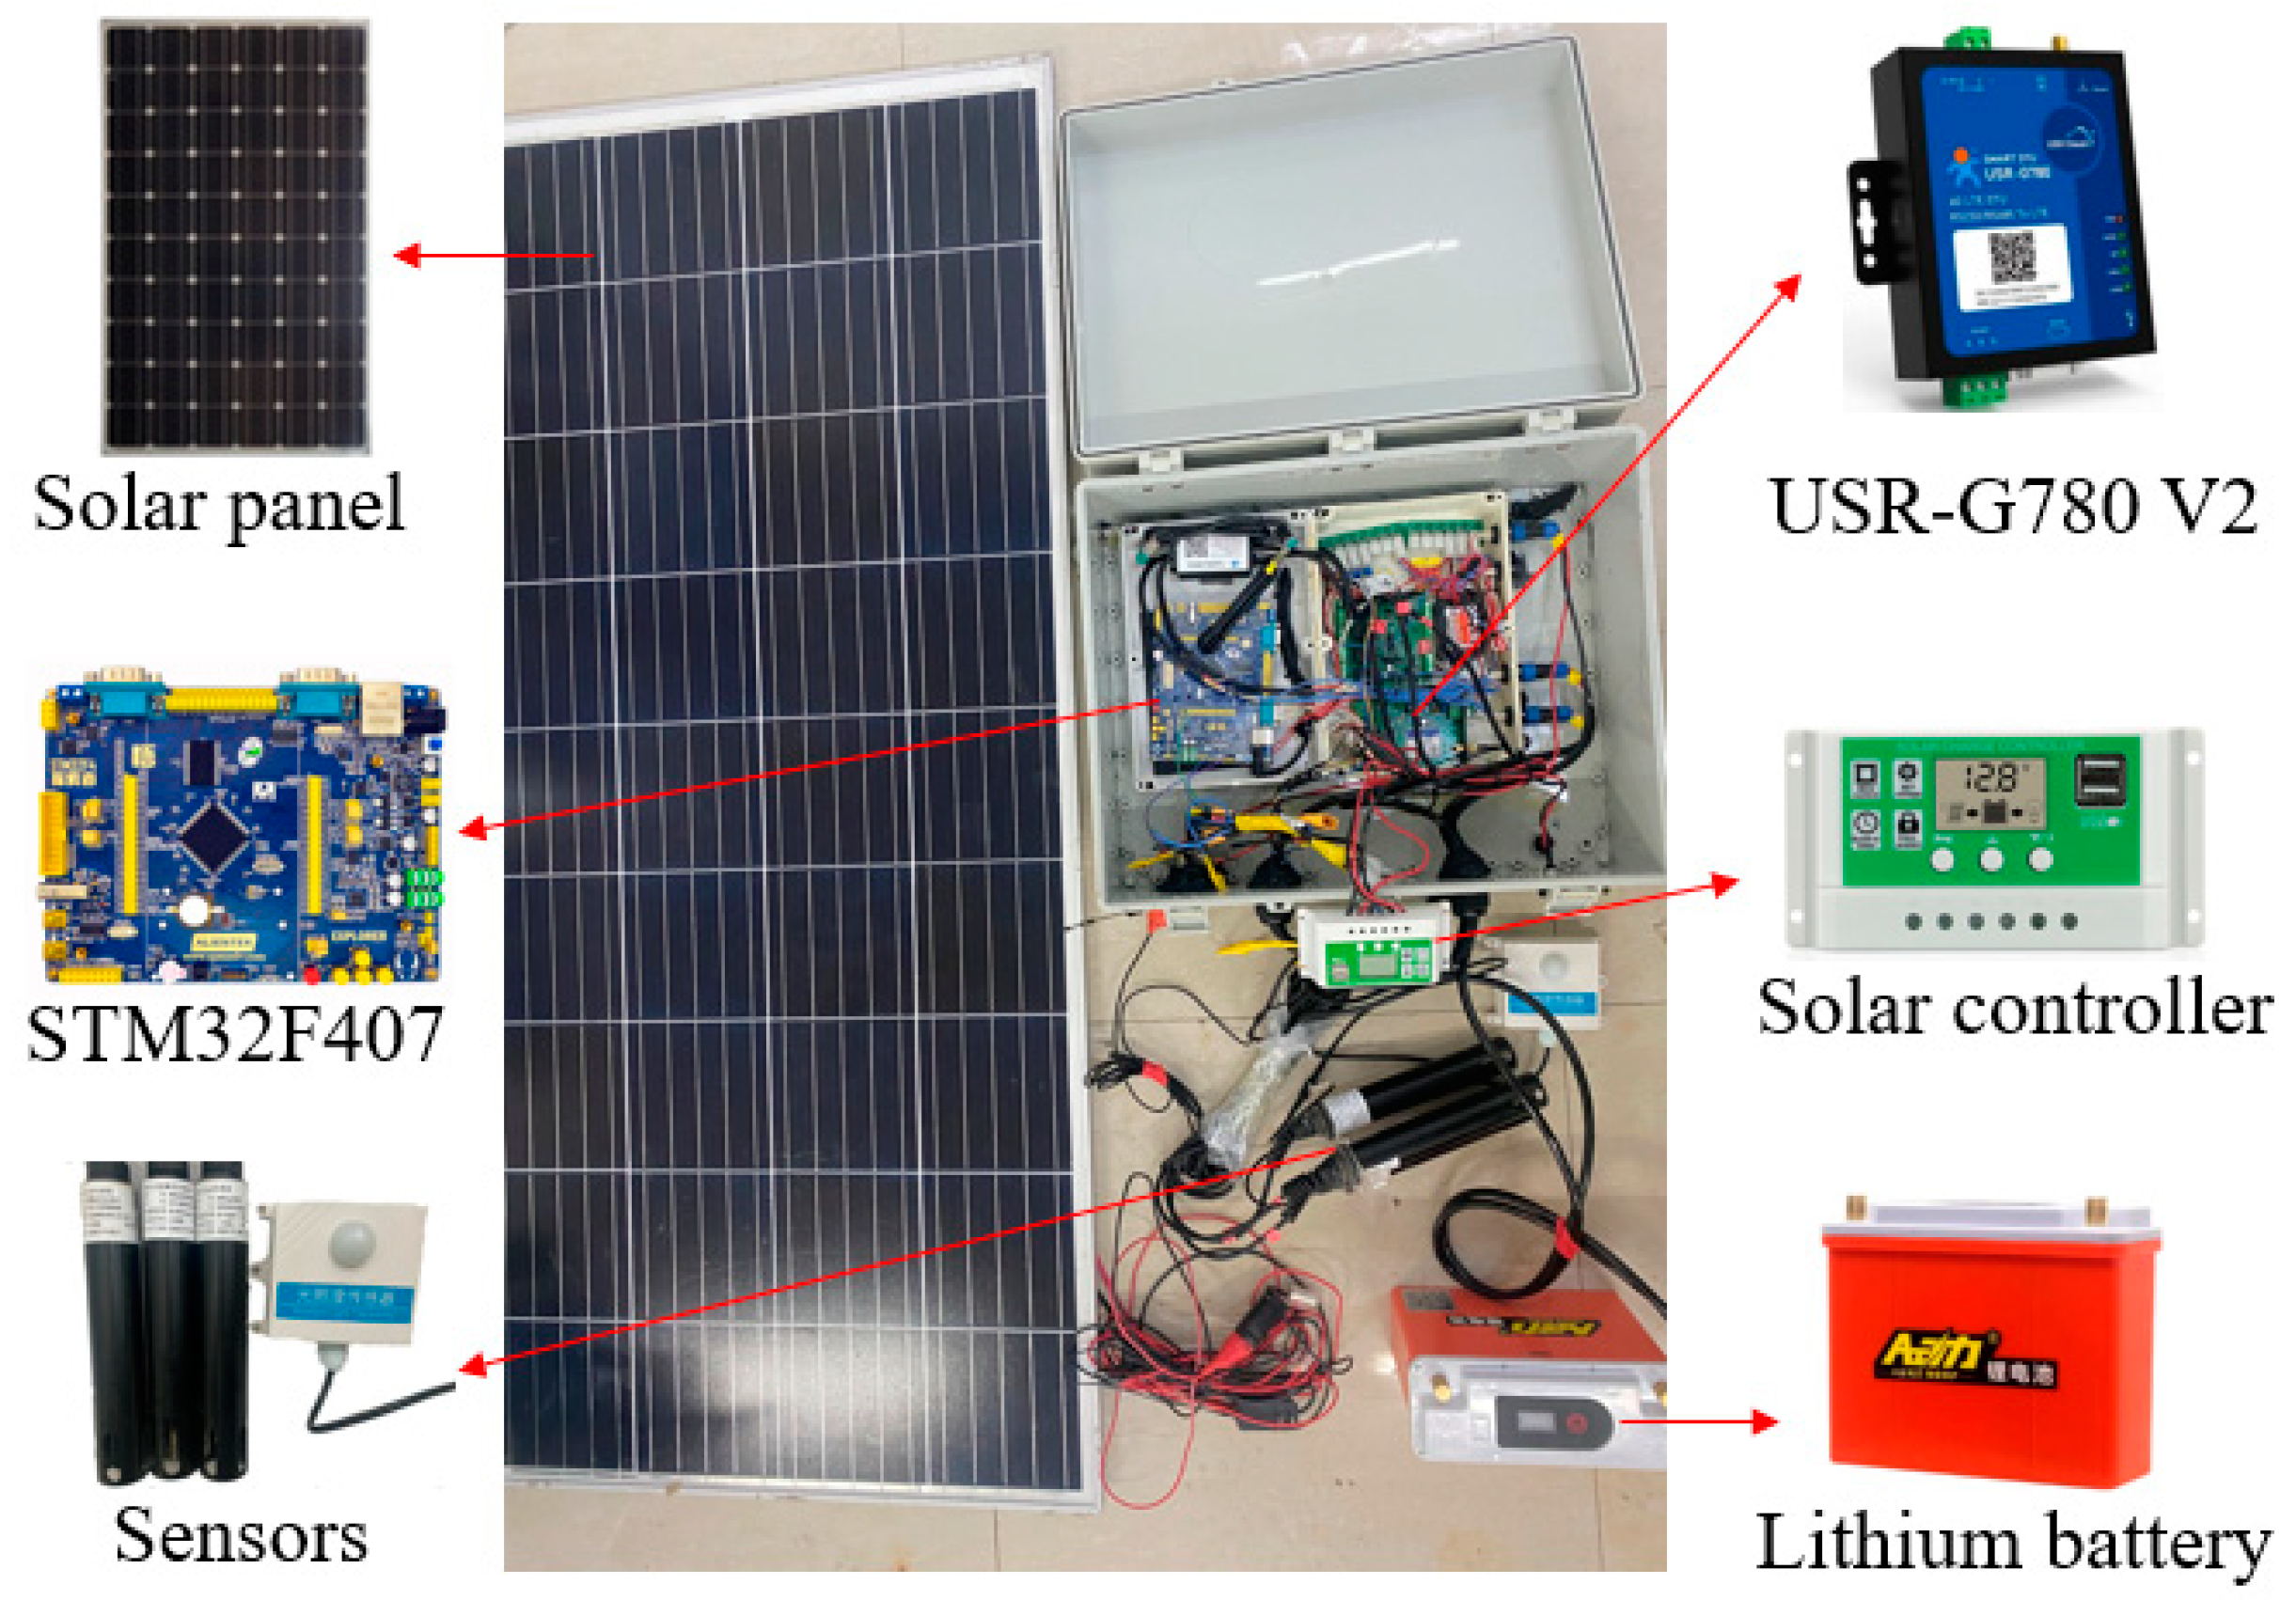
Figure 1. The main hardware equipment.
Sustainability 15 05678 g001
Figure 2. The diagram of the equipment’s power supply.
Sustainability 15 05678 g002
Figure 3. Sensor module. (a) pH sensor, (b) dissolved oxygen sensor, (c) conductivity sensor, (d) light sensor.
Sustainability 15 05678 g003
Figure 4. The data acquisition process.
Sustainability 15 05678 g004
Figure 5. Flow chart of anomaly detection algorithm.
Sustainability 15 05678 g005
Figure 6. The process of early warning score calculation.
Sustainability 15 05678 g006
Figure 7. Fuzzy control design. (a) E (Deviation fuzzy value) (b) EC (Deviation rate of change fuzzy value) (c) Score (Warning score) (d) Output 3D plot of the warning score.
Sustainability 15 05678 g007
Figure 8. The architecture of the software platform.
Sustainability 15 05678 g008
Figure 9. The visual flow of real-time monitoring.
Sustainability 15 05678 g009
Figure 10. The test area and field layout. (a) Outdoor test area (b) Field test.
Sustainability 15 05678 g010
Figure 11. The visual monitoring interface of the aquaculture environment platform.
Sustainability 15 05678 g011
Figure 12. The effective monitoring original data.
Sustainability 15 05678 g012
Figure 13. Dissolved oxygen warning score.
Sustainability 15 05678 g013
Table 1. Hardware devices used in the monitoring system.
EquipmentManufacturer and ModelNumberCommunication ModeParameters and Functions
Development boardThe punctual atoms STM32F4071RS-232
RS-485
(Modbus-RTU)
Control module
Photovoltaic solar panelsJiangsu Feiyu Photovoltaic1-Power: 150 W
Lithium batteryAnhui NewStrong1-12 V, 50 A
Digital conductivity sensorGuohong environmental protection Instrument MQ-Cond011RS-485 (Modbus-RTU)Conductivity:
0~200,000 μs·cm−1
Digital pH sensorGuohong environmental protection Instrument MQ-pH011RS-485 (Modbus-RTU)pH value:
0~14
Digital dissolved oxygen sensorGuohong environmental protection Instrument MQ-FDO021RS-485 (Modbus-RTU)Dissolved oxygen:
0~20 mg·L−1
Light intensity sensorTelegraphic unblocked electronics
JXBS-3001-GZ
1RS-485 (Modbus-RTU)Illumination:
0~200,000 Lux
Intelligent spherical cameraHikvision
DS-2DE3Q120MY-T/GLSE
14G traffic cardsurveillance camera 12 V, 0.75 A
Four-way controllerThe internet of people
ZZ-IO404D-RS485
1RS-485 (Modbus-RTU)DC 7~30 V, 10 A
Six-way controllerThe internet of people
ZZ-IO0606-RS232+485
1RS-485 (Modbus-RTU)DC 7~30 V, 10 A
4G communication moduleThe internet of people
USR-G780 V2
1TCP/IP
RS-485 (Modbus-RTU)
DC 5~36 V
Table 2. The slave information table.
Equipment NameSlave AddressCalibration MethodTransmission TypeStorage Mode
Digital pH sensor1CRC CalibrationFloatsmall-end mode
Digital conductivity sensor2Float
Digital dissolved oxygen sensor3Long
485 type light level transmitter4Float
RS-485 four-way controller5Float
RS-485 six-way controller6Float
Table 3. Control rule table.
UEC
NBNMNSZEPSPMPB
ENBNBNBNBNBNMNSZE
NMNBNBNBNMNSZEPS
NSNMNMNMNSZEPSPS
ZENMNMNSZEPSPMPM
PSNSNSZEPSPMPMPM
PMZEZEPSPMPBPBPB
PBZEZEPSPBPBPBPB
Table 4. Packet loss rate test.
Time Period of AcquisitionAmount of Data Should Be CollectedActual Amount of Data ReceivedPacket Loss Rate
2022-11-21 18:00:00 to 2022-11-22 18:00:0016,70415,5197.10%
2022-11-23 18:00:00 to 2022-11-24 18:00:0016,70415,3737.97%
2022-11-25 18:00:00 to 2022-11-26 18:00:0016,70415,2508.70%
mean16,70415,3817.92%
Table 5. Anomaly detection experimental results.
Detection MethodPRF1
STW-DBSCAN87.71%82.58%85.06%
method II82.53%78.23%80.32%
method III42.35%78.79%55.09%
method IV92.29%16.31%27.72%
Disclaimer/Publisher’s Note: The statements, opinions and data contained in all publications are solely those of the individual author(s) and contributor(s) and not of MDPI and/or the editor(s). MDPI and/or the editor(s) disclaim responsibility for any injury to people or property resulting from any ideas, methods, instructions or products referred to in the content.