
Insulation Performance of Building Components and Effect on the Cooling Load of Homes in Saudi Arabia
 , and
, and
Abstract
:1. Introduction
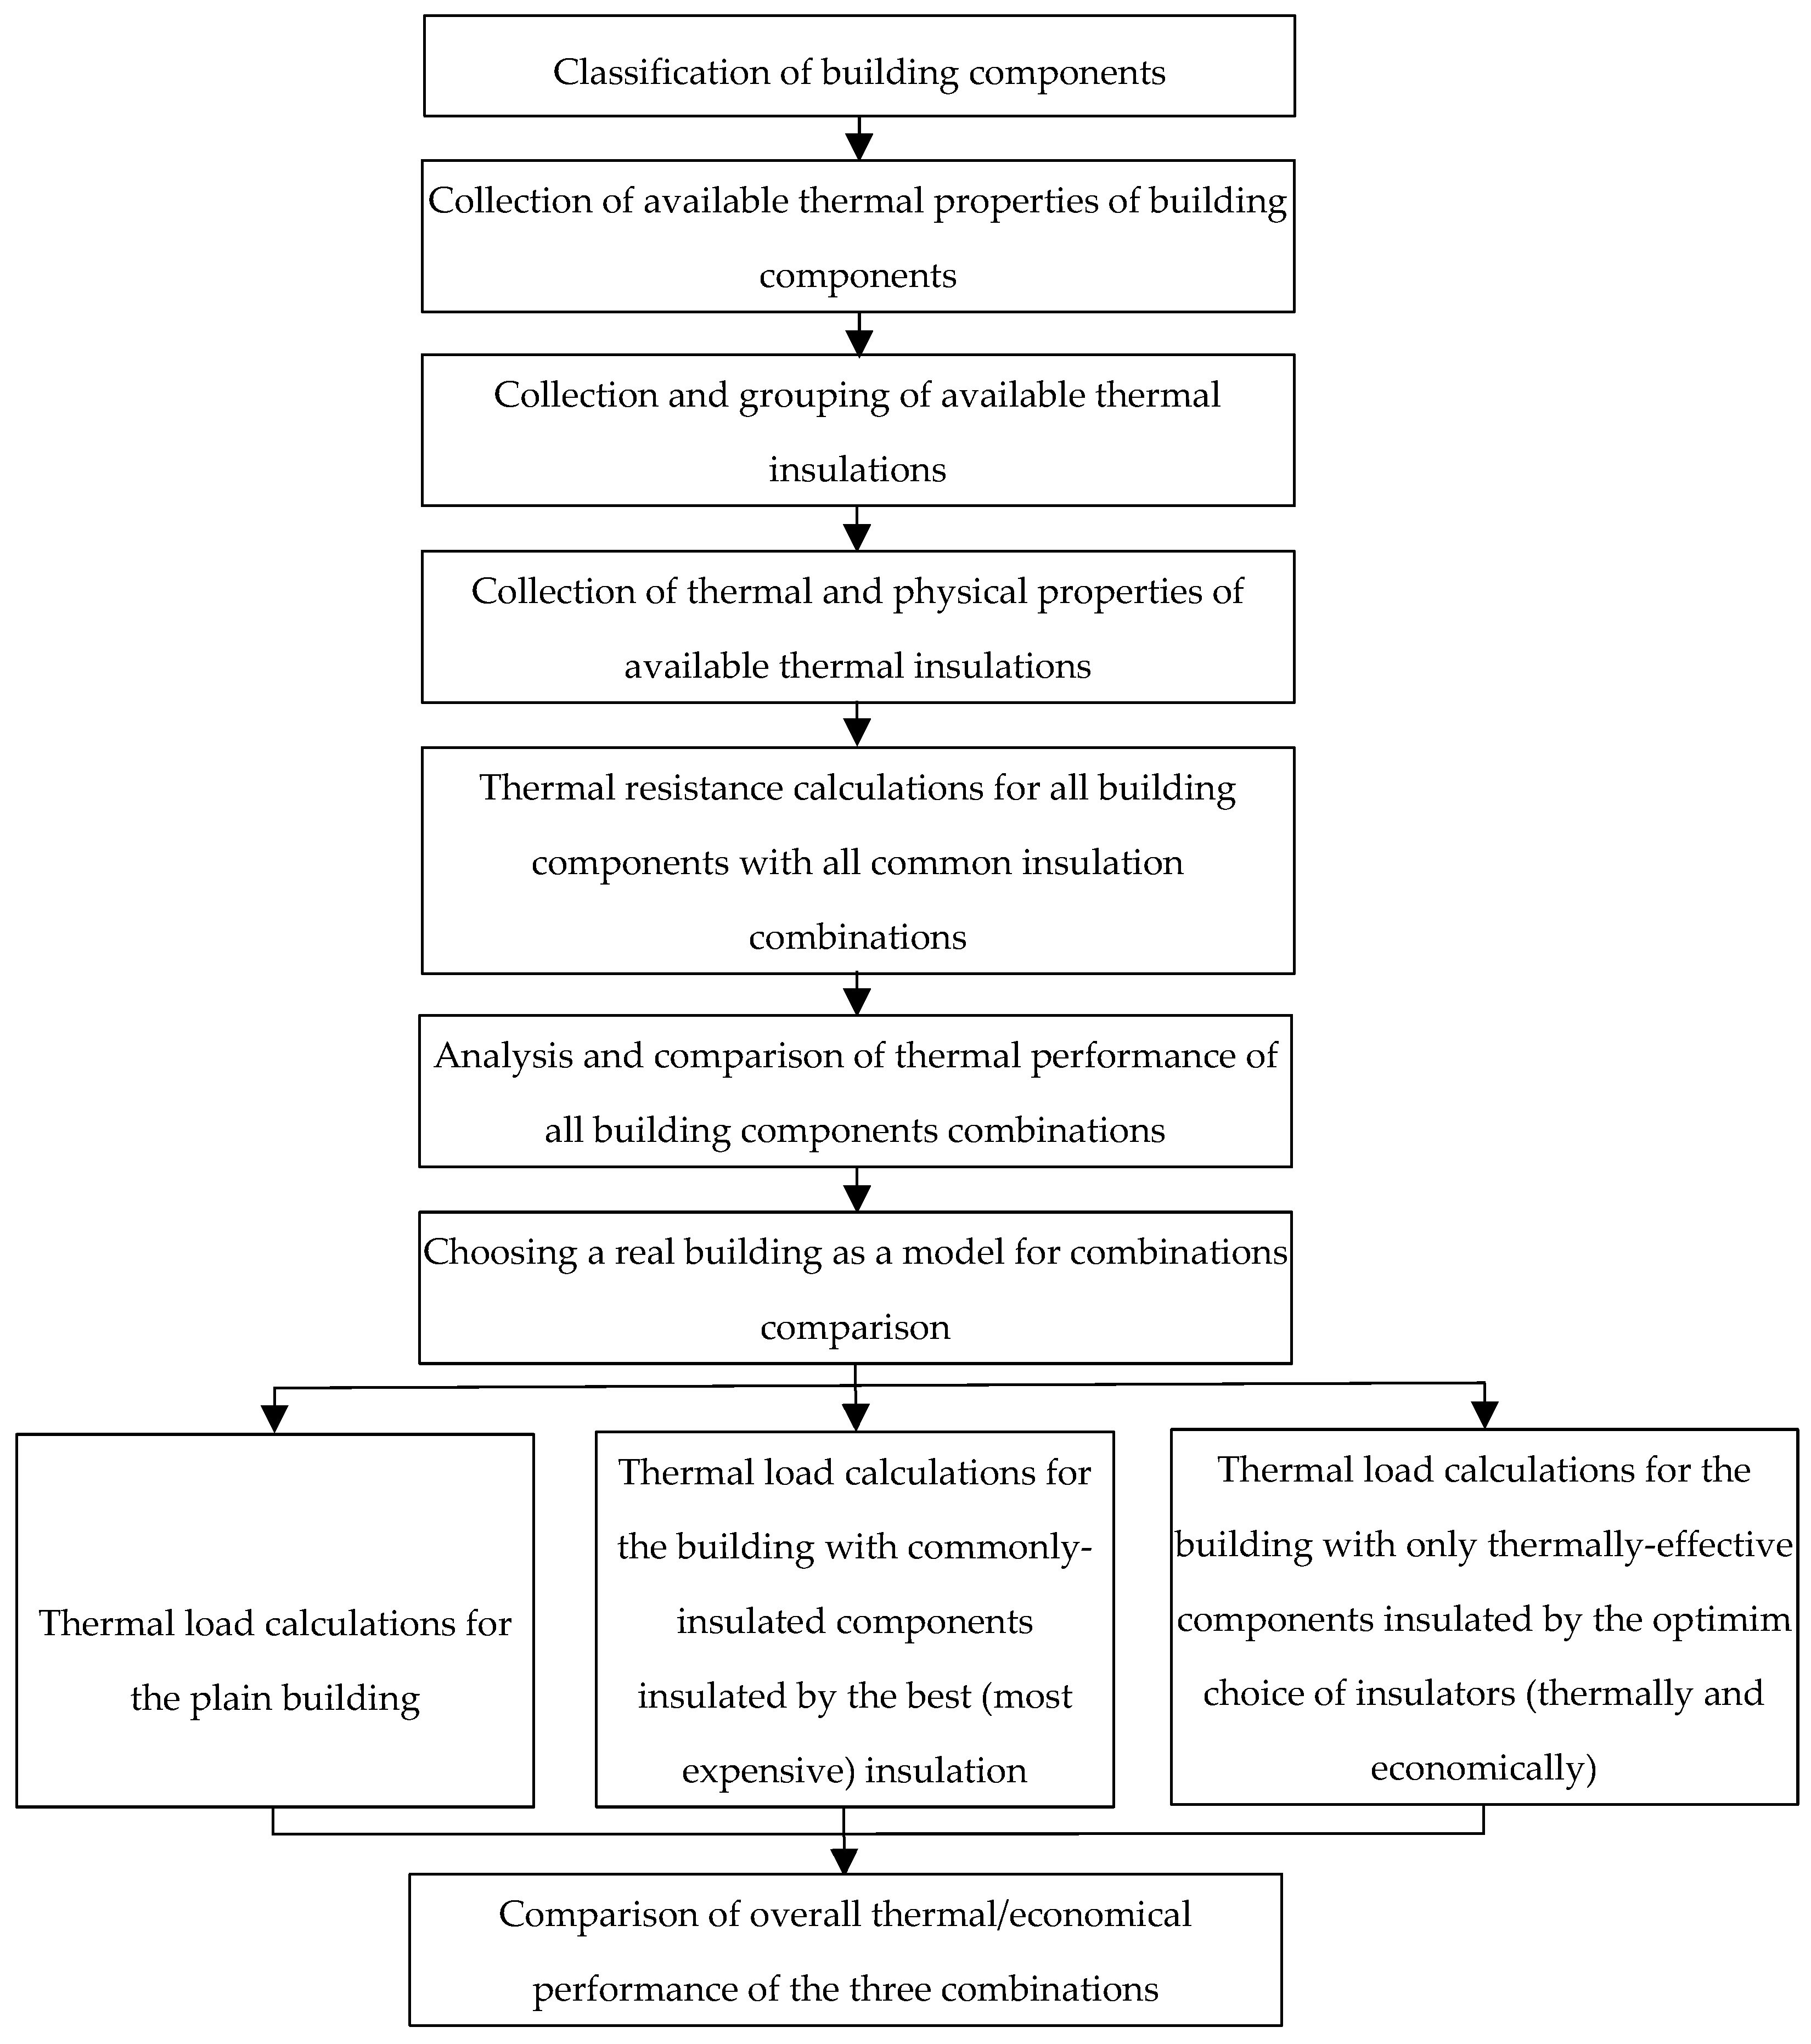
2. Materials and Methods
- The model used for cooling load calculations is a one-dimensional steady-state heat transfer model, which was solved using HAP software.
- Construction deficiencies such as the breaking of insulation boards during installation were not taken into consideration.
- Building components’ uniformity was assumed, i.e., neglecting the interruption of any building component such as plastering between the bricks of single walls, the imperfect match between insulation boards of double walls, and the concrete between hollow block slabs (Hordi) in Hordi roofs.
- As the building was shifted from a single-wall to a double-wall system, the column width was kept fixed even though the thickness of the columns increased.
- Changes in insulation performance over time due to aging and other environmental factors were not considered.
3. Results and Discussion
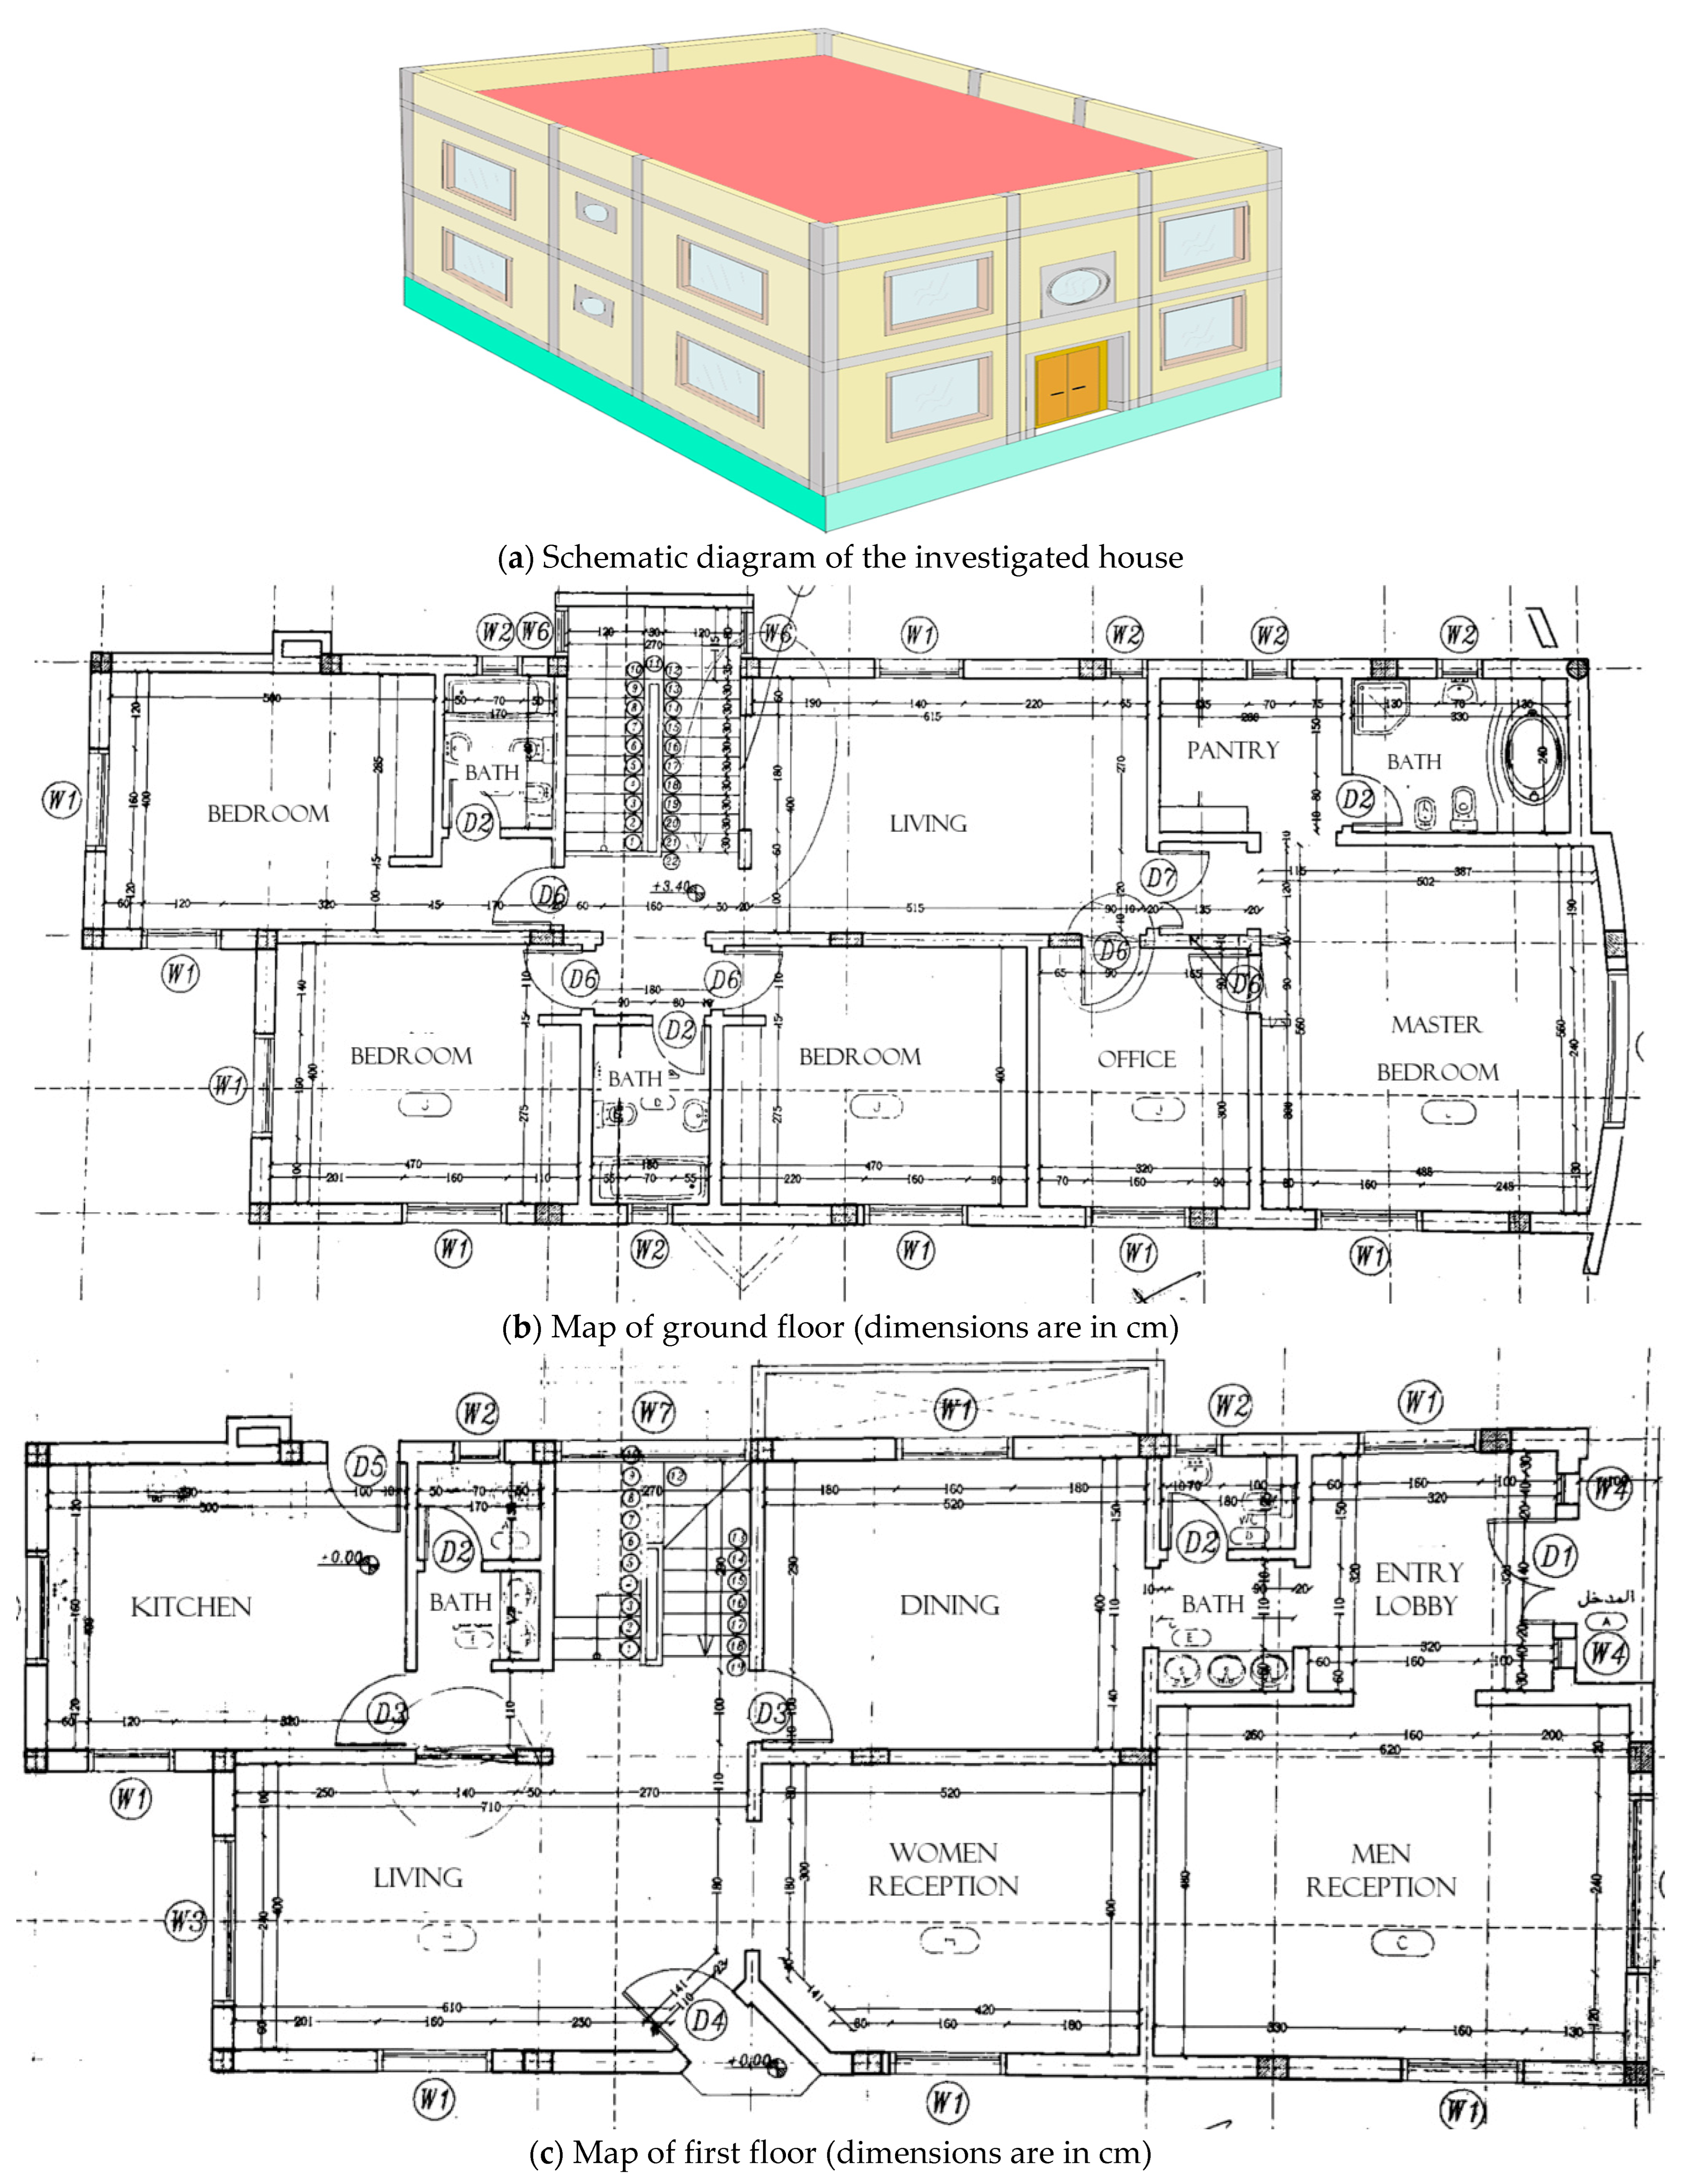
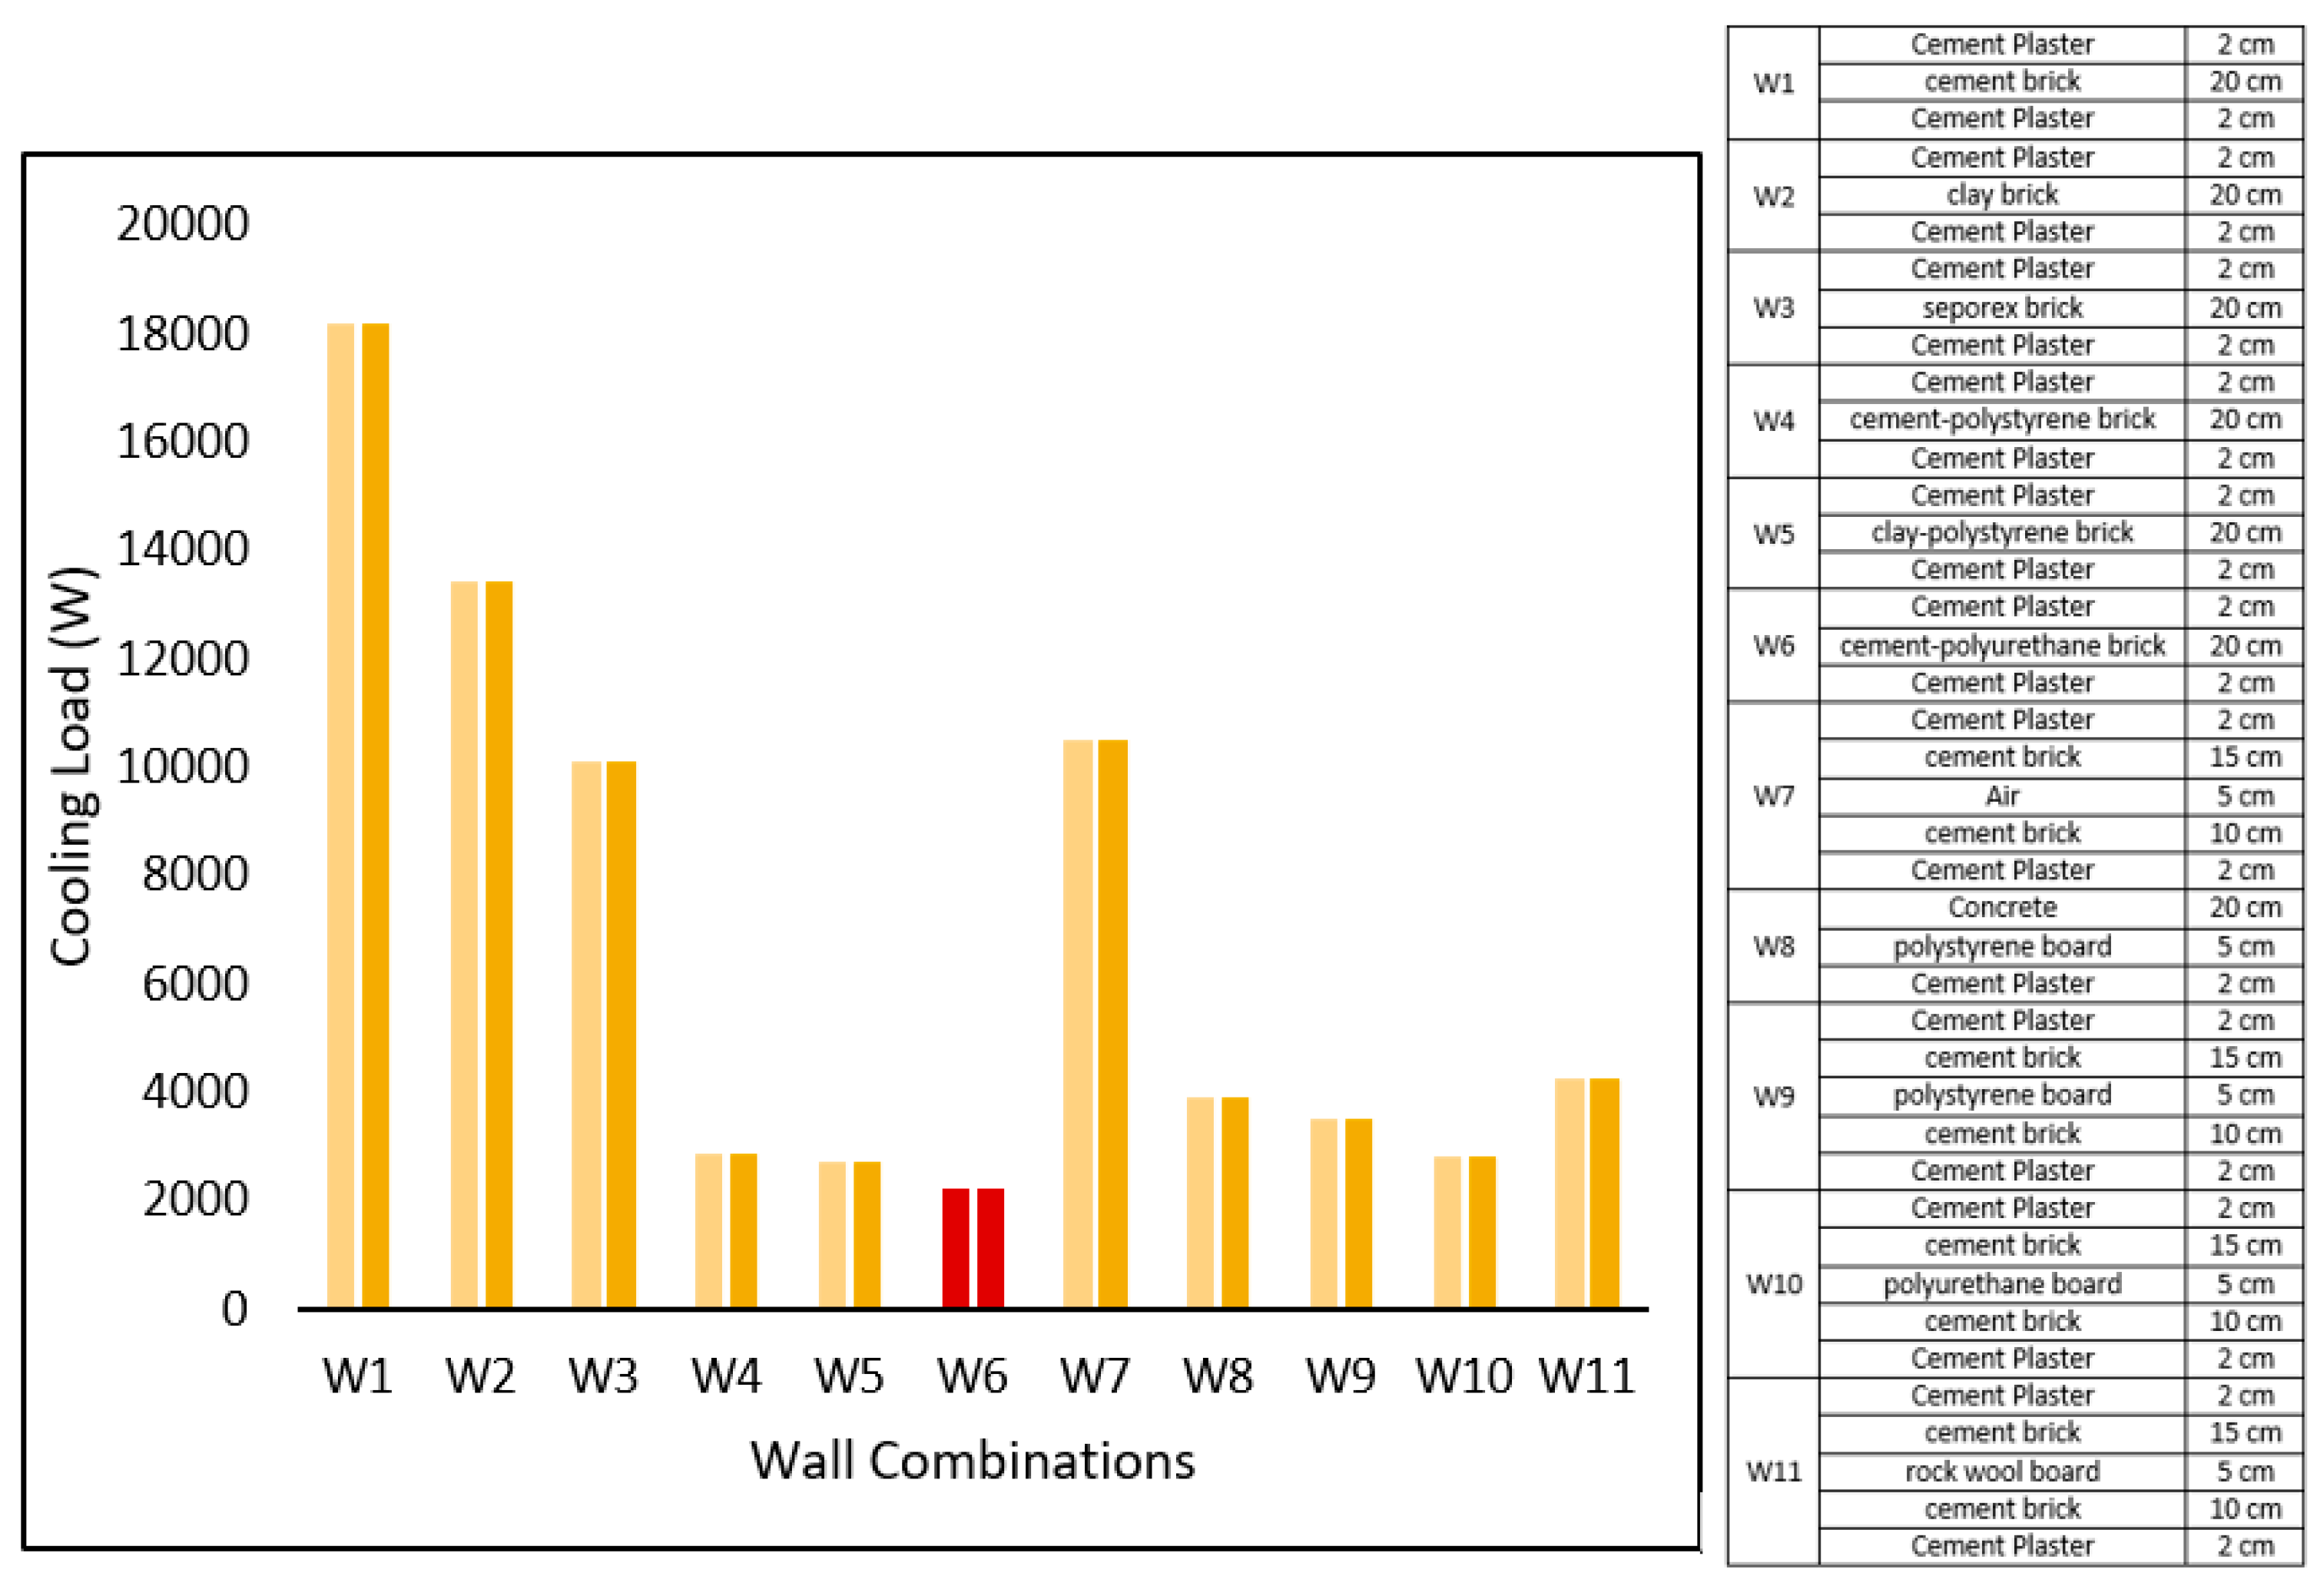
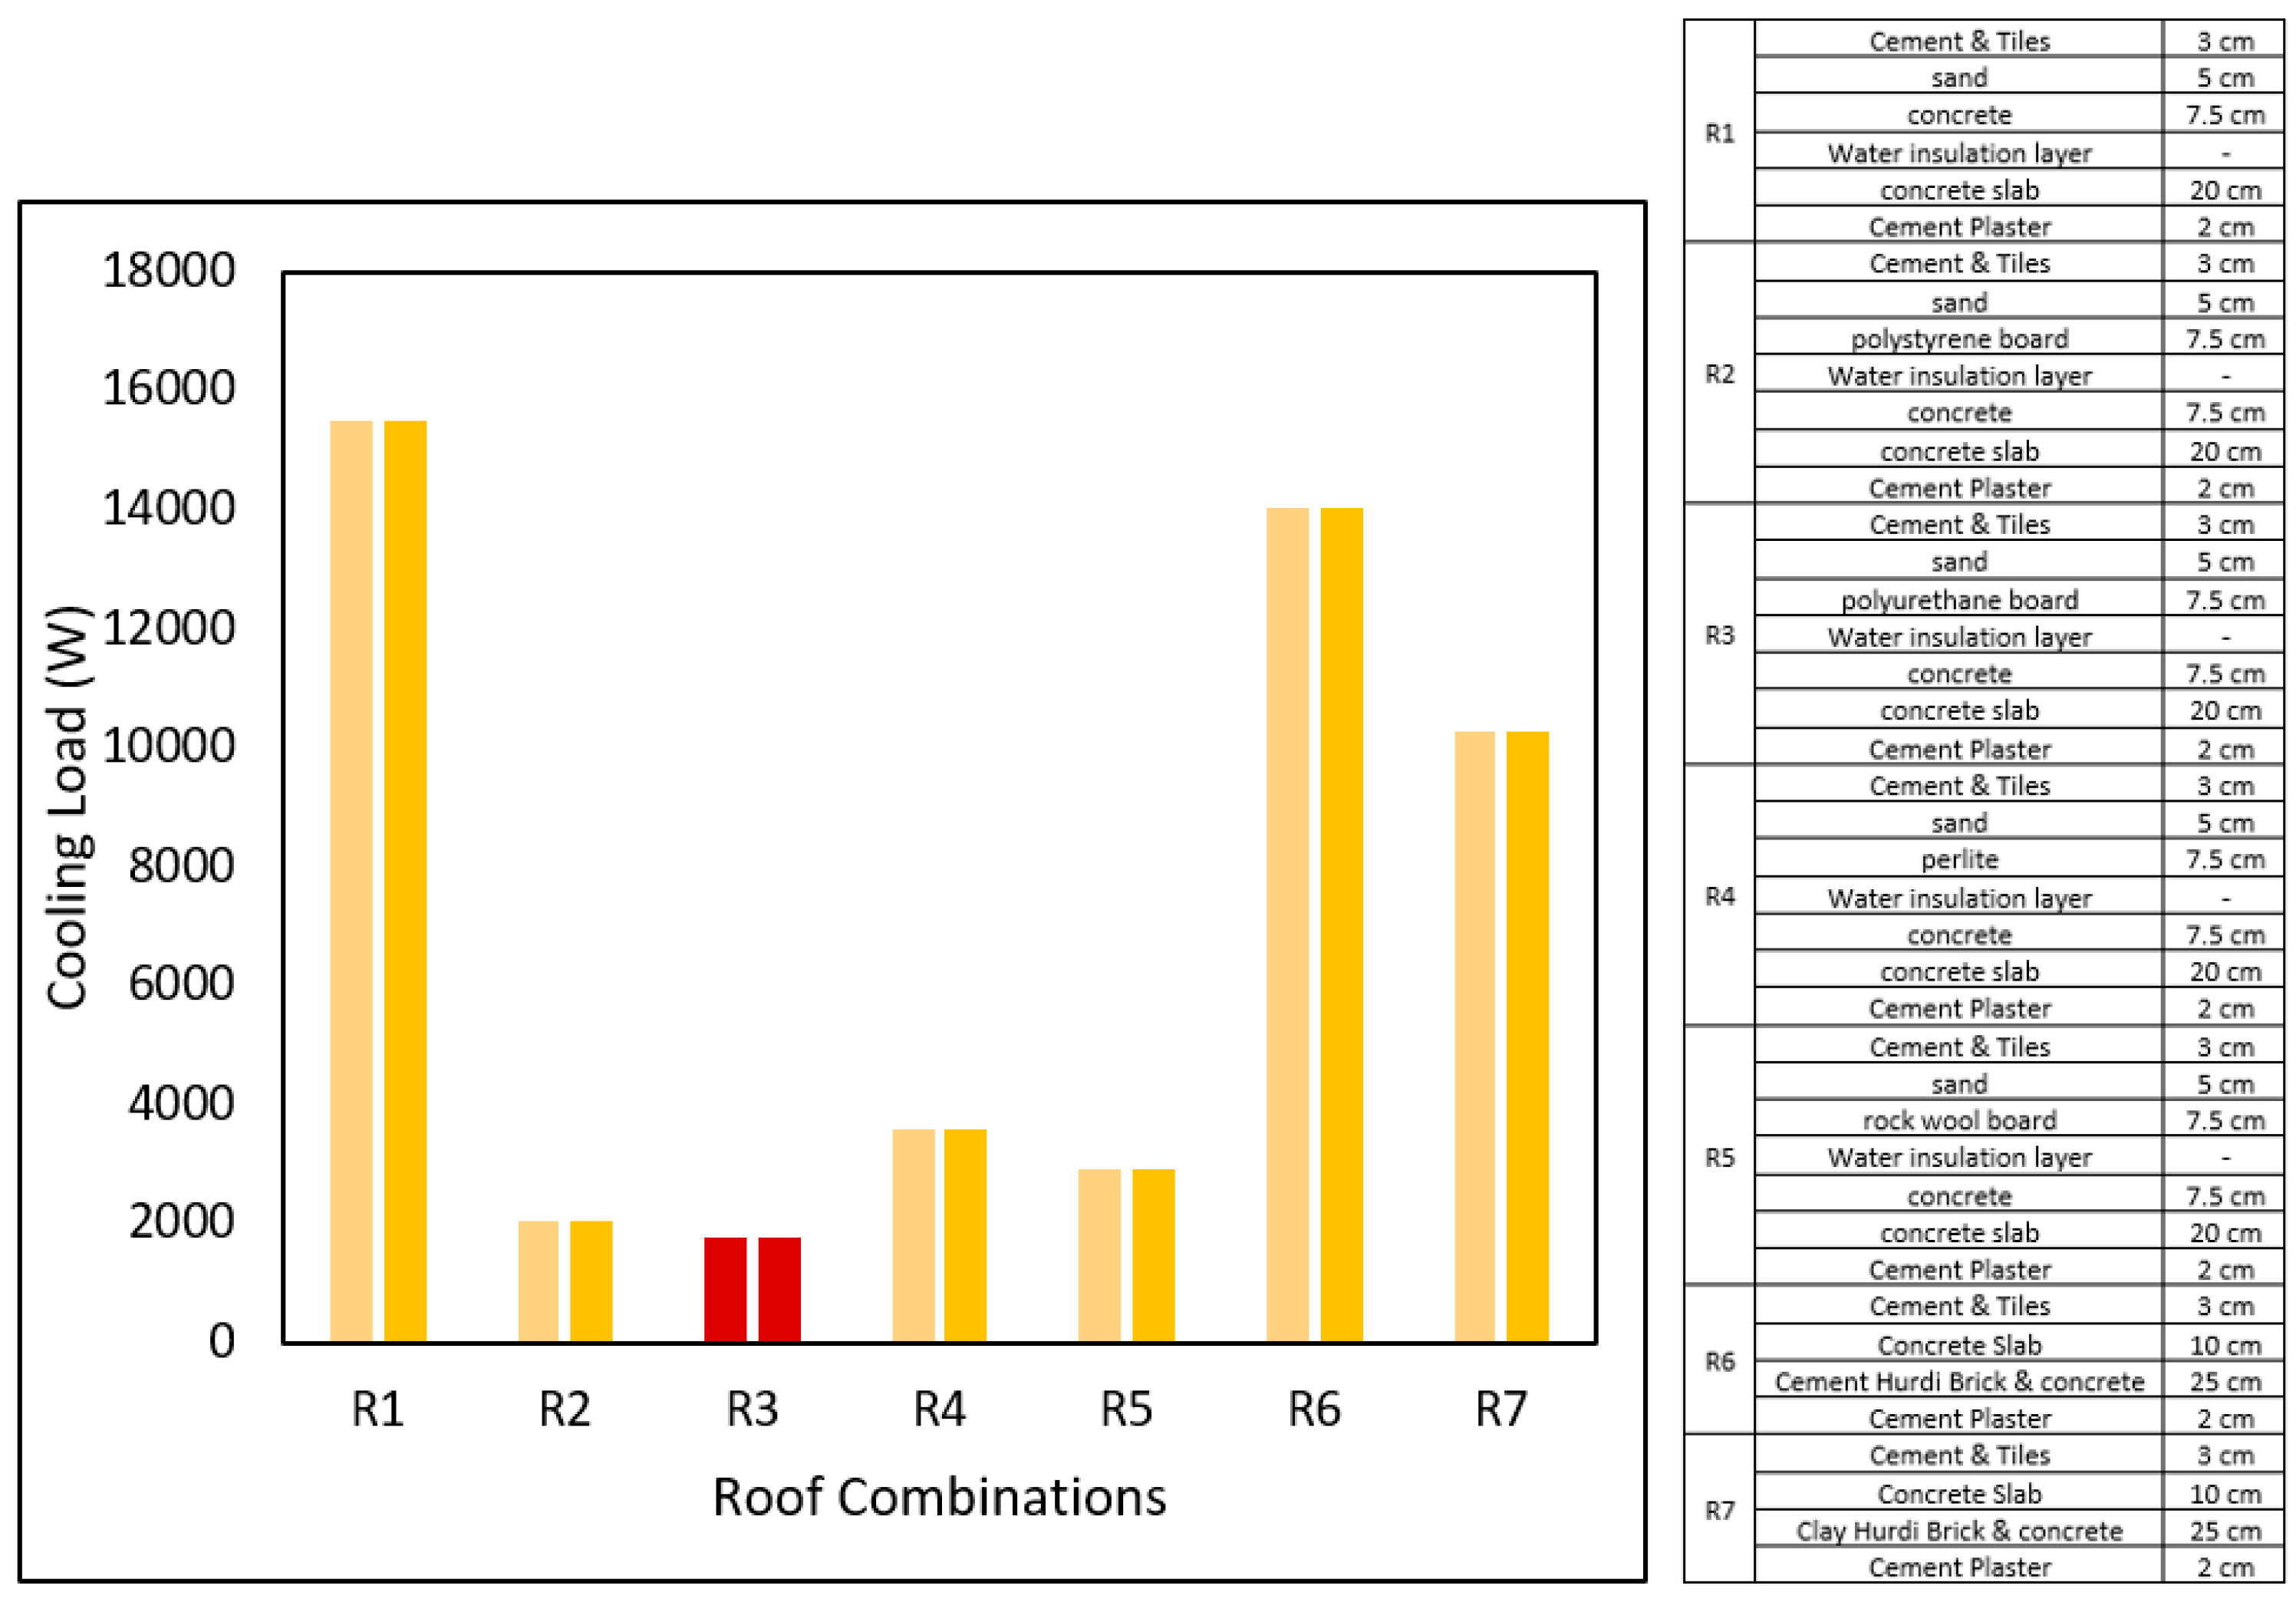
3.1. Analysis of Building Components and Their Insulation
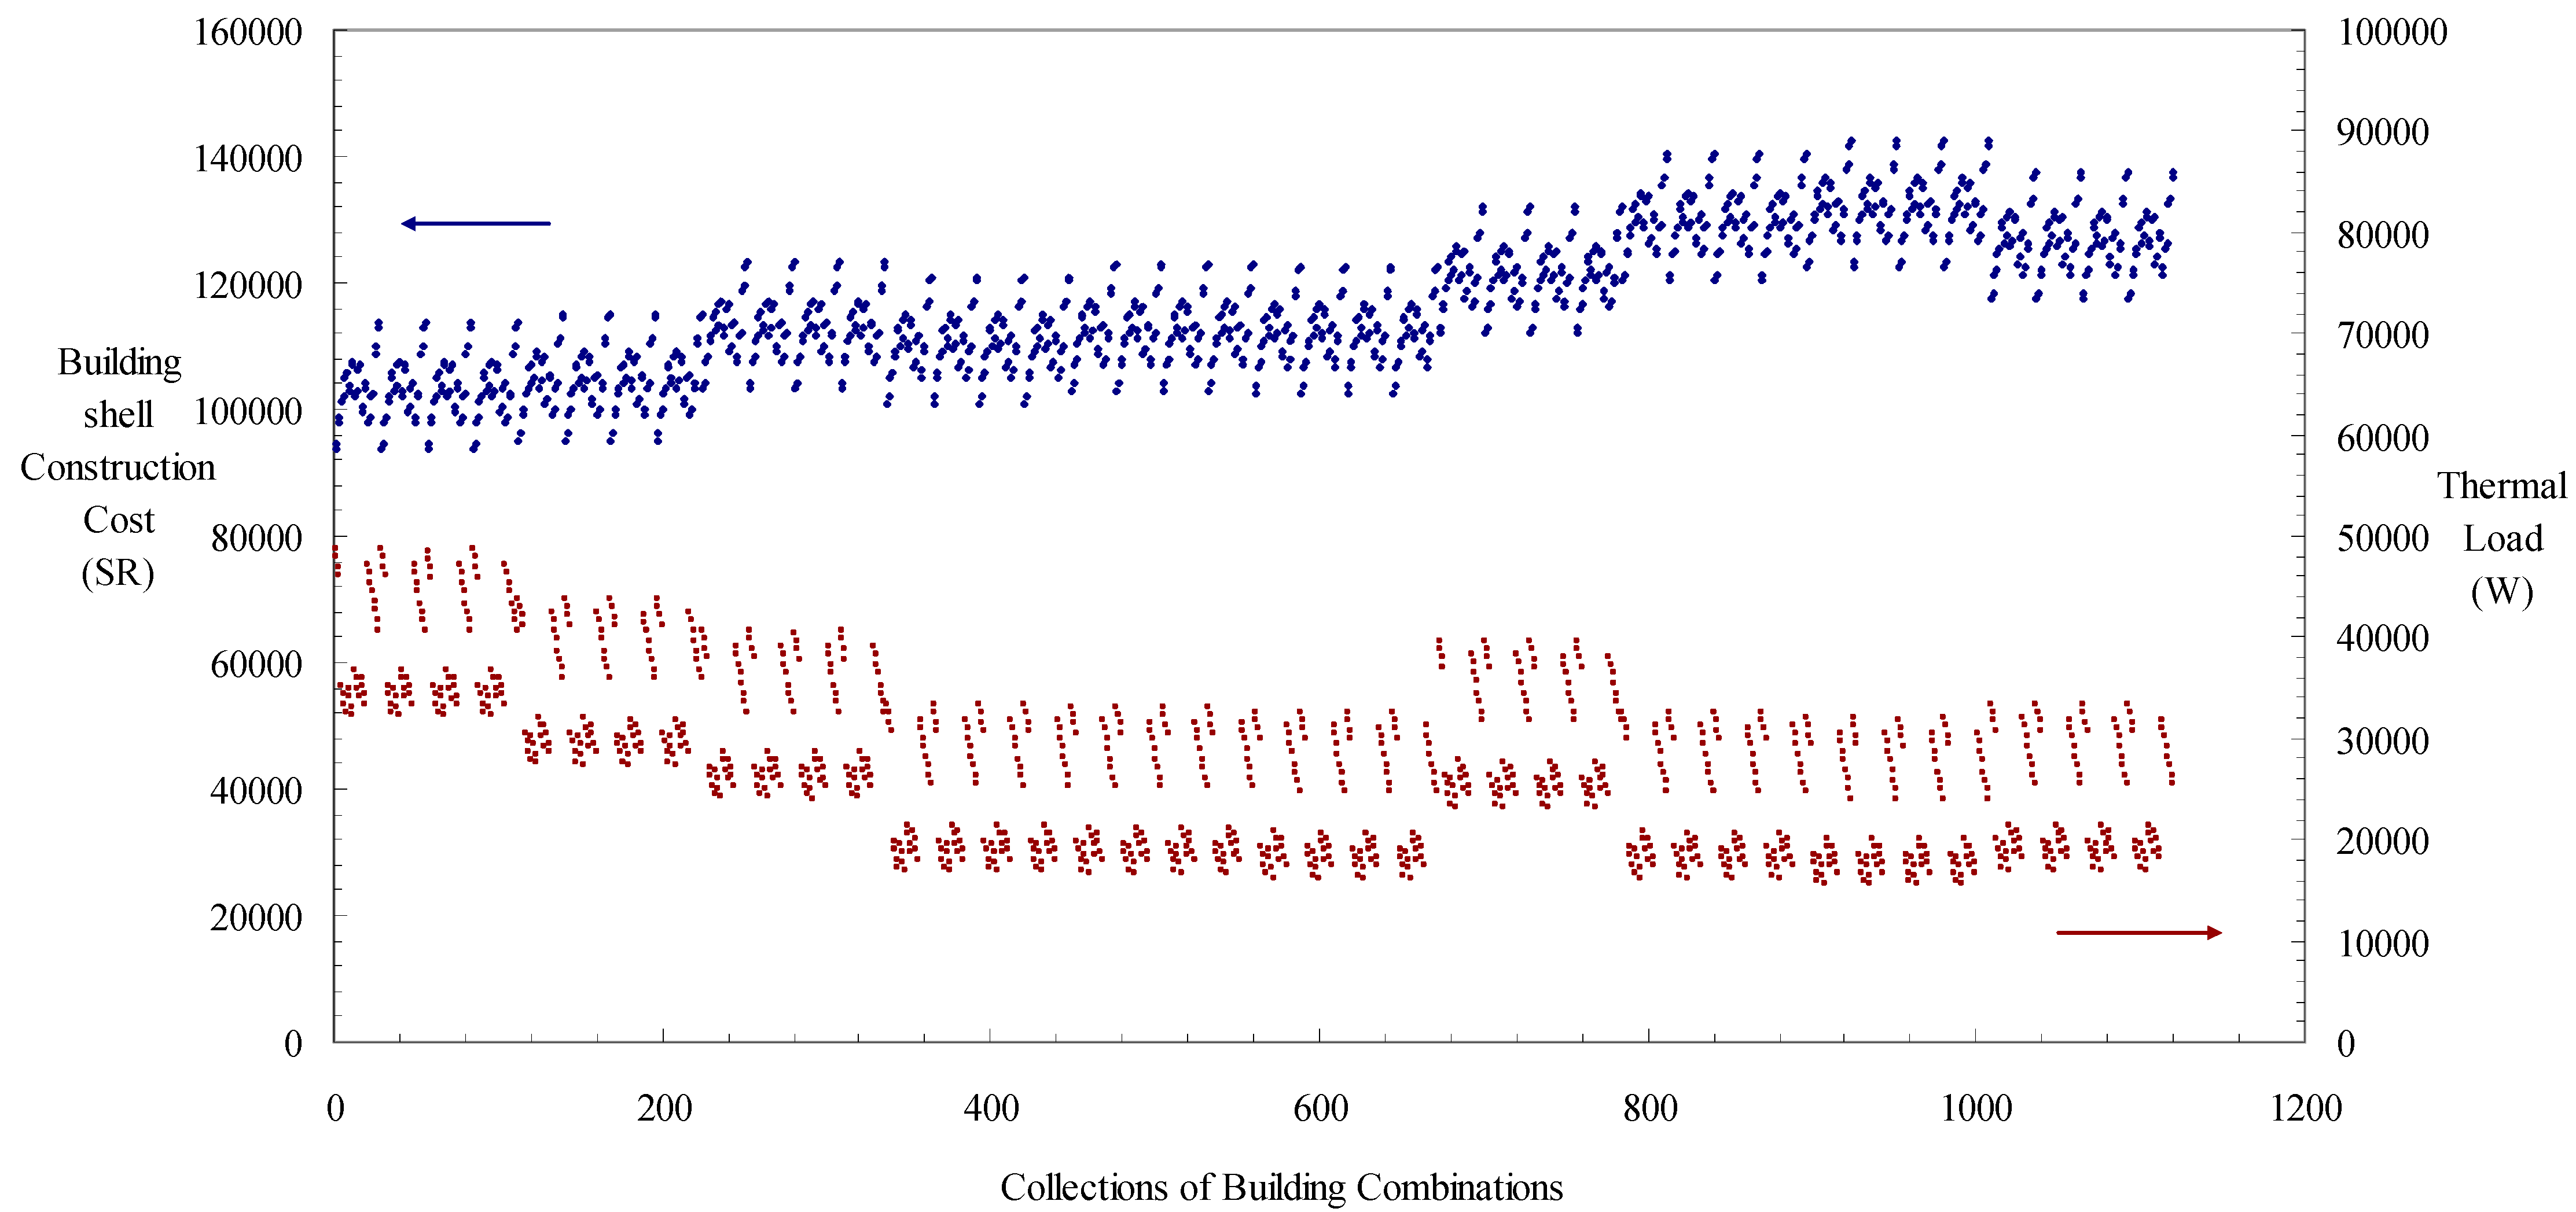
3.2. Cooling Load Estimation of Different Combinations
- The overall cooling load is calculated for the building in its plain form, i.e., without any form of thermal insulation.
- The overall cooling load is calculated for the building with common insulation, i.e., with only walls and windows insulated with the common form of insulation.
- The overall cooling load is calculated for the building heavily insulated with the most expensive insulation available in the local construction market.
- A wide range of cooling load calculations are performed by matching the various combinations of all building components in search of an optimized selection of building combinations (building materials and their insulators) and an optimum match of the combinations of the different components.
4. Conclusions
Author Contributions
Funding
Institutional Review Board Statement
Informed Consent Statement
Data Availability Statement
Acknowledgments
Conflicts of Interest
Appendix A

| Building Component | Building Combination | Combination Code | Combination Layers | Layers’ Thickness (cm) | Overall Thickness (cm) | U-Value (W/m²K) | Cost/m2 (SR) |
|---|---|---|---|---|---|---|---|
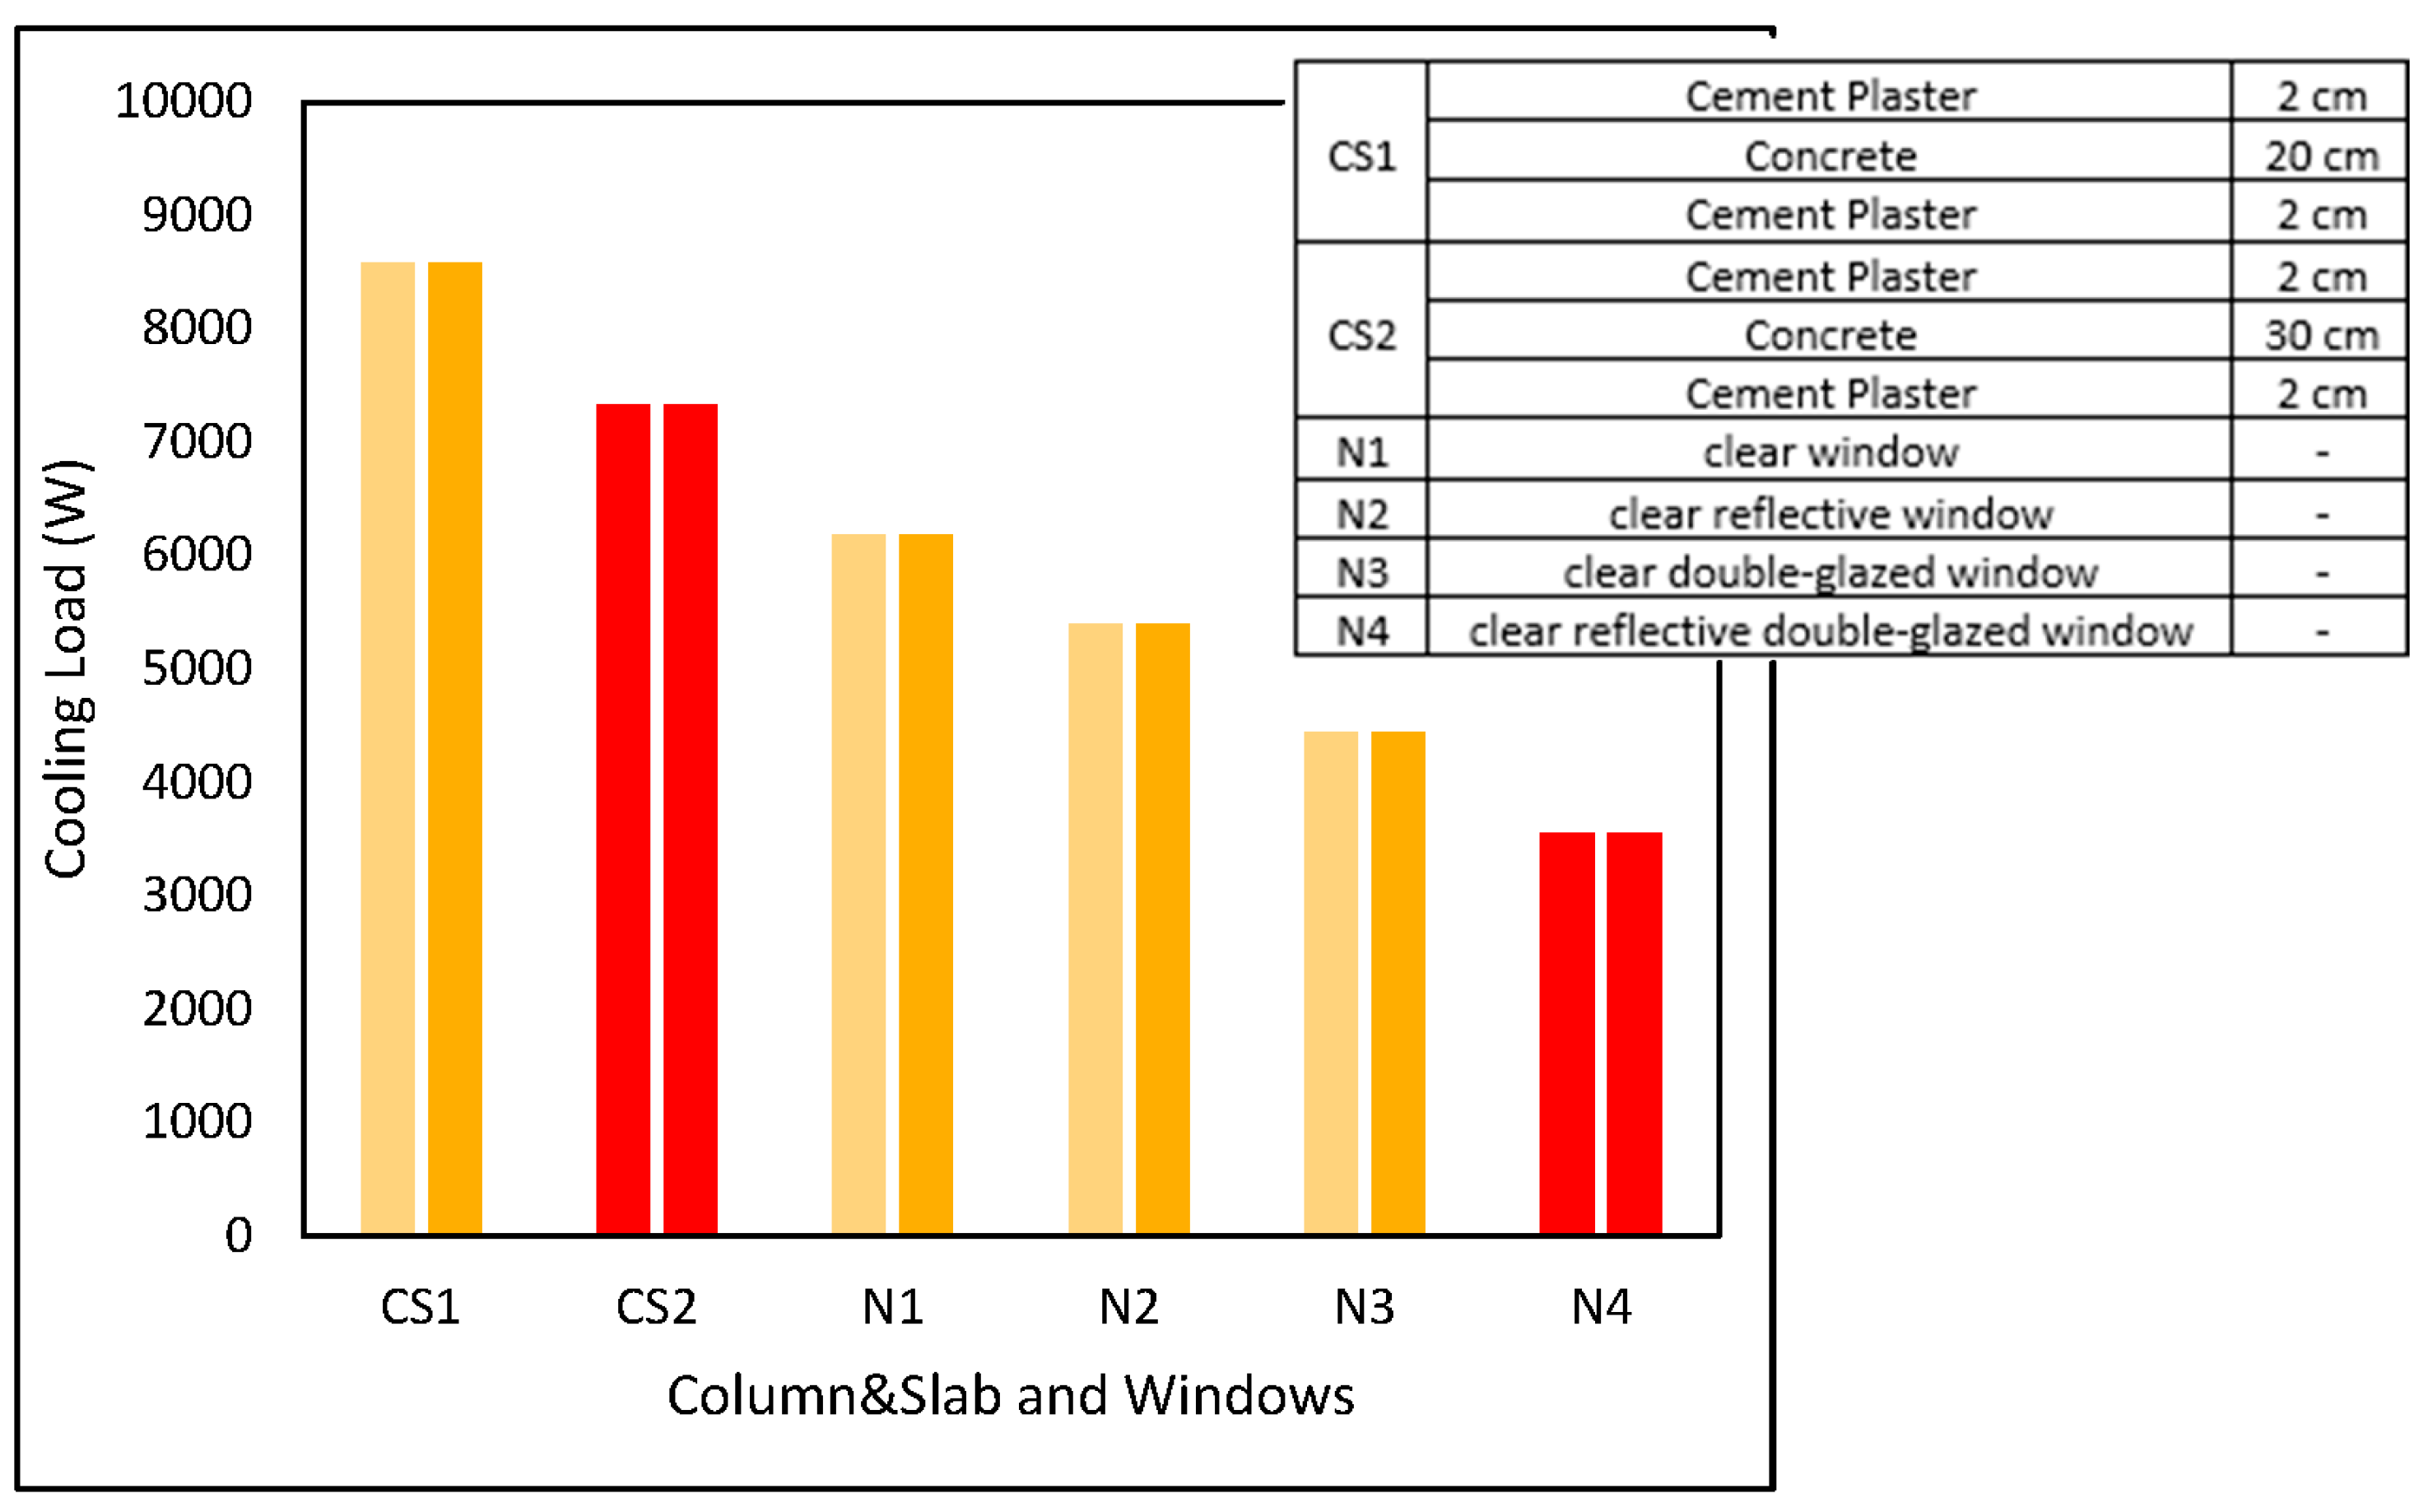
| Columns and Slabs | CnS 200 | CS1 | Cement plaster | 2 | 24 | 2.847 | 120 |
| Concrete | 20 | ||||||
| Cement plaster | 2 | ||||||
| CnS 300 | CS2 | Cement plaster | 2 | 34 | 2.443 | 180 | |
| Concrete | 30 | ||||||
| Cement plaster | 2 | ||||||
| Doors | Ordinary door | D1 | 1.12 | 200 | |||
| Polystyrene-insulated door | D2 | 0.826 | 220 | ||||
| Polyurethane-insulated door | D3 | 0.575 | 232 | ||||
| Injected-insulation door | D4 | 1.02 | 210 | ||||
| Roof | Roof 1, reinforced concrete | R1 | Cement and tiles | 3 | 37.5 | 2.216 | 227 |
| Sand | 5 | ||||||
| Concrete | 7.5 | ||||||
| Water insulation layer | - | ||||||
| Concrete slab | 20 | ||||||
| Cement plaster | 2 | ||||||
| Roof 2, polystyrene–concrete | R2 | Cement and tiles | 3 | 45 | 0.31 | 263.5 | |
| Sand | 5 | ||||||
| Polystyrene board | 7.5 | ||||||
| Water insulation layer | - | ||||||
| Concrete | 7.5 | ||||||
| Concrete slab | 20 | ||||||
| Cement plaster | 2 | ||||||
| Roof 3, polyurethane–concrete | R3 | Cement and tiles | 3 | 45 | 0.269 | 272.5 | |
| Sand | 5 | ||||||
| Polyurethane board | 7.5 | ||||||
| Water insulation layer | - | ||||||
| Concrete | 7.5 | ||||||
| Concrete slab | 20 | ||||||
| Cement plaster | 2 | ||||||
| Roof 4, perlite–concrete | R4 | Cement and tiles | 3 | 45 | 0.543 | 269 | |
| Sand | 5 | ||||||
| Perlite | 7.5 | ||||||
| Water insulation layer | - | ||||||
| Concrete | 7.5 | ||||||
| Concrete slab | 20 | ||||||
| Cement plaster | 2 | ||||||
| Roof 5, rockwool–concrete | R5 | Cement and tiles | 3 | 45 | 0.447 | 255.5 | |
| Sand | 5 | ||||||
| Rockwool board | 7.5 | ||||||
| Water insulation layer | - | ||||||
| Concrete | 7.5 | ||||||
| Concrete slab | 20 | ||||||
| Cement plaster | 2 | ||||||
| Roof 6, cement Hordi | R6 | Cement and tiles | 3 | 40 | 1.915 | 247.5 | |
| Concrete slab | 10 | ||||||
| Cement Hordi Brick and concrete | 25 | ||||||
| Cement plaster | 2 | ||||||
| Roof 7, clay Hordi | R7 | Cement and tiles | 3 | 40 | 1.412 | 303 | |
| Concrete slab | 10 | ||||||
| Clay Hordi brick and concrete | 25 | ||||||
| Cement plaster | 2 | ||||||
| Walls | Single wall 1, cement bricks | W1 | Cement plaster | 2 | 24 | 2.34 | 79.5 |
| Cement brick | 20 | ||||||
| Cement plaster | 2 | ||||||
| Single wall 2, clay bricks | W2 | Cement plaster | 2 | 24 | 1.75 | 83.5 | |
| clay brick | 20 | ||||||
| Cement plaster | 2 | ||||||
| Single wall 4, Siporex bricks | W3 | Cement plaster | 2 | 24 | 1.321 | 108 | |
| Siporex brick | 20 | ||||||
| Cement plaster | 2 | ||||||
| Single wall 5, polystyrene–cement bricks | W4 | Cement plaster | 2 | 24 | 0.398 | 101 | |
| Cement–polystyrene brick | 20 | ||||||
| Cement plaster | 2 | ||||||
| Single wall 6, polystyrene–clay bricks | W5 | Cement plaster | 2 | 24 | 0.38 | 107 | |
| Clay–polystyrene brick | 20 | ||||||
| Cement plaster | 2 | ||||||
| Single wall 7 polyurethane-cement bricks | W6 | Cement plaster | 2 | 24 | 0.308 | 106 | |
| Cement–polyurethane brick | 20 | ||||||
| Cement plaster | 2 | ||||||
| Double wall 1, air between cement bricks | W7 | Cement plaster | 2 | 34 | 1.482 | 110 | |
| Cement brick | 15 | ||||||
| Air | 5 | ||||||
| Cement brick | 10 | ||||||
| Cement plaster | 2 | ||||||
| Double wall 2, concrete and polystyrene | W8 | Concrete | 20 | 27 | 0.53 | 158 | |
| Polystyrene board | 5 | ||||||
| Cement plaster | 2 | ||||||
| Double wall 3, polystyrene between cement bricks | W9 | Cement plaster | 2 | 34 | 0.481 | 135 | |
| Cement brick | 15 | ||||||
| Polystyrene board | 5 | ||||||
| Cement brick | 10 | ||||||
| Cement plaster | 2 | ||||||
| Double wall 4, polyurethane between cement bricks | W10 | Cement plaster | 2 | 34 | 0.385 | 141.5 | |
| cement brick | 15 | ||||||
| Polyurethane board | 5 | ||||||
| Cement brick | 10 | ||||||
| Cement plaster | 2 | ||||||
| Double wall 5, rockwool between cement bricks | W11 | Cement plaster | 2 | 34 | 0.587 | 126 | |
| Cement brick | 15 | ||||||
| Rockwool board | 5 | ||||||
| Cement brick | 10 | ||||||
| Cement plaster | 2 | ||||||
| Windows | Clear window | N1 | 6.884 | 180 | |||
| Clear reflective window | N2 | 6.884 | 220 | ||||
| Clear double-glazed window | N3 | 350 | |||||
| Clear reflective double-glazed window | N4 | 380 | |||||
References
- The Research Institute. Testing of El-Maimani Red Clay Bricks to Determine Thermal Characteristics; King Fahd University of Petroleum and Minerals, Prepared for El-Maimani Red Bricks and Clay; King Fahd University of Petroleum and Minerals: Dhahran, Saudi Arabia, 1989. [Google Scholar]
- The Research Institute. Simulation of Energy and Cost Effectiveness Studies for Residential Buildings Built from Clay Brick; King Fahd University of Petroleum and Minerals, Prepared for the Committee of Clay Brick Producers in Saudi Arabia; King Fahd University of Petroleum and Minerals: Dhahran, Saudi Arabia, 1991. [Google Scholar]
- Almazroui, M. Changes in Temperature Trends and Extremes over Saudi Arabia for the Period 1978–2019. Adv. Meteorol. 2020, 2020, 8828421. [Google Scholar] [CrossRef]
- Thangarasu, A.; Henderson, J.H. Thermal and Structural Behaviour of Sandwiched Reinforced Cement Concrete Wall Panels. Mater. Sci. 2022, 28, 4. [Google Scholar] [CrossRef]
- Bolattürk, A. Determination of optimum insulation thickness for building walls with respect to various fuels and climate zones in Turkey. Appl. Therm. Eng. 2006, 26, 1301–1309, ISSN 1359-4311. [Google Scholar] [CrossRef]
- Kim, Y.J.; Allard, A. Thermal response of precast concrete sandwich walls with various steel connectors for architectural buildings in cold regions. Energy Build. 2014, 80, 137–148, ISSN 0378-7788. [Google Scholar] [CrossRef]
- Ucar, A.; Balo, F. Effect of fuel type on the optimum thickness of selected insulation materials for the four different climatic regions of Turkey. Appl. Energy 2009, 86, 730–736, ISSN 0306-2619. [Google Scholar] [CrossRef]
- Ahmad, S. Energy Saving through Thermal Insulation in Buildings. Hous. Sci. 1983, 7, 297. [Google Scholar]
- Ferieg, S.; Younis, M. Effect of Energy Conservation Measures in the Life Cycle Cost of Kuwaiti Residential Buildings. Energy Build. 1985, 8, 71. [Google Scholar] [CrossRef]
- Said, A.; Abdelrahman, M.; Racz, G. Economics of Thermal Insulation in the Eastern Province of Saudi Arabia. ASHRAE Trans. 1989, 96 Pt 1, 83–90. [Google Scholar]
- Mujahid, A.; Zedan, M. Comparison of Thermal Performance of Methods of Insulation in Buildings. Al-Mohandis 1996, 9, 3. [Google Scholar]
- Tewfik, K.M. Evaluating the Effect of Design and Construction Deficiencies on the Economic Performance of Wall Thermal Insulation Systems. Ph.D. Thesis, The University of Michigan, Ann Arbor, MI, USA, 1993. [Google Scholar]
- SCECO-Eastern Province. Insulating Glass and Its Effect in Conservation of Electricity Consumption. Arabic Booklet. Available online: https://www.se.com.sa/ar-sa/MarketingPrintMaterial/NewID/%D8%A7%D9%84%D8%AF%D9%84%D9%8A%D9%84%20%D8%A7%D9%84%D8%A7%D9%95%D8%B1%D8%B4%D8%A7%D8%AF%D9%8A%20%D9%84%D8%A7%D9%94%D9%86%D8%B8%D9%85%D8%A9%20%D9%88%D9%85%D9%88%D8%A7%D8%AF%20%D8%A7%D9%84%D8%B9%D8%B2%D9%84%20%D8%A7%D9%84%D8%AD%D8%B1%D8%A7%D8%B1%D9%8A.pdf (accessed on 20 March 2023).
- Samen, V.E.L.K.; Nemaleu, J.G.D.; Kaze, R.C.; Kammogne, F.D.; Meukam, P.; Kamseu, E.; Leonelli, C. A Low Thermal Conductivity of Lightweight Laterite-cement Composites with Cotton Wastes Fibres. Silicon 2022, 14, 8205–8222. [Google Scholar] [CrossRef]
- Lamrani Alaoui, A.; Amrani, A.; Alami Merrouni, A.; Daoudia, A.; El Hassouani, Y. Optimization of thermal efficiency in traditional clay-based buildings in hot–dry locations. Case study: The south-eastern region of Morocco. Int. J. Energy Environ. Eng. 2022, 13, 499–514. [Google Scholar] [CrossRef]
- Available online: https://www.carrier.com/commercial/en/us/software/hvac-system-design/hourly-analysis-program/ (accessed on 20 January 2023).
- The Research Institute. Simulation of Energy and Cost Effectiveness Studies for Residential Buildings Built from Clay Brick versus Other Masonry Construction, Final Report; King Fahd University of Petroleum and Minerals, Prepared for Committee of Clay Brick Producers in Saudi Arabia; King Fahd University of Petroleum and Minerals: Dhahran, Saudi Arabia, 1990. [Google Scholar]


| Building Material or Insulation Material | Conductivity (W/mK) | Thickness (mm) | Density (kg/m3) | Specific Heat (J/kgK) | R (m2K/W) | Rt (m2K/W) | |
|---|---|---|---|---|---|---|---|
| Cement plaster | 0.72 | 20 | 1860 | 840 | 0.028 | ||
| 0.8 | 20 | 1682 | 840 | 0.025 | |||
| Heavy-weight hollow cement brick HWHCB (200 mm) | 1.04 | 200 | 1105 | 840 | 0.192 | ||
| HWHCB (150 mm) | 0.96 | 150 | 1362 | 840 | 0.156 | ||
| HWHCB (100 mm) | 0.81 | 100 | 1618 | 840 | 0.123 | ||
| Cement brick, hollow block slab (Hordi) | 1.092 | 250 | 1083 | 840 | 0.229 | ||
| Hollow clay brick (300 × 200 × 200) | 0.595 | 200 | 833 | 880 | 0.336 | ||
| Hollow clay brick (300 × 200 × 150) | 0.497 | 150 | 778 | 880 | 0.302 | ||
| Hollow clay brick (300 × 200 × 100) | 0.44 | 100 | 834 | 880 | 0.227 | ||
| Hollow clay brick Hordi (450 × 200 × 200) | 0.603 | 200 | 722 | 880 | 0.332 | ||
| Polystyrene-insulated cement brick | Solid cement brick (80 mm) | 1.42 | 80 | 2400 | 840 * | 0.056 | 2.279 |
| Extruded polystyrene (70 mm) | 0.032 | 70 | 28 | 1280 * | 2.188 | ||
| Solid cement brick (50 mm) | 1.42 | 50 | 2400 | 840 * | 0.035 | ||
| Polyurethane-insulated cement brick | Solid cement brick (80 mm) | 1.42 | 80 | 2400 | 840 * | 0.056 | 3.008 |
| Polyurethane (70 mm) | 0.024 | 70 | 28 | 1537 * | 2.917 | ||
| Solid cement brick (50 mm) | 1.42 | 50 | 2400 | 840 * | 0.035 | ||
| Polystyrene-insulated clay brick | Solid clay brick (80 mm) | 0.636 | 80 | 2400 | 840 * | 0.126 | 2.392 |
| Extruded polystyrene (70 mm) | 0.032 | 70 | 28 | 1280 * | 2.188 | ||
| Solid clay brick (50 mm) | 0.636 | 50 | 2400 | 840 | 0.079 | ||
| Reinforced concrete (75 mm) | 1.726 | 75 | 2400 | 960 | 0.043 | ||
| 1.75 | 75 | 2300 | 960 | 0.043 | |||
| Reinforced concrete (100 mm) | 1.726 | 100 | 2400 | 960 | 0.058 | ||
| 1.75 | 100 | 2300 | 960 | 0.057 | |||
| Reinforced concrete (200 mm) | 1.726 | 200 | 2400 | 960 | 0.116 | ||
| 1.75 | 200 | 2300 | 960 | 0.114 | |||
| Reinforced concrete (250 mm) | 1.726 | 250 | 2400 | 960 | 0.145 | ||
| 1.75 | 250 | 2300 | 960 | 0.143 | |||
| Reinforced concrete (300 mm) | 1.726 | 300 | 2400 | 960 | 0.174 | ||
| 1.75 | 300 | 2300 | 960 | 0.171 | |||
| Precast concrete (75 mm) | 1.5718 | 75 | 2500 | 960 | 0.048 | ||
| Siporex brick | 0.383 | 200 | 633 | N/A | 0.522 | ||
| Sand | 0.87 | 50 | 1500 | 880 | 0.057 | ||
| Cement tile | 1.06 | 30 | 1500 | 840 | 0.028 | ||
| Extruded polystyrene | 0.032 | 50 | 28 | 1280 | 1.563 | ||
| Extruded polystyrene | 0.032 | 75 | 28 | 1280 | 2.344 | ||
| Extruded polystyrene—roof | 0.027 | 75 | 33 | 1280 | 2.778 | ||
| Polyurethane (board) | 0.024 | 50 | 28 | 1537 | 2.083 | ||
| Polyurethane (board) | 0.024 | 75 | 28 | 1537 | 3.125 | ||
| Polyurethane—roof | 0.023 | 75 | 30 | 1537 | 3.261 | ||
| Rockwool | 0.042 | 50 | 50 | 840 | 1.190 | ||
| Rockwool | 0.042 | 75 | 50 | 840 | 1.786 | ||
| Perlite (loose fill) | 0.054 | 75 | 94 | 1090 | 1.389 | ||
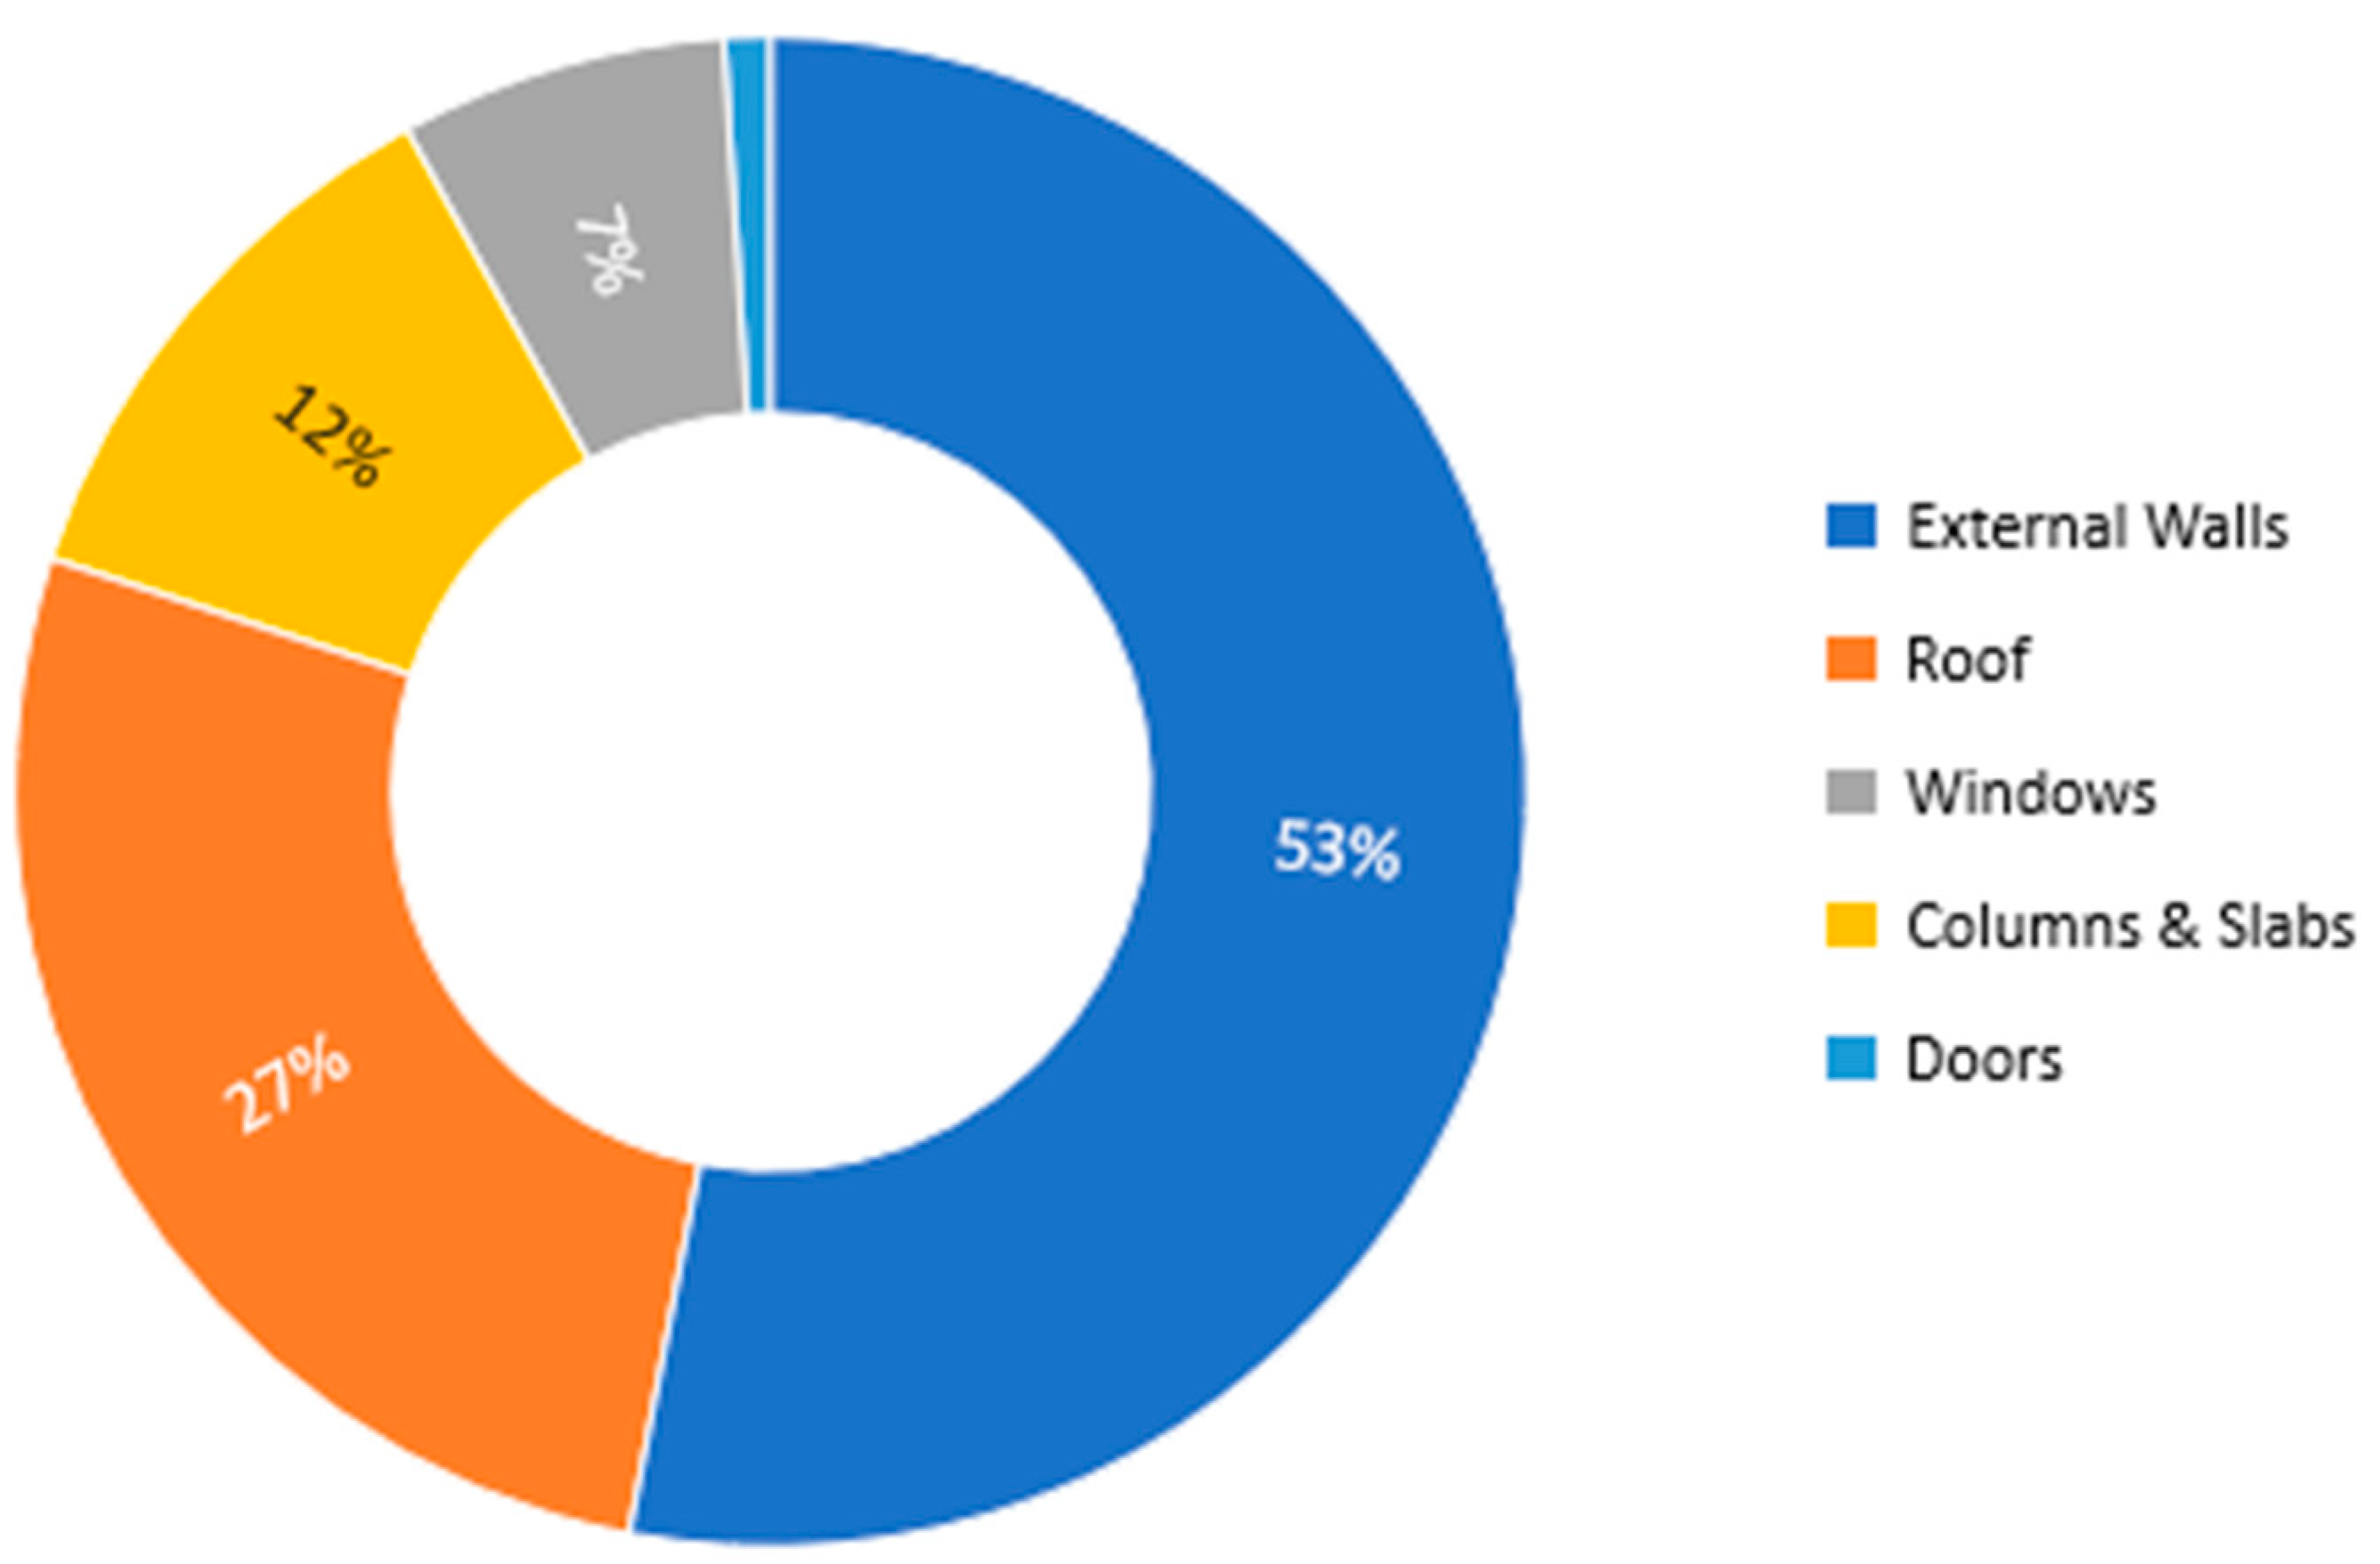
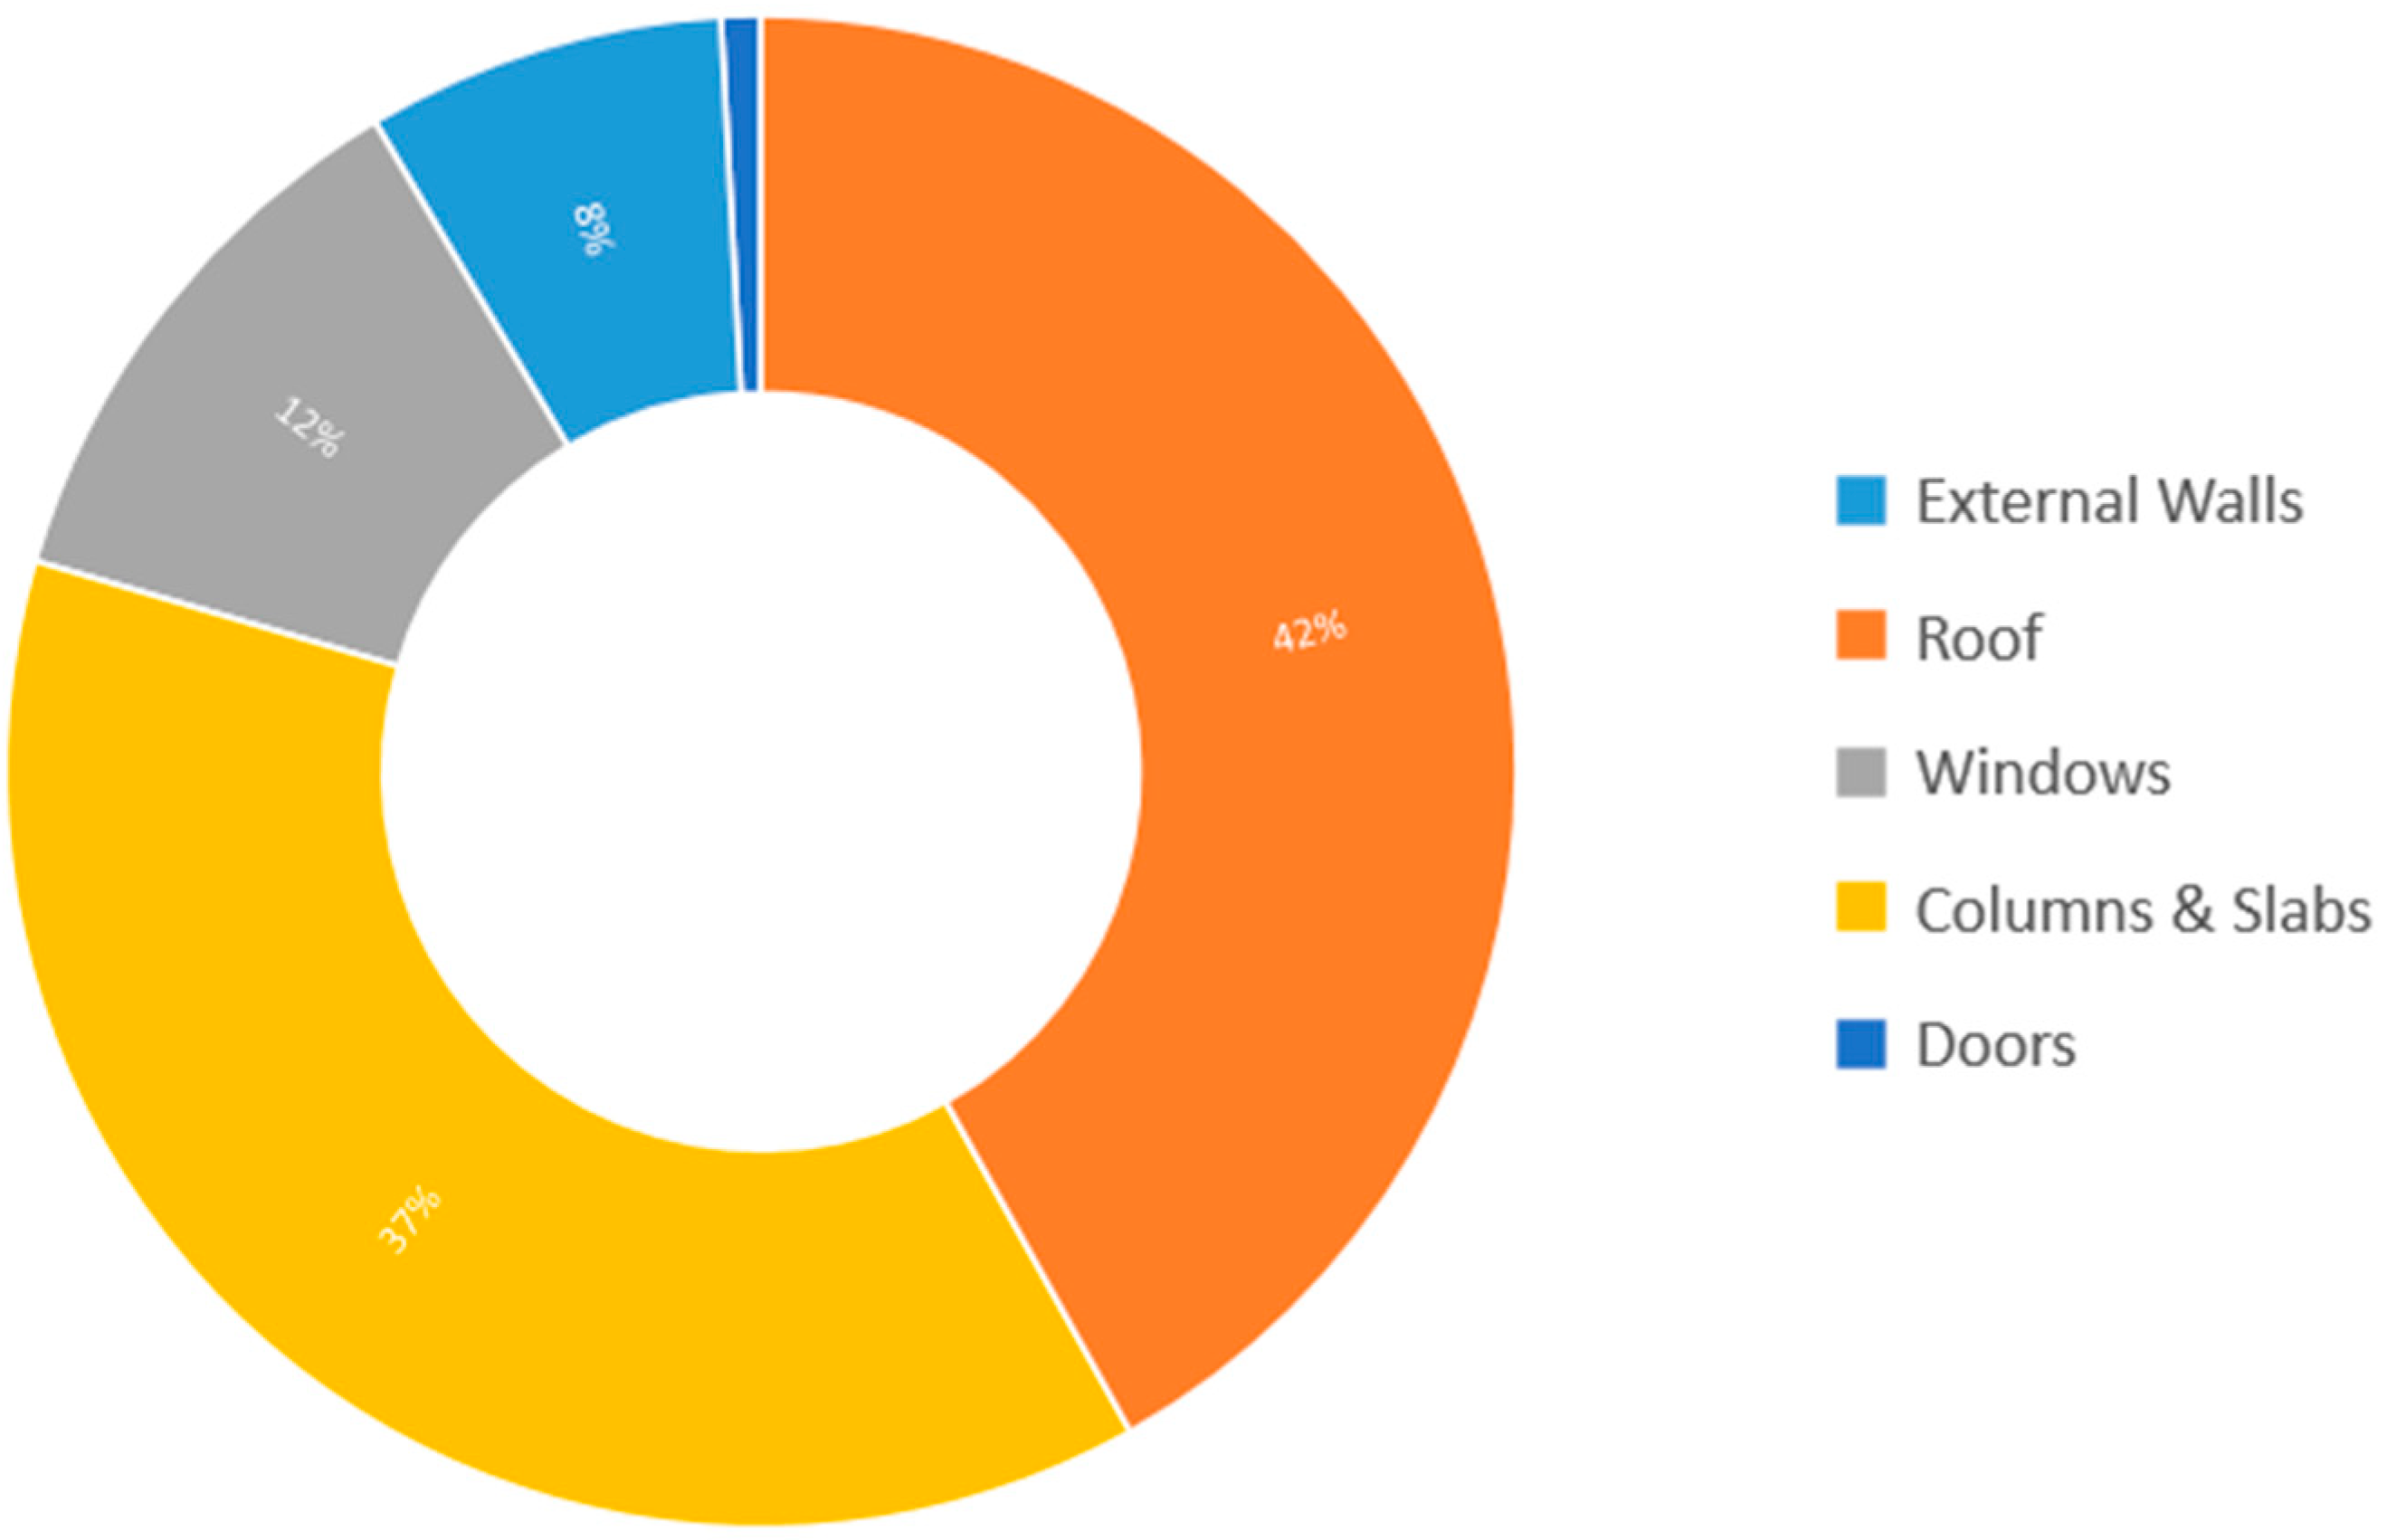
| # | Component | Area (m2) | Total Cooling Load without Insulation (W) | Total Cooling Load with Common Practice Insulation * (W) |
|---|---|---|---|---|
| 1 | External Walls | 366.9 | 18,190 | 2721 |
| 2 | Roof | 191.0 | 15,517 | 15,517 |
| 3 | Windows | 46.33 | 6184 | 4439 |
| 4 | Columns and Slabs | 85.87 | 8584 | 8584 |
| 5 | Doors | 9.9 | 148 | 148 |
| Total | 700 | 48,623 | 19,402 | |
| Step No. | Building Type | Scenario of Combinations | ||||
|---|---|---|---|---|---|---|
| Columns and Slabs | Doors | Roof | Walls | Windows | ||
| 1 | Plain building | CS1 | D1 | R1 | W1 | N1 |
| 2 | Common practice of building insulation | CS1 | D1 | R6 | W4 | N3 |
| 3 | Most expensive building insulation | CS2 | D3 | R7 | W10 | N4 |
| 4 | All possible scenarios | 1120 possibilities | ||||
Disclaimer/Publisher’s Note: The statements, opinions and data contained in all publications are solely those of the individual author(s) and contributor(s) and not of MDPI and/or the editor(s). MDPI and/or the editor(s) disclaim responsibility for any injury to people or property resulting from any ideas, methods, instructions or products referred to in the content. |
© 2023 by the authors. Licensee MDPI, Basel, Switzerland. This article is an open access article distributed under the terms and conditions of the Creative Commons Attribution (CC BY) license (https://creativecommons.org/licenses/by/4.0/).
Share and Cite
Al-Abduljabbar, A.; Al-Mogbel, M.; Danish, S.N.; El-Leathy, A. Insulation Performance of Building Components and Effect on the Cooling Load of Homes in Saudi Arabia. Sustainability 2023, 15, 5685. https://doi.org/10.3390/su15075685
Al-Abduljabbar A, Al-Mogbel M, Danish SN, El-Leathy A. Insulation Performance of Building Components and Effect on the Cooling Load of Homes in Saudi Arabia. Sustainability. 2023; 15(7):5685. https://doi.org/10.3390/su15075685
Chicago/Turabian StyleAl-Abduljabbar, Abdulhamid, Majid Al-Mogbel, Syed Noman Danish, and Abdelrahman El-Leathy. 2023. "Insulation Performance of Building Components and Effect on the Cooling Load of Homes in Saudi Arabia" Sustainability 15, no. 7: 5685. https://doi.org/10.3390/su15075685