Article

What Drives Profit Income in Mexico’s Main Banks? Evidence Using Machine Learning

by
Carlos González-Rossano
1,*,
Antonia Terán-Bustamante
1,*,
Marisol Velázquez-Salazar
1 and
Antonieta Martínez-Velasco
2
1
Facultad de Ciencias Económicas y Empresariales, Universidad Panamericana, Ciudad de México 03920, Mexico
2
Facultad de Ingeniería, Universidad Panamericana, Ciudad de México 03920, Mexico
*
Authors to whom correspondence should be addressed.
Sustainability 2023, 15(7), 5696; https://doi.org/10.3390/su15075696
Submission received: 8 February 2023 / Revised: 15 March 2023 / Accepted: 19 March 2023 / Published: 24 March 2023

Abstract

:
Historically, the banking system has been critical to the development of economies by addressing funds efficiently—from customer savings and investors to the productive activities of people and companies, financing consumer goods and current expenses, housing, infrastructure projects and providing liquidity to the market. However, it must be transformed to respond to emerging demands in society for better financial products and services with a positive impact on living conditions and well-being. To achieve this, banks must create economic value—that is to say, banks should create profits in a sustained manner—in order to also create social value and thus generate shared value. The purpose of this study was twofold. The first aim was to identify the main factors that contributed to the majority of Mexican banking profits in the period from 2003 to 2021; the second aim of the study was to provide an innovative metric of banking performance. Using supervised machine learning algorithms and Principal Component Analysis, two prediction models were tested, and two banking performance indices were defined. The findings show that Random Forest is a reliable profit prediction model with a lower mean absolute error between the predicted yearly profit and losses and the actual data. There are no significant ranking position differences between the two performance indices. The first performance index obtained is novel due to its simplicity, since it is built on the basis of five values associated with commercial banking activity. In Mexico, no similar studies have been published. The indicator most widely used by regulators worldwide is the CAMELS index, which is a weighted average of the capital adequacy level, asset quality, management capacity, profitability, liquidity, and sensitivity to market risk. Its scale of 1 to 5 is useful for identifying the robustness and solvency of a bank, but not necessarily its capacity to generate profits. This approach might encourage banks to remain aware of their potential to create shared value and to develop competitive strategies to increase benefits for stakeholders.

1. Introduction

Social, environmental, and economic problems have diverse origins, and, in recent years, companies have been associated with these problems, leading to distrust [1,2]. Porter and Kramer [1,2] proposed reconnecting business success with social progress through the principle of shared value, which involves creating economic value in a way that also creates value for society by addressing its needs or challenges and providing tangible social benefits.
The banking sector is no exception; most banking corporations are less focused on creating shared value and, in some cases, do not address the satisfaction of social needs. These social needs include greater financial security, better health, better housing, quality education, better nutrition, support for the disabled and elderly, help for disaster-prone communities, backing for agriculture and small and medium-sized enterprises (SMEs), financial assistance for women entrepreneurs, access to formal banking and environmental protection, among others [3].
The banking system plays a fundamental role in economic development, promoting the industry’s growth through financing investments in technology and infrastructure, as seen in the industrial revolution [4]. Festré and Nasica [5] confirmed a positive relationship between businesspeople and bankers when credit is used to finance innovation projects.
A solid and efficient banking system must fulfill its fundamental functions in a profitable manner, generating economic value and contributing to the development of its clients and the country by maintaining a loan portfolio with low delinquency rates, complying with local and international banking regulations, offering competitive conditions, and facilitating access to its services [6]. In addition, to ensure its long-term viability, it must have a propitious impact on society. However, to achieve this, it must first preserve the positive effects of the critical variables that produce benefits and keep them under control so as to remain profitable and, consequently, generate economic value [7]; second, it must generate positive effects throughout its environment, i.e., the community, and with all the actors with whom it has a relationship, generating social value and therefore shared value. Thus, shared value is conceived as the intersection between society and the company as a mutual partnership, with the goal of generating social benefit [8].
Several studies propose increasingly powerful ways to analyze the factors or determinants of bank income and profits, given the importance and dynamism of the banking sector in different countries. Methodologies generally become more precise by using quantitative methods that capture the prioritized elements for defining the outcome variable: income. However, only some studies include economic and social aspects in the analysis.
It has been observed that studies on banks and the determinants of their income are divided into those that incorporate the creation of social value under some social indicator that determines it, such as Jallo et al. [9], Casselli [10], and Cepni [11], and others that focus solely on the creation of economic value such as Ronquillo et al. [12] and Apolo [13].
The most common variables to analyze the impact of economic value on income are obtained from banks’ income statements and bank information such as delinquency rates, bank deposits, credit amounts, and interest rates, among others. At the same time, the approximation to social value is measured by Gross Domestic Product, unemployment rate, and income distribution.
Ronquillo et al. [12] identify the financial factors determining the profitability of banks operating in Mexico. To achieve this objective, they used multivariate statistics of factor analysis from the point of view of the offer using the variables of Financial Margin Adjusted for Credit Risks, Total Operating Income, and Administrative and Promotion Expenses. The results showed that the financial factors contributing to profitability are the financial margin adjusted for credit risks, administrative and promotional expenses, administrative expenses, and the result of the operation, which are measured from the indicators of the Statement of Income of Banking Operations. In their research, they do not consider any other component of a social nature.
Cepni et al. [11] discusses the role of interest rate uncertainty as a predictor of pre-provision bank revenues (PPNR) by comparing the forecasting performance of a baseline model that includes the unemployment rate, the federal funds rate, and an interest rate spread against an augmented model that also includes interest rate uncertainty as a predictor. The use of interest rate uncertainty in the context of stress testing of bank performance is motivated by the evidence that interest rate uncertainty is a crucial leading indicator that drives macroeconomic conditions. The article also suggests that the predictive power of interest rate uncertainty is concentrated on the non-interest component of bank revenues. Finally, this article examines the point predictions under a severely stressed scenario. It shows that the model can successfully predict the negative effect on overall bank revenues with a rise in the non-interest component of income during the first quarter of 2019. A social element is incorporated into the study by including the unemployment rate.
In their study, Jallo et al. [9] assume that credit allocation is the main activity carried out by banks and is an essential source of their income. Therefore, they analyze credit delinquency in the period 2009–2019 in a locality in Peru. They use the deductive-inductive and analytical method that involves the treatment of time series variables with a linear econometric model, by ordinary least squares, taking variable delinquency as the result and the Gross Domestic Product, disbursements, capital balance, and real interest rate as independent variables. The first three are significant. Since it is analyzed from the demand and the GDP, and the microeconomic variables of the consumers are used, the social component is likely included. However, there is no direct relationship between the results and the banks’ income.
Apolo [13] analyze the technical efficiency of Ecuador’s banks and their determinants during the period from 2015 to 2019. They use a nonparametric Data Envelopment Analysis (DEA) model with Variable Returns to Scale (VRS) to estimate the technical efficiency of Ecuadorian private banks, using operating and interest expenses as inputs, and deposits, loans, interest income, and non-interest income as outputs. In the second stage, the Tobit econometric model was applied to find the main determinants of technical efficiency. The model results showed that Return on Assets (ROA) and market share positively and significantly affect estimating technical efficiency. On the other hand, credit risk, bank size, and market concentration are negatively significant determinants of technical efficiency. These authors did not consider social value creation and only focused on economic value.
For his part, Chavarín [14], identifies the main determinants of the profitability of commercial banking established in Mexico using a database of 45 banks that represent practically the entire universe of commercial banking from 2007–2013, estimating dynamic models using Arellano–Bover/Blundell–Bond estimators with an error following an MA(1) process, as well as static models with random effects and Hausman–Taylor estimators. The results suggest that the profitability of commercial banks is supported by the level of capital, the collection of commissions and fees, and the control of operating expenses, as well as by specific barriers to market entry and impediments to competition that cause a relatively high persistence in profitability. It is observed that the research does not incorporate any social variable.
Casselli and Somekh [10] study access to banking and how it relates to banks’ rate of return on investments and income distribution. They developed their empirical framework through a theoretical supply-side model of bank deposit services with a consumer population heterogeneous in income. The model considers how the interest rate margin and the distribution of income of consumers can impact bank decisions, focusing specifically on the supply of deposits in the banking sector. They demonstrate how it might be optimal for the bank to exclude the lower-income portion of the population under certain circumstances. The model focuses on the interest rate margin and income distribution as fundamental determinants of access to retail banking. The methodology was a regression analysis using US household data for 2009, 2011, 2013, and 2015. They have found evidence in favor of the fact that decreases in the interest rate margin and increases in income disparities lead to increases in the proportion of unbanked and higher financial exclusion. Although they do not refer to the income of banks or households, they include a social component: income distribution.
Salmony [7] emphasizes that in recent years, banks have been directed by third parties or by factors beyond their control, such as regulation, customers, or new competitors.
The variables studied by the different authors include the impact of board and senior management decisions, the technical and operational capacity of its staff, client preference, and the ability of management to address credit risks and market and liquidity risks, among others. However, there is a gap in the research related to how net profits or losses are related to the performance variables associated with banking business activity to determine the behavior of the leading Mexican banks and their evolution in the creation of economic value.
According to the theory of classical banking intermediation [15], the main commercial activities of banks are the promotion of current, savings, and investment accounts to raise resources from their clients and the relevant assessment of credit risk to provide it to the applicants of short- and long-term financing funds.
The sustainability of a bank is a function of its ability to produce profits consistently and to achieve the preference of its customers; if the economic value is absent, there is no way to simultaneously influence the generation of social value [16]. According to Porter and Kramer [2], shared value (SV) arises when economic value and social value co-occur, and SV is the evolution of social responsibility actions taken by various organizations in the global financial sector.
Jones and Wright [17] empirically proved the close statistical relationship between the creation of SV and several financial indicators of thirty companies listed on the Australian stock exchange in the period of 2008–2012, identifying a causal relationship: companies with higher financial performance have higher adoption of SV initiatives.
Therefore, two research questions guide this work: the first is “what are the critical factors to get profits in the leading banks in Mexico causing economic value?” The second is “can we create a Banking Performance Index based on those critical factors that allow us to go over the leading banking institutions’ evolution in Mexico and rank them to perceive their potential to create SV?”
To answer these questions, several performance variables, including profits and losses of the leading Mexican banks, are analyzed to understand their behavior and bearing on results over time. This research aims to establish a Banking Performance Index as a public management parameter that can boost competition among participants, with significant benefits for customers and society.
The applied method to achieve the objective is machine learning because it allows for efficient processing that can lead new insights and discoveries that would be difficult to achieve through traditional statistical methods. The algorithms are designed to make predictions based on patterns in data, which is often a critical part of empirical research like that presented in this paper. These predictions help to understand the relationships between different variables and make informed decisions about future research. The common language that is developed through the method gives power of prediction and generalization and allows the replication of the study for other cases. Likewise, the self-learning ability could continually refine their predictions and improve the accuracy of their results. However, as with any empirical research method, it is essential to be careful in how results are interpreted and ensure that the analysis is both valid and reliable, as has been the practice in this work.
The present work has six sections. Firstly, the article introduces the subject, and the purpose of the research is outlined. Next, the theoretical framework is reviewed; the main concepts and importance of shared value, its measurement, and banking performance indicators are addressed. The third section describes methodology. The fourth section presents the results and findings. Finally, in the fifth and sixth sections, the discussion and conclusions are presented.

2. Theoretical Framework

2.1. Creation of Shared Value: Importance, Conceptualization, and Measurement

Since 2006, Porter and Kramer [1] have argued that the company’s strategy must go beyond best practice; it must choose a unique position and differentiate itself from the competition. With this approach, they begin to elucidate the concept of shared value.
For Porter and Kramer [2], the creation of Shared Value (SV) refers to the simultaneous creation of economic value for the shareholders of the company, but also social value; this can only be achieved by addressing social needs and challenges at the core of the company’s strategy formulation processes [2].
The SV is a unique corporate strategy that recognizes the interdependence between the company and society to function in a theoretical and practical win–win relationship [18]. SV is also “a way to mitigate externalities that cause socioeconomic and ecological problems including poverty, fraud due to lack of ethics, and lack of health and safety” [19].
Therefore, companies create shared value when they employ policies and practices that generate economic benefits for the business while generating social benefits in the regions where the company operates.
For Dembek, Singh, and Bhakoo [20], the concept of shared value is essential to determine, to a large extent, the costs of shared value (each policy, operational practice, choice, and commercial initiative engender different costs).
However, while SV activities may overlap with corporate social responsibility (CSR) and become indistinguishable from each other, companies argue that it is possible to see long-term economic and social objectives as integrally connected and thus to move from CSR to corporate social opportunity through CSR. The creation of SV [21] led to measures that have a better social impact.
To achieve SV, Porter and Kramer [2] proposed the following process: identify the objective social benefit, define the associated business plan, model in advance the economic and social benefit by considering the projected associated costs, record progress, measure results, and assess whether greater value can be achieved as a result of the process.
Porter and Kramer [2] identified three approaches to the creation of SV; Bockstate and Stamp [22] later adapted them to the financial sector as follows:
  • Redesign products and markets to provide appropriate services and meet unmet needs. For example, to promote customer prosperity in the financial sector, initiatives such as supporting existing customers’ financial health, expanding banking services to the unbanked population, and financing small and medium-sized enterprises are useful.
  • Redefine productivity in the value chain to mitigate risks and increase productivity.
  • Enable on-premises cluster development by improving the external framework that supports enterprise operations. For example, banks can act by boosting the growth of regional economies and by providing venture capital or financing investor resources to cluster members and their value chain partners, thereby increasing social value. In addition, banks can boost less developed regions by financing the development of public facilities, such as transport infrastructure. This would help to increase the productivity of all cluster members and benefit the community. A more prosperous community, in return, creates more business opportunities for banks, i.e., increases economic value [23].
In their work, Pfitzer, Bockstette and Stamp [24] suggest five fundamental elements that reinforce each other for value creation.
  • The social purpose: Identify the requirements that need to be addressed with the social goal.
  • A defined need: Understanding the particular needs of a region—the environment–helps define areas that demand to be improved and the extent of these improvements, and the value of that change to the business.
  • Measurement: Establish immediate measures and track progress to validate the early links.
  • The appropriate innovation structure: The degree to which the shared value potential can be anticipated and aligned with the company’s financial criteria determines the optimal innovation structure for the social enterprise, as well as the requirements to deliver business and social value.
  • Co-creation forms the basis for relationships of trust [24].
In addition, different approaches have been proposed for SV measurement, with factors ranging from externalities to ethics being considered. Among these approaches, those of Spitzeck and Chapman [25] and Spitzeck [26] stand out, as they present a series of indicators for measurement. Maltz and Ringold [27] developed a nine-step approach based on the firm’s vision of resource- and externality-based society to compare multiple shared-value initiatives in terms of their costs and benefits. Mohammed [28] suggests a method of measuring shared value based on the principle of corporate responsibility for externalities. Pfitzer et al. [24] offered a three-step assessment as follows: (1) estimate the social and business value that links change in social status to profits; (2) establish intermediate measures and track progress to validate (or invalidate) the early link; (3) assess the shared value produced by measuring the final social and business benefits. Spitzeck [26] advised a series of organizational and social indicators and Yang and Yan [29] focused on the creation of SV ecosystem attached to the integration of social and economic activities including markets, social network, and corporate entrepreneurship.
Given the above, Bockstette and Stamp [22] suggest three ways to create shared value in the banking sector: I. promote customer prosperity; II. boost the growth of regional economies; and III. finance solutions to global challenges.

2.2. Bank Performance Indicators

Several authors have studied the variables that affect the results of banks. For instance, Johan and Sari [30] analyzed the influence of the characteristics of the Chief Executive Officer (CEO) on the performance of 28 banks listed on the Indonesian stock exchange. This is because the CEO is responsible for implementing the mission and defining the strategies to achieve the specified vision and goals. When reviewing the variables, i.e., age, education, seniority in the position, experience, history as a second-level or deputy general manager, training in the bank itself or externally, and their relationship with net results, the authors concluded that CEOs have a significant positive impact on the profitability of banks, especially in terms of return on capital.
In a larger study, Simpson et al. [31] used a sample of 385 national banks operating in the United States to study the relationship between banks’ financial performance (FP) and their corporate social performance (CSP).
As for the FP in the first scenario, they set it as a dependent variable on the asset profitability indicator (ROA). In the second scenario, they defined the quotient obtained as a dependent variable by dividing the loss for unpaid loans by the total loan portfolio. The ROA indicator is relevant because it “measures the bank’s ability to acquire deposits at a reasonable cost, invest these funds in profitable loans and investments, and profitably conduct the bank’s day-to-day operations”, p. 104, [31].
To assess the CSP, they used the rating and social performance indicator of the Community Reinvestment Act (CRA) established in 1997, which aims to ensure banks serve their communities through loans and banking services starting from the places where they operate, as an independent variable.
The results of their research in the two scenarios show a highly positive relationship between the CSP and the FP in the banking sector, concluding that when the financial results are positive, the corporate social results will also be favorable. However, the study did not establish a causal relationship between the variables.
Coincidentally, in a recent investigation, Brotons and Sansalvador [32] concluded that Spanish companies that have the IQNetSR10 (analogous to CSP) CSR certification achieve increased value regardless of the size of the companies or in which economic sector they operate.
At the Latin American level, Jiménez-Hernández et al. [33] conducted research on the determinants of banking efficiency. They concluded that the factors that explain the differences observed in 409 banks from seventeen countries in the region were as follows: the size of the bank, the ratio of loans between total assets, and the indicator of past-due loans to the total portfolio.
Some other authors studying the behavior of Mexican banks focused on identifying the determinants of profitability, and most of them agreed that the relevant factors in the period 1995–2009 were the level of capitalization, market share, level of efficiency, and size of the institution [34,35,36,37,38].
In the report of the Bank for International Settlements (BIS, 2018) cited in Pampurini and Quaranta [39], conducted after the financial crisis of 2018, it is mentioned that large international banks tend to concentrate on the traditional banking business of credits and funding resources through their client base, and reduce global treasury operations and interbank funding.
According to Gaul et al. [40], the CAMELS evaluation system is used internationally by different regulatory bodies, including U.S. financial authorities, to measure the financial status, risk profile, and overall performance of a bank. CAMELS is an acronym for the following six risks assessed in the rating: capital adequacy, quality of assets, management, earnings, liquidity, and sensitivity to market risk. Ratings range from 1, the lowest risk rating, to 5, the highest risk rating. Most banks have ratings of 1 or 2 and are considered to be in satisfactory condition. Banks with a rating of 3, 4, or 5 are generally considered unsatisfactory and must take steps to improve their situation.
However, even if the determinants of profitability in Mexican banks are modified, the ROA and ROE indicators will continue to capture the impact of the variables that comprise the founding factors. Therefore, their use continues to be relevant in evaluating the performance of banks.
Since banking products and services affect the economic, social, and environmental setting of the localities, countries, or regions in which they operate, financial institutions worldwide have proposed different initiatives to bring banking activities towards sustainability criteria; that is to say, these initiatives are viable in social, environmental, and economic contexts.
This is why the Dow Jones Sustainability World Index (DJSI) exists; it is a weighted index of market capitalization adjusted for variables that measure the performance of companies selected according to Environmental, Social, and Governance (ESG) criteria by comparing participants with best-performing firms in their class in the ESG field or the Principles for Responsible Banking structured in 2019 by a core group of 30 leading banks, the “Founding Banks,” through the United Nations Environment Program Finance Initiative (UNEP FI), according to which a responsible bank seeks to contribute sustainably to the well-being of its customers, the community and society. BBVA, Banorte, Citibanamex, and Santander signed these principles in 2019, and they outline the progress they have made in complying with these principles in their annual reports.

3. Materials and Methods

The present research is quantitative. The orange machine learning platform was used as a tool for analysis [41], as well as RStudio (2020, RStudio, PBC, Boston, MA, USA).
A dataset was obtained from the National Banking and Stock Exchange Commission (CNBV) for 2003–2021. A sample of seven of fifty Mexican banks was selected since this subset accounts for 85% of the market share in total loans and volume of savings and deposits. The banks in the sample are Banco Bilbao Vizcaya (BBVA), Banorte, Banamex, Santander, HSBC, Scotiabank, and Inbursa.
The quantitative or numerical variables selected from the dataset are:
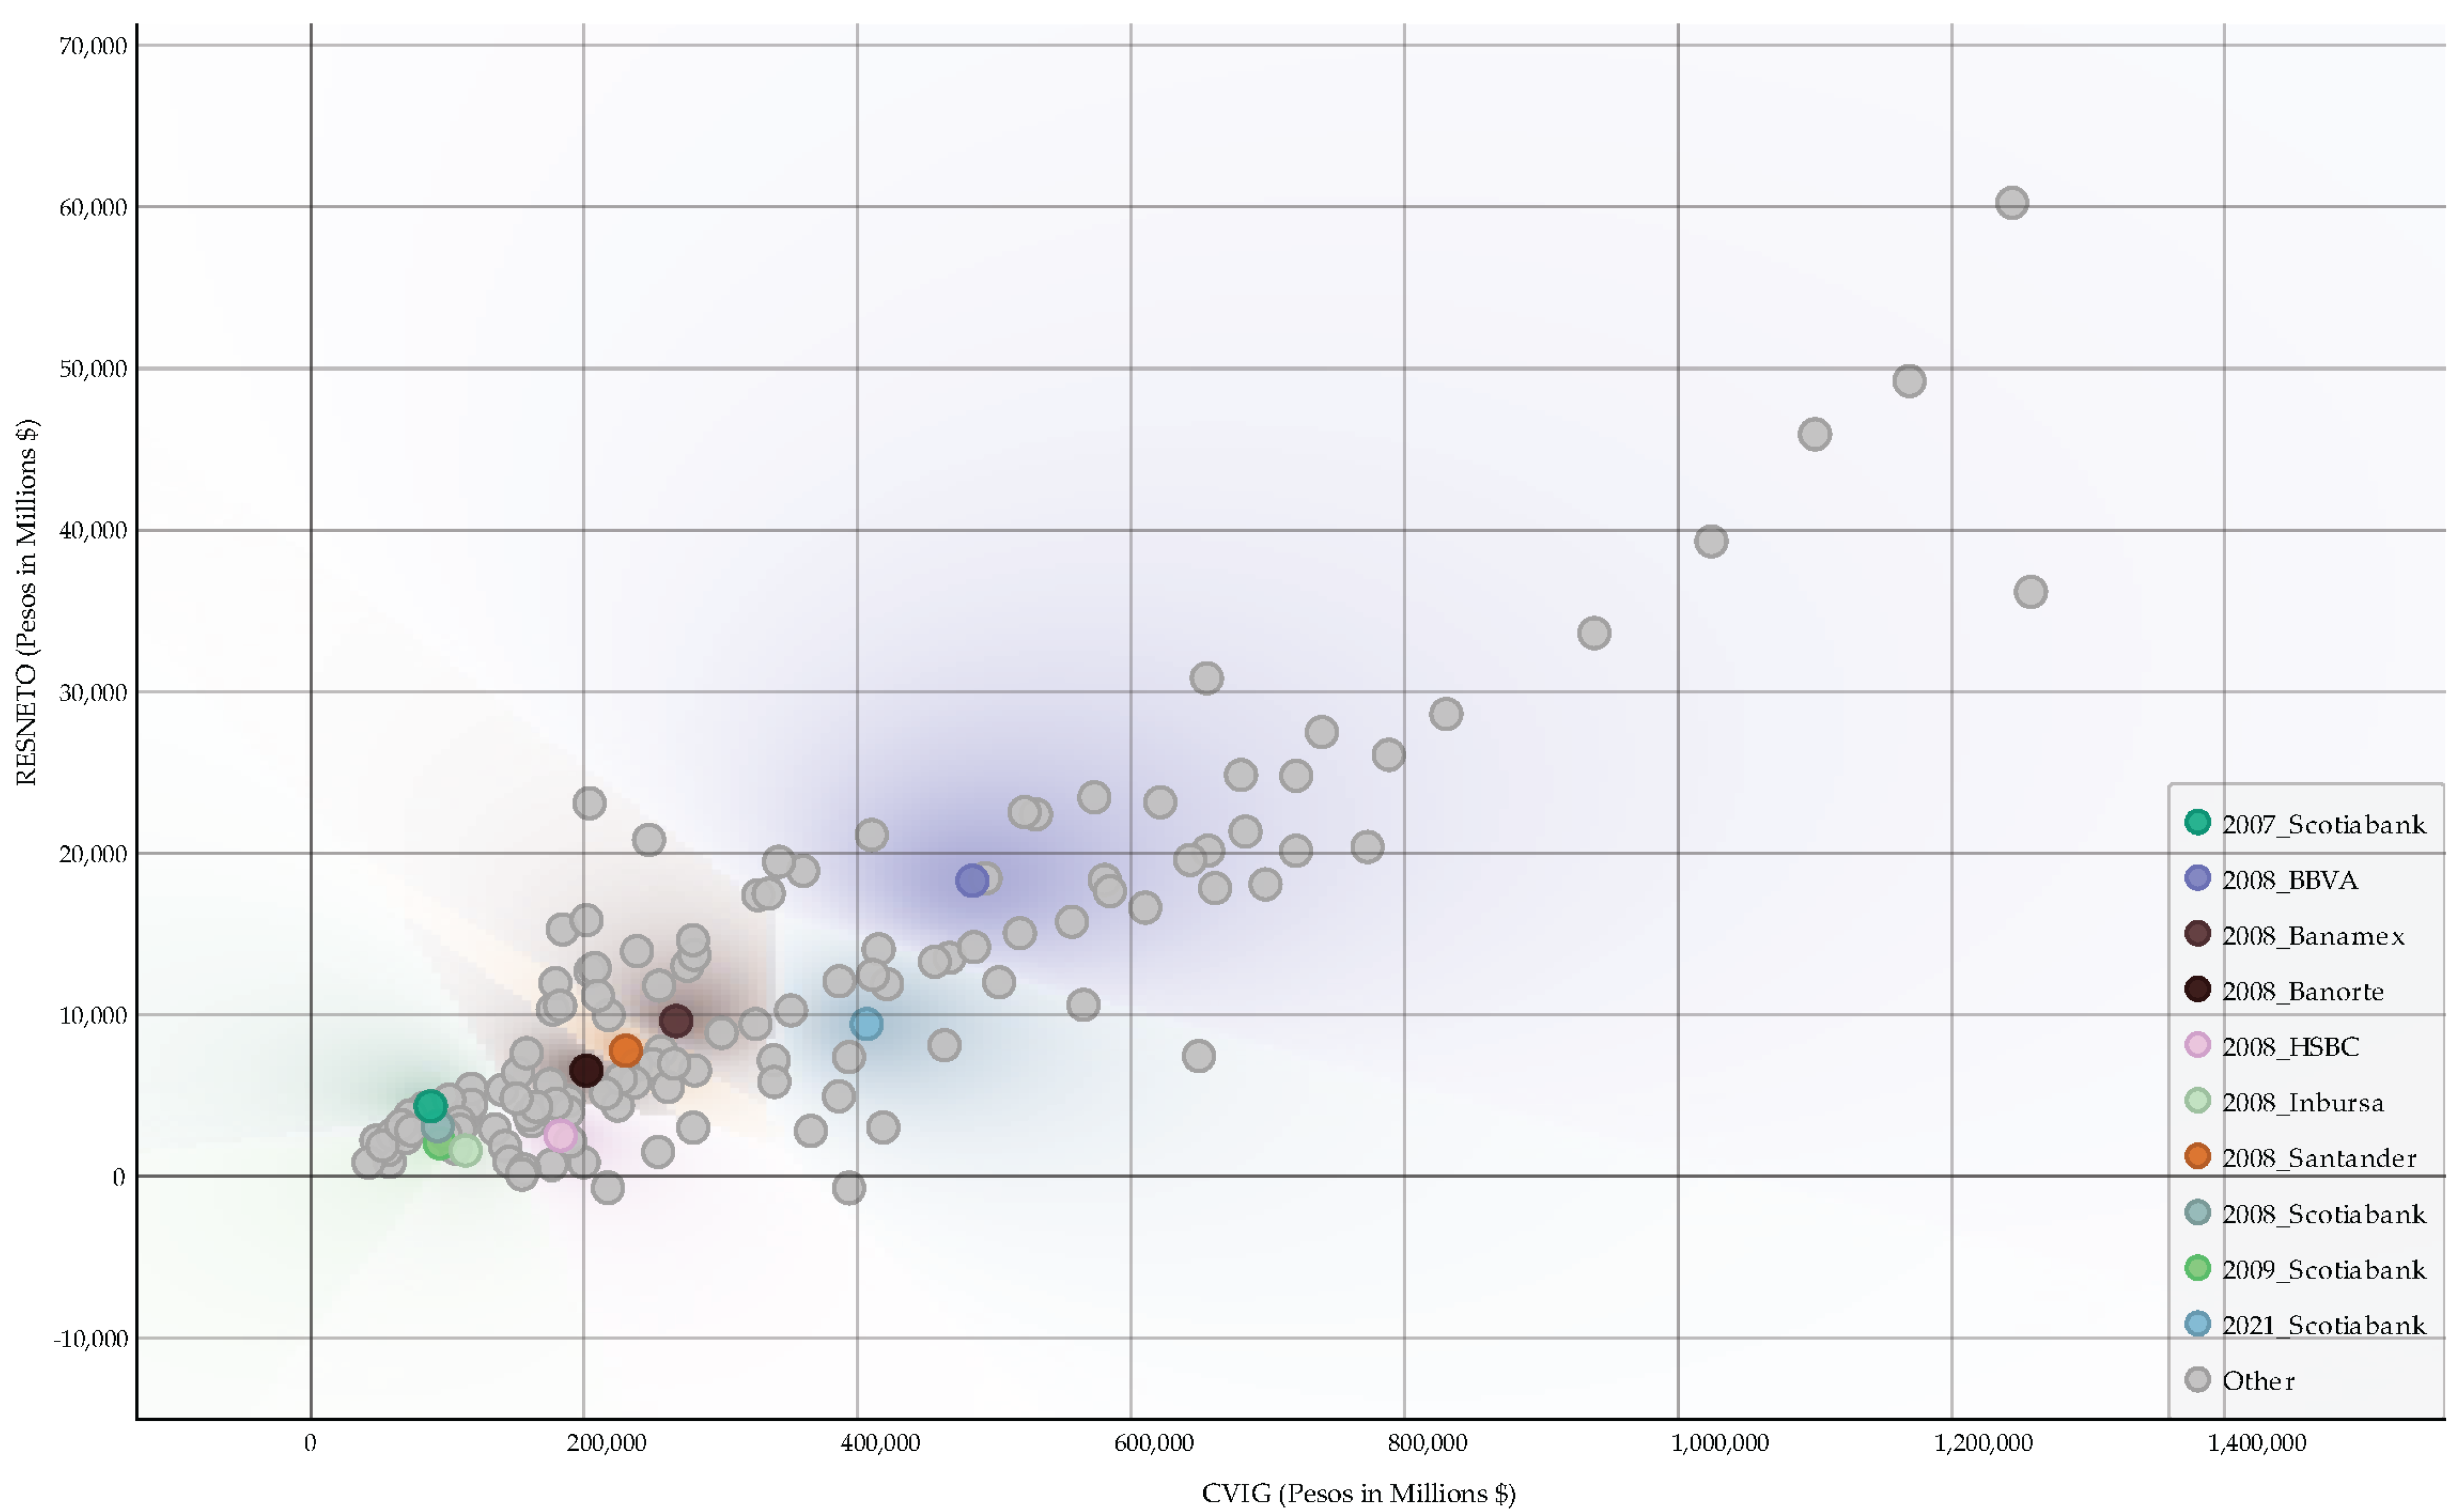
  • Total average volume of the current loan portfolio in millions of Mexican pesos (hereinafter Mx) (CVIG).
  • Total average volume of the portfolio of past due loans in millions of Mx (CVENC).
  • Total volume of write-offs accepted during the year in millions of Mx from uncollectable loans (QYC).
  • Total average annual volume of deposits in millions of Mx (DEPDISP).
  • Average annual volume of total savings and investments with a fixed maturity in millions of Mx (DEPPZO).
  • Average annual volume of demand deposits, savings, and investments with a fixed maturity in millions of Mx (CAPTRAD).
  • Average annual ratio of return on assets (ROA). For each month of the year, the month’s net profit or loss is divided by the last 12-month average of total assets.
  • Average annual return on equity ratio (ROE). For each month of the year, the month’s net profit or loss is divided by the average of the last 12 months of total capital.
  • Average delinquency ratio of loan portfolio during the year (IMOR). For each month of the year, the volume of past due loans in millions of Mx at the end of the month is divided by the average of the last 12 months of the total loan portfolio.
  • Average delinquency ratio of credit portfolio adjusted for write-offs accepted during the year (IMORA). For each month of the year, the volume of past-due loans in millions of Mx plus the volume of write-offs in millions of Mx related to irrecoverable loans at the end of the month is divided by the average total portfolio of the last 12 months.
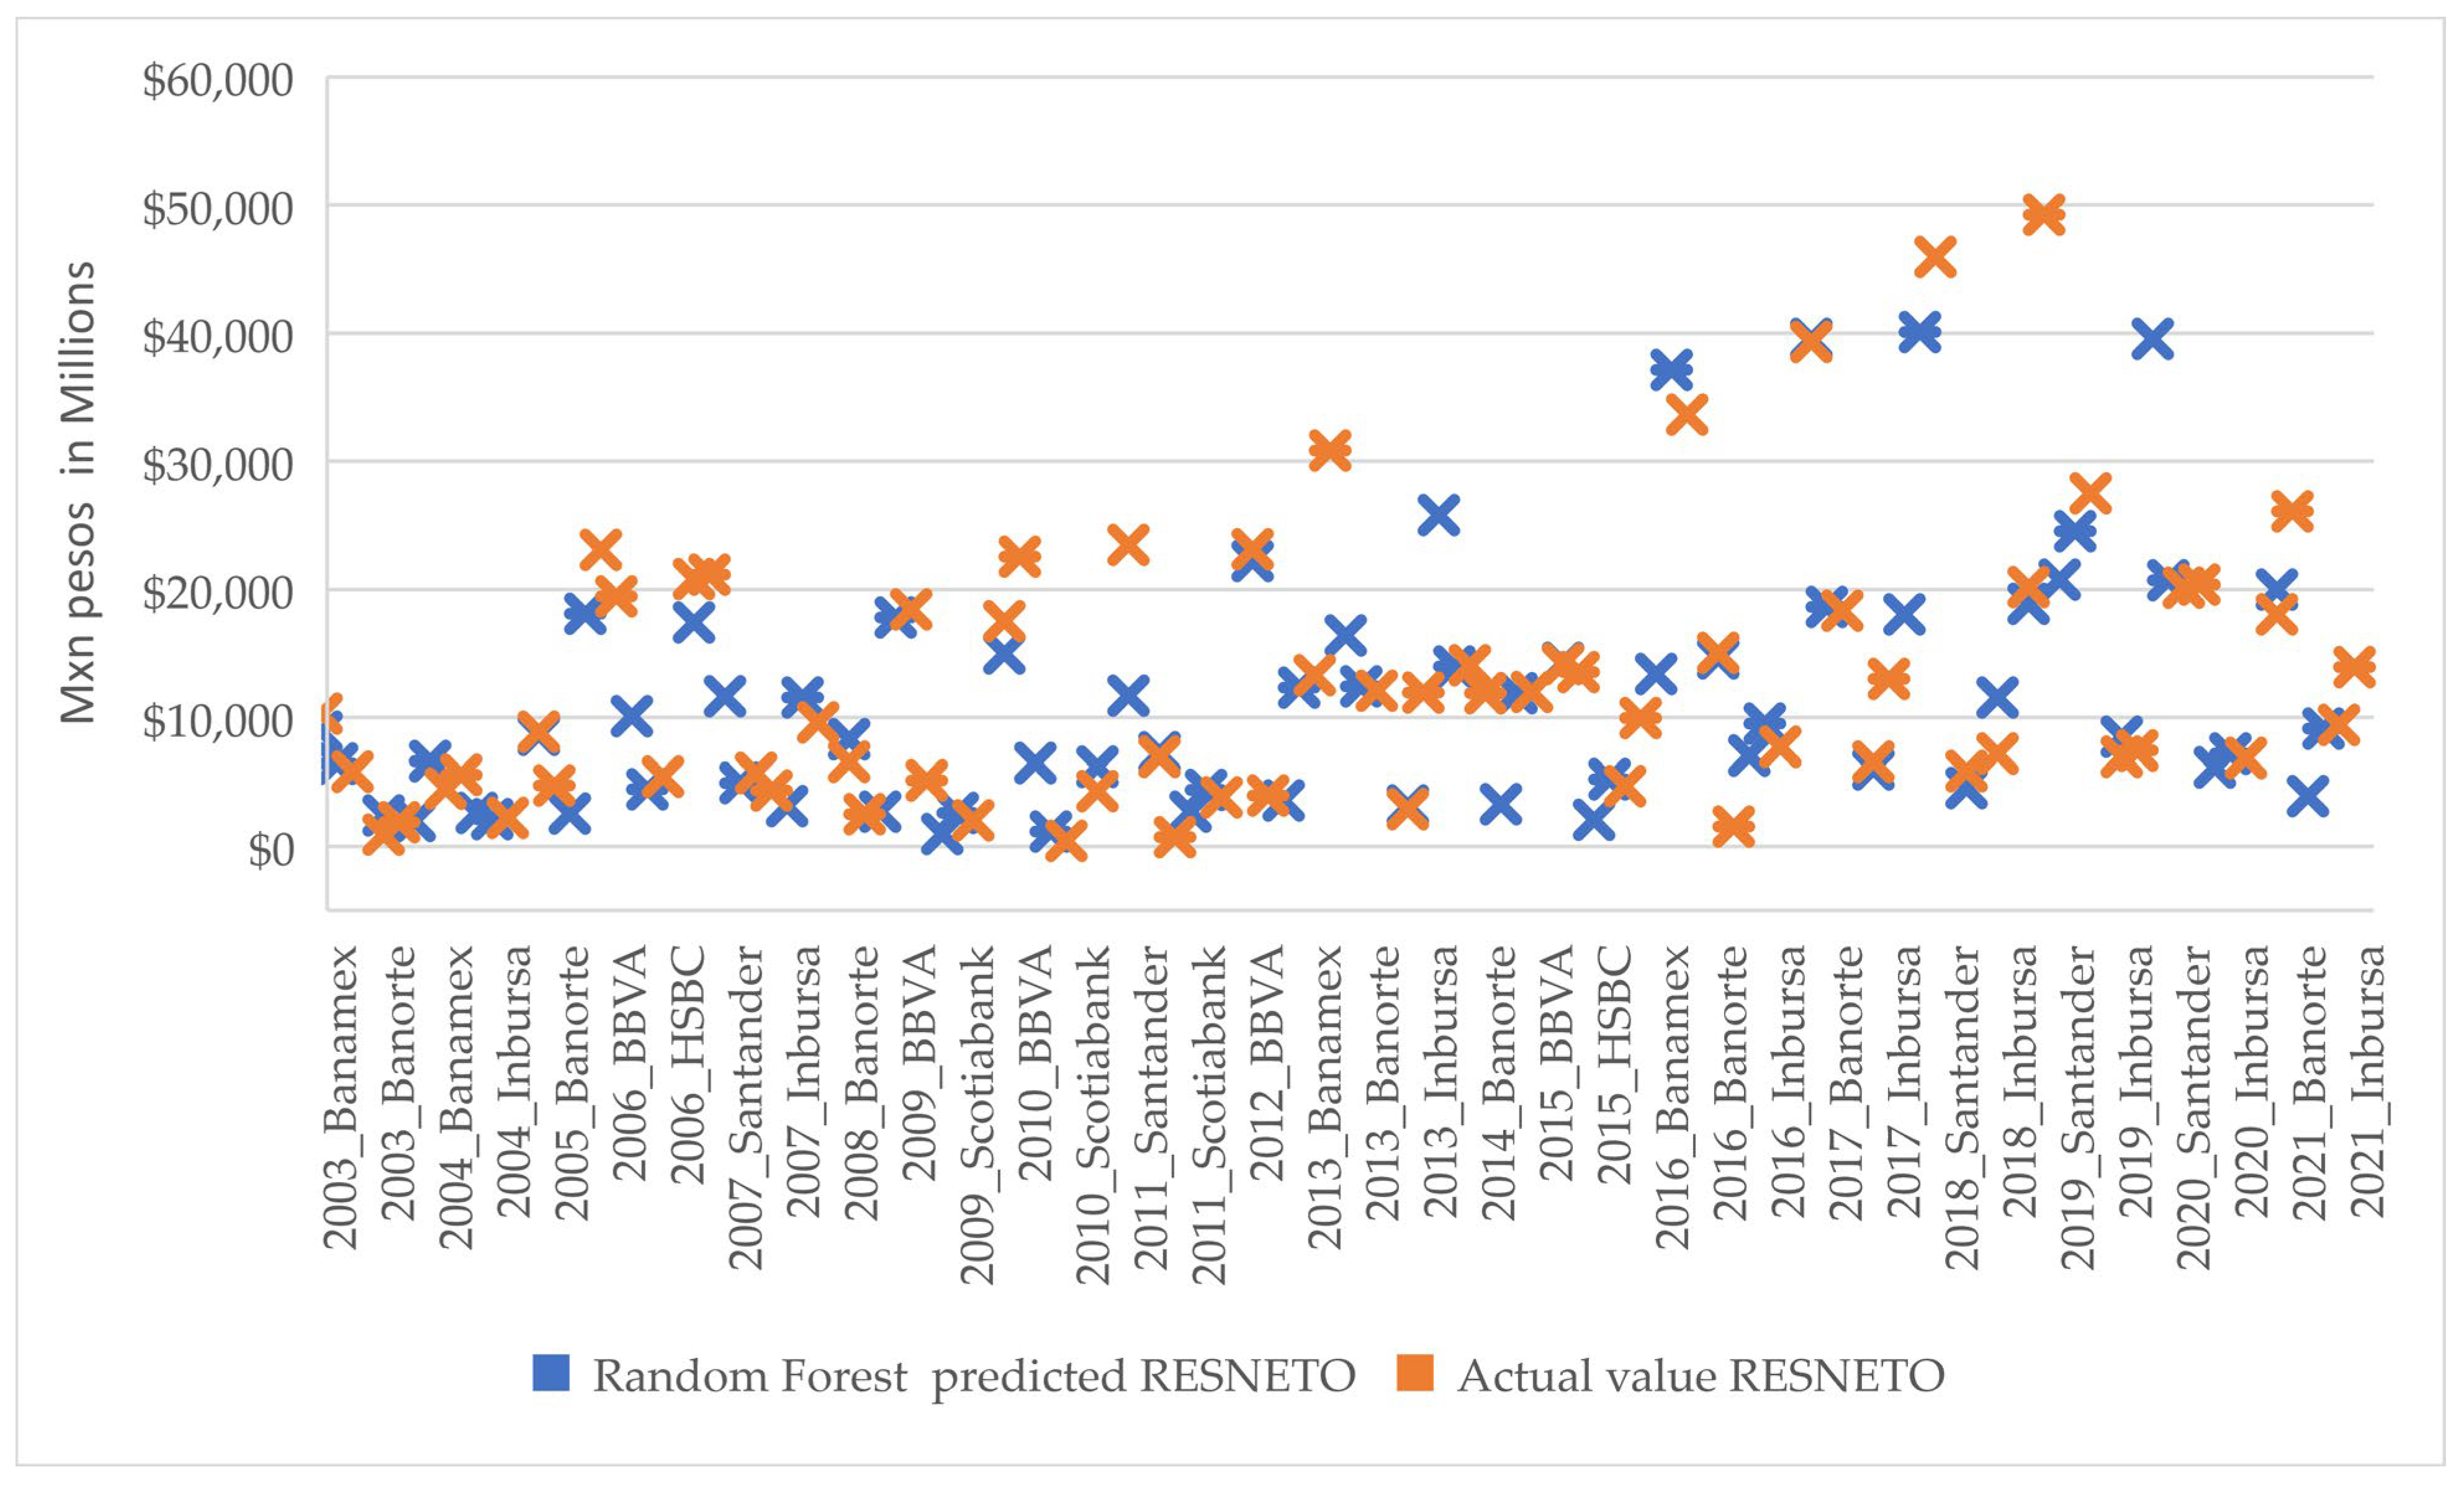
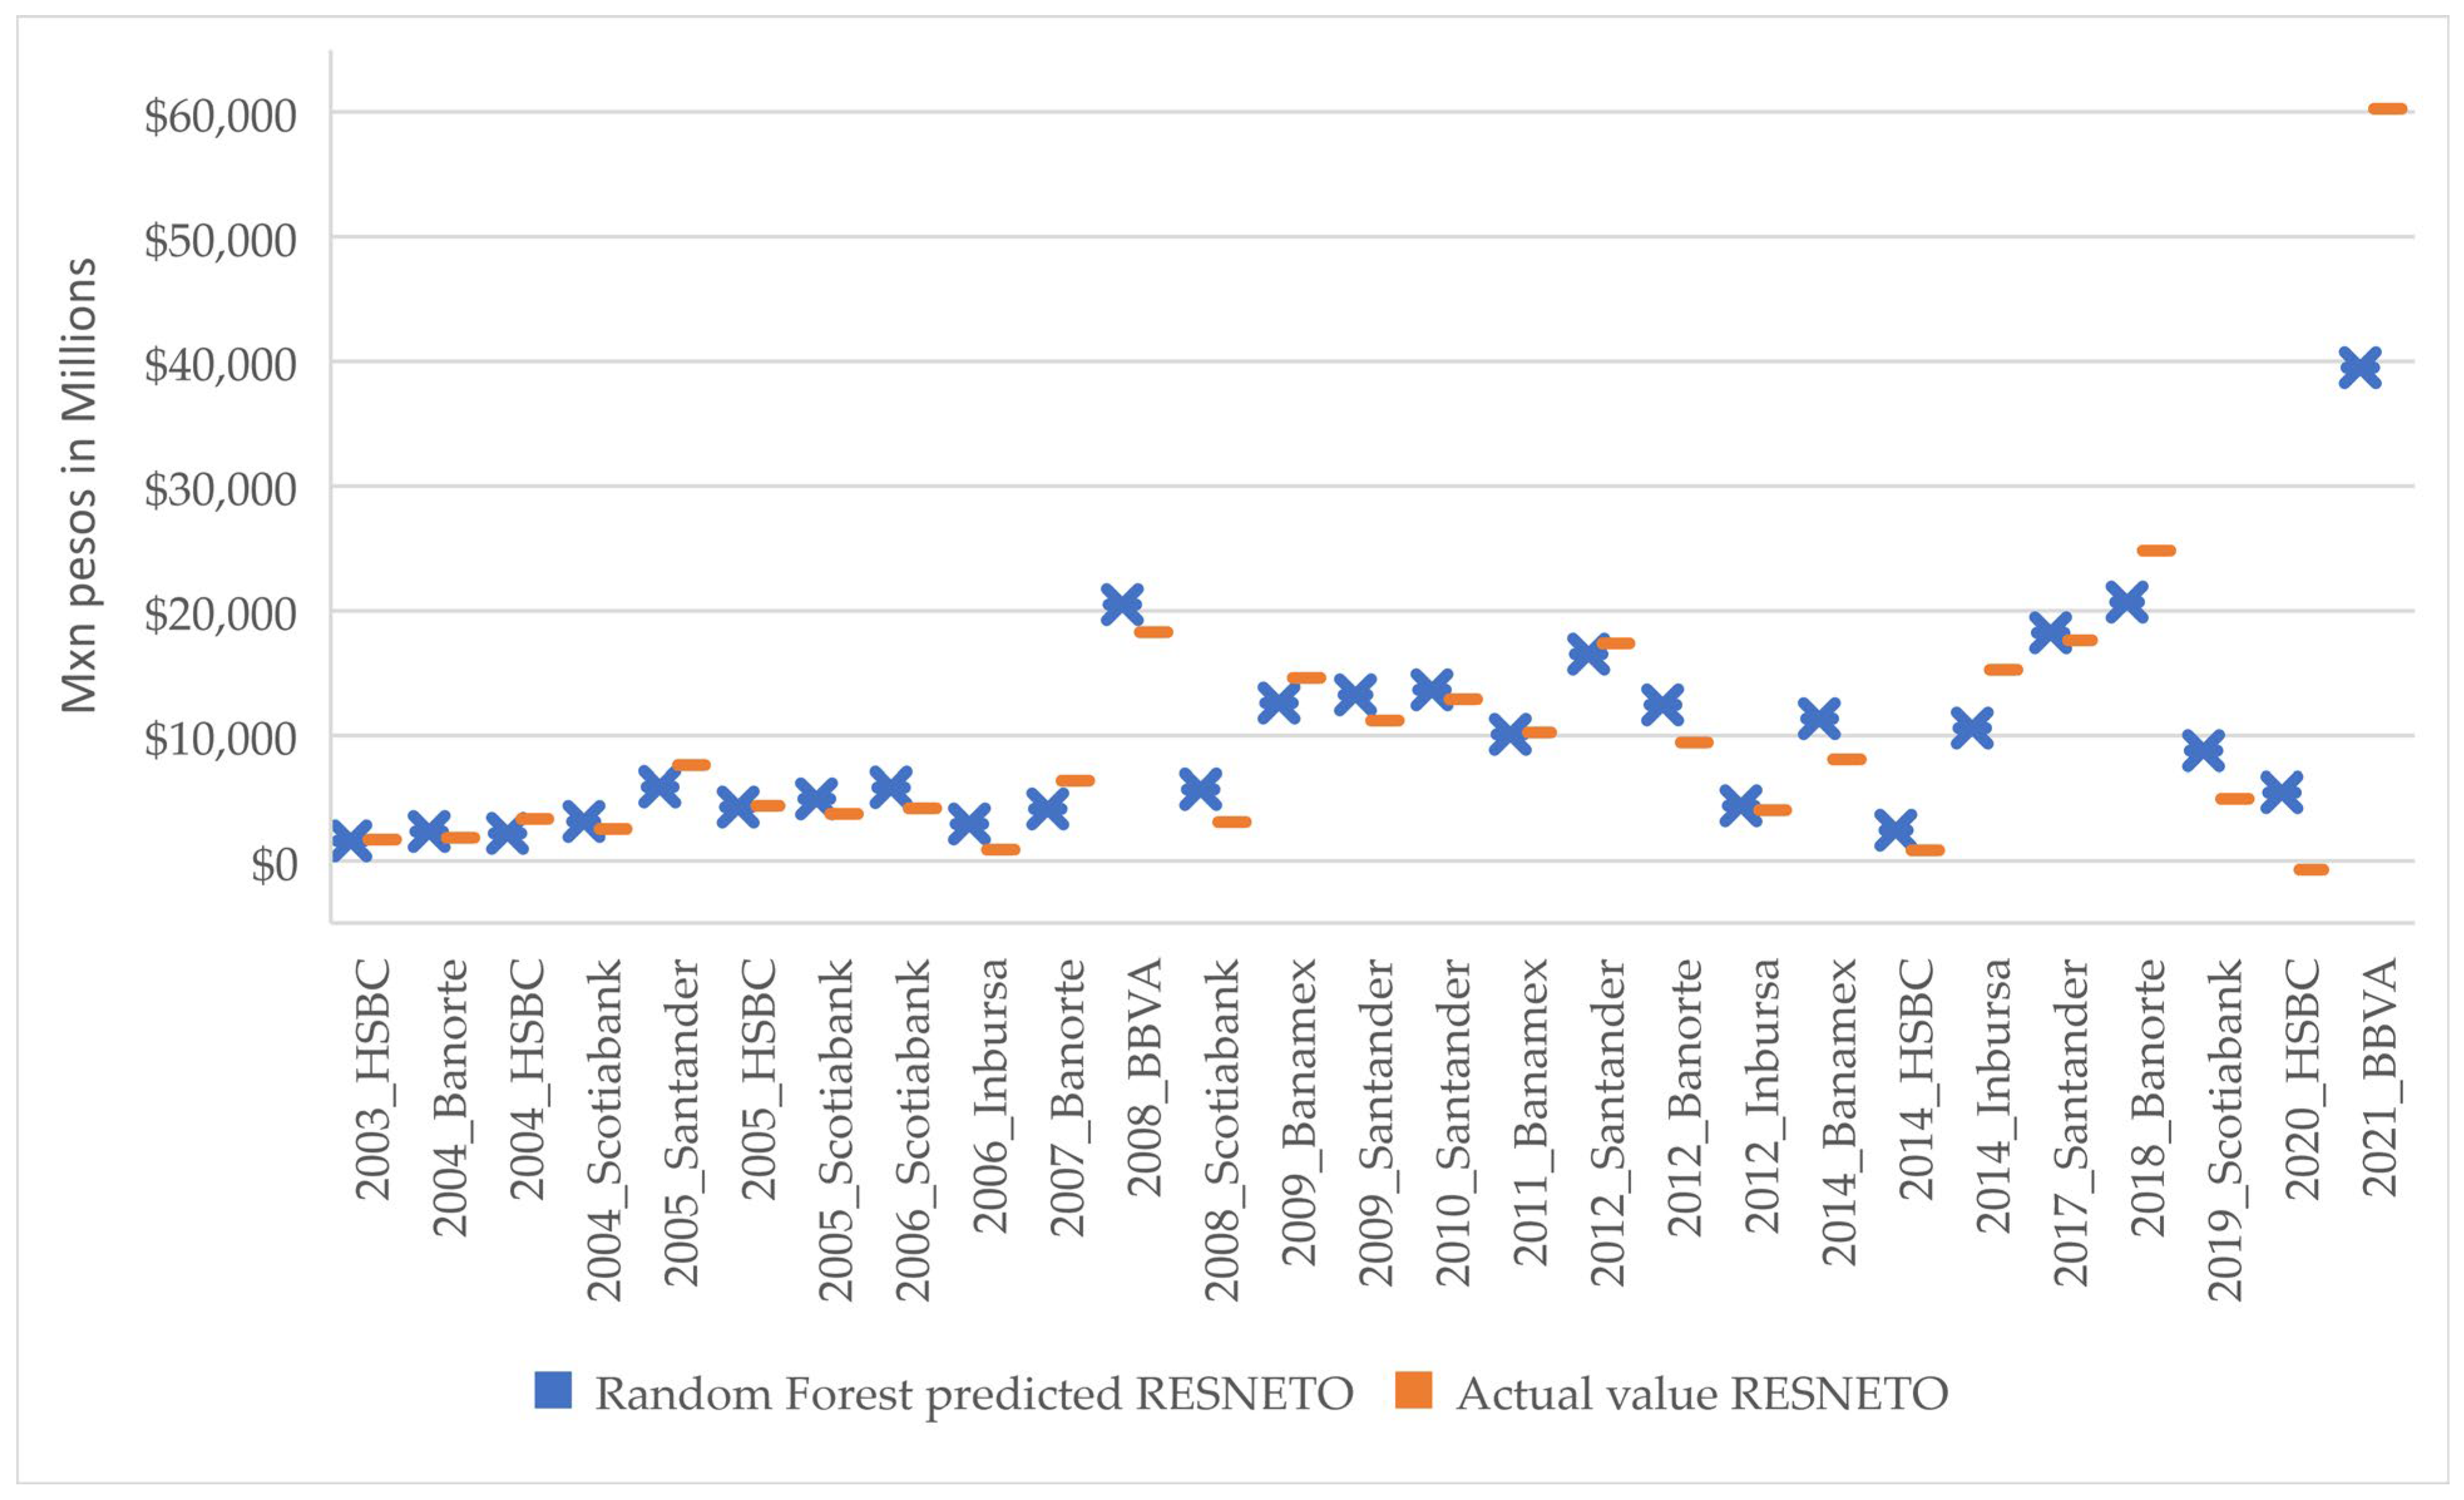
  • Net profit or accumulated loss at the end of the year (RESNETO).
  • The variables Year and Bank were defined as categorical so as to perform an analysis with panel data. (Year-Bank).
The data matrix was formed using 133 rows × 13 columns, including the bank and year identifier columns.

3.1. Procedure for Applying Machine Learning Tools

RESNETO was defined as the target or dependent variable, and CAPTRAD was removed because it is the result of adding DEPDISP plus DEPPZO. As an exploratory analysis, the associations between the target variable and the other variables were reviewed using Spearman’s correlation as well as the cross-correlation between all variables.
To analyze the behavior of the data set, two models were used and each one estimates the RESNETO.

3.1.1. Model I

Extreme values were avoided, and we transformed the following numerical data using the natural logarithm function: CVIG, CVENC, DEPDISP, DEPPZO, QYC. Using the rank command and Orange’s RreliefF feature selection method, which is considered one of the best methods based on the similarity/dissimilarity of the independent variables in a given instance, only the following five features were retained: log(CVIG), log(DEPDISP), log(DEPPZO), log(CVENC) and IMORA.
Subsequently, a regression analysis of the linear-logarithmic type was defined as follows:
y i = β 0 + β 1 log ( x 1 i ) + β 2 log ( x 2 i ) + β 3 log ( x 3 i ) + β 4 log ( x 4 i ) + β 5 I M O R A i + ε i
Here, a one percentage increase in x i   and one unit increase in I M O R A i leads yi to increase by ( β i /100) units plus α i units, with i = observations (year-bank). The values of x are the variables = CVIG, CVENC, DEPDISP, DEPZO, QYC.
Normal distribution of errors was assumed. The metric error employed was MAE (mean absolute error = to the sum of absolute errors divided by the sample size), used to measure how close our predictions are to outcomes.
Using these five features, we ran three appropriate machine learning algorithms; Linear Regression (LR), Decision Tree (DT) and Random Forest (RF) were run since the target variable is numerical and continuous (Supplementary Materials Appendix SA)
We used the k-folds cross-validation technique to evaluate the performance of the machine learning models on unseen data, dividing the previous years’ data into five equal-sized folds; the model was trained on four folds using RESNETO as the target variable (training data set), and was tested on the remaining fold (test data set), and this process was repeated five times. This solves the limitation of the method that reduces the amount of data available for training the model, which can lead to suboptimal performance. The results of each fold were then averaged to get an estimate of the model’s performance.
Cross-validation is a valuable technique that provides a more reliable estimate of a model’s performance than a single test set and helps to prevent overfitting.
The results obtained with each algorithm were evaluated on the training and test data sets, respectively, and compared; the one that reported the lowest Mean Absolute Error (MAE) was selected because it provides a quantitative evaluation of the accuracy of the model’s prediction. To determine whether the magnitude of MAE was appropriate, the range of the target variable RESNETO was considered. The minimum value was −707.9, the maximum was 60,256.4, and the mean was 11,410. The goal was to find the model that minimizes the average absolute difference between the predicted and actual values of the target variable.

3.1.2. Model II

Principal Component Analysis (Supplementary Materials Appendix SB) summarizes the information of various numerical or quantitative variables, n, in a new set of k components, with k  n, preserving as much information as possible of the original variables. Each component is defined as a linear combination of the original variables and is less interpretable; thus, they do not necessarily have real meaning.
Y r k = a r 1 k X r 1 + a r 2 k X r 2 + a r k X k r
where r = 1, …, m for m number of observations and k dimension retained.
The principal components were chosen in order of significance according to the highest percentage of variance that they explain. In this study, we maintained three main components and normalized the original data with μ = 0 and σ 2 = 1.
With these three components as predictors and RESNETO as the target variable, the LR, DT, and RF algorithms were also run, using k-folds cross-validation, and MAE to evaluate the accuracy of Model II.

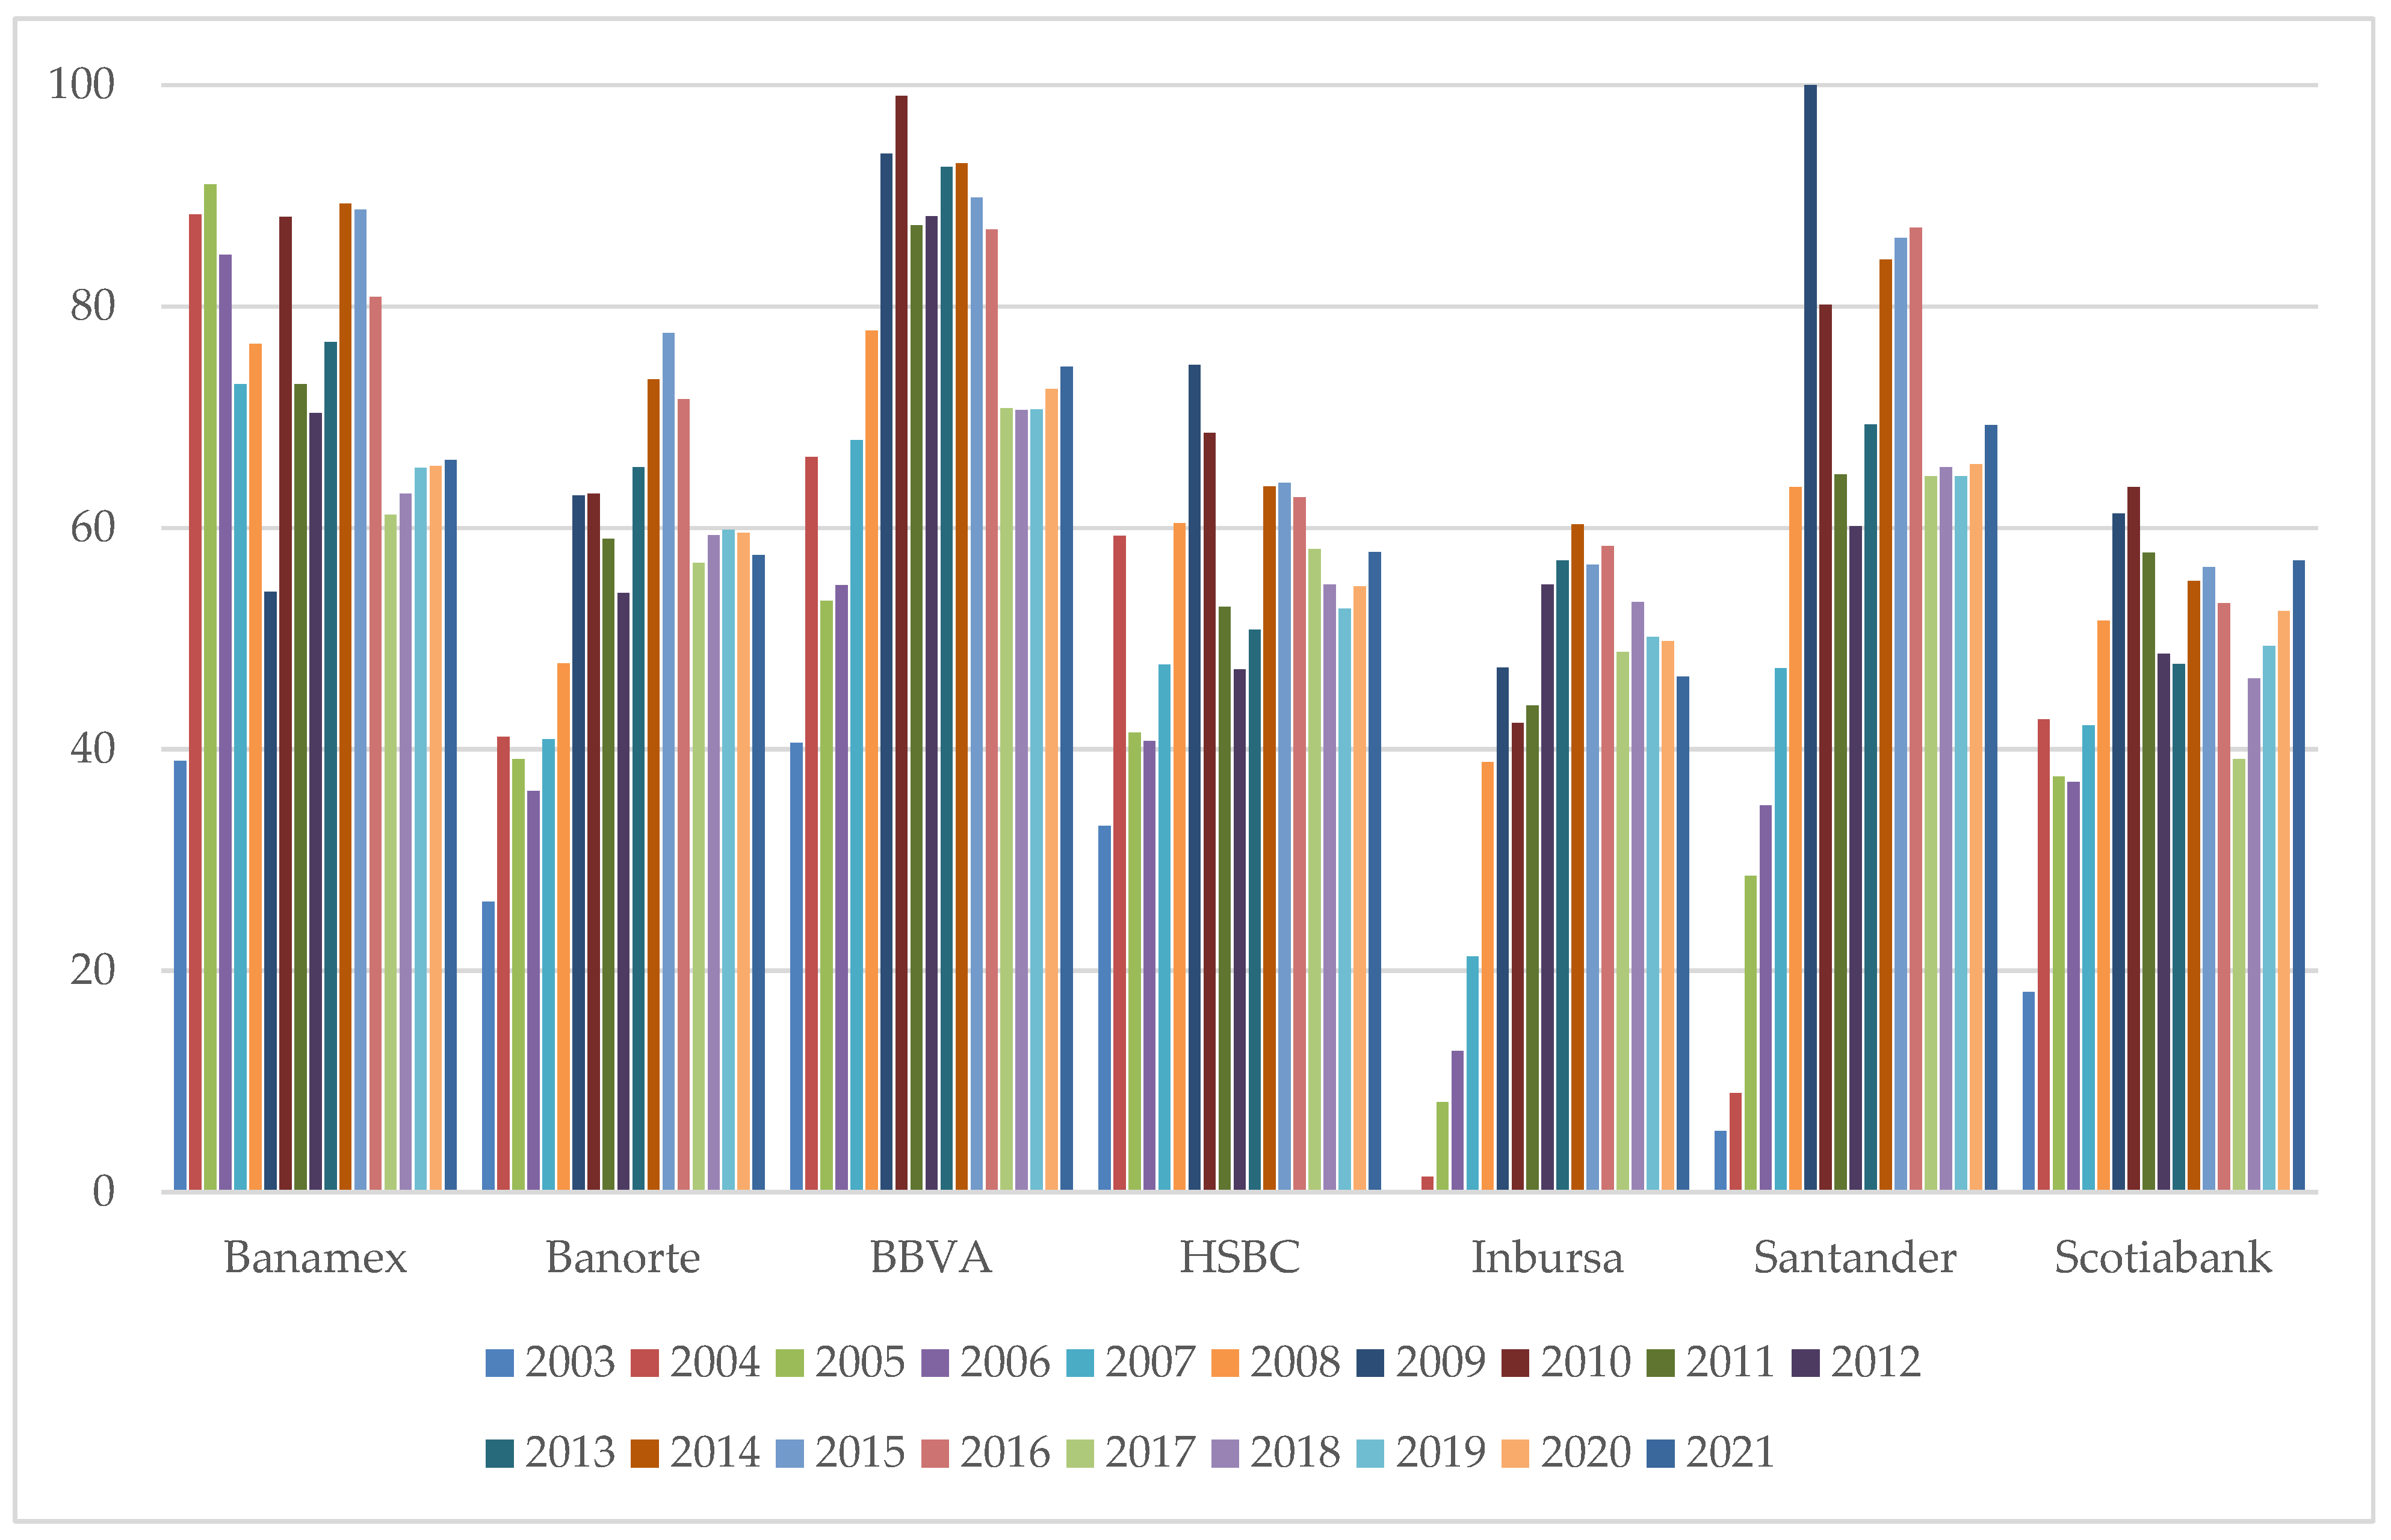
3.2. Procedure for Calculating the Bank Performance Index

3.2.1. Index I

Once the five independent variables of Model I have been identified, the Model I cumulative variance is calculated, and each variable contribution to cumulative variance is defined as k j = V a r ( x ) / 1 5 V a r ( x j ) ; x stands for an independent variable with j from 1 to 5.
The xij original value is multiplied by k j , and added to obtain a total score; S i = 1 5 x i j k j   ;   w i t h   j = 1 to 5 and i = observation.
The score variables are center and scale transformed, i.e., z i = ( S i − min(S))/(max(S) − min(S)) where Si is the original, zi the scaled values and i the observation. Finally, the calculation output of this transformation is multiplied by 100 to re-express it on a friendlier scale from 0 to 100.

3.2.2. Index II

After the three main components with the original normalized values have been chosen, the Model II cumulative variance is obtained. The eigenvalue of each component weighted by its respective contribution to the percentage of the accumulated variance is added. This sum is re-expressed for better interpretability on a scale from 0 to 100 analogously, as described in Section 3.2.1.

4. Results

When exploring the data with Spearman’s correlation test, we found that the variable most correlated with RESNETO is CVIG, so it is inferred that it is the most influential target variable (RESNETO). In the scatter plot, the relationship between both variables, indicated with different colors for each bank, can be verified (Table 1, Figure 1).
The review of Spearman’s correlations between all the variables taken by peers indicates that those linked to commercial banking activities, such as the total average volume of the current loan portfolio (CVIG), the total average volume of the portfolio of unpaid loans (CVENC), the total volume of penalties and losses (write-offs) recognized during the year (QYC), the average annual total volume of deposits (DEPDISP) and the average annual volume of total savings and investments with a fixed maturity of one year (DEPPZO) show a high positive correlation with the profit and loss variable (RESNETO); however, the ROA and ROE profitability ratio variables reveal a low inverse correlation with the first mentioned method, and a direct association with RESNETO.
The average non-performing variable of the IMOR loan portfolio is inversely associated with the total average volume of the CVIG current loan portfolio and with ROE, and moderately interconnected with CVENC. Meanwhile, IMORA is directly and moderately associated with ROA, ROE, QYC, and CVENC and inversely correlated with CVIG, DEPDISP, and DEPPZO (Table 2).
In Model I, the dynamics of change of the variables associated with credit and fundraising, such as the average total volume of the current loan portfolio (CVIG), the total average volume of the portfolio of past due loans (CVENC), the total average annual volume of deposits (DEPDISP), the average annual loan volume of total savings and investments with fixed maturity to one year (DEPPZO), together with the NPL ratio adjusted for write-offs recognized during the year (IMORA), were considered the most relevant inputs to estimate the level of profit and losses (RESNETO).
The following three regression algorithms were tested on training and test sets: Linear Regression, Decision Tree, and Random Forest. The accuracy of each of them was evaluated with the Mean Absolute Error (MAE) metric and cross-validation technique. (Table 3). In this case, the minimum MAE came from Random Forest and was consistent on both data sets.
In this way, the model based on the Random Forest algorithm can be used to make predictions in terms of the behavior of the RESNETO variable (Figure 2, Figure 3).
The Bank Performance Index I calculated from the five predictive variables of Model I shows a decreasing trend for all banks under study from 2009 to 2013; it can be related to the 2008 financial crisis lagged effect. From 2013 to 2016, a recovery period is observed, then a fall again from 2016 to 2021. The best years for most banks were 2015–2016. Santander had the highest score of 100 in 2009, and the best-placed 2021 bank is BBVA, with an index of 75 (Figure 4).
In Model II, using PCA, three central components were found, which capture 86% of the total variance. Component 1 accounts for 50.79% of the total variance; component 2 accounts for 22.55%, and component 3 accounts for 12.84% (Table 4).
Nevertheless, the three main components are latent variables; they were used as predictor variables with RESNETO as the target variable. The same machine learning algorithms, LR, DT, and FR, were performed on training and test data sets. The findings coincided with Model I; RF has the lowest MAE (Table 5).
The Bank Performance Index II calculated from the components of Model II (PCA) shows a positive slope from 2012 to the present for BBVA, Banorte and Santander, and Scotiabank, except for 2018 when it decreases; on the other hand, it changes in an erratic way for Banamex, HSBC, and Inbursa. With this metric, the best levels are observed in 2021, where BBVA reaches 100 points (Figure 5).

5. Discussion

Predictive models I and II, constructed using machine learning, display reasonably accurate estimates of the yearly profit and losses of the banks analyzed. Both models perform well, with an acceptable MAE representing 12% and 13% of the actual profit and losses mean value for the training data set and 23% to 30% for the test data set.
Model I involve five variables that are directly related to the bank’s fundamental financial intermediation activity and the quality of its loan portfolio; therefore, it is easy to forecast the expected level of profits and losses using percentage variations in the current portfolio, non-performing loans, deposits available (on demand and savings) and changes to the delinquency ratio including write-offs as the explanatory variables.
On the other hand, model II reduces the dimensionality of the data to three principal components and the variance of the expected profit and losses is proportionally more significant than that of model I. However, as the components are latent variables, they are not interpretable; therefore, their practical usefulness for predictive purposes is lower than for model I.
The aim of constructing a parameter to measure and evaluate banking performance from the explanatory variables of model I and from the main components of model II is satisfactorily fulfilled, resulting in two bank performance indices; each assigns scores on a scale from 0 to 100 to each bank for each year analyzed. The score of each financial intermediary differs from one index to another. However, it does not significantly affect the ranking positions of each institution, which are ordered by year from highest to lowest according to their ratings (Table 6), except for HSBC in 2017. Given the above, it is considered convenient to use Index I, as obtained from model I.
According to the proposed method, bank performance indices defined using a machine learning model are helpful to track the progress, stagnation, or setbacks experienced by each of the prominent Mexican banks, as well as to make comparisons between them using values between 0 and 100.
For Bank Performance Index I, the best bank in the generation of profits derived from its commercial activity over the years is BBVA, which is located in the first three places in the study time window, becoming the benchmark, followed by Banamex and more recently by Santander. Santander and Banorte have risen from less than 3 and 10 index points in 2003 to 42 and 31 in 2021, respectively.
Banamex, which ranked first in 2003 with 17.4 points, was just very close to BBVA (17.3 points) and fell to fourth place in 2017. Banamex had a negative year in 2009, when it finished in sixth position, but recovered in 2010.
HSBC and Scotiabank have alternated in the lower middle part occupying the fifth and sixth positions; however, HSBC began to improve its positioning in 2021, taking fourth place.
In the last two years, Santander’s Index I of banking performance placed it in the third position, followed by Inbursa or HSBC.
Inbursa remained at the bottom of the list until 2011; in 2012, it moved to the fifth position and settled below fifth until 2017, rising again in 2019 and 2020 to fourth place.
According to Bank Performance Index I defined here, in 2021 Inbursa is in sixth place with 31 points and BBVA is at the top with 43 points; this shows that Inbursa’s ability to generate profits through its fundraising and lending activity is much lower than that of BBVA. In contrast, when evaluating the banks in the sample with the CAMELS Index (focusing on the financial health and soundness of the institution) it is observed that Inbursa has the second-best position together with BBVA with 2.6 points on a scale of 1 to 5 (Table 7).
While in soundness and solvency, BBVA and Inbursa have excellent overall financial health under the CAMELS methodology, the opposite is true regarding their ability to generate profits when evaluated with Bank Performance Index I.
This comparison is relevant because, according to the theoretical framework, for a bank to be able to generate shared value, it is a necessary condition that it generates profits; even if a bank has a solid balance sheet, if it does not create economic value, it will not be able to generate social value.

6. Conclusions

Several studies analyze the determinants of income and profit; the most current and relevant for discussion are added in the document. However, few incorporate the social element or the creation of social value and almost zero those that combine economic and social value as a bank’s profit and loss drivers. Our contribution in this article demonstrates that by using machine learning, it is possible to define a reliable predictive model with five independent variables related to bank intermediation and portfolio quality (model I), with net profit and losses as the target variable.
Model I ease interpretation when compared with a predictive model of the net result based on three main components. For simplicity, it is more convenient to use model I. Based on the independent variables of model I, Bank Performance Index I was defined to gauge, using a metric with a scale of 0 to 100, the profit generation capacity of each institution from 2003 to 2021 in addition to its ranking position from 1 to 7 in each of the years under study. The original variables of commercial banking business relate to each other in such a way that they can reasonably predict the net profit and losses, so together, they comprise a critical factor for the creation of the economic value of a bank.
Bank Performance Index I evolution analysis shows evidence that BBVA has the highest performance, followed by Santander, Banamex, and Banorte. The higher-ranking position denotes the creation of economic value and consequently increases the likelihood of creating social value. When both co-occur, the creation of shared value is present, and benefits are generated for both companies and society.
The findings are significant because this approach can induce banking institutions to:
  • Reconceive products and markets to support existing and potential customers’ financial health, opening up banking services to the unbanked population.
  • Finance small and medium-sized enterprises or production clusters members to boost regional economies.
  • Redefine internal processes to enhance their commercial activities and productivity, thereby improving their potential to produce economic value.
According to the determined Bank Performance Index I, the best banks from 2003 to 2021 were BBVA, Banorte, Santander and Banamex. The last three have similar metrics, and BBVA does not give up its leadership position. At the bottom of the ranking are Inbursa, Scotiabank, and HSBC.
To expand on the scope of this research, a future work should provide a comparative analysis of large, medium, and small Mexican banks, with the inclusion of some global international banks to identify how profit-predicting model I and Banking Performance Index I run.

Supplementary Materials

The following supporting information can be downloaded at: https://www.mdpi.com/article/10.3390/su15075696/s1, Supplementary Materials Appendixes SA and SB [42,43,44,45].

Author Contributions

Conceptualization, C.G.-R. and A.T.-B.; methodology, C.G.-R., A.T.-B. and A.M.-V.; software, C.G.-R. and A.M.-V.; validation, C.G.-R., A.T.-B., M.V.-S. and A.M.-V.; formal analysis, C.G.-R., A.T.-B., M.V.-S. and A.M.-V.; investigation, C.G.-R., A.T.-B. and A.M.-V.; resources, C.G.-R., A.T.-B. and A.M.-V.; data curation, C.G.-R.; writing—original draft preparation, C.G.-R., A.T.-B. and A.M.-V.; writing—review and editing, C.G.-R., A.T.-B., M.V.-S. and A.M.-V.; visualization, C.G.-R., A.T.-B. and A.M.-V.; supervision, A.T.-B., M.V.-S. and A.M.-V.; project administration, A.T.-B. All authors have read and agreed to the published version of the manuscript.

Funding

This research received no external funding.

Institutional Review Board Statement

Not applicable.

Informed Consent Statement

Not applicable.

Data Availability Statement

Not applicable.

Conflicts of Interest

The authors declare no conflict of interest.

References

  1. Porter, M.E.; Kramer, M.R. Strategy and society: The link between competitive advantage and corporate social responsibility. Harv. Bus. Rev. 2006, 84, 78–92. [Google Scholar]
  2. Porter, M.E.; Kramer, M.R. Creation of shared value. Harv. Bus. Rev. 2011, 89, 62–77. [Google Scholar]
  3. Islam, M.; Hossain, S. Conceptual mapping of shared value creation by the private commercial banks in Bangladesh. Asian J. Sustain. Soc. Responsib. 2019, 4, 3. [Google Scholar] [CrossRef]
  4. Hicks, J. A Theory of Economic History; Oxford University Press: Oxford, UK, 1969; Volume 163. [Google Scholar]
  5. Festré, A.; Nasica, E. Schumpeter on Money, Banking, and Finance: An Institutionalist Perspective. Eur. J. Hist. Econ. Thought 2009, 16, 325–356. [Google Scholar] [CrossRef] [Green Version]
  6. Paulet, E.; Mavoori, H. Conventional banks and Fintechs: How digitization has transformed both models. J. Bus. Strategy 2020, 41, 19–29. [Google Scholar] [CrossRef]
  7. Salmony, M. Banks taking back control. J. Paym. Strategy Syst. 2019, 13, 13–19. [Google Scholar]
  8. Corner, P.D.; Pavlovich, K. Shared Value Through Inner Knowledge Creation. J. Bus. Ethics 2016, 135, 543–555. [Google Scholar] [CrossRef]
  9. Jallo, M.; Ticona, L.; Apazca, C.M.; Ticona, M.; Rodríguez, I. Analysis of the determining factors that influence on credit delay, Puno, Perú. Veritas Sci. 2022, 11, 125–137. [Google Scholar]
  10. Caselli, M.; Somekh, B. Access to Banking and the Role of Inequality and the Financial Crisis. B.E. J. Econ. Anal. Policy 2021, 21, 1373–1410. [Google Scholar] [CrossRef]
  11. Cepni, O.; Demirer, R.; Gupta, R.; Sensoy, A. Interest rate uncertainty and the predictability of bank revenues. J. Forecast. 2022, 41, 1559–1569. [Google Scholar] [CrossRef]
  12. Ronquillo, D.; Aguilasocho, D.; Galeana, E. Financial Factors that Determine The Mexican Banking Market Profitability. Merc. Neg. 2018, 38, 23–44. [Google Scholar]
  13. Apolo Cárdenas, C.A. Eficiencia Técnica de los Bancos del Ecuador y sus Determinantes Durante el Período de 2015–2019. Bachelor’s Thesis, PUCE-Ecuador, Quito, Ecuador, 2022. [Google Scholar]
  14. Chavarín, R. Determinants of Commercial Bank Profitability in Mexico. EconoQuantum 2015, 12, 97–123. [Google Scholar] [CrossRef] [Green Version]
  15. Gurley, J.G.; Shaw, E.S. Money in a Theory of Finance; The Brookings Institution: Washington, DC, USA, 1960. [Google Scholar]
  16. Mustafina, K.; Limanskis, A. Profitability growth factors as a driver of sustainability in the banking sector. J. Bus. Manag. 2017, 14, 69–84. [Google Scholar]
  17. Jones, S.; Wright, C. Fashion or future: Does creating shared value pay? Account. Financ. 2018, 58, 1111–1139. [Google Scholar] [CrossRef]
  18. Burrell, L.; Hewlett, S.A.; Luce, C.B.; Frohman, D. ACM International Conference Proceeding Series, Proceedings of the 1st International Conference on Information Interaction in Context, Copenhagen, Denmark, 18–20 October; Association for Computing Machinery: New York, NY, USA, 2006; Volume 176. [Google Scholar]
  19. Mendy, J. Supporting the creation of shared value. Strateg. Chang. 2019, 28, 157–161. [Google Scholar] [CrossRef]
  20. Dembek, K.; Singh, P.; Bhakoo, V. Literature Review of Shared Value: A Theoretical Concept or a Management Buzzword? J. Bus. Ethics 2016, 137, 231–267. [Google Scholar] [CrossRef]
  21. Moon, H.C.; Parc, J. Shifting corporate social responsibility to corporate social opportunity through creating shared value. Strateg. Chang. 2019, 28, 115–122. [Google Scholar] [CrossRef]
  22. Bockstette, V.; Stamp, M. Creating Shared Value: A How to Guide for the New Corporate (R) Evolution. 2011. Available online: http://www.FSG.org/publications/creating-shared-value-how--guide-new-corporate-revolution (accessed on 5 December 2022).
  23. Ilmarinen, P.; Akpinar, M. Creating Shared Value in the Banking Industry: A Case Study from Finland. 2018. Available online: https://www.researchgate.net/publication/325284745_Creating_shared_value_in_the_banking_industry_A_case_study_from_Finland (accessed on 7 February 2023).
  24. Pfitzer, M.; Bockstette, V.; Stamp, M. Innovating for Shared Value. Companies that deliver both social benefit and business value rely on five mutually reinforcing element. Harv. Bus. Rev. 2013, 89, 3–9. [Google Scholar]
  25. Spitzeck, H.; Chapman, S. Creating shared value as a differentiation strategy—The example of BASF in Brazil. Corp. Gov. 2012, 12, 499–513. [Google Scholar] [CrossRef] [Green Version]
  26. Spitzeck, H. Normative versus instrumental corporate responsibility. In Encyclopedia of Corporate Social Responsibility; Springer: Berlin/Heidelberg, Germany, 2013; pp. 1768–1770. [Google Scholar] [CrossRef]
  27. Maltz, E.; Thompson, F.; Ringold, D.J. Assessing and maximizing corporate social initiatives: A strategic view of corporate social responsibility. J. Public Aff. 2011, 11, 344–352. [Google Scholar] [CrossRef]
  28. Mohammed, M. Conceptual framework for corporate accountability in the context of sustainability—A Literature Review. In Proceedings of the 5th Annual EuroMed Conference of the EuroMed Academy of Business, Montreux, Switzerland, 4–5 October 2012; pp. 1131–1140. [Google Scholar]
  29. Yang, T.K.; Yan, M.R. The corporate shared value for sustainable development: An ecosystem perspective. Sustainability 2020, 12, 2348. [Google Scholar] [CrossRef] [Green Version]
  30. Johan, S.; Sari, W.R. The influence of the CEO characteristics on banking performance. In Proceedings of the International Conference on Management, Accounting, and Economy (ICMAE 2020), Jakarta, Indonesia, 13–14 February 2020. [Google Scholar]
  31. Simpson, W.G.; Kohers, T. The Link Between Corporate Social and Financial Performance: Evidence from the Banking Industry. J. Bus. Ethics 2002, 35, 97–109. [Google Scholar] [CrossRef]
  32. Brotons, J.; Sansalvador, M. The relationship between corporate social responsibility certification and financial performance: An empirical study in Spain. Corp. Soc. Resp. Env. 2020, 27, 1465–1477. [Google Scholar] [CrossRef]
  33. Jiménez-Hernández, I.; Palazzo, G.; Sáez-Fernández, F.J. Determinants of banking efficiency: Evidence from the Latin American banking industry. Appl. Econ. Anal. 2019, 27, 184–206. [Google Scholar] [CrossRef] [Green Version]
  34. Arteaga, J. Market Power or Efficiency: Origin of the Profits of the Mexican Banking System from 1995 to 1999. Master’s Thesis, Universidad Autónoma de Nuevo León, Monterrey, Mexico, 2001; pp. 35–48. [Google Scholar]
  35. Chortareas, G.; Garza-García, J.; Girardone, C. Market structure, profits and spreads in the Mexican banking industry. Banks Bank Syst. 2009, 4, 43–52. [Google Scholar]
  36. Garza-Garcia, J.G. Does market power influence banks’ profits in Mexico? A study on market power and efficiency. Appl. Financ. Econ. 2012, 22, 21–32. [Google Scholar] [CrossRef]
  37. Guerrero, R.; Villalpando, M. Profitability, concentration and efficiency in the Mexican banking system. El Trimest. Económica 2009, 76, 237–263. [Google Scholar] [CrossRef] [Green Version]
  38. Montemayor, E.R. Industrial concentration and profitability of banking in Mexico-Evaluation after the 1995 recession. Trimest. Econ. 2003, 70, 371–404. [Google Scholar]
  39. Pampurini, F.; Quaranta, A. Measurement of efficiency in the banking market. An empirical investigation of the performance of the last decade. SSRN Electron. J. 2020, 1–33. [Google Scholar] [CrossRef]
  40. Gaul, L.; Jones, J.; Uysal, P. Forecasting High-Risk Composite CAMELS Ratings. Int. Financ. Discuss. Pap. 2019, 2019, 1252. [Google Scholar] [CrossRef]
  41. Demsar, J.; Curk, T.; Erjavec, A.; Gorup, C.; Hocevar, T.; Milutinovic, M.; Mozina, M.; Polajnar, M.; Toplak, M.; Staric, A.; et al. Orange: Data Mining Toolbox in Python. J. Mach. Learn. Res. 2013, 14, 2349–2353. [Google Scholar] [CrossRef] [Green Version]
  42. Goodfellow, I.; Bengio, Y.; Courville, A. Deep Learning; MIT Press: Cambridge, MA, USA, 2016. [Google Scholar] [CrossRef]
  43. Ho, T.K. The Random Subspace Method for Constructing Decision Forests. IEEE Trans. PatternAnalysis Mach. Intell. 1998, 20, 832–844. [Google Scholar] [CrossRef] [Green Version]
  44. Breiman, L. Random Forests. Mach. Learn. 2001, 45, 5–32. [Google Scholar] [CrossRef] [Green Version]
  45. Quinlan, J.R. Induction of decision trees. Mach. Learn. 1986, 1, 81–106. [Google Scholar] [CrossRef] [Green Version]
Figure 1. Scatter plot between RESNETO and CVIG, from 2003 to 2021 in the main Mexican banks. Source: authors.
Sustainability 15 05696 g001
Figure 2. Model I RESNETO comparison actual vs predicted on train data set. Source: authors based on model I results.
Sustainability 15 05696 g002
Figure 3. Model I RESNETO comparison actual vs predicted on test data set. Source: authors, based on model I results.
Sustainability 15 05696 g003
Figure 4. Bank Performance Index I, from 2003 to 2021. Source: authors, based on Model I results.
Sustainability 15 05696 g004
Figure 5. Bank Performance Index II, from 2003 to 2021. Source: authors based on Model II results.
Sustainability 15 05696 g005
Table 1. Spearman’s correlations between RESNETO and other variables.
CorrelationVariable 1Variable 2
0.804CVIGRESNETO
0.752DEPPZORESNETO
Source: authors.
Table 2. Spearman correlation between variables.
CVIGCVENCQYCDEPDISPDEPPZOROAROEIMORIMORARESNETO
CVIG1.000
CVENC0.8581.000
QYC0.8580.8241.000
DEPDISP0.9520.8500.9101.000
DEPPZO0.9250.8110.8570.8571.000
ROA−0.176−0.247−0.245−0.287−0.1591.000
ROE−0.115−0.202−0.172−0.172−0.0150.7611.000
IMOR−0.2260.109−0.222−0.222−0.1930.3900.3131.000
IMORA0.1060.1880.3100.1710.0510.3840.2970.6231.000
RESNETO0.8040.6280.6970.7450.7520.2570.291−0.1350.1851.000
Source: authors.
Table 3. Model I. Regression supervised machine learning comparison.
ModelMAE
Train Data Set
MAE
Test Data Set
Random Forest1378.32605.4
Linear Regression3873.95017.9
Decision Tree 1495.83090.3
Source: authors. Cross Validation sample method used with 5 subsets.
Table 4. Principal components’ individual and cumulative variance.
ComponentVariance (%)Cumulative Variance (%)
1 50.79150.791
2 22.55873.350
3 12.84386.193
4 6.36292.555
5 3.41895.973
6 2.50598.479
7 0.78399.262
8 0.06099.864
9 0.001100.000
Source: authors.
Table 5. Model II. Regression supervised machine learning comparison.
ModelMAE
Train Data Set
MAE
Test Data Set
Random Forest1523.23372.7
Linear Regression2740.33902.2
Decision Tree 1672.73771.2
Note: Cross Validation sample method used with 5 subsets and three main components from PCA as predictor variables. Source: authors.
Table 6. Main Mexican Banks’ ranking position variation in terms of Banking Performance Index I with II, from 2003 to 2021.
Bank Performance IndicatorBank Ranking Position by YearDifference
Year_BankIndex IIndex IIIndex IIndex IIRanking (Index I-II)
2003_Banamex17.428.812−1
2003_Banorte10.011.145−1
2003_BBVA17.330.6211
2003_Scotiabank8.911.9541
2004_Banorte31.415.0541
2004_Scotiabank43.014.5431
2005_Banorte35.011.945−1
2005_HSBC32.113.8532
2005_Scotiabank35.612.134−1
2006_Banorte29.311.646−2
2006_HSBC29.014.8532
2006_Santander24.414.5642
2006_Scotiabank33.212.235−2
2007_Banamex63.534.212−1
2007_BBVA49.440.4211
2007_HSBC32.920.6532
2007_Scotiabank37.514.735−2
2008_Banamex66.435.212−1
2008_Banorte35.918.8651
2008_BBVA59.450.8211
2008_HSBC46.531.5532
2008_Santander53.927.734−1
2008_Scotiabank48.018.746−2
2009_Banamex43.623.9651
2009_Banorte51.828.1541
2009_BBVA77.368.1211
2009_Santander100.044.812−1
2009_Scotiabank58.823.146−2
2010_Banorte52.626.7651
2010_HSBC61.028.7541
2010_Scotiabank61.523.746−2
2011_Banorte44.426.8541
2011_HSBC40.821.8651
2011_Santander52.229.9431
2011_Scotiabank54.220.136−3
2012_Banorte37.425.4642
2012_HSBC34.020.2761
2012_Inbursa43.621.745−1
2012_Scotiabank42.716.857−2
2014_Inbursa48.426.256−1
2015_Banamex76.053.413−2
2015_BBVA67.577.8312
2015_Inbursa41.925.6761
2015_Scotiabank44.922.167−1
2016_Banamex65.352.923−1
2016_BBVA62.781.9312
2016_Santander69.059.612−1
2017_Banamex38.348.3431
2017_Banorte31.742.0541
2017_BBVA40.780.8211
2017_HSBC41.228.215−4
2017_Santander40.151.6321
2018_Banorte32.549.8642
2018_Inbursa36.624.646−2
2019_Banamex40.655.713−2
2019_Banorte32.153.8541
2019_BBVA38.888.1211
2019_HSBC31.631.8651
2019_Inbursa34.621.547−3
2019_Santander38.157.2321
2019_Scotiabank26.327.5761
2020_Banamex40.856.913−2
2020_Banorte33.554.7541
2020_BBVA40.096.6211
2020_HSBC33.034.9651
2020_Inbursa34.221.647−3
2020_Santander38.362.7321
2020_Scotiabank28.331.9761
2021_Banamex43.254.213−2
2021_Banorte31.050.9743
2021_BBVA42.8100.0211
2021_HSBC36.634.846−2
2021_Inbursa31.518.067−1
2021_Santander42.466.2321
Source: authors, from Model I and Model II results.
Table 7. Main Mexican Banks Camel Index, 2021.
YearBankCapital Adequacy 1/Asset Quality 2/Management 3/EarningsLiquiditySensitivity 8/Camels index 9/
ROA 4/ROE 5/L1 6/L2 7/
2021Banamex1.02.01.03.05.03.05.04.03.0
2021BBVA1.02.01.02.04.05.05.01.02.6
2021Santander1.02.01.03.05.05.05.03.03.1
2021Banorte1.01.01.02.04.05.05.01.02.5
2021HSBC3.02.01.05.05.04.05.01.03.3
2021Scotiabank2.02.01.03.05.05.05.01.03.0
2021Inbursa1.02.01.01.05.05.05.01.02.6
Source: authors from Model I and Model II results; 1/ C = Average (FCR + BCR) = FCR (Fundamental capital ratio) = Fundamental Capital/Risk adjusted total assets; BCR (Basic Capital Ratio) = (Fundamental Capital + Non fundamental Capital)/Risk adjusted total assets. 2/ A = Average (IMOR + IMORA). 3/ M = Operating expenses/Operating profit. 4/ E1 = ROA. 5/ E2 = ROE. 6/ L1 = L1 = Total loans/Total deposits. 7/ L2 = L2 = Current assets/Total assets. 8/ S = Total securities/Total assets. 9/ CAMELS = Average (1 + 2 + 3 + 4 + 5 + 6 + 7 + 8).
Disclaimer/Publisher’s Note: The statements, opinions and data contained in all publications are solely those of the individual author(s) and contributor(s) and not of MDPI and/or the editor(s). MDPI and/or the editor(s) disclaim responsibility for any injury to people or property resulting from any ideas, methods, instructions or products referred to in the content.

