Abstract
Manufacturing, as an energy-intensive industry, plays a major role in economic growth. Its green growth is the focus of national planning for sustainable development, especially for a country such as Korea, which has a scarcity of fossil energy of its own. While internationalization has brought Korea scarce energy, serious carbon emissions have become a pressing issue. It is still necessary to explore the relationship between globalization and green growth in manufacturing. Thus, our paper aims to observe their relationship by using 24 manufacturing industries from 2011 to 2019. Through the panel Granger non-causality test and the Dumitrescu–Hurlin test, we find that imports and inward foreign direct investment (FDI) causes green growth at the overall manufacturing level, but their causality relationships exist in different industries. The green-growth causality relationship of inward FDI mainly exists in capital-intensive and internationally competitive manufacturing industries (manufacture industries of basic metals; furniture; food products; coke, briquettes, and refined petroleum products; and chemicals and chemical products, except pharmaceuticals and medicinal chemicals). Furthermore, the green-growth causality relationship of imports primarily exists in the fossil-energy-consumption-intensive manufacturing industry (manufacture industries of motor vehicles, trailers, and semitrailers and coke, briquettes, and refined petroleum products). Furthermore, in our regression analysis, we find that only inward FDI robustly promotes the Korean manufacturing sector’s green growth; the positive effect is in the range from 0.005 to 0.009. Though the parameter estimates are positive and significant for FDI, they are close to zero, suggesting very limited positive effects that are close to almost zero. Conversely, imports have no significant impact, which we speculate is related to the import structure of Korea. Hence, the Korean manufacturing development model suggests that developing countries with similar country characteristics need to develop and guide the formation of capital-intensive and competitive industries. Additionally, it is imperative to decarbonize energy-intensive industries and to work on renewable energy development and diffusion. Finally, it is essential to introduce various green monitoring mechanisms to reduce carbon emissions. The government needs to strengthen its support for research and development of innovative technologies to reduce carbon emissions as well as promote the development of environmental and energy-saving related professional service enterprises.
1. Introduction
As one of the externalities of the global economy, climate change results from increasing greenhouse gas emissions, primarily due to the burning of fossil fuels such as coal, oil, and natural gas [1], particularly from the development of heavy industry, vehicle exhaust emissions, and so on. It is mostly an undesired byproduct of industrialization and economic activities (Climate Action, European Commission). Carbon emissions are an accumulated process that possesses path dependence on the history of emissions and economic growth [2]. Because of its irreversible nature, governance is the central issue in dealing with it [1]. Thus, the current severe emission status has led to more governments committing to reducing fossil fuel use and developing renewable energy while pursuing economic growth, which is also the known as green growth or sustainable growth [3].
Globalization, on the one hand, has spread the effects of climate change to other countries. In addition to the carbon emissions directly caused by developing countries themselves, their location on the industrial chain also indirectly transmits pressures related to emission reductions from developed countries to developing countries, which is not conducive to green growth [3]. Globalization, on the other hand, can boost innovation and the sharing of energy-saving and emission-reducing technologies among countries, making it easier to deal with climate change [4]. Furthermore, with the process of globalization, international trade and foreign direct investment (FDI) present an excellent opportunity for optimizing resource allocation and boosting labor productivity.
Globalization has given South Korea (Korea) enormous prospects and has allowed it to make up for its own shortage of mineral and energy resources in its industrialization process, resulting in the formation of an export-oriented economic development pattern [5]. However, such a pattern has also resulted in Korea’s industrial output comprising a much larger proportion of its GDP compared to other industrialized nations. As a significant contributor to national economic growth and a major source of greenhouse gas emissions, the manufacturing sector has contributed to high energy consumption and greenhouse gas emissions [6]. In other words, Korean economic success over the past few decades has been driven primarily by energy-intensive industries, which in turn are mainly fueled by coal, which has left the country with a significant carbon footprint (The Carbon Brief Profile: South Korea).
Note that Korea has become the first country in the world to complete the transformation from a developing country to a developed country in 2021. Changes in international status have also led to South Korea’s need to assume more responsibility for energy conservation and emission reduction. In this regard, at the 26th Conference of the Parties of the United Nations Framework Convention on Climate Change World Leaders’ Summit, the President of Korea pledged to increase nationally determined contributions further; he stated that by 2030, greenhouse gas emissions would be 40% lower than in 2018, and by 2050, carbon neutrality would be achieved (Ministry News of Foreign Affairs, Republic of Korea). Therefore, the Korean manufacturing sector as the main source of carbon emissions should act immediately to accomplish an energy transition in order to achieve carbon neutrality and green growth shortly.
In 2020, greenhouse gas (GHG) emissions were lowered by 7.3% year over year to approximately 648.6 million tons, marking the second consecutive year that emissions were reduced in Korea, and per capita emissions decreased by 7.4% to 12.5 tons. The energy and industrial engineering sectors have reduced their GHG emissions by 7.8% and 7.1% year over year, respectively (Greenhouse Gas Inventory and Research Center). Due to the rise of Liquefied Natural Gas, nuclear power, and solar power, the share of coal-fired power generation declined from 43% to 39%. This transformation has resulted in record-low emission intensity for the Korean power sector. Despite this, the proportion of fossil fuels is still substantial at 67%. Meanwhile, despite renewable energy’s double-digit growth over the previous five years, the industry’s share has only reached 6%, considerably below the level of the European Union, Japan, and the United States. In sum, Korea’s greenhouse gas emissions have been decreasing, but the country still needs to exert effort on multiple fronts to meet its emission reduction goals, especially for the manufacturing sector.
Compared to the cases of developed country [3,7], prior studies examining the relationship between FDI or international trade and green growth mainly focused on developing countries [8,9,10,11,12,13,14,15,16,17,18], especially for the case of China. Furthermore, most studies also test the green growth impact of FDI or international trade in combination with environmental regulations, technological innovation, financial development, or other variables for threshold analysis [6,15,19,20,21].
Still, there is scarce research on the relationship between globalization and green growth in terms of the industry level of the Korean manufacturing sector. Furthermore, the differences in the progress towards carbon neutrality stem from different energy-consumption compositions, the substitutability of energy sources, the heterogeneous intensity of environmental regulations, and the characteristics of the Korean manufacturing industry itself, which intertwine with the differences in reliance on international trade or FDI to create a complex and diverse industry background. Therefore, there may be some deficiency in policy recommendations elicited from macro-level determinants such as countries or sectors [22].
Our study can fill the analysis gap using panel data composed of 24 Korean manufacturing industries from 2011 to 2019. This is the period in which Korea started publishing year-over-year carbon emission data until the outbreak of COVID-19. By using the Dumitrescu–Hurlin Granger non-causality test, we can observe the overall causality relationship between FDI or international trade and green growth in the Korean manufacturing sector and distinguish the heterogeneous causality relationship of 24 Korean manufacturing industries to identify individual effects and formulate corresponding decision-making principles in the complex context of manufacturing sectors. It would be also beneficial to suggest the right and appropriate policy recommendations for each manufacturing industry.
Second, as a typical export-oriented country, the Korean model of achieving green growth in manufacturing has significant reference value and implications for other developing countries regarding their energy scarcity as this relates to the transition to a more sustainable economic model while also pursuing economic growth. As the first country to transition from a developing to a developed country, the Korean manufacturing sector continuously upgrades its industries, thereby maintaining its economic growth while improving its environmental performance. Finally, a proper measurement of green growth is also vital for evaluating the effect of the reform conducted by the Korean government.
Our findings highlight that in the Granger causality analysis, imports and inward FDI have a Granger causality relationship with green growth in the Korean manufacturing sector, but the industries are different. In more detail, the green growth causality relationship of inward FDI mainly exists in capital-intensive and internationally competitive manufacturing industries and the green growth causality relationship of imports primarily exists in the fossil-energy-consumption-intensive manufacturing industry. In the subsequent regression analysis, our results illustrate that only the increase in inward FDI inflows significantly effectively raises the green growth of the Korean manufacturing sector. Conversely, imports have no significant impact; we speculate that this is related to the import structure of Korea.
2. Literature Review
In the current global trend of promoting carbon neutrality, economic growth is no longer based on a model focused on quantity that ignores quality. Sustainable green growth is not only the goal of developed countries but is also essential for developing countries undergoing industrialization due to high industrial growth often being accompanied by high emissions. That is, globalization presents significant development opportunities for developing countries while also presenting multifaceted challenges. Thus, research on the green growth impact of FDI or international trade has also been a hot topic in recent years. Unfortunately, no consensus has been reached on the relationship between them yet.
2.1. The Impact of FDI on GTFP
Since different directions of FDI have different impact paths on green growth measured according to green total factor productivity (GTFP), we distinguish between inward and outward FDI to investigate its impacts on GTFP, as summarized in Figure 1.
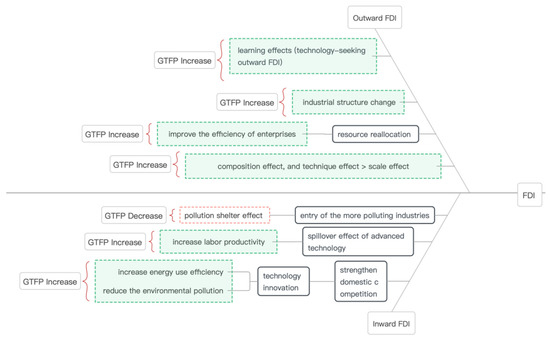
Figure 1.
The relationship between FDI and GTFP.
Inward FDI strengthens domestic competition and leads to the technological innovation of similar domestic enterprises, thus increasing carbon emission efficiency and reducing environmental pollution. On the other hand, especially for developing countries, the spillover effect of advanced technology and experience from inward FDI on their upstream and downstream industries increases labor productivity and eventually achieves green growth [23]. On the contrary, production activities at the bottom of the global value chain not only have low added value, but most have greater negative impact on the environment. With inward FDI flowing in, the entry of the more-polluting industries may make the recipient country suffer from the pollution shelter effect, thereby harming GTFP [24].
Li et al. [10] argue that inward FDI from Korea significantly inhibits China’s GTFP, equivalent to regarding China as a “pollution haven”. They interpret that the negative effect is due to China’s current lack of ability to digest, absorb, and re-innovate Korea’s advanced technology, thus resulting in insignificant technology spillover effects brought about by Korean inward FDI, which hinders the improvement of GTFP in China. However, when analysis targets the equipment manufacturing industry in China, the results confirm a positive association between inward FDI and equipment manufacturing GTFP and reveal that its positive effect comes from a combination of capital and technology spillover effects [11].
In addition to analyzing the green growth effect of inward FDI, a plethora of studies also target the impact of inward FDI on carbon emissions, carbon emission efficiency, environmental degradation, and air pollution. Using panel data from 25 OECD countries from 1991 to 2016, Paramati et al. [25] argue that green technology, trade, and FDI are the primary drivers for reducing carbon emissions. Inward FDI enables recipient countries to apply and innovate advanced technology in the domestic production process.
Solarin and AI-Mulali [24] conclude that inward FDI increases pollution in developing countries while reducing pollution in developed countries. The negative impact of FDI on environmental degradation in developed countries can be explained by the fact that these countries have strong environmental regulations that make it almost impossible for high-polluting foreign industries to invest in these countries when using data composed of 20 countries from 1982 to 2013. Hassaballa [26] tests the Granger causality relationship between FDI and emissions from energy use for 23 developing countries. The results indicate that there is a two-way relationship between FDI and emissions from energy use in seven countries only. Furthermore, energy use emissions Granger-cause FDI in 15 countries, whereas FDI Granger-cause emissions from energy use in 9 countries.
Similarly, Zafar et al. [27] point out that inward FDI could bring with it advanced technology and innovative products to reduce energy intensity or replace energy-intensive goods with energy-efficient goods, thereby decreasing environmental pollution in the United States. Zhu et al. [28] illustrate that the effect of FDI on carbon emissions is negative and that a higher level of trade openness can mitigate the increase in carbon emissions for ASEAN-5, especially in low- and high-emission nations. Khan et al. [29] show that economic policy uncertainty (EPU), trade, and GDP increase carbon emissions. However, FDI inflows and renewable energy consumption boost the quality of the environment of East Asian economies (China, Japan, Korea, and Singapore).
However, some studies also indicate that there is no significant impact between inward FDI and carbon emissions. For instance, Hille et al. [30] use the simultaneous equation model and decompose the air pollution impact of inward FDI into three aspects: scale effect, composition effect, and technique effect. The results show that inward FDI does not significantly affect air pollution in Korea since the technique effect can offset the increased part caused by the scale and composition effect of inward FDI.
Kim [31] tests the cointegration relationship between FDI, economic growth, industrial structure, renewable and nuclear energy, urbanization, and Korean GHG emissions using the ARDL bounds test. The results confirm that FDI inflows lead to an increase in GHG, but the coefficient is negligible. In the short run, economic growth causes an increase in GHG emissions, while renewable and nuclear energy contribute to a reduction in GHG emissions. FDI and urbanization do not play a role in increasing GHG emissions in the short term. Adebayo et al. [32] also reveal a one-way causality relationship between energy consumption and GDP in Korea.
Likewise, Lee [33] indicates that inward FDI directly affects economic growth but does not contribute to the increase in carbon emissions in G20 countries from 1971 to 2009. Ghorbal et al. [34] conclude that FDI, GDP, and home patents promote foreign patents in Korea, and suggest that it should continue attracting FDI because of their positive impact on foreign patents leading to more economic growth and a cleaner environment. Kim and Seok [35] reveal that FDI inflows positively affect CO2 emissions in the long run. However, the absolute size of the positive effect decreases with an increase in income. Eventually, the effect of FDI inflows changes from positive to negative.
In terms of outward FDI, developing countries can generate learning effects of green technology through technology-seeking outward FDI [17]. Meanwhile, it may affect the industrial structure of the home country. For example, labor-intensive and pollution-intensive industries are preferentially transferred overseas through outward FDI, thus upgrading the industrial structure and eventually promoting green growth in the domestic economy. Moreover, it facilitates resource reallocation as well. A more efficient resource reallocation improves the efficiency of domestic enterprises, which is also summarized in Figure 1.
Hao et al. [36] decompose the impact of outward FDI on environmental quality into scale, composition, and technique effects. However, by analyzing data from 29 Chinese provinces from 2003 to 2016, they argue that it is a positive effect, and more specifically, that the degree of the decrease in carbon emission intensity due to technology spillovers and industrial upgrading fully outweighs the increase in carbon emission intensity due to the expansion of domestic production. Song et al. [17] use Chinese firm-level data to find that outward FDI has a significant positive impact on GTFP. It also contributes positively to the GTFP of private- and foreign-invested firms in China. Additionally, technology-seeking outward FDI contributes more to GTFP than resource-seeking and market-seeking outward FDI.
Conversely, Wang et al. [37] indicate that when OFDI mainly concentrates on the leasing and business services industry, it is often impossible to transfer high-polluting, high-energy-consuming industries to the home country. Zhou et al. [13] illustrate that outward FDI brings green spillover effects to China only when the average number of years of education of workers or the index of environmental legal construction reaches a certain level in each province, and its effects are minimal. Meanwhile, there is significant heterogeneity among provinces due to the lack of necessary supporting conditions. In addition, Mohanty and Sethi [38] test the impact of outward FDI on energy consumption and environmental quality in BRICS from 1990 to 2019, conveying that outward FDI and energy consumption will help to reduce BRICS’ environmental pollution in the long run and find the existence of the Environmental Kuznets Curve in developing nations.
2.2. The Impact of International Trade on GTFP
With reference to earlier research on the relationship between international trade and GTFP, developing countries can obtain advanced technology and optimize industrial upgrading through international trade. Second, international trade can improve allocation efficiency and labor productivity through complementary advantages and enhance international trade competitiveness. Furthermore, the introduction of advanced technology and production processes can lead to cleaner production [3].
Conversely, Copeland and Taylor [39] point out that one key role of international trade is to offer an alternative abatement mechanism. International trade may expand the scale of domestic production [40], increasing a country’s pollution footprint [41]. Trade liberalization may lead to the excessive utilization of natural resources as well as the concentration of pollution-intensive industries in countries with less stringent environmental regulations, making them pollution havens [9]. Moreover, controlling for incomes and scale, changes in the sectoral composition of clean and dirty industries affects emissions. These trade-created composition effects vary across countries depending on their comparative advantages [40].
Li et al. [11] illustrate that exports increase the GTFP of the equipment manufacturing industry in China, but imports decrease it. The reason for this is that imports are intended for exports in the equipment manufacturing industry. However, there is potential environmental pollution in low-value-added production activities, such as assembly. Likewise, using firm-level Indian data from 2012 to 2020, Debbarma et al. [8] indicate that GTFP growth is higher for exporting firms than non-exporting firms. In other words, the “learning by exporting” effect exists and exports can help Indian firms face climate change. Moreover, Li et al. [10] find that trade effectively promotes technological progress, thereby improving China’s GTFP. The virtuous mechanism to encourage GTFP jointly has developed between trade and FDI in Korea and China.
In addition to studies targeting developing countries, some studies with samples from developed countries have come to similar conclusions. Cui et al. [3] apply a non-parametric approach to evaluate the green productivity of 36 OECD countries from 1990 to 2019 and find a positive association between international trade and green productivity. Topcu and Payne [42] suggest that OECD countries where trade is a major contributor to growth should recognize the potential adverse impact on growth. That is to say, increase in international trade could increase energy consumption.
Furthermore, Ustabas and Ersin [43] point out that high-technology exports have strong positive impacts on GDP per capita and economic growth rates in both the long-run and short-run models for Korea using structural unit root tests and cointegration methodologies. Bildirici and Ersin [44] confirm the interdependent relationship between biomass energy consumption and economic growth in the United States. Bildirici and Ersin [45] test the relationship between Industry 4.0-related variables and environmental sustainability and also explore its long-run and short-run effects on CO2 emissions for a panel of 9 countries (India, Italy, Germany, Canada, France, Japan, United States, and the United Kingdom). Among them, ICT-related I4.0 innovations were determined to affect emissions positively in the long-run in contrast to a relatively low effect in the short-run. ICT exports also affect emissions positively in all settings, especially in the long run. Energy consumption significantly promotes hazardous emissions; therefore, the large negative effect of energy consumption on the environment cannot be rejected.
Zafar et al. [22] confirm that FDI and trade openness have a significantly positive relationship with carbon emissions and have a certain association with green economic growth in the short and long runs. Le [46] concludes that there exists a positive cointegration relationship between international trade and industrial pollution emissions in the long run; international trade would harm the quality of Korea’s environment, and such an effect has some sustainability.
In summary, the research on two-directional FDI and international trade, which involves different dimensions or sample characteristics, ultimately fails to reach a consensus on the relationship between FDI or international trade on GTFP as of yet. Thus, it is still necessary and worthwhile to explore the relationship between them, especially in the context of the scarce studies that analyze the industry-level heterogeneous impact of the Korean manufacturing sector.
3. Data, Preliminary Test, and Methodology
3.1. Data
3.1.1. The Measurement of GTFP
Green growth is mostly measured according to GTFP, which not only includes a traditional input factor but also undesired byproducts, such as carbon emissions and industrial wastes [19]. Traditional total factor productivity (TFP) reflects the impact of technological progress and efficiency improvement during the process of economic growth, which measures the efficiency with which an economy can produce output from a given set of inputs and the quality of economic growth [47]. To take environmental performances into account, GTFP can be developed by incorporating environmental variables based on TFP, which denotes the ability of an economy to produce output from a given set of inputs while minimizing negative environmental consequences [48].
Furthermore, a wide variety of approaches have appeared in previous studies to measure GTFP. For instance, Song et al. [17] first start calculating total factor productivity before multiplying it with a green coefficient. However, most studies have used data envelopment analysis techniques (DEA), which consist of non-parametric linear programming for calculating the efficiency and productivity of decision-making units [49]. The approach traces out an efficient production frontier and calculates the distances from observed production to the frontier with given data containing inputs and outputs [48].
Chambers et al. [50] and Chung et al. [51] put forward the directional distance function (DDF) and Chung et al. [51] apply the directional distance function to the Malmquist model and develop the Malmquist–Luenberger productivity index [52]. Of these, the global Malmquist–Luenberger productivity index (GMLPI) is the more widely used to measure GTFP [10,11,13,52,53]. Compared to the conventional DDF and the Malmquist–Luenberger productivity index, GMLPI has the advantage of being circular and lacks infeasibility problems of measuring cross-period directional distance functions [54,55]. Thus, we will use the change in the GMLPI between t and t + 1 time to proxy for GTFP with reference to previous studies, which is defined below:
where is the form of global DDF based on the global benchmark technology, of which “g” stands for the direction vectors, “x” represents the input vectors, and the output vectors consist of good outputs “y” and bad outputs “b.” Based on the calculated results, we define that a GMLPI greater than 1 indicates an increase in the GTFP, and a GMLPI less than 1 indicates a decrease in the GTFP [52].
To calculate GMLPI, we use panel data derived from 24 Korean manufacturing industries from 2010 to 2019. Korean mining manufacturing survey reports provide the industry-level data are compiled with the tenth edition of Korean Standard Industrial Classification: the value-added (units: KRW million), shipments (units: KRW million), values of tangible assets at the end of the year (units: KRW million), the number of workers (units: person), and so on. Since we cannot collect capital stock data for the Korean manufacturing industry, we use the values of tangible assets at the end of each year as a proxy for capital stock with reference to Lee et al. [56]. They explained that capital contributions to the trends of profit generation decline over time, so it is more suitable to evaluate capital stock on a net basis.
Following this, we introduce the input and output variables for calculating GMLPI. Input variables include labor, capital stock, and energy consumption. The number of workers and energy consumption (units: thousand teq.) are proxies for labor and energy consumption, respectively. Energy consumption is the sum of the carbon dioxide equivalents of coal, oil, gas, thermal energy, electricity, etc. The values of tangible assets at the end of each year represent capital stock. Output variables include the desired and undesired output, which is represented by proxy by shipments and CO2 emissions (units: thousand tons), respectively. Data on energy consumption and CO2 emissions are drawn from the National Greenhouse Gas Emission Total Information System. The data for calculating GTFP is reported in Table 1.

Table 1.
Basic Data for calculating GTFP.
3.1.2. Other Variables
For globalization, we observe four proxy variables: inward FDI, outward FDI, imports, and exports. For their respective data sources, the outward FDI data are drawn from the Export–Import Bank of Korea and the inward FDI data are collected from the Ministry of Industry, Trade, and Industry Energy. The import and export data are drawn from the Korean Statistical Information Service. For the subsequent analysis, all of these are converted to the real values for the base period of 2015 and then have logarithms taken of them.
During this process, we find some zero FDI values in our data set at the industry level. However, if no action is taken to take the logarithm directly, these values will become missing data, thereby resulting in forming an unbalanced panel data set. Therefore, we replace all zero values of the raw data with one and then take the logarithm [57]. Then, to measure the productivity of the 24 Korean manufacturing industries, we use the ratio of value-added to the shipments to observe it in manufacturing.
The basic statistics of each variable are reported in Table 2. We find that the standard deviation of the GTFP of the Korean manufacturing sector is greater than 0, which means that it is in a state of green growth from 2011 to 2019. The Kurtosis statistic indicates that GTFP and outward FDI have a fat-tailed distribution and the remaining variables have a thin-tailed distribution.
Table 2.
Basic Statistics.
3.2. Preliminary Test
Before applying the Granger non-causality tests, we run a preliminary test step by step to ensure that the variables satisfy the prerequisite of determining whether the variables are stationary or not. In the first step, we test whether each cross-section’s slopes are homogeneous. Peseran and Yamagata [58] propose a normal distributed test [59]. Later, a robust version allows for heteroskedasticity autocorrelation and cross-sectional dependence [60]. The mean-variance bias-adjusted test statistics reported in column (4) of Table 3 show that only the import variable rejects the null hypothesis of homogeneous slopes. That is, only the import variable has a slope heterogeneity problem.
Table 3.
Residuals’ cross-section independence test and Slope homogeneity test.
Moreover, due to the common shocks, unobserved factors, spatial dependence, and idiosyncratic pairwise dependence in the disturbances, panel data models are likely to exhibit substantial cross-sectional dependence in the error term [61]. Note that the desired statistical properties of the LM test would be significantly destroyed in cases where the sample does not satisfy T > N. Thus, in the second step, we need to find proper methods to test cross-section dependence for cases where N > T, as mentioned by Pesaran, Ullah, and Yamagata [62]. Baltagi, Feng, and Kao [63] use both the LM test and the bias-adjusted LM test, but the former is suitable for the heterogeneous panels, the latter is for the homogeneous panels. The cross-section dependence test results are also reported in Table 3, revealing that there is indeed a cross-sectional dependence of all panels in the residuals.
Combining the above results of the residuals’ cross-section dependence and slope heterogeneity test, we then implement the panel unit root tests in the third step considering the idiosyncrasies of our panel data, which allows for heterogeneity slopes and addresses the cross-sectional dependence issue. The Pesaran CIPS panel unit root test accounts for heterogeneity across cross sections and assumes cross-sectional dependence in the form of a single unobserved common factor [64]. The null hypothesis is that the variable has a unit root for all cross sections under the assumption of cross-section dependence. In turn, the alternative hypothesis is that the variable has no unit root for some cross sections [65].
As the results show in column (1) of Table 4, we find that the level variable of GTFP, inward FDI, value-added, and imports reject the null hypothesis of having a unit root under the significance level of 10%, which indicates these variables are stationary. However, the remaining outward FDI and export variable cannot reject the null hypothesis. However, they reject it after the first-order difference in column (2) of Table 4, proving that these variables are stationary variables after differencing. Considering the short time dimensions of the collected data and the need for subsequent analysis, we choose not to difference the data, but to filter the non-stationary variables. Thus, we use the inward FDI, value-added, and import variables as independent variables to analyze the causality relationship between globalization and GTFP in the following research.
Table 4.
Panel Unit Root Test.
3.3. Methodology
We test the causal nexus between inward FDI or imports and GTFP. A simple Granger non-causality test in heterogeneous panel data models with fixed coefficients is conducted using the Dumitrescu–Hurlin test [66], which allows us to take into account both the heterogeneity of the causal relationships and the heterogeneity of the regression model used to test for Granger causality. It relies on a block bootstrapping approach that corrects the empirical critical values of the panel causality test statistic in order to deal with the cross-sectional dependence problem, which is performed within a bivariate panel Vector Autoregressive (VAR) modeling framework [65]. It can observe not only the overall average non-causality relationship but also the heterogeneous non-causality relationship for each manufacturing industry.
The Dumitrescu–Hurlin test has advantages in the analysis of Granger non-causality over other panel causality tests, which can be summarized as: (1) it is easy to compute the standard average Wald statistics, having a standard normal asymptotic distribution and (2) it has good properties for small T and N time dimensions panel data. In detail, the power of the Dumitrescu–Hurlin test statistic is that it substantially exceeds that of Granger non-causality tests based on a single time series in all experiments and in particular for very small values of T, e.g., T = 10, provided that there are at least a few cross-section units in the panel e.g., N = 5 [66].
We start with two stationary variables observed from 24 Korean manufacturing industries from 2011 to 2019. The dependent variable is the green growth measured by GTFP and the independent variable is globalization including inward FDI, value-added, and imports. The linear model is specified below:
We assume that the individual effects of 24 Korean manufacturing industries are fixed and that the lag orders are identical. Furthermore, we allow the auto-regressive parameters and regression coefficients to differ in each manufacturing industry. Thus, due to the individual effects and the heterogeneity regression coefficients, the standard causality test statistics can lead to a fallacious inference if we impose the homogeneity regression coefficients. Thus, we propose to test the Homogeneous Non-Causality hypothesis (HNC) by considering both the heterogeneity of the regression model and that of the non-causality relationship. The null hypothesis of HNC is defined as:
In the alternative hypothesis of the HNC, we allow for subgroups of manufacturing industries with no causality relationships and subgroups of manufacturing industries with causality relationships, which is defined as:
Thus, if the null hypothesis is not rejected, then inward FDI, value-added, and imports do not Granger-cause GTFP for all manufacturing industries in Korea. If the HNC is rejected and , this indicates that inward FDI, value-added, and imports Granger-cause GTFP for all manufacturing industries. Conversely, if , the result illustrates that the causality relationship is heterogeneous. The average statistic associated with the HNC null hypothesis is defined as:
where denotes the individual Wald statistics for each manufacturing industry corresponding to the individual test Note that the above descriptions and conclusions about the Dumitrescu–Hurlin tests can mainly show good properties in large N, T samples.
However, for fixed T dimensions with T > 5 + 2K, Dumitrescu and Hurlin [66] based their work on the assumptions that the individual residuals are independently and normally distributed with , and finite heterogeneous variances for each manufacturing industry. Furthermore, are independently distributed across each cross section. Consequently and Following this, they computed approximated standardized statistics , converging in the below distribution:
The panel Granger non-causality test results are reported in Table 5, we find that it significantly rejects the null hypothesis, which indicates that imports, value-added, and inward FDI variables Granger-cause GTFP. The result confirms that there exist Granger causality relationships between imports, value-added, or inward FDI and GTFP at the overall level in the Korean manufacturing industry.
Table 5.
Panel Granger Non-causality Test.
Next, to confirm the robustness of our results, we show two robustness tests, with the first performed by the bootstrap method and the second being a Granger non-causality test developed by Juodis et al. [67] based on the Dumitrescu–Hurlin test. It has advantages in both homogeneous and heterogeneous panels. The results are reported in the Appendix A of Table A1 and Table A2. Both robustness checks prove that the results we obtained are trustworthy.
The results of the causality relationship between imports and GTFP are reported in columns (2) and (3) of Table 6. Imports Granger-causes GTFP significantly in the manufacturing industries of basic metals; furniture; food products; coke, briquettes, and refined petroleum products; and chemicals and chemical products not including pharmaceuticals and medicinal chemicals. The food product and furniture processing industries are more inclined to be export-oriented in Korea. With the expansion of overseas markets, their share in the manufacturing sector has been increasing since 2011 and the export structure is being built around high-value-added products. The high value added will contribute to industrial upgrading and green growth. Basic metals and coke, briquettes, and refined petroleum products as well as chemicals and chemical products not including pharmaceuticals and medicinal chemicals have similar industrial characteristics. These industries require the import of large amounts of raw materials and are technology and capital intensive. Additionally, these are also some of the industries in which Korea is highly competitive internationally, although these industries are primarily associated with large energy consumption and severe carbon emissions in their production processes.
Table 6.
Imports-GTFP and Inward FDI-GTFP Causality Relationships.
The Korean manufacturing industries where inward FDI has a causality relationship with GTFP differ. It is obvious that imports have more numerous significant causality relationships. This is related to Korea’s economic development pattern mentioned above, wherein the lack of natural resources requires importing raw materials from abroad for meeting some industries’ development. When we observe Korea’s imports of raw materials, crude oil, natural gas, petroleum products, and precision chemical materials are consistently in the top 10, mostly matching our results. The results of the causality relationship between inward FDI and GTFP are reported in columns (5) and (6) of Table 6. Inward FDI Granger-causes GTFP significantly in the manufacture industries of motor vehicles, trailers, and semitrailers and coke, briquettes, and refined petroleum products. Investments in the production of future automotive components such as electric vehicle engines and batteries, hydrogen vehicle fuel cells and storage tanks, and autonomous driving sensors are increasing. In addition, the Korean government is sparing no effort to fully support the development of an environmentally friendly future car industry (Invest Korea).
4. Empirical Results
In the regression analysis, as control variables, not only did we consider the value-added rate variables, but R&D expenditures and average wages variables were also considered to control innovation capacity and income level. Since the diagnostic test and Granger non-causality test gave statistically insignificant results, unfortunately, we were unable to introduce them to our study. Moreover, taking into account the residuals’ cross-sectional dependence and slope heterogeneity, we needed to seek the proper econometric methods to obtain unbiased, consistent, and efficient results.
First, to solve the heterogeneity problem in the cross-sections, we used a fixed-effect model allowing for individual-specific slopes. The results are reported in column (1) of Table 7. The result finds a positive association relationship between inward FDI or value-added rate and the green growth of the Korean manufacturing sector. However, compared to inward FDI, the green growth impact of the increase in productivity improvements is more significant. The green growth effect of 24 Korean manufacturing industries brought by inward FDI is weak. In the endogeneity test, we used the Davidson–Mackinnon Test for inward FDI and imports and found that the null hypothesis of no endogeneity could not be rejected.
Table 7.
Empirical Results.
Following this, we also used the augmented mean group (AMG) estimation developed by Eberhardt and Bond [68,69] to check their relationship. The AMG estimator showed cross-section dependence by involving a common dynamic effect in the industry regression [70]. It had the advantage of solving the heterogeneity problem in individual industries, cross-sectional dependence, and slope homogeneity of the data. Likewise, common correlated effects mean group (CCEMG) estimators were also helpful in slope homogeneity and cross-section dependence, initially proposed by Pesaran [64]. The CCEMG estimator was evaluated as the mean of the individual slope coefficient estimates assuming there was slope heterogeneity through cross-sectional units. Finally, as shown in column (4) of Table 7, we conducted a dynamic common-correlated effect model to perform a robustness check, which allowed heterogeneous or homogeneous coefficients and supported instrumental variable regressions and unbalanced panels [71].
In light of the results from columns (2) to (3) of Table 7, the results reveal that only inward FDI significantly promotes GTFP in the Korean manufacturing sector. These results are similar to Solarin and AI-Mulali [24] and Hille et al. [30]. In detail, inward FDI increased by 1 unit and GTFP in the Korean manufacturing industry increased in the range from 0.0005 units to 0.0009 units. The results for the fixed effect model also fell within the interval. That is, the results of multiple econometric methods confirmed that the positive effect of inward FDI on green growth in manufacturing was extremely weak.
As Wang et al. [72] mentioned, Korea is in the later stages of industrialization, and the share of industry in GDP is an essential part of national economic growth. In addition, we find that the manufacturing industries that have attracted a large proportion of FDI flows in Korea are concentrated in chemical products and automobile-related industries, the chemical industry was the largest recipient of investment in the manufacturing sector. These industries all have some common characteristics. That is, they have strong international competitiveness, occupy a significant market share globally, pursue knowledge, capital, or technology-intensive economies of scale, and create high-added value.
In line with its production capacity and competitiveness, Korea’s manufacturing industry is also becoming a global player (invest Korea). Inward FDI will strengthen the domestic competition in Korea’s manufacturing industry, drive similar domestic enterprises to carry out technological innovation, improve carbon emission efficiency, and reduce environmental pollution while maintaining the core competitiveness of the industry [23]. Moreover, the increase in effective investment will also increase the productivity of the industry, thus contributing to the green growth of Korea’s manufacturing industry.
Unfortunately, imports have not been effective in increasing green growth in manufacturing. Korea’s resource scarcity stands in stark contrast to the way the economy is growing. In 2015, Korea became the ninth largest consumer of energy in the world, with the production and consumption of fossil fuels, including oil, natural gas, and coal, accounting for 97% of energy consumption. Furthermore, the Korean industrial sector consumes 60 percent of the imported energy just to manufacture exported goods. Therefore, we speculate that it may be due to this excessive energy intensity and Korea’s import structure that the increase in imports does not effectively contribute to the green growth of Korean manufacturing.
Although the results are not robust, we find that the increase in value added shown in columns (1) and (2) of Table 7 promotes the green growth of Korean manufacturing sectors, and its impact is more significant than that of inward FDI. A prerequisite for high value-added is the availability of corresponding advanced or new technologies. In a sense, high value-added results from technological progress and technological development. Therefore, technological progress in the industry will contribute to the green development of the Korean manufacturing sector. However, this result is not significant in the CCEMG and Dynamic Common Correlated Model.
5. Conclusions
Regarding the relationship between globalization and green growth, most studies have focused on developing countries, especially China. Due to the complex and diverse industry background, there may be some deficiency in policy recommendations elicited from the macro-level. Furthermore, there is still scarce research on the relationship between globalization and green growth in terms of the industry level of the Korean manufacturing sector. Meanwhile, Korea’s unique development model, which has achieved dramatic economic growth despite its lack of fossil energy and has become the only developing country that has advanced to the status of a developed country, has important template implications for other developing countries. Thus, we used panel data composed of 24 Korean manufacturing industries from 2011 to 2019 and applied the heterogeneous panel based on the non-causality test to examine these. The results are summarized as follows.
First, we used GLMPI to measure the green growth of 24 manufacturing industries in Korea. We found that the mean value was 1 with a standard deviation of 0.01, which is slightly greater than 0. This means that on average, the 24 manufacturing industries in Korea were in a green growth situation between 2011 and 2019.
Next, for the four variables measuring globalization, we conducted preliminary tests and found that outward FDI and exports accepted the null hypothesis in the panel CIPS unit root test, which means that there was a unit root for these two variables. The prerequisites of the Granger non-causality test were that the test required stationary variables and had requirements for time dimensions. That is, inward FDI or imports Granger-caused green growth at the overall level in the Korean manufacturing sector. However, for 24 different Korean manufacturing industries, the industries in which imports and inward FDI had a causal relationship were different. Imports Granger-caused GTFP significantly in the manufacturing industries of basic metals; furniture; food products; coke, briquettes, and refined petroleum products; and chemicals and chemical products not including pharmaceuticals and medicinal chemicals. Inward FDI Granger-caused GTFP significantly in the manufacture industries of motor vehicles, trailers, and semitrailers as well as coke, briquettes, and refined petroleum products.
Finally, to further examine the relationship between inward FDI or imports and GTFP, some regression analyses were applied, which consisted of econometric methods that should have allowed for the heterogeneous slope and cross-sectional dependence, such as AMG and CCEMG estimators. The results reveal that only inward FDI significantly increased the GTFP of the Korean manufacturing sector, but its positive impact was feeble due to the concentration of inward FDI in the technology, knowledge, or capital-intensive products of the Korean manufacturing industry. Inward FDI not only brings large-scale capital inflows to promote production efficiency, but inward FDI also strengthens domestic competition in Korea’s manufacturing industry and drives similar domestic enterprises to carry out technological innovation, improve carbon emission efficiency, and reduce environmental pollution while maintaining core competitiveness [23]. Unfortunately, imports have no significant impact on GTFP, which is inseparable from Korea’s import structure.
Corresponding to our empirical results, we put forward the following policy recommendations. Korea, as a manufacturing powerhouse, has strong international competitiveness and inward FDI attractiveness in both highly capital- and technology-intensive manufacturing industries. This illustrates that the upgrading and transformation of the manufacturing industry from low value-added industries to high value-added industries has been successful. Indeed, the government’s efforts to capture leading markets are also highly instructive for other developing countries. Thus, for other developing countries, the first task is to develop and guide the formation of internationally competitive industries, improve the added value of manufacturing products, and realize the transformation and upgrading of manufacturing industries.
Second, it is imperative to decarbonize energy-intensive industries and to work on renewable energy development and diffusion. For example, equipping buildings with solar panels and environmentally friendly insulation; finding suitable sites for offshore wind farms; providing loans to farm and factory owners to install renewable energy facilities; and increasing public awareness of energy-saving methods, and so on.
Third, from the government’s perspective, it is essential to introduce various green monitoring mechanisms to reduce carbon emissions. In addition, the government needs to strengthen its support for research and development of innovative technologies to reduce carbon emissions, as well as to promote the development of environmental and energy-saving related professional service enterprises.
Lastly, regarding the limitations of our study, we propose the following points. First, there are some limitations in the choice of proxy variables for the capital stock, which may have a misleading impact on our results. Secondly, due to the limitation of the time dimension of the collected data, we are greatly limited in our analysis. Our dataset permits us to have confidence regarding our results only during the period studied, but it cannot promote confidence in our conclusions for a long time. Finally, too few control variables were used in the analysis, which is partly due to the restriction of the data. Therefore, if more data can be drawn in future research, findings will be more meaningful.
Author Contributions
Conceptualization, B.C.; data curation, M.W.; methodology, M.W.; writing—original draft, M.W.; writing—review & editing, X.D. All authors have read and agreed to the published version of the manuscript.
Funding
This research received no external funding.
Institutional Review Board Statement
Not applicable.
Informed Consent Statement
Not applicable.
Data Availability Statement
The data presented in this study are available from the authors upon request.
Acknowledgments
The authors would like to thank the Editors and the three anonymous reviewers for the useful and constructive comments.
Conflicts of Interest
The authors declare no conflict of interest.
Appendix A
Robustness Check
Table A1.
Panel Granger non-causality test (Bootstrap replication: 1000).
Table A1.
Panel Granger non-causality test (Bootstrap replication: 1000).
| Dumitrescu–Hurlin Granger Non-Causality Test | Wbar-Stat | Zbar-Stat | Zbar Tilde-Stat |
|---|---|---|---|
| : IFDI does not Granger-cause GTFP. | 4.47 | 12.01 (p = 0.01) | 2.91 (p = 0.01) |
| : Imports do not Granger-cause GTFP. | 4.16 | 10.96 (p = 0.04) | 2.59 (p = 0.04) |
| : Value-added does not Granger-cause GTFP. | 4.24 | 11.24 (p = 0.04) | 2.68 (p = 0.04) |
Table A2.
Juodis, Karavias and Sarafidis (2021) [67] Granger non-causality test results.
Table A2.
Juodis, Karavias and Sarafidis (2021) [67] Granger non-causality test results.
| HPJ Wald Test | HPJ Wald Test | p Value_HPJ |
|---|---|---|
| : IFDI does not Granger-cause GTFP. | 2.83 | p = 0.09 |
| : Imports do not Granger-cause GTFP. | 71.75 | p ≤ 0.01 |
| : Value-added does not Granger-cause GTFP. | 79.30 | p ≤ 0.01 |
References
- Nordhaus, W. Climate change: The ultimate challenge for economics. Am. Econ. Rev. 2019, 109, 1991–2014. [Google Scholar] [CrossRef]
- Ersin, Ö.Ö. The Nonlinear Relationship of Environmental Degradation and Income for the 1870–2011 Period in Selected Developed Countries: The Dynamic Panel-STAR Approach. Procedia Econ. Financ. 2016, 38, 318–339. [Google Scholar] [CrossRef]
- Cui, L.; Mu, Y.; Shen, Z.; Wang, W. Energy transition, trade and green productivity in advanced economies. J. Clean. Prod. 2022, 361, 132288. [Google Scholar] [CrossRef]
- Wenz, L.; Globalization Has Made Our Economies More Vulnerable to Climate Change. 19 July 2016. Available online: https://www.weforum.org/agenda/2016/07/the-earth-really-is-getting-hotter-and-we-re-poorer-for-it/ (accessed on 30 December 2021).
- Lee, Y. Long-Term Shifts in Korean Manufacturing and Plant-Level Productivity Dynamics; Policy Research Working Paper; No. 9279; World Bank: Washington, DC, USA, 2020. [Google Scholar]
- Wang, X.; Shao, Q. Non-linear effects of heterogeneous environmental regulations on green growth in G20 countries: Evidence from panel threshold regression. Sci. Total Environ. 2019, 660, 1346–1354. [Google Scholar] [CrossRef] [PubMed]
- Kardos, M. The relevance of Foreign Direct Investment for sustainable development. Empirical evidence from European Union. Procedia Econ. Financ. 2014, 15, 1349–1354. [Google Scholar] [CrossRef]
- Debbarma, J.; Choi, Y.; Yang, F.; Lee, H. Exports as a new paradigm to connect business and information technology for sustainable development. J. Innov. Knowl. 2022, 7, 100233. [Google Scholar] [CrossRef]
- Ding, L.; Wu, M.; Jiao, Z.; Nie, Y. The positive role of trade openness in industrial green total factor productivity—Provincial evidence from China. Environ. Sci. Pollut. Res. 2022, 29, 6538–6551. [Google Scholar] [CrossRef]
- Li, K.-Y.; Gong, W.-C.; Choi, B.-R. The Influence of Trade and Foreign Direct Investment on Green Total Factor Productivity: Evidence from China and Korea. J. Korea Trade (JKT) 2021, 25, 95–110. [Google Scholar] [CrossRef]
- Li, Y.; Wu, Y.; Chen, Y.; Huang, Q. The influence of foreign direct investment and trade opening on green total factor productivity in the equipment manufacturing industry. Appl. Econ. 2021, 53, 6641–6654. [Google Scholar] [CrossRef]
- Pan, X.; Li, M.; Wang, M.; Chu, J.; Bo, H. The effects of outward foreign direct investment and reverse technology spillover on China’s carbon productivity. Energy Policy 2020, 145, 111730. [Google Scholar] [CrossRef]
- Zhou, Y.; Jiang, J.; Ye, B.; Hou, B. Green spillovers of outward foreign direct investment on home countries: Evidence from China’s province-level data. J. Clean. Prod. 2019, 215, 829–844. [Google Scholar] [CrossRef]
- Xu, S.; Li, Z. The impact of Innovation Activities, Foreign Direct Investment on Improved Green Productivity: Evidence from Developing Countries. Front. Environ. Sci. 2021, 9, 8. [Google Scholar] [CrossRef]
- Yao, X.; Tang, X. Does financial structure affect CO2 emissions? Evidence from G20 countries. Financ. Res. Lett. 2021, 41, 101791. [Google Scholar] [CrossRef]
- Hu, J.; Wang, Z.; Lian, Y.; Huang, Q. Environmental regulation, foreign direct investment and green technological progress—Evidence from Chinese manufacturing industries. Int. J. Environ. Res. Public Health 2018, 15, 221. [Google Scholar] [CrossRef] [PubMed]
- Song, Y.; Hao, F.; Hao, X.; Gozgor, G. Economic policy uncertainty, outward foreign direct investments, and green total factor productivity: Evidence from firm-level data in China. Sustainability 2021, 13, 2339. [Google Scholar] [CrossRef]
- Zhao, M.; Liu, F.; Sun, W.; Tao, X. The relationship between environmental regulation and green total factor productivity in China: An empirical study based on the panel data of 177 cities. Int. J. Environ. Res. Public Health 2020, 17, 5287. [Google Scholar] [CrossRef] [PubMed]
- Wang, M.; Zhang, X.; Hu, Y. The green spillover effect of the inward foreign direct investment: Market versus innovation. J. Clean. Prod. 2021, 129501. [Google Scholar] [CrossRef]
- De Vita, G.; Li, C.; Luo, Y. The inward FDI-Energy intensity nexus in OECD countries: A sectoral R & D threshold analysis. J. Environ. Manag. 2021, 287, 112290. [Google Scholar]
- Dai, L.; Mu, X.; Lee, C.-C.; Liu, W. The impact of outward foreign direct investment on green innovation: The threshold effect of environmental regulation. Environ. Sci. Pollut. Res. 2021, 28, 34868–34884. [Google Scholar] [CrossRef]
- Zafar, M.; Kousar, S.; Sabir, S.A. Impact of globalization on green growth: A case of OECD Countries. J. Indian Stud. 2019, 5, 231–244. [Google Scholar]
- Wang, Q.; Zhang, Q. Foreign Direct Investment and Carbon Emission Efficiency: The Role of Direct and Indirect Channels. Sustainability 2022, 14, 13484. [Google Scholar] [CrossRef]
- Solarin, S.A.; Al-Mulali, U. Influence of foreign direct investment on indicators of environmental degradation. Environ. Sci. Pollut. Res. 2018, 25, 24845–24859. [Google Scholar] [CrossRef] [PubMed]
- Paramati, S.R.; Mo, D.; Huang, R. The role of financial deepening and green technology on carbon emissions: Evidence from major OECD economies. Financ. Res. Lett. 2021, 41, 101794. [Google Scholar] [CrossRef]
- Hassaballa, H. Testing for Granger causality between energy use and foreign direct investment Inflows in developing countries. Renew. Sustain. Energy Rev. 2014, 31, 417–426. [Google Scholar] [CrossRef]
- Zafar, M.W.; Zaidi, S.A.H.; Khan, N.R.; Mirza, F.M.; Hou, F.; Kirmani, S.A.A. The impact of natural resources, human capital, and foreign direct investment on the ecological footprint: The case of the United States. Resour. Policy 2019, 63, 101428. [Google Scholar] [CrossRef]
- Zhu, H.; Duan, L.; Guo, Y.; Yu, K. The effects of FDI, economic growth and energy consumption on carbon emissions in ASEAN-5: Evidence from panel quantile regression. Econ. Model. 2016, 58, 237–248. [Google Scholar] [CrossRef]
- Khan, Y.; Hassan, T.; Kirikkaleli, D.; Xiuqin, Z.; Shukai, C. The impact of economic policy uncertainty on carbon emissions: Evaluating the role of foreign capital investment and renewable energy in East Asian economies. Environ. Sci. Pollut. Res. 2022, 29, 18527–18545. [Google Scholar] [CrossRef] [PubMed]
- Hille, E.; Shahbaz, M.; Moosa, I. The impact of FDI on regional air pollution in the Republic of Korea: A way ahead to achieve the green growth strategy? Energy Econ. 2019, 81, 308–326. [Google Scholar] [CrossRef]
- Kim, S. The effects of foreign direct investment, economic growth, industrial structure, renewable and nuclear energy, and urbanization on Korean greenhouse gas emissions. Sustainability 2020, 12, 1625. [Google Scholar] [CrossRef]
- Adebayo, T.S.; Awosusi, A.A.; Kirikkaleli, D.; Akinsola, G.D.; Mwamba, M.N. Can CO2 emissions and energy consumption determine the economic performance of South Korea? A time series analysis. Environ. Sci. Pollut. Res. 2021, 28, 38969–38984. [Google Scholar] [CrossRef]
- Lee, J.W. The contribution of foreign direct investment to clean energy use, carbon emissions and economic growth. Energy Policy 2013, 55, 483–489. [Google Scholar] [CrossRef]
- Ghorbal, S.; Soltani, L.; Ben Youssef, S. Patents, fossil fuels, foreign direct investment, and carbon dioxide emissions in South Korea. Environ. Dev. Sustain. 2022. [Google Scholar] [CrossRef]
- Kim, S.-E.; Seok, J.H. The impact of foreign direct investment on CO2 emissions considering economic development: Evidence from South Korea. J. Int. Trade Econ. Dev. 2022, 1–16. [Google Scholar] [CrossRef]
- Hao, Y.; Guo, Y.; Guo, Y.; Wu, H.; Ren, S. Does outward foreign direct investment (OFDI) affect the home country’s environmental quality? The case of China. Struct. Chang. Econ. Dyn. 2020, 52, 109–119. [Google Scholar] [CrossRef]
- Wang, Y.; Liao, M.; Wang, Y.; Malik, A.; Xu, L. Carbon emission effects of the coordinated development of two-way foreign directinvestment in China. Sustainability 2019, 11, 2428. [Google Scholar] [CrossRef]
- Mohanty, S.; Sethi, N. The energy consumption-environmental quality nexus in BRICS countries: The role of outward foreign direct investment. Environ. Sci. Pollut. Res. 2022, 29, 19714–19730. [Google Scholar] [CrossRef] [PubMed]
- Copeland, B.R.; Taylor, M.S. Trade, growth, and the environment. J. Econ. Lit. 2004, 42, 7–71. [Google Scholar] [CrossRef] [PubMed]
- Cherniwchan, J.; Copeland, B.R.; Taylor, M.S. Trade and the environment: New methods, measurements, and results. Annu. Rev. Econ. 2017, 9, 59–85. [Google Scholar] [CrossRef]
- Jun, W.; Mahmood, H.; Zakaria, M. Impact of trade openness on environment in China. J. Bus. Econ. Manag. 2020, 21, 1185–1202. [Google Scholar] [CrossRef]
- Topcu, M.; Payne, J.E. Further evidence on the trade-energy consumption nexus in OECD countries. Energy Policy 2018, 117, 160–165. [Google Scholar] [CrossRef]
- Ustabaş, A.; Ersin, Ö. The Effects of R & D and High Technology Exports on Economic Growth: A Comparative Cointegration Analysis for Turkey and South Korea. In Proceedings of the International Conference on Eurasian Economies 2016, Kaposvar, Hungary, 29–31 August 2016; pp. 44–55. [Google Scholar]
- Bildirici, M.; Ersin, Ö. An Investigation of the Relationship between the Biomass Energy Consumption, Economic Growth and Oil Prices. Procedia-Soc. Behav. Sci. 2015, 210, 203–212. [Google Scholar] [CrossRef]
- Bildirici, M.; Ersin, Ö.Ö. Nexus between Industry 4.0 and environmental sustainability: A Fourier panel bootstrap cointegration and causality analysis. J. Clean. Prod. 2023, 386, 135786. [Google Scholar] [CrossRef]
- Le, C. Research on the Environmental Effects and Green Development Path of South Korean Foreign Trade. J. Korea Trade 2020, 24, 93–106. [Google Scholar] [CrossRef]
- Krugman, P. Defining and measuring productivity. The Age of Diminishing Expectations; MIT Press: Cambridge, MA, USA, 1994. [Google Scholar]
- Xia, F.; Xu, J. Green total factor productivity: A re-examination of quality of growth for provinces in China. China Econ. Rev. 2020, 62, 101454. [Google Scholar] [CrossRef]
- Ji, Y.-B.; Lee, C. Data envelopment analysis. Stata J. 2010, 10, 267–280. [Google Scholar] [CrossRef]
- Chambers, R.G.; Fāure, R.; Grosskopf, S. Productivity growth in APEC countries. Pac. Econ. Rev. 1996, 1, 181–190. [Google Scholar] [CrossRef]
- Chung, Y.H.; Färe, R.; Grosskopf, S. Productivity and Undesirable Outputs: A Directional Distance Function Approach. J. Environ. Manag. 1997, 51, 229–240. [Google Scholar] [CrossRef]
- Chen, C.; Lan, Q.; Gao, M.; Sun, Y. Green total factor productivity growth and its determinants in China’s industrial economy. Sustainability 2018, 10, 1052. [Google Scholar] [CrossRef]
- Emrouznejad, A.; Yang, G.-L. A framework for measuring global Malmquist–Luenberger productivity index with CO2 emissions on Chinese manufacturing industries. Energy 2016, 115, 840–856. [Google Scholar] [CrossRef]
- Oh, D.-H. A global Malmquist-Luenberger productivity index. J. Product. Anal. 2010, 34, 183–197. [Google Scholar] [CrossRef]
- Pastor, J.T.; Lovell, C.K. A global Malmquist productivity index. Econ. Lett. 2005, 88, 266–271. [Google Scholar] [CrossRef]
- Lee, S.; Noh, D.W.; Oh, D.H. Characterizing the Difference between Indirect and Direct CO2 Emissions: Evidence from Korean Manufacturing Industries, 2004–2010. Sustainability 2018, 10, 2711. [Google Scholar] [CrossRef]
- Bellégo, C.; Benatia, D.; Pape, L. Dealing with Logs and Zeros in Regression Models. ERN: Other Econometrics: Econometric & Statistical Methods (Topic). arXiv 2022, arXiv:2203.11820. [Google Scholar]
- Pesaran, M.H.; Yamagata, T. Testing slope homogeneity in large panels. J. Econom. 2008, 142, 50–93. [Google Scholar] [CrossRef]
- Bersvendsen, T.; Ditzen, J. xthst: Testing for Slope Homogeneity in Stata; Centre for Energy Economics Research and Policy Working Paper; Heriot-Watt University: Edinburgh, Scotland, 2020. [Google Scholar]
- Blomquist, J.; Westerlund, J. Testing slope homogeneity in large panels with serial correlation. Econ. Lett. 2013, 121, 374–378. [Google Scholar] [CrossRef]
- De Hoyos, R.E.; Sarafidis, V. Testing for Cross-Sectional Dependence in Panel-Data Models. Stata J. 2006, 6, 482–496. [Google Scholar] [CrossRef]
- Pesaran, M.H.; Ullah, A.; Yamagata, T. A bias-adjusted LM test of error cross-section independence. Econom. J. 2008, 11, 105–127. [Google Scholar] [CrossRef]
- Baltagi, B.H.; Feng, Q.; Kao, C. A Lagrange Multiplier test for cross-sectional dependence in a fixed effects panel data model. J. Econom. 2012, 170, 164–177. [Google Scholar] [CrossRef]
- Pesaran, M.H. A simple panel unit root test in the presence of cross-section dependence. J. Appl. Econom. 2007, 22, 265–312. [Google Scholar] [CrossRef]
- Aluko, O.A.; Ibrahim, M.; Atagbuzia, M.O. On the causal nexus between FDI and globalization: Evidence from Africa. J. Int. Trade Econ. Dev. 2021, 30, 203–223. [Google Scholar] [CrossRef]
- Dumitrescu, E.-I.; Hurlin, C. Testing for Granger non-causality in heterogeneous panels. Econ. Model. 2012, 29, 1450–1460. [Google Scholar] [CrossRef]
- Juodis, A.; Karavias, Y.; Sarafidis, V. A homogeneous approach to testing for Granger non-causality in heterogeneous panels. Empir. Econ. 2021, 60, 93–112. [Google Scholar] [CrossRef]
- Eberhardt, M.; Bond, S. Cross-Section Dependence in Nonstationary Panel Models: A Novel Estimator; MPRA Paper No. 17870; MPRA: Munich, Germany, 2009. [Google Scholar]
- Bond, S.; Eberhardt, M. Accounting for Unobserved Heterogeneity in Panel Time Series Models; University of Oxford: Oxford, UK, 2013; pp. 1–11. [Google Scholar]
- Xia, W.; Doğan, B.; Shahzad, U.; Adedoyin, F.F.; Popoola, A.; Bashir, M.A. An empirical investigation of tourism-led growth hypothesis in the European countries: Evidence from augmented mean group estimator. Port. Econ. J. 2022, 21, 239–266. [Google Scholar] [CrossRef]
- Ditzen, J. Estimating Dynamic Common-Correlated Effects in Stata. Stata J. 2018, 18, 585–617. [Google Scholar] [CrossRef]
- Wang, M.; Pang, S.; Hmani, I.; Hmani, I.; Li, C.; He, Z. Towards sustainable development: How does technological innovation drive the increase in green total factor productivity? Sustain. Dev. 2021, 29, 217–227. [Google Scholar] [CrossRef]

Disclaimer/Publisher’s Note: The statements, opinions and data contained in all publications are solely those of the individual author(s) and contributor(s) and not of MDPI and/or the editor(s). MDPI and/or the editor(s) disclaim responsibility for any injury to people or property resulting from any ideas, methods, instructions or products referred to in the content. |
© 2023 by the authors. Licensee MDPI, Basel, Switzerland. This article is an open access article distributed under the terms and conditions of the Creative Commons Attribution (CC BY) license (https://creativecommons.org/licenses/by/4.0/).