Article

Projections of Beach Erosion and Associated Costs in Chile

by
Patricio Winckler
1,2,3,*,
Roberto Agredano Martín
4,
César Esparza
5,
Oscar Melo
6,7,
María Isabel Sactic
7 and
Carolina Martínez
8,9
1
Escuela de Ingeniería Civil Oceánica, Universidad de Valparaíso (UV), Valparaíso 2362844, Chile
2
National Research Center for Integrated Natural Disaster Management (CIGIDEN), Santiago 7820436, Chile
3
Centro de Observación Marino para Estudios de Riesgos del Ambiente Costero (COSTAR), Valparaíso 2362844, Chile
4
PRDW Consulting Port and Coastal Engineers, Santiago 7560830, Chile
5
Departamento de Ingeniería Hidráulica y Ambiental, Pontificia Universidad Católica de Chile, Santiago 7820436, Chile
6
Department of Agricultural Economics, Pontificia Universidad Católica de Chile, Santiago 7820436, Chile
7
Centro de Cambio Global, Pontificia Universidad Católica de Chile, Santiago 7820436, Chile
8
Institute of Geography, Faculty of History, Geography and Political Science, Pontificia Universidad Católica de Chile, Santiago 7820436, Chile
9
Instituto Milenio en Socio-ecología Costera (SECOS), Santiago 8331150, Chile
*
Author to whom correspondence should be addressed.
Sustainability 2023, 15(7), 5883; https://doi.org/10.3390/su15075883
Submission received: 6 February 2023 / Revised: 7 March 2023 / Accepted: 22 March 2023 / Published: 28 March 2023
(This article belongs to the Section Hazards and Sustainability)

Abstract

:
Economic costs associated to coastal erosion are projected in 45 sandy beaches in Chilean coasts. We compare mid-century (2026–2045) and end-of-century projections (2081–2100) of wave climate and sea-level rise (SLR) with a historical period (1985–2004) using several General Circulation Models for the RCP 8.5 scenario. Offshore wave data are then downscaled to each site, where shoreline retreat is assessed with Bruun rule for various berm heights and sediment diameters. Results indicate that mid-century retreat would be moderate (>13 m) while larger end-of-century projections (>53 m) are explained by SLR (0.58 ± 0.25 m). A small counterclockwise rotation of long beaches is also expected. To assess the costs of shoreline retreat, we use the benefit transfer methodology by using adjusted values from a previous study to the sites of interest. Results show that, by mid-century, beach width reduction would be between 2.0% and 68.2%, implying a total annual loss of USD 5.6 [5.1–6.1] million. For end-the-century projections, beach width reduction is more significant (8.4–100%), involving a total annual loss of USD 10.5 [8.1–11.8] million. Additionally, by the end-of-century, 13–25 beaches could disappear. These costs should be reduced with coastal management practices which are nevertheless inexistent in the country.

1. Introduction

In recent years, coastal erosion has been aggravated worldwide due to climate variability, climate change, and anthropogenic factors [1,2,3], generating uncertainty in local and regional economies dependent on sun and beach tourism. Sandy beaches are essential social-ecological elements and therefore reflect the health of the coastal system. Therefore, their loss and/or width reduction could discourage tourists from returning for vacation [4]. Bird [5] pointed out that different climatic factors were responsible for approximately 70% of the beaches receding between 1976 and 1984. Furthermore, a recent study predicted that 67% of beaches could ultimately erode by 2100 in southern California [6]. Luijendijk et al. [7] also established that 24% of the world’s sandy beaches are eroding at rates greater than 0.5 m/y. The possibility of mid-century extinction of half of the world’s sandy beaches [8] has motivated interdisciplinary research aimed at understanding the complex causes of erosion at local and regional scales [9].
While SLR has been a primary concern in several studies [8,9,10], urbanization has often triggered coastal erosion in areas of high tourist demand [11]. Since beach tourism involves many industries, it has become a focal point in coastal areas [12] and a major concern of scientific and non-governmental organizations. Still, many places in the world suffer from coastal erosion due to an inadequate management, or where management is non-existent.
Silvestri [13] characterized beach tourism as a market in which the demand corresponds to a supply given by the availability of the shoreline area, using the carrying capacity as an indicator. This concept was defined as the number and type of visitors that can be accommodated on the beach without unacceptable social consequences or negative environmental impacts [14,15]. However, the proliferation of indicators to assess the quality of a beach reflects the need to measure the different dimensions of what is considered suitable for a particular type of tourism. Such dimensions include litter presence, water quality, leisure infrastructure, accessibility, distance to urban centers, coexistence of uses, safety, aesthetics of the beach, and the local environment [16,17,18,19,20,21,22].
A recent study [23] found that sites with erosion were associated with a lower density in accommodation and lower daily rates on Brazilian beaches. Thus, a direct relationship was found between the income of the local tourism sector and beaches experiencing erosion [23]. Conversely, Spencer et al. [24] found that, under a high emissions scenario (RCP 8.5), SLR would lead to 39% and 47% reductions in hotel rooms and direct tourism revenues in Caribbean islands, respectively. In another study, Ruiz-Ramirez et al. [25] estimated a loss of USD 330 million for coastal resort towns in the Mexican Caribbean, considering a 1 m SLR. Along with the impacts on the increasingly expanding coastal tourism [26], erosion alters other ecosystem services associated with the interactions with the immediate landscape, such as wetlands and dune fields. Thus, the impact on the beach is only part of a more significant problem. Furthermore, the intense development of mass tourism, involving the construction of infrastructure and buildings, causes erosion and deterioration of the quality of a beach, affecting the tourism industry [27,28].
In the last decades, coastal storms have triggered unprecedented erosion rates [29] and structural damage in several cities along the Chilean coastline [30]. The effects of these events have sometimes been aggravated by earthquakes, which in turn trigger tsunamis and changes in land elevation. The combination of these geophysical, climate, and anthropogenic driven hazards has placed Chilean sandy shorelines on a vulnerable condition. This study aims to project coastal erosion on 45 Chilean beaches according to IPCC’s RCP 8.5 climate change scenario, and to evaluate the associated economic losses. These beaches constitute a representative sample of the nearly 1172 beaches in Chile [31]. Such new knowledge is expected to guide the decision-making process to promote the sustainability of affected sandy coastlines.

2. Study Sites

The study analyzes 45 sandy beaches covering nearly 1960 km (20.23° S–37.88° S) along the Chilean coast (Figure 1). During the last four decades, 80% of these sites have eroded, 7% accreted, and 13% remained stable [29] (p. 6). Except for Anakena in Easter Island, these sites are located on an eminently rocky coast with alternating projections, inlets, beaches, and dune systems [32]. Links to maps of each site are provided in the Supplementary Materials while some of their attributes are listed in Table 1.
The morphology of the continental sites is defined by a tectonically active margin, where subduction earthquakes often occur. Indeed, in recent years, three large subduction earthquakes with magnitudes greater than 8.0 and the succeeding tsunamis (2010, 2014, and 2015) have caused severe morphological changes in the region. For example, beaches in Tubul and Llico (#41,42 in Table 1) experienced a severe accretion following a coseismic uplift during the 2010 Maule Earthquake while several others were eroded because of coastal subsidence [29]. Coseismic changes in the study sites, however, are highly variable in space, as discussed in Martínez et al.’s [29] Table A3.
The climate in the region is controlled by the South Pacific subtropical anticyclone and the circumpolar band of low-pressure migratory systems sometimes associated with frontal systems. The climate in the northern portion of the study region (18° S–30° S) is desertic and shifts towards a Mediterranean climate in the central and south regions (30° S–38° S). Wave climate is characterized by swells forming from extratropical cyclones between 40° S and 60° S. Offshore waves are mild in the north, with a mean annual significant wave height of Hs = 2.0 and mean periods of Tm = 9.2 s in the northernmost site analyzed, slightly increasing in energy towards the south, where the height increases to Hs = 2.4 m and the period is reduced to Tm = 9.0 s [33] (p. 25). During coastal storms, wave heights have reached values of up to Hs = 4.7 m and Hs = 8.6 m in the northern and southernmost extremes of the study region [33] (pp. 41,77), respectively, while periods are usually below Tm = 16 s. In recent decades, there has been an increase in the frequency of extreme events in the region [34]. Tides are mixed semi-diurnal, with ranges of ~1.6 m on the continental coast and of ~0.8 m on Easter Island [35], while storm surges and meteotsunamis are relatively minor in the region, with amplitudes below 1 m [36].
In terms of demography, the study area is characterized by the sparsely inhabited Atacama Desert and large metropolitan areas in Central and South Chile. Population and economic activities are concentrated in three main coastal conurbations, namely Concepción, Valparaíso, and La Serena-Coquimbo, where several of the analyzed beaches are located. From the 45 beaches under scrutiny, 20 (44%) are urban, 10 (22%) are periurban, 6 (13%) are rural, and 9 (20%) combine rural, periurban, or rural features (Table 1). Additionally, Quintero and San Vicente are situated in heavily industrialized bays. Several of the urban sites analyzed herein have experienced an increment in tourism following the implementation of new infrastructure, which has nevertheless caused their deterioration as planning has been focused on economic development rather than environmental protection [37]. However, well-documented studies analyzing this phenomenon on a local level are scarce and found, for example, in Coquimbo Region [28,37].

3. Methodology

The methodology consists of mid-century (2026–2045) and end-of century (2081–2100) projections of wave climate and SLR which, combined with morphological and sediment characteristics on each beach, provide information to project shoreline retreat with respect to a historical period (1985–2004) and the associated costs of erosion.

3.1. Projections of Wave Climate

Wave climate was characterized using a Pacific-wide model in WAVEWATCH III [38], forced with 3-hourly wind data and daily ice coverage from six General Circulation Models (GCMs) from CMIP5 [39]. The computation was conducted for the historical period, mid-century, and end-of-century projections. Four GCMs (ACCESS 1.0, HadGEM2-ES, MIROC5, MRI-CGM3) were selected based on the model performance for the southeast Pacific Ocean region [40], while two others (EC-EARTH, CMCC) were used due to their high resolution. These data are available in [41].
The numerical domain covered between 135°E–65°W and 75° S–60° N, with a resolution of 1°. Bathymetric data were obtained from ETOPO2v2 [42] on a 2 × 2 min grid, and the coastline built from the GHHSGVIII database [43]. Wave spectra were resolved with 32 frequencies, a directional resolution of 15°, the ST4 parametrization to model wave growth and dissipation [44,45] and the Discrete Interaction Approximation [46] to model the nonlinear energy transfer. These parameterizations adequately characterize multimodal wave conditions off Chile’s coasts [47]. Time series of wave spectra and statistical parameters ( H s , T m , θ m ) were then computed every 3 h, from which, temporal medians for 20 years of statistical parameters were computed for each GCM and then assembled. Figure S1 summarized this process, proposed by Winckler et al. [48].
Transformation of wave climate from deep waters to each beach was accomplished by means of two methods, depending on the availability of high-resolution bathymetric charts. In sites where these charts were available (Hornitos, Reñaca, Las Salinas, Los Marineros, Caleta Portales, Torpederas, and Bahía de Lebu), the spectral wave model SWAN [49] was used to compute wave climate at 20 m depth. Offshore wave spectra were transformed for each combination of frequency and direction [50], considering the processes waves experience on irregular bottoms (shoaling, refraction, diffraction, and breaking). For each GCM, the time series of statistical parameters ( H s , T m , θ m ) were inferred for the historical period and the projections. Next, empirical Gumbel quantile mapping EGQM bias correction method [51] was applied to exceedance probability curves of H s to compute the significant wave height exceeding 12 h a year H s 12 , a parameter used to compute beach erosion. This correction used the wind reanalysis CFSR [52] as a benchmark for the historical period.
Where high-resolution bathymetric charts were unavailable, propagations were conducted using small amplitude wave theory and Snell’s Law [53]. In these sites, only shoaling and refraction were considered.

3.2. Projections Sea-Level Rise

The projection of SLR at the 45 beaches under scrutiny was computed from the ensemble mean of 21 GCMs corresponding to the RCP 8.5 scenario in the entire Pacific basin, already presented in IPCC’s AR5 [54]. A 1° × 1° resolution dataset was available between 2007 and 2100 relative to the baseline period 1986–2005 in Hamburg University’s Integrated Climate Data Center.
We used raw data corresponding to the mid-century and end-of-century projections and interpolated new data on each beach. These projections include several effects, namely, global thermal expansion and atmospheric loading, ice sheet mass changes from surface mass balance and from ice dynamics, glacier mass changes, changes in land water from ground water extraction and reservoir impoundment, and glacial isostatic adjustment due to the response of the solid Earth, the gravitational field, and oceans to the changes in the global ice sheets. Detailed calculation methods of each of these components can be consulted in [55].

3.3. Projections of Shoreline Change

The projections of shoreline change were conducted for 44 beaches in continental Chile, and in Anakena, Easter Island. Table 1 details the selected beaches and attributes such as the latitude, longitude, type (urban, periurban, rural, and industrial), shape (embayed, rectilinear), length, width, area, and orientation. Embayed beach refers to those enclosed between headlands (natural or artificial) [56], otherwise they are considered rectilinear.
Shoreline changes were estimated for mid-century and end-of-century with respect to the historical period projections using Bruun rule [57]. This rule states that beaches would translate upward and landward, maintaining their shore-normal geometry when subjected to a SLR. The shoreline retreat R is expressed as:
R = L S / B + h * ,
where L is the width of the active profile, S the sea level rise, B the berm height, and h * the depth of closure [58], computed as:
h * = 1.75 H s 12 57.9 H s 12 2 / g T s 2 ,
where H s 12 is the significant wave height that is exceeded twelve hours per year and T s is the peak period associated with H s 12 . The width of the active profile was computed using Dean’s profile as L = ( h * / A ) 3 / 2 , where the scale parameter of the equilibrium profile, in m−1/3, was computed as A = K w 0.44 , with K = 0.51, and the fall velocity of grain particles, in m/s, was computed as w = 273 D 1.1 for grain diameter between 0.1 < D < 1 mm [59]. For a few beaches, sediment sizes and berm heights were measured (Table 1) while for those beaches with no information, shoreline retreat was calculated for three typical sediment sizes ( D 50 = 0.15, 0.3 and 0.8 mm) and four berm heights ( B = 1, 2, 3, 4 m).

3.4. Projections of Economic Losses Due to Beach Erosion

Beaches, like other ecosystems, provide services valuable to society. One of these ecosystem services is the provision of recreational space [60,61]. Due to beach erosion, changes in the quantity or quality of these services will affect the value they generate. Earlier studies have used environmental economics valuation methods to measure this value change. In the case of beach erosion, the economic analysis has focused on techniques that use the value of properties near beaches, the travel costs of visitors, and contingent questions to users [62,63,64,65,66]. In the present study, we applied the benefit transfer methodology that uses adjusted values from a previous study to the sites of interest [67]. In this case, we explored the literature for studies that estimate a per-trip willingness to pay (WTP) for changes in beach width. Such an approach was undertaken because the information available on beach users was based on the number of trips, and the hazard analysis presented herein was expressed in terms of changes in beach reduction. The percentage of beach reduction R was calculated as the ratio between the average beach reduction ( R ) and the average of the historical minimum and maximum beach width ( W ) included in Table 1.
R = R / W ,
where R was computed as the projected minimum beach width reduction (associated to D 50 = 0.8 mm and B = 4 m) and maximum beach width reduction (associated to D 50 = 0.15 mm and B = 1 m),
R = R D 50 = 0.8   mm , B = 4   m + R D 50 = 0.15   mm , B = 1   m 2 ,
This type of approach is consistent with extant travel cost studies, which use the cost of traveling to represent the price paid to access recreational sites usually having no entrance fee. These studies are based on a demand function estimated using this price, number of trips, and beach characteristics, from which a WTP for the feature of interest (beach width) is obtained. Due to its similarity to the present case, Parsons et al.’s [65] study was adapted, as they combine travel cost and contingent behavior questions in a survey of visitors to seven beaches in Delaware; the travel cost component describes actual past behavior (revealed preferences) while the contingent behavior captures potential trip changes due to changes in beach width (stated preferences). Combining revealed and stated preference information has provided good estimates for benefit transfer [68].
The WTP per trip and change in beach width from Parsons et al. [65] was adjusted by inflation from the year of the study to 2019 and converted to Chilean pesos using the World Bank’s PPP exchange rate. The values were then adjusted using each country’s ratio of PPP-corrected GDPs for that year and unitary elasticity. Since Parsons et al.’s [65] estimations are based on proportional changes (increase and decrease) in beach width, a linear function was estimated to obtain a value for the increase and decrease in one meter of beach width.
The number of trips was taken from the National Survey of Trips in Chile 2018 [69]. In beaches where no data were available, the entire communal trips were divided by the number of beaches. In addition, the number of trips was projected using the historical rate of tourism growth in Chile, calculated by the National Tourism Service [69]. This rate was reduced by an eighth for each decade of the projections (from 2019 to 2100). Finally, each beach’s economic benefit change was calculated by multiplying the change in width, the unit value of WTP, and the number of visits for the mid- and end-of-century projections.

4. Results

4.1. Projections of Wave Climate

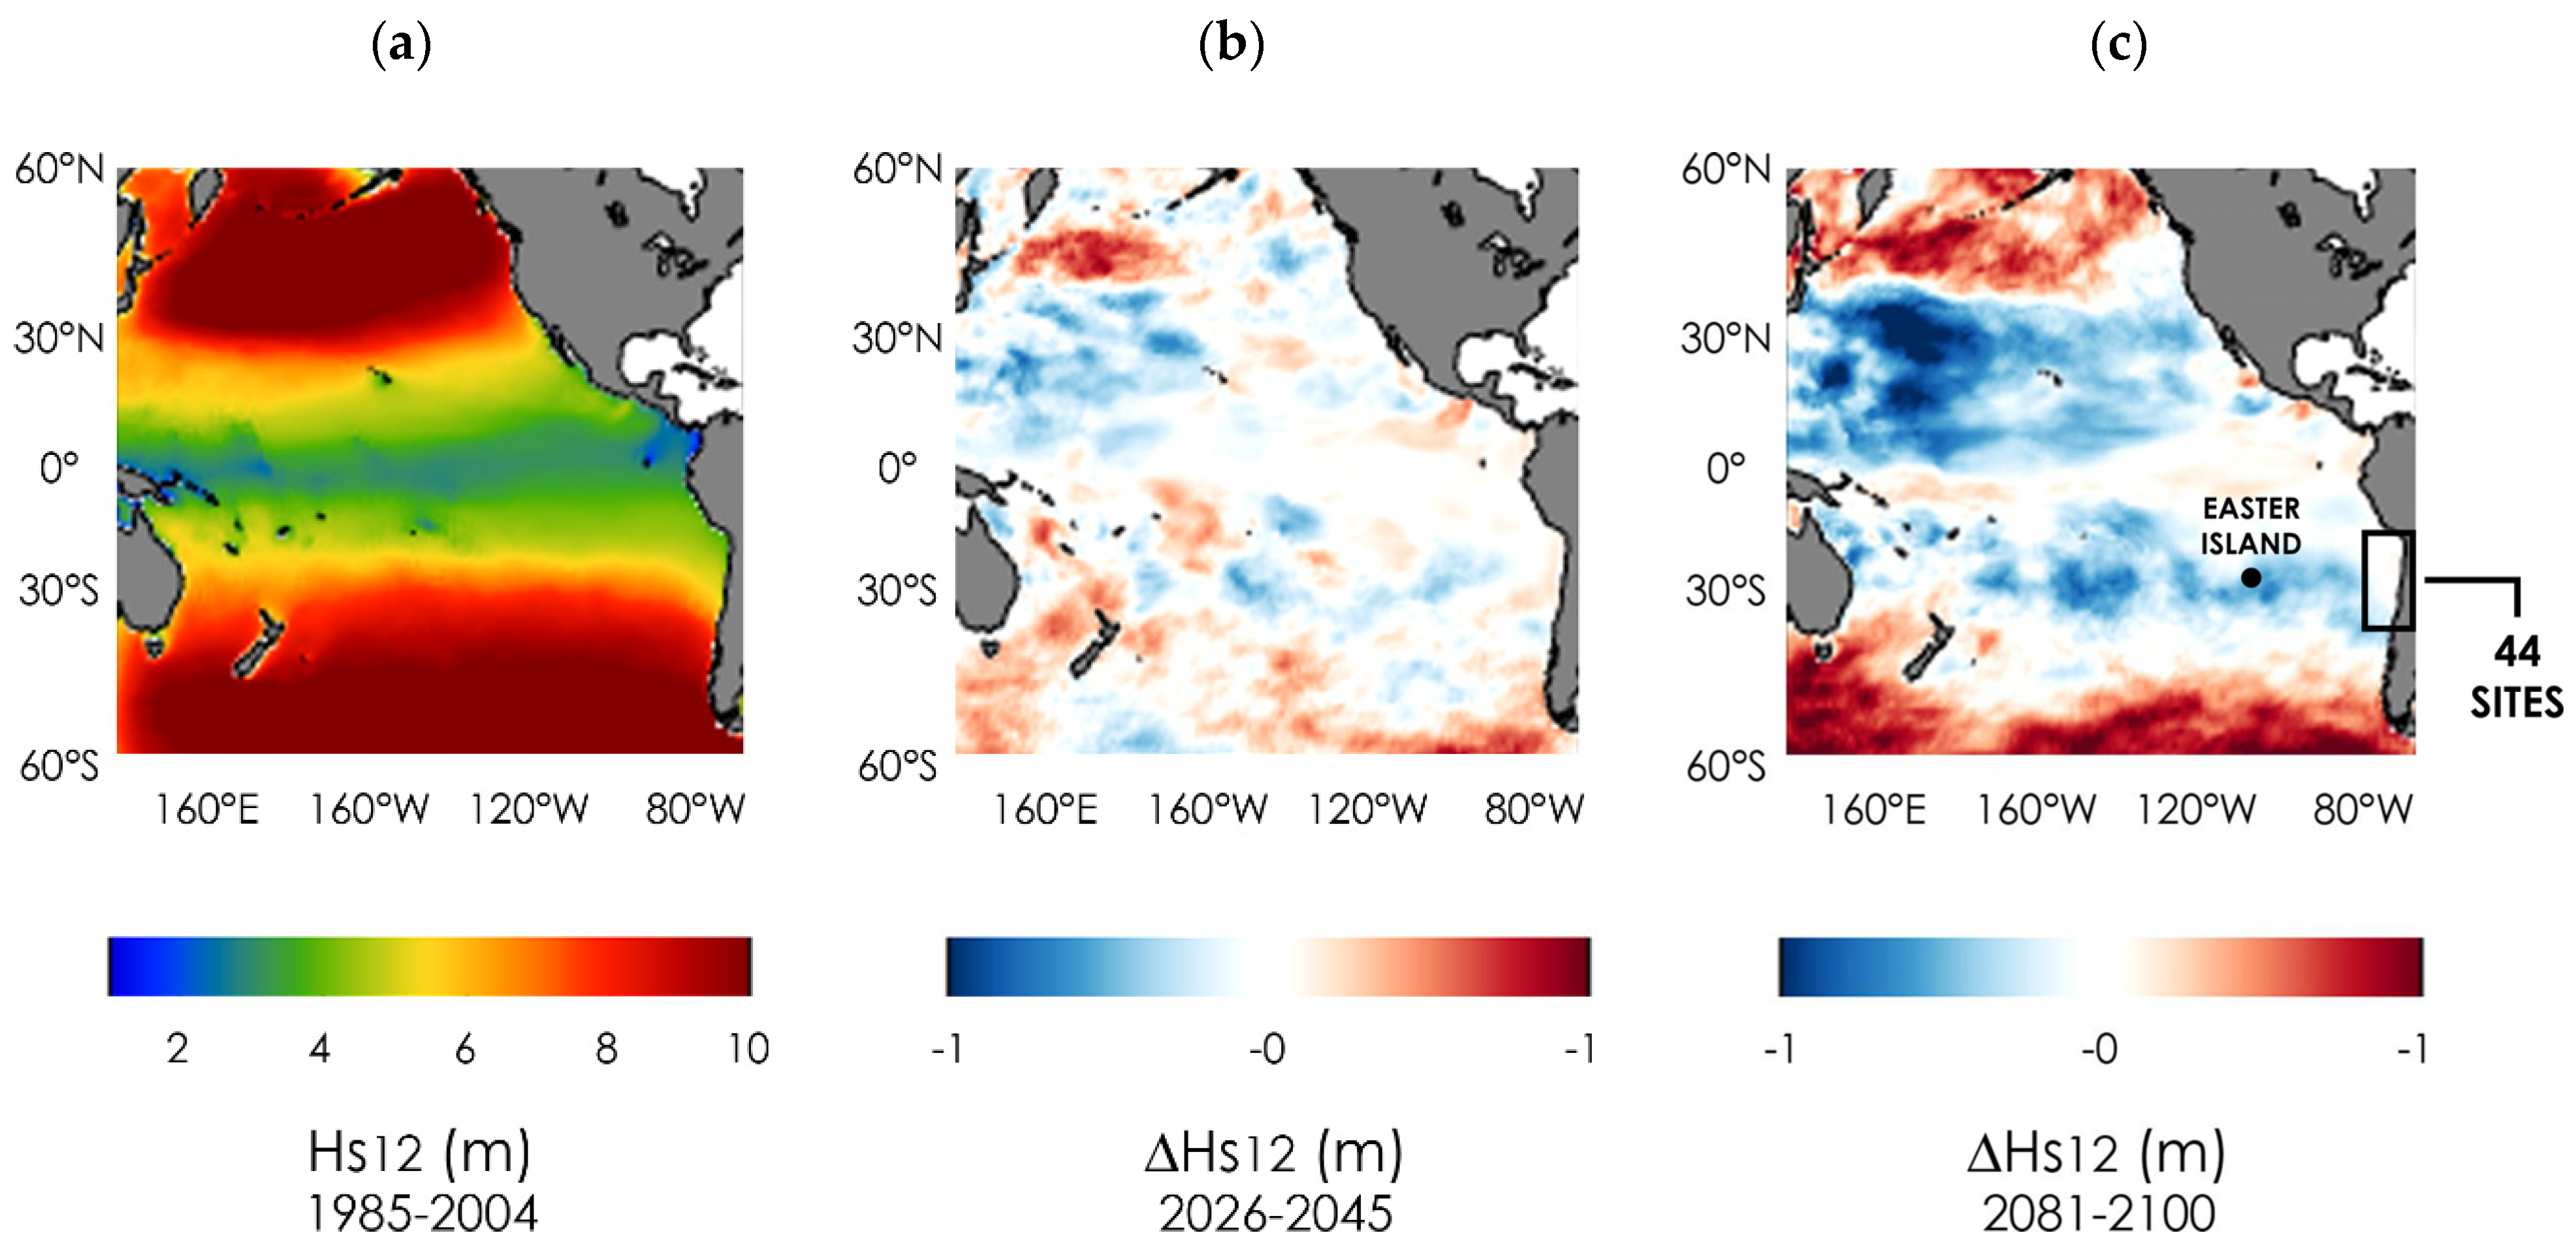
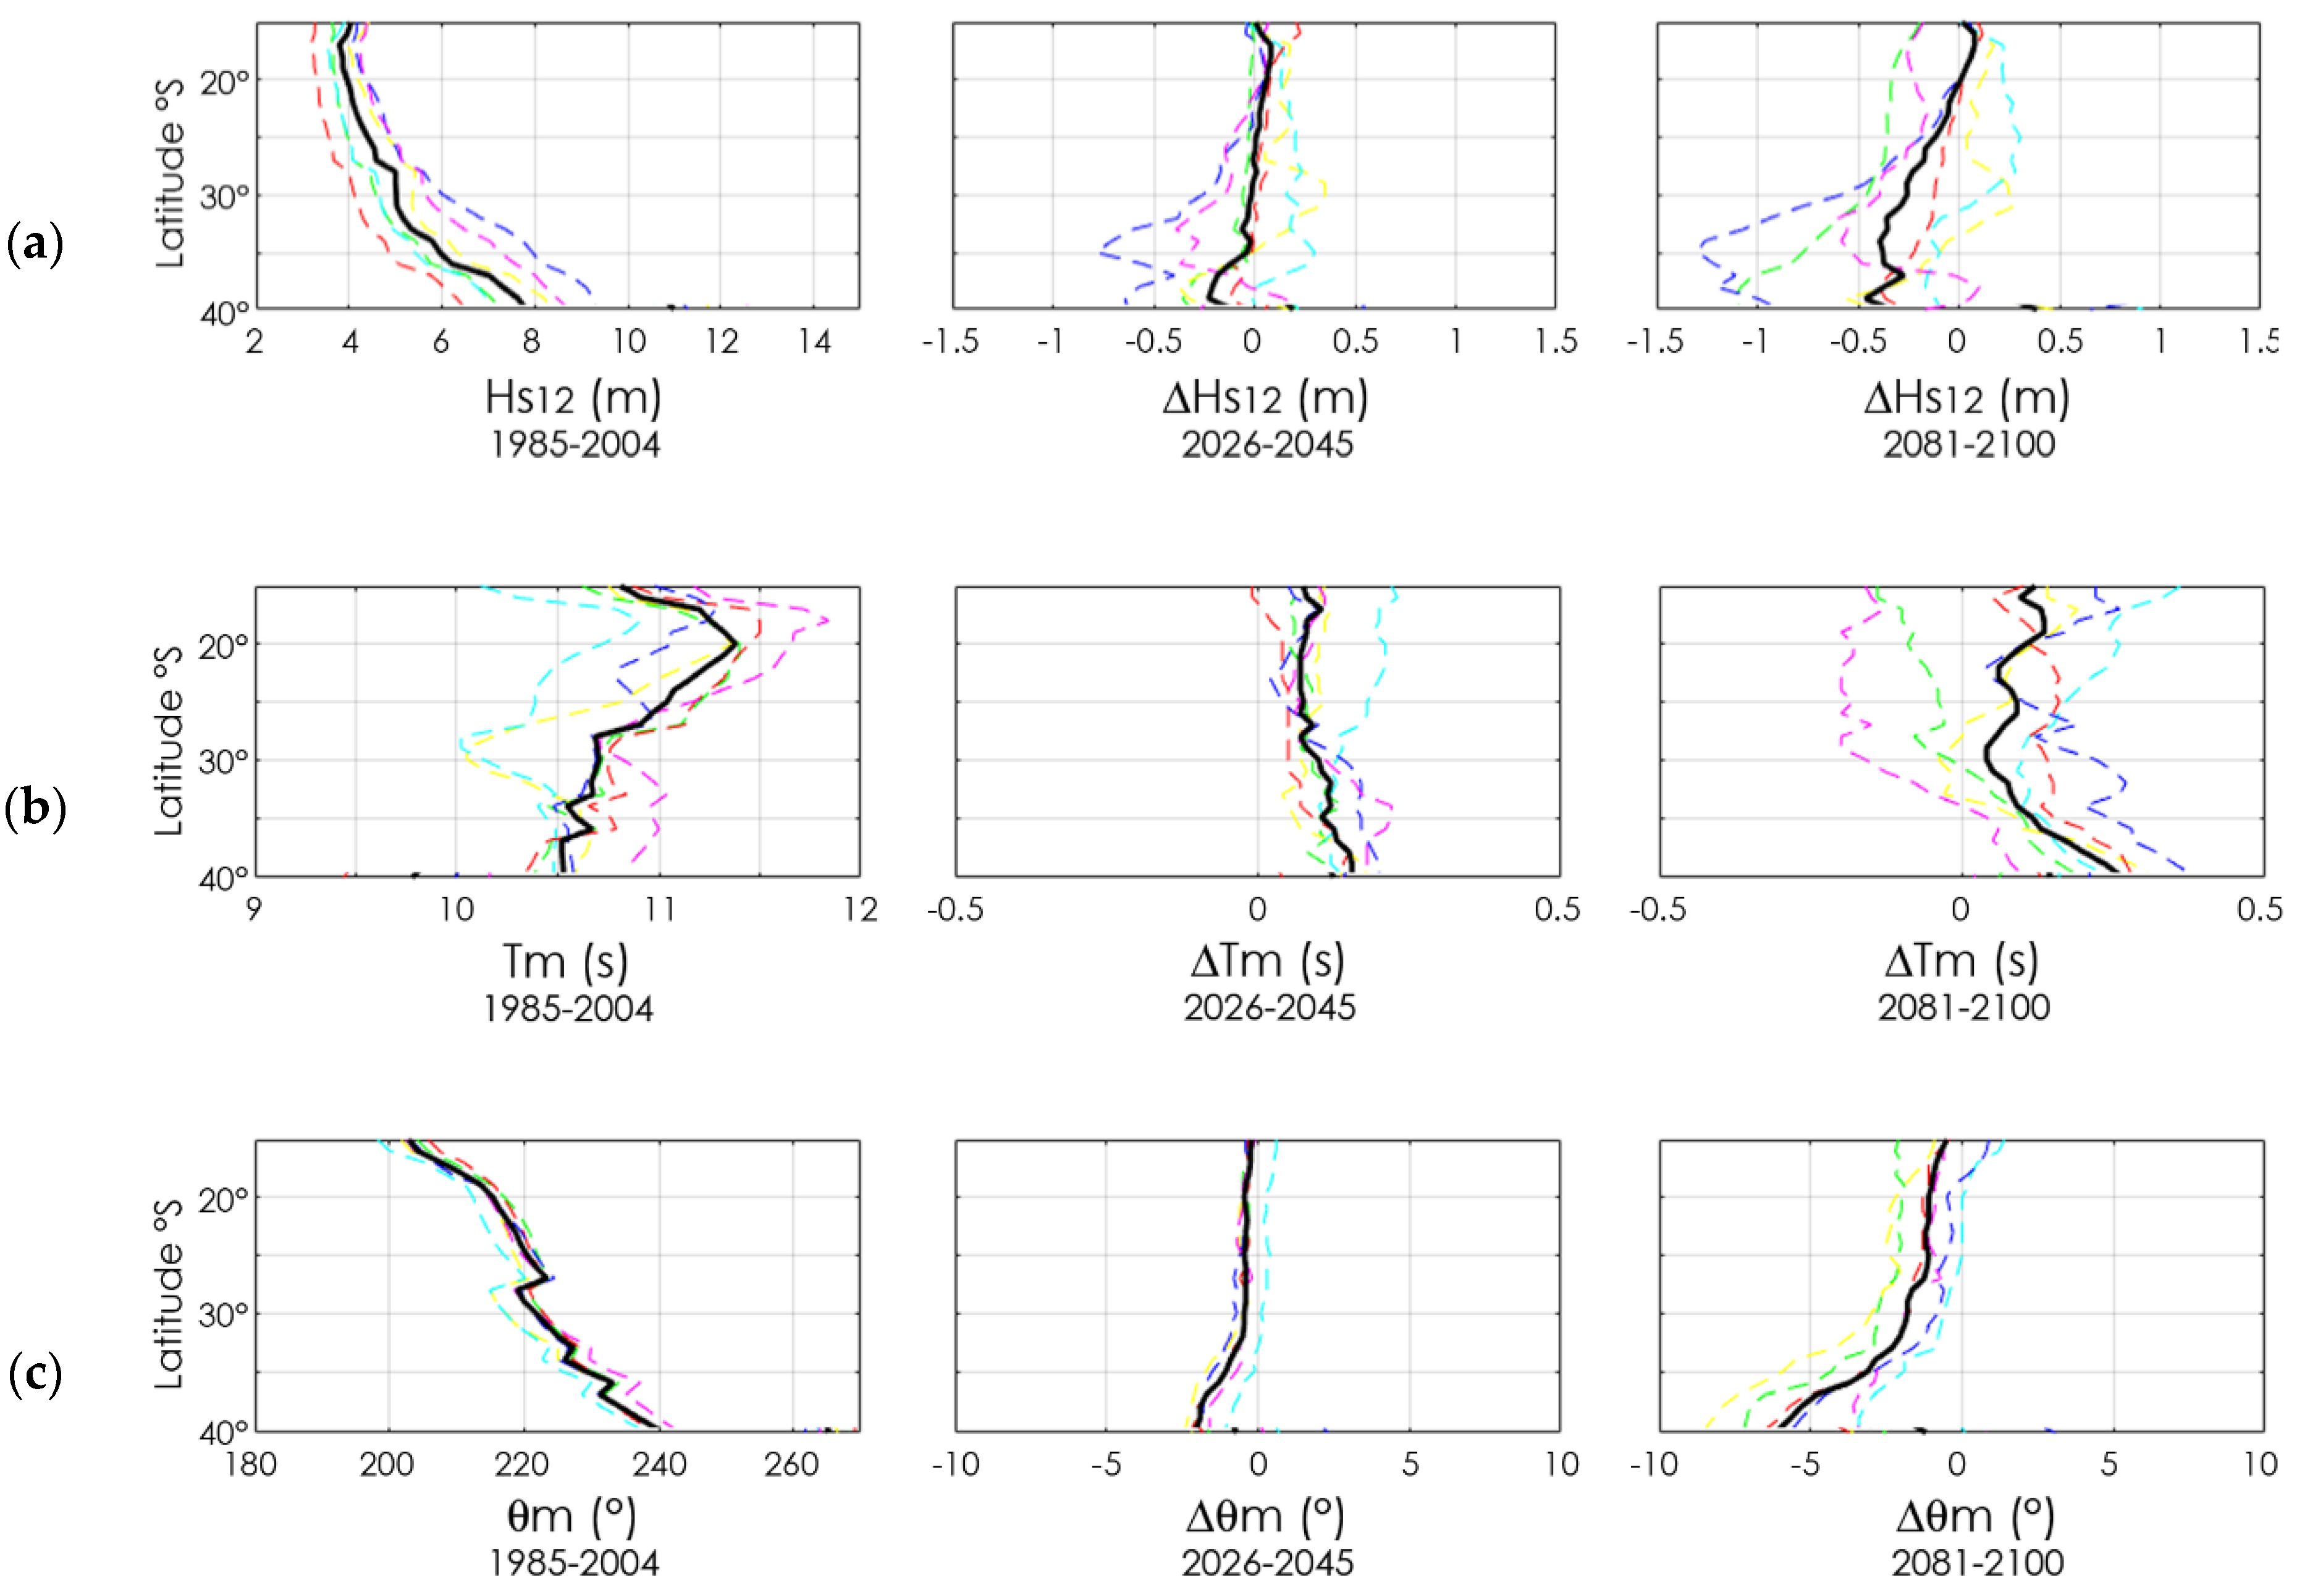
Figure 2a shows the spatial patterns of H s 12 in the Pacific Ocean, and the almost negligible changes between the mid-century (Figure 2b) and end-of-century projections (Figure 2c) with respect to the historical period in the study sites. The temporal and model median of this parameter ranges between H s 12 = 4.0 and 7.8 m in the northernmost beach (Cavancha, 20.23° S) and southernmost beach (Lebu–Tirúa, 37.88° S), respectively (Figure 3a). The values obtained from the 6 GCMs of H s 12 = 3.3–4.3 m and H s 12 = 6.4–9.4 m for both sites show a large range of expected responses. The mean period ranges from T m = 11.5 s [10.8–11.8] in Cavancha to T m = 10.5 s [10.3–10.7] in Lebu–Tirúa (Figure 3b). Finally, the mean direction ranges from θ m = 215° [212°–217°] to 240° [237°–242°] at both sites (Figure 3c). The latitudinal gradients are explained by the variable distance to the wave generation zone [70]. However, for mid-century projections, H s 12 would remain relatively constant except for the southernmost region (>35°), where H s 12   < −0.25 m. At the same time, an almost negligible increase in the mean period of T m = +0.15 s (Figure 3b) and southward rotation in the offshore wave direction of θ m = −2°, especially between 35° S and 45° S (Figure 3c), are expected.
For the end-of-century projection, the spatial patterns of these variables’ changes are similar to the mid-century projection but enhanced in terms of magnitude. For example, the significant wave height is reduced by as much as H s 12 = −0.5 m and the mean period increases to T m = +0.25 s. In contrast, the southward rotation in the offshore wave direction reaches θ m = −6° in the southernmost end of the study region. The projected spatial changes in wave climate could be attributed to the strengthening, expansion, and poleward migration of the Southeast Pacific Subtropical Anticyclone already observed in recent decades [34,71], which is expected to evolve in the next few decades [72].
Overall, changes in wave height and period, which play a role in the definition of the depth of closure, seem to be minor along the continental margin and Easter Island. The relatively minor changes in the mean direction, however, could trigger the pivoting of relatively long beaches [73] in microtidal environments (i.e., with tidal range below 2 m) dominated by waves [74].

4.2. Projections Sea-Level Rise

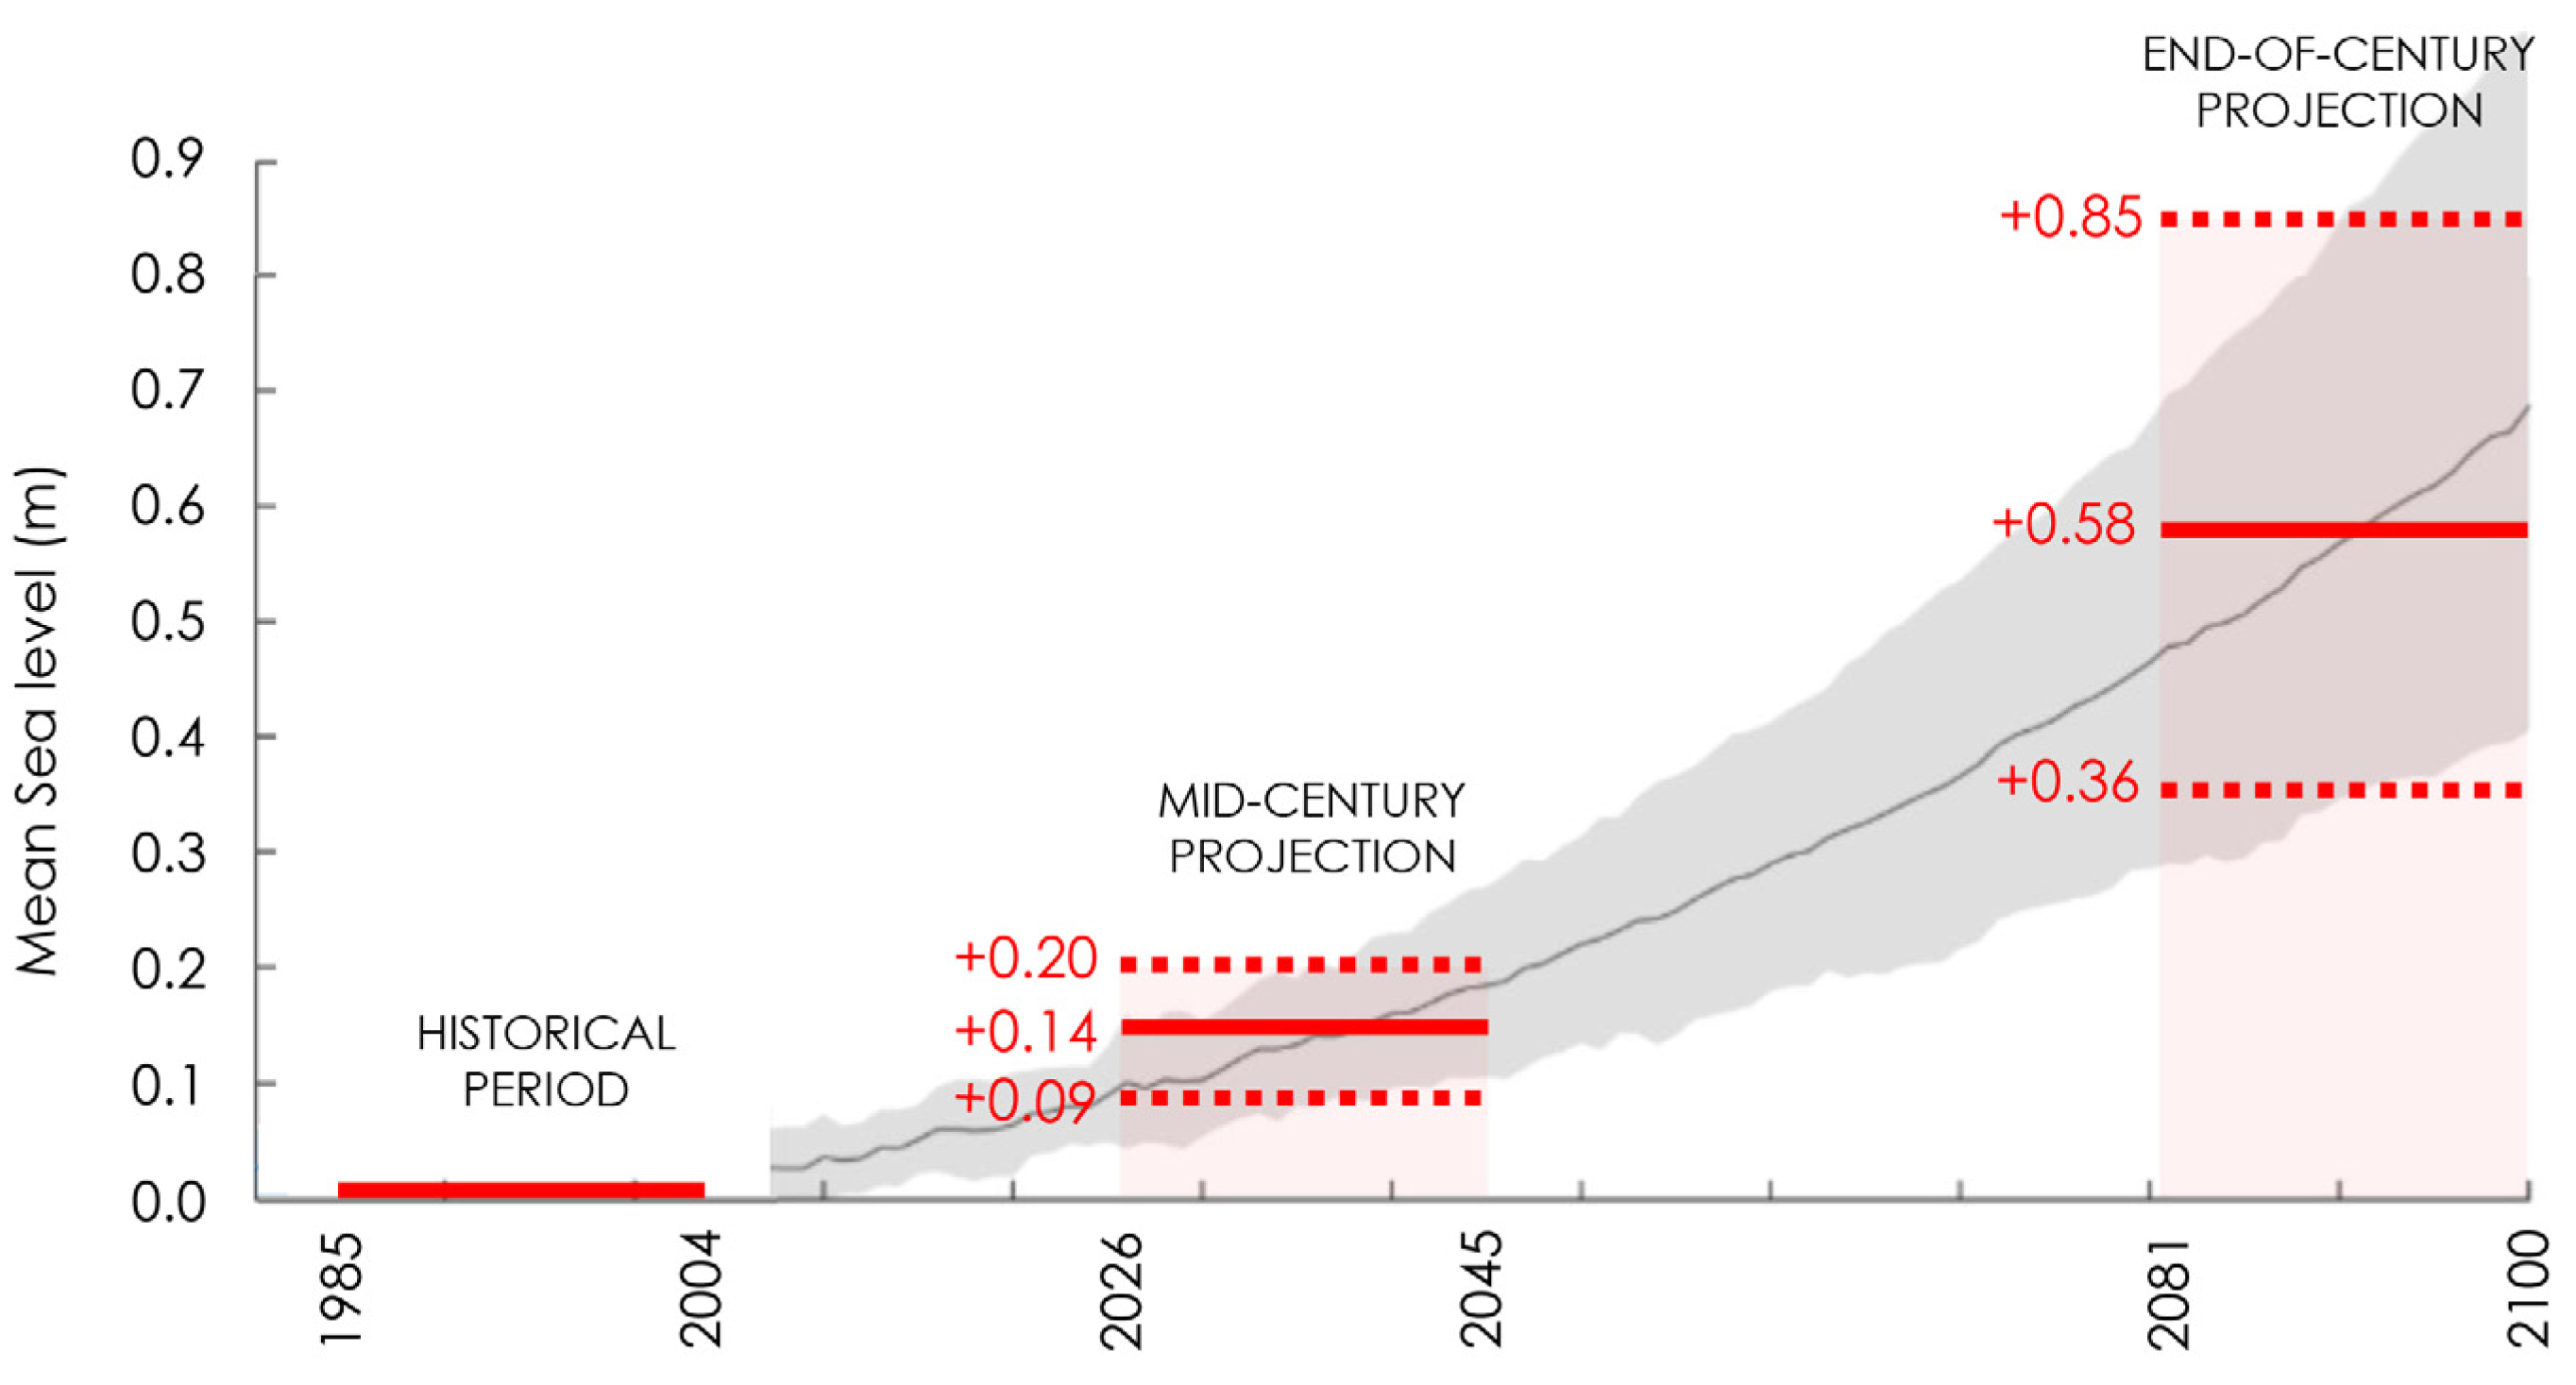
Figure 4 shows the mid-century and end-of-century projections of SLR with respect to the historical period, based on 20 GCMs in Valparaíso, as an example. SLR is relatively homogeneous within the study area, as shown in Winckler et al.’s [75] p. 234. In Valparaíso, mean sea level is expected to increase 0.14 m [0.09–0.20 m] for the mid-century projection and 0.58 m [0.36–0.85 m] for the end-of-century projection with respect to the historical period. These values are consistent with those of Albrecht and Shaffer [76], who projected a SLR between 0.34 and 0.74 m by the end of this century along the Chilean coast.

4.3. Projections of Shoreline Change

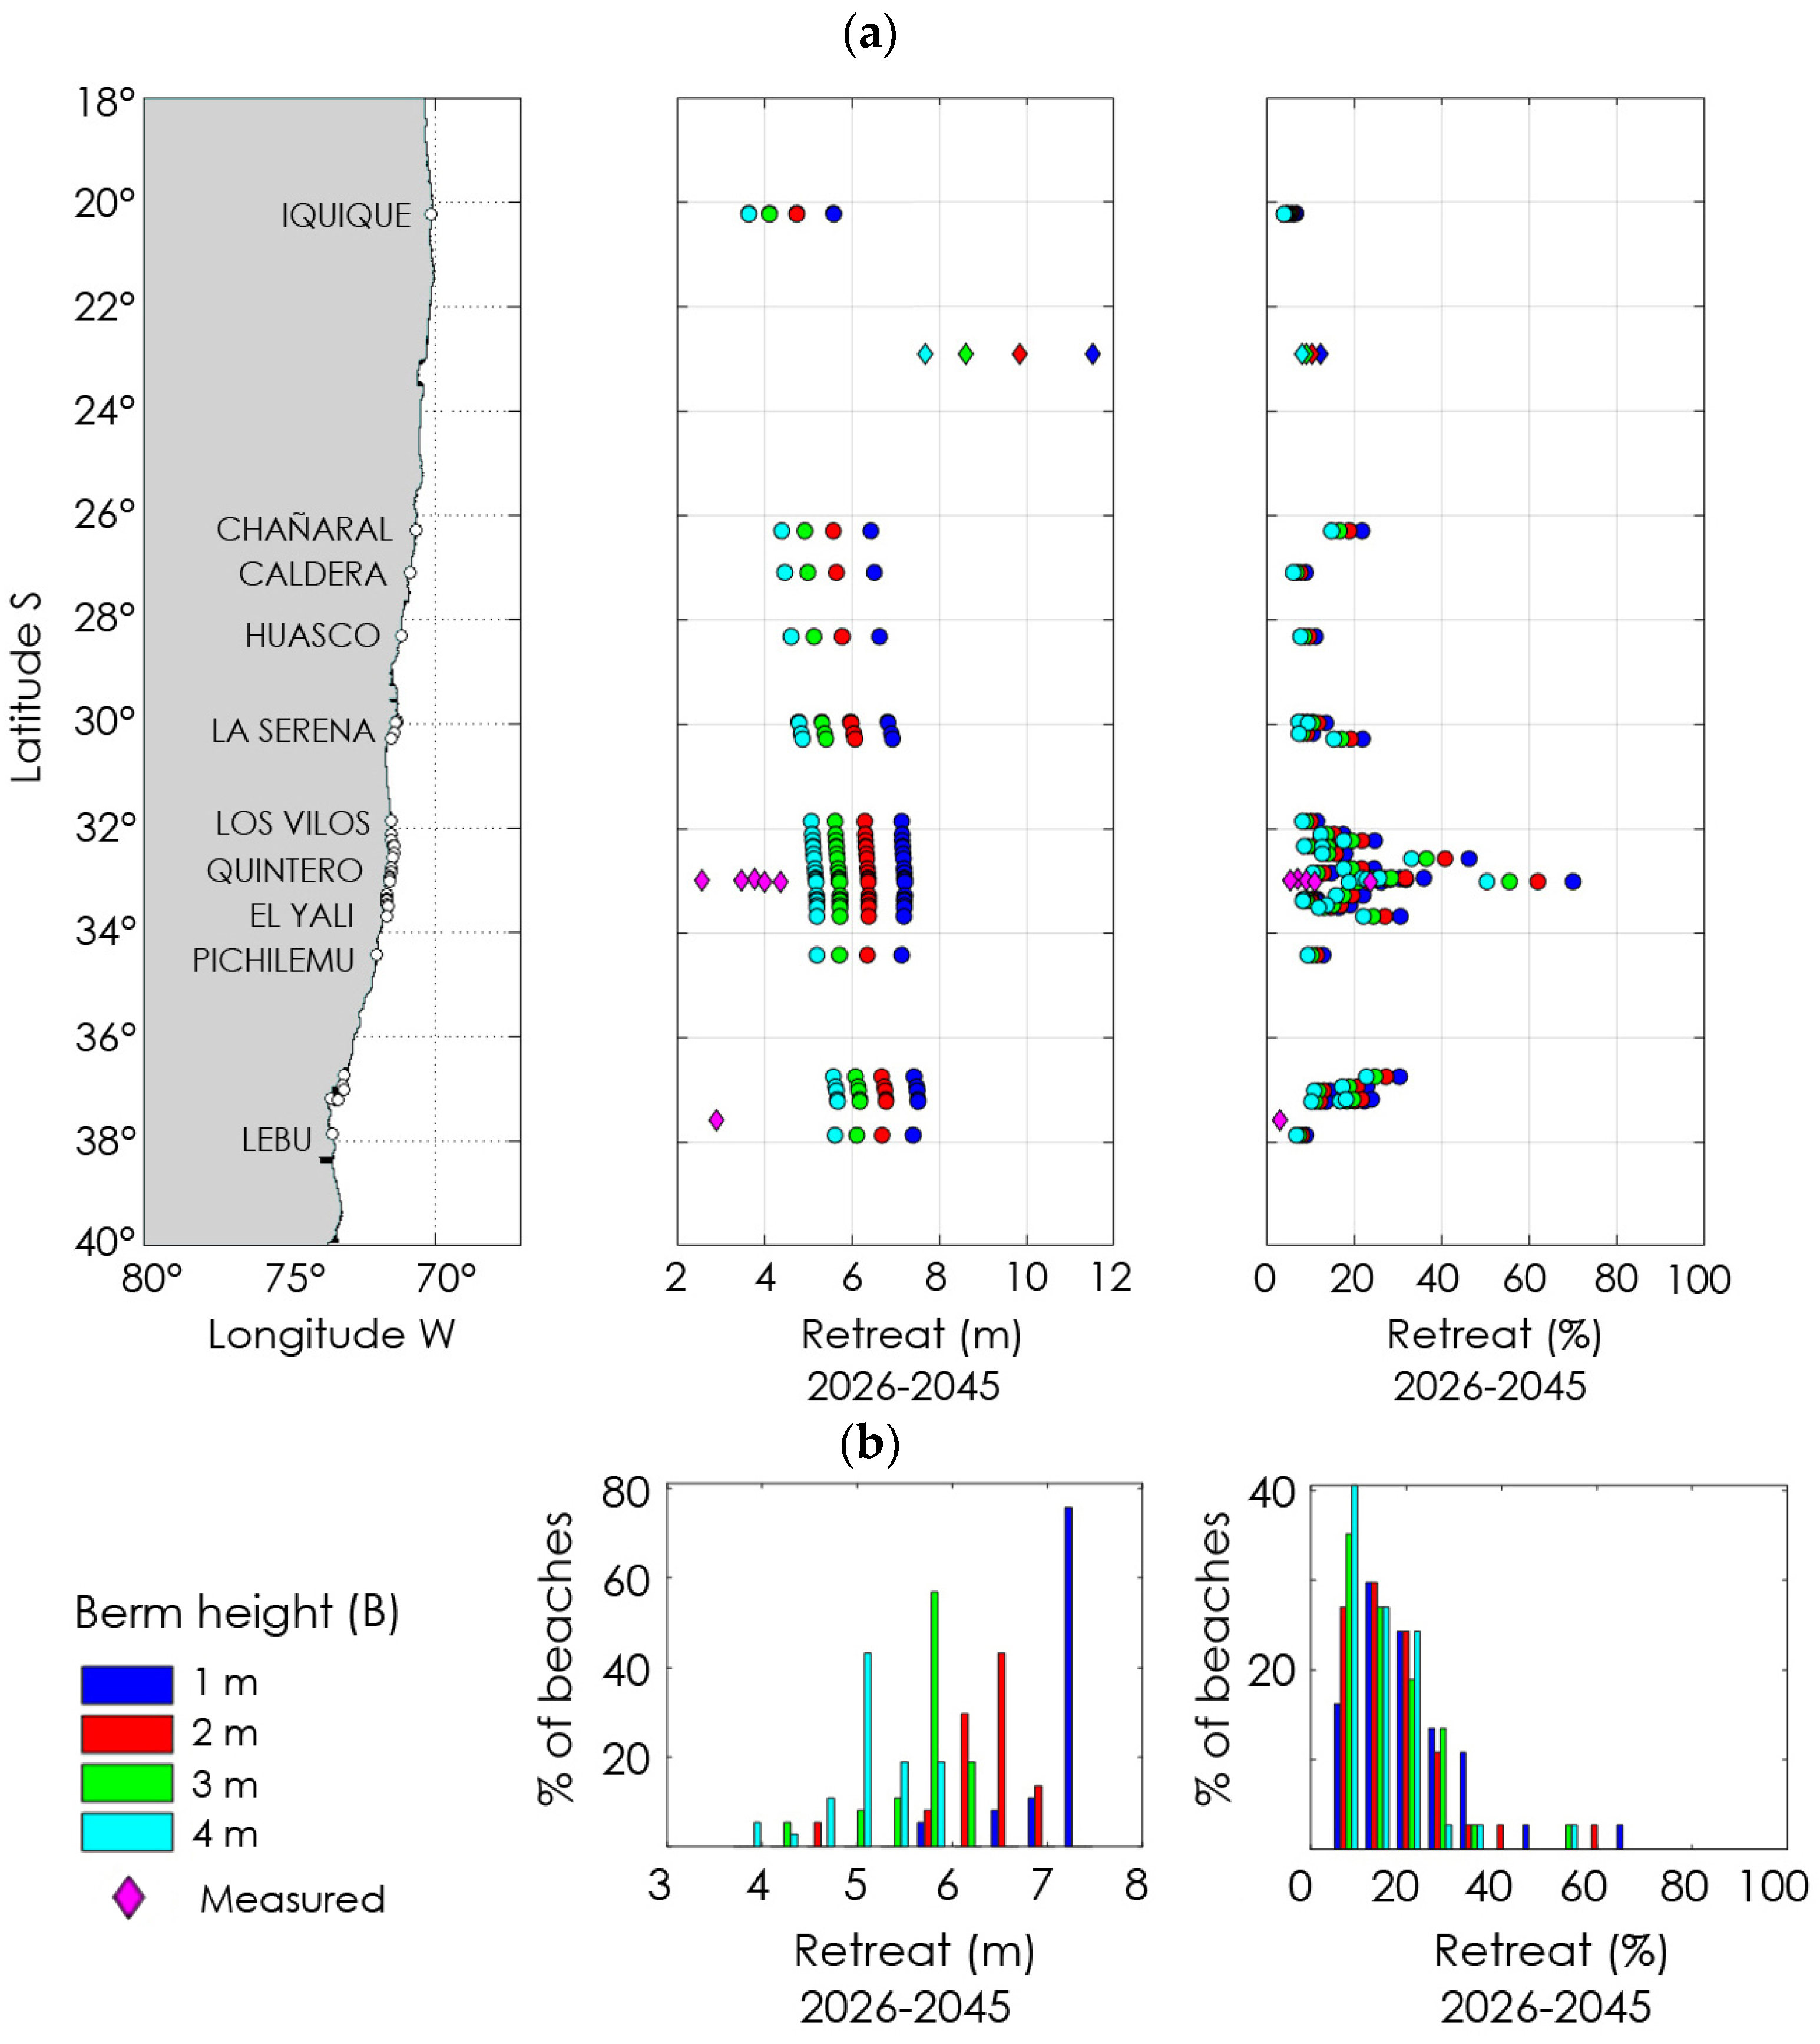
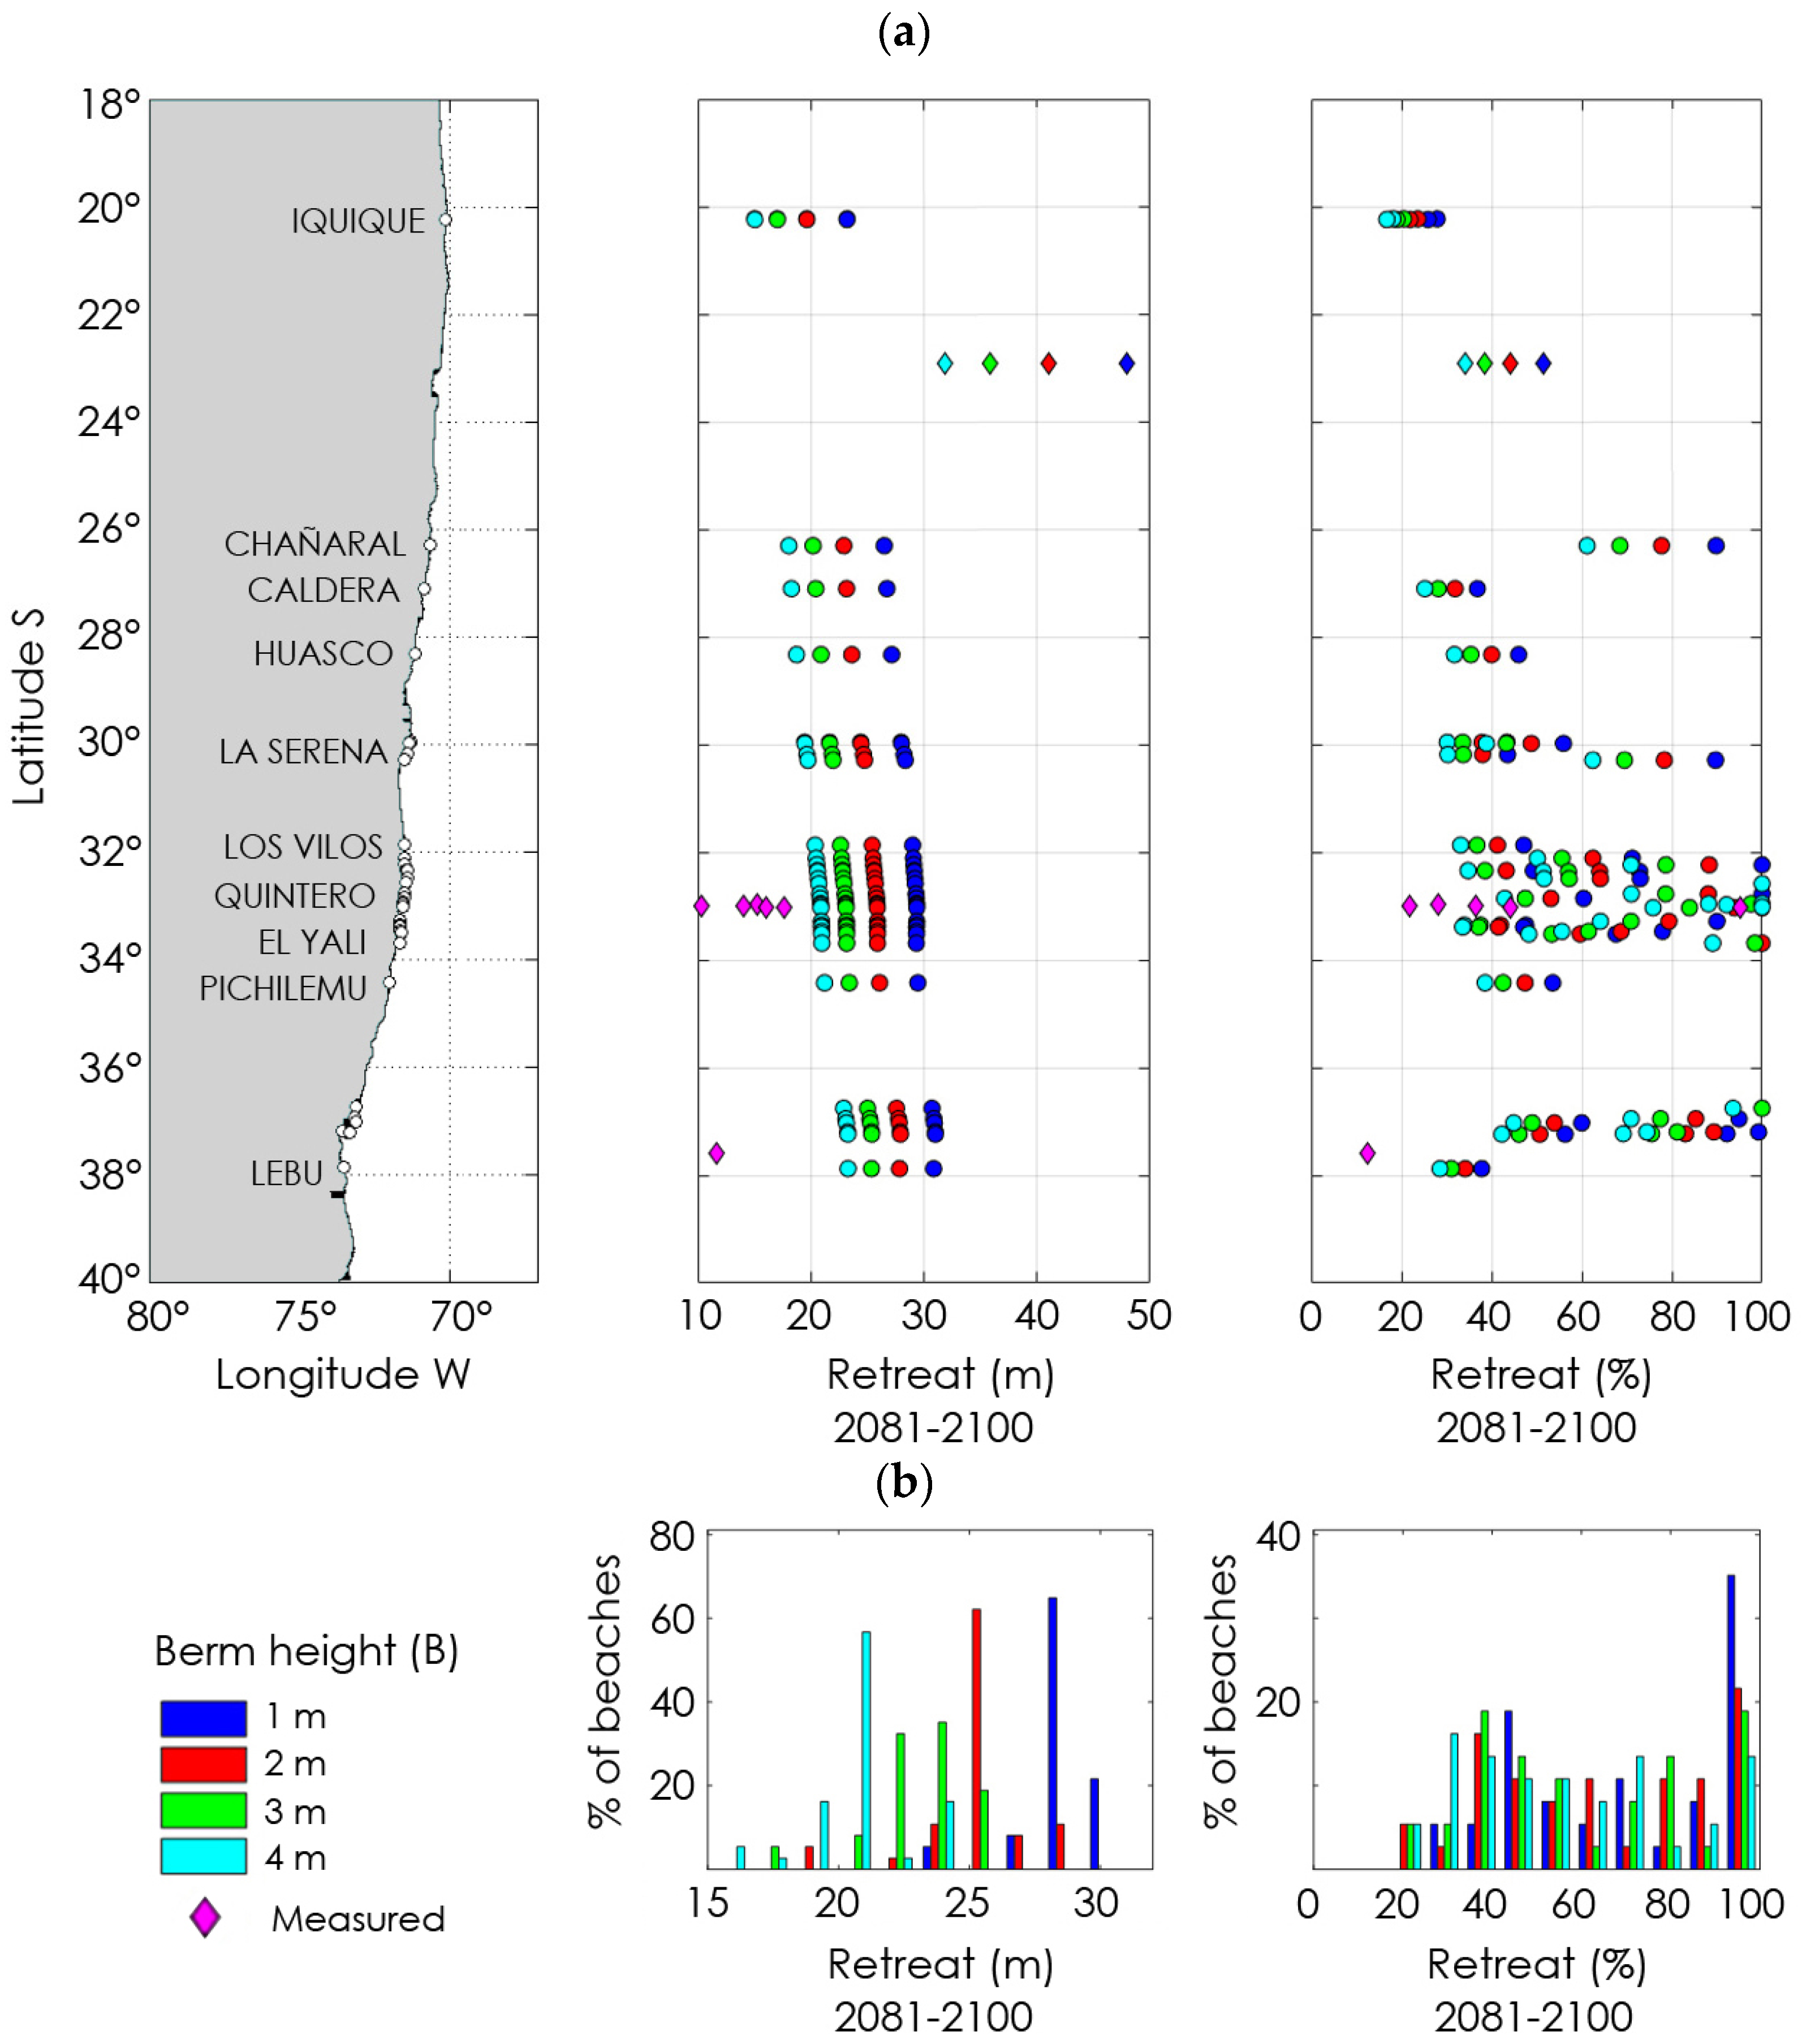
Projections of shoreline retreat for the mid-century and end-of-century projections with respect to the historical period for a grain size of D 50 = 0.3 mm are shown in absolute values and as a percentage of the beach width (0% and 100% corresponding to no and total erosion, respectively) in Figure 5 and Figure 6, respectively. Additional plots for grain sizes of D 50 = 0.13 and 0.18 mm are included in Figures S2 and S4. The analysis shows that retreat would range between 2 and 13 m for the mid-century projection, values which are equivalent to an annual erosion rate of between 0.05 and 0.33 m/y (Figure 5a, center), depending on the berm height. For the end-of-century projection, the retreat would range between 10 and 53 m, corresponding to an annual rate between 0.25 and 1.33 m/y (Figure 6a, center). There is a mild latitudinal gradient, with smaller values in the north and larger in the south. Additionally, shoreline retreat is larger for small grain sizes, such as in Hornitos (22.92° S), where D 50 = 0.12 mm (Table 1).
Results for the mid-century projection show that no beach would completely disappear (Figure 5a, right), while the majority would show erosion below 30% of its present width (Figure 5b, right). For the end-of-century projection, 28–55% of beaches (13–25 for assumed grain sizes of 0.3 and 0.8 mm, respectively) could experience total erosion, and the majority would experience a significant retreat (Figure 6, right). According to Rangel et al. [77], all cases fall under the categories of erosion when considering shoreline retreat (>0.2 m/y). It is worth noting that this analysis excludes the capacity of non-urban beaches to migrate to higher elevations as sea-level increases [9].
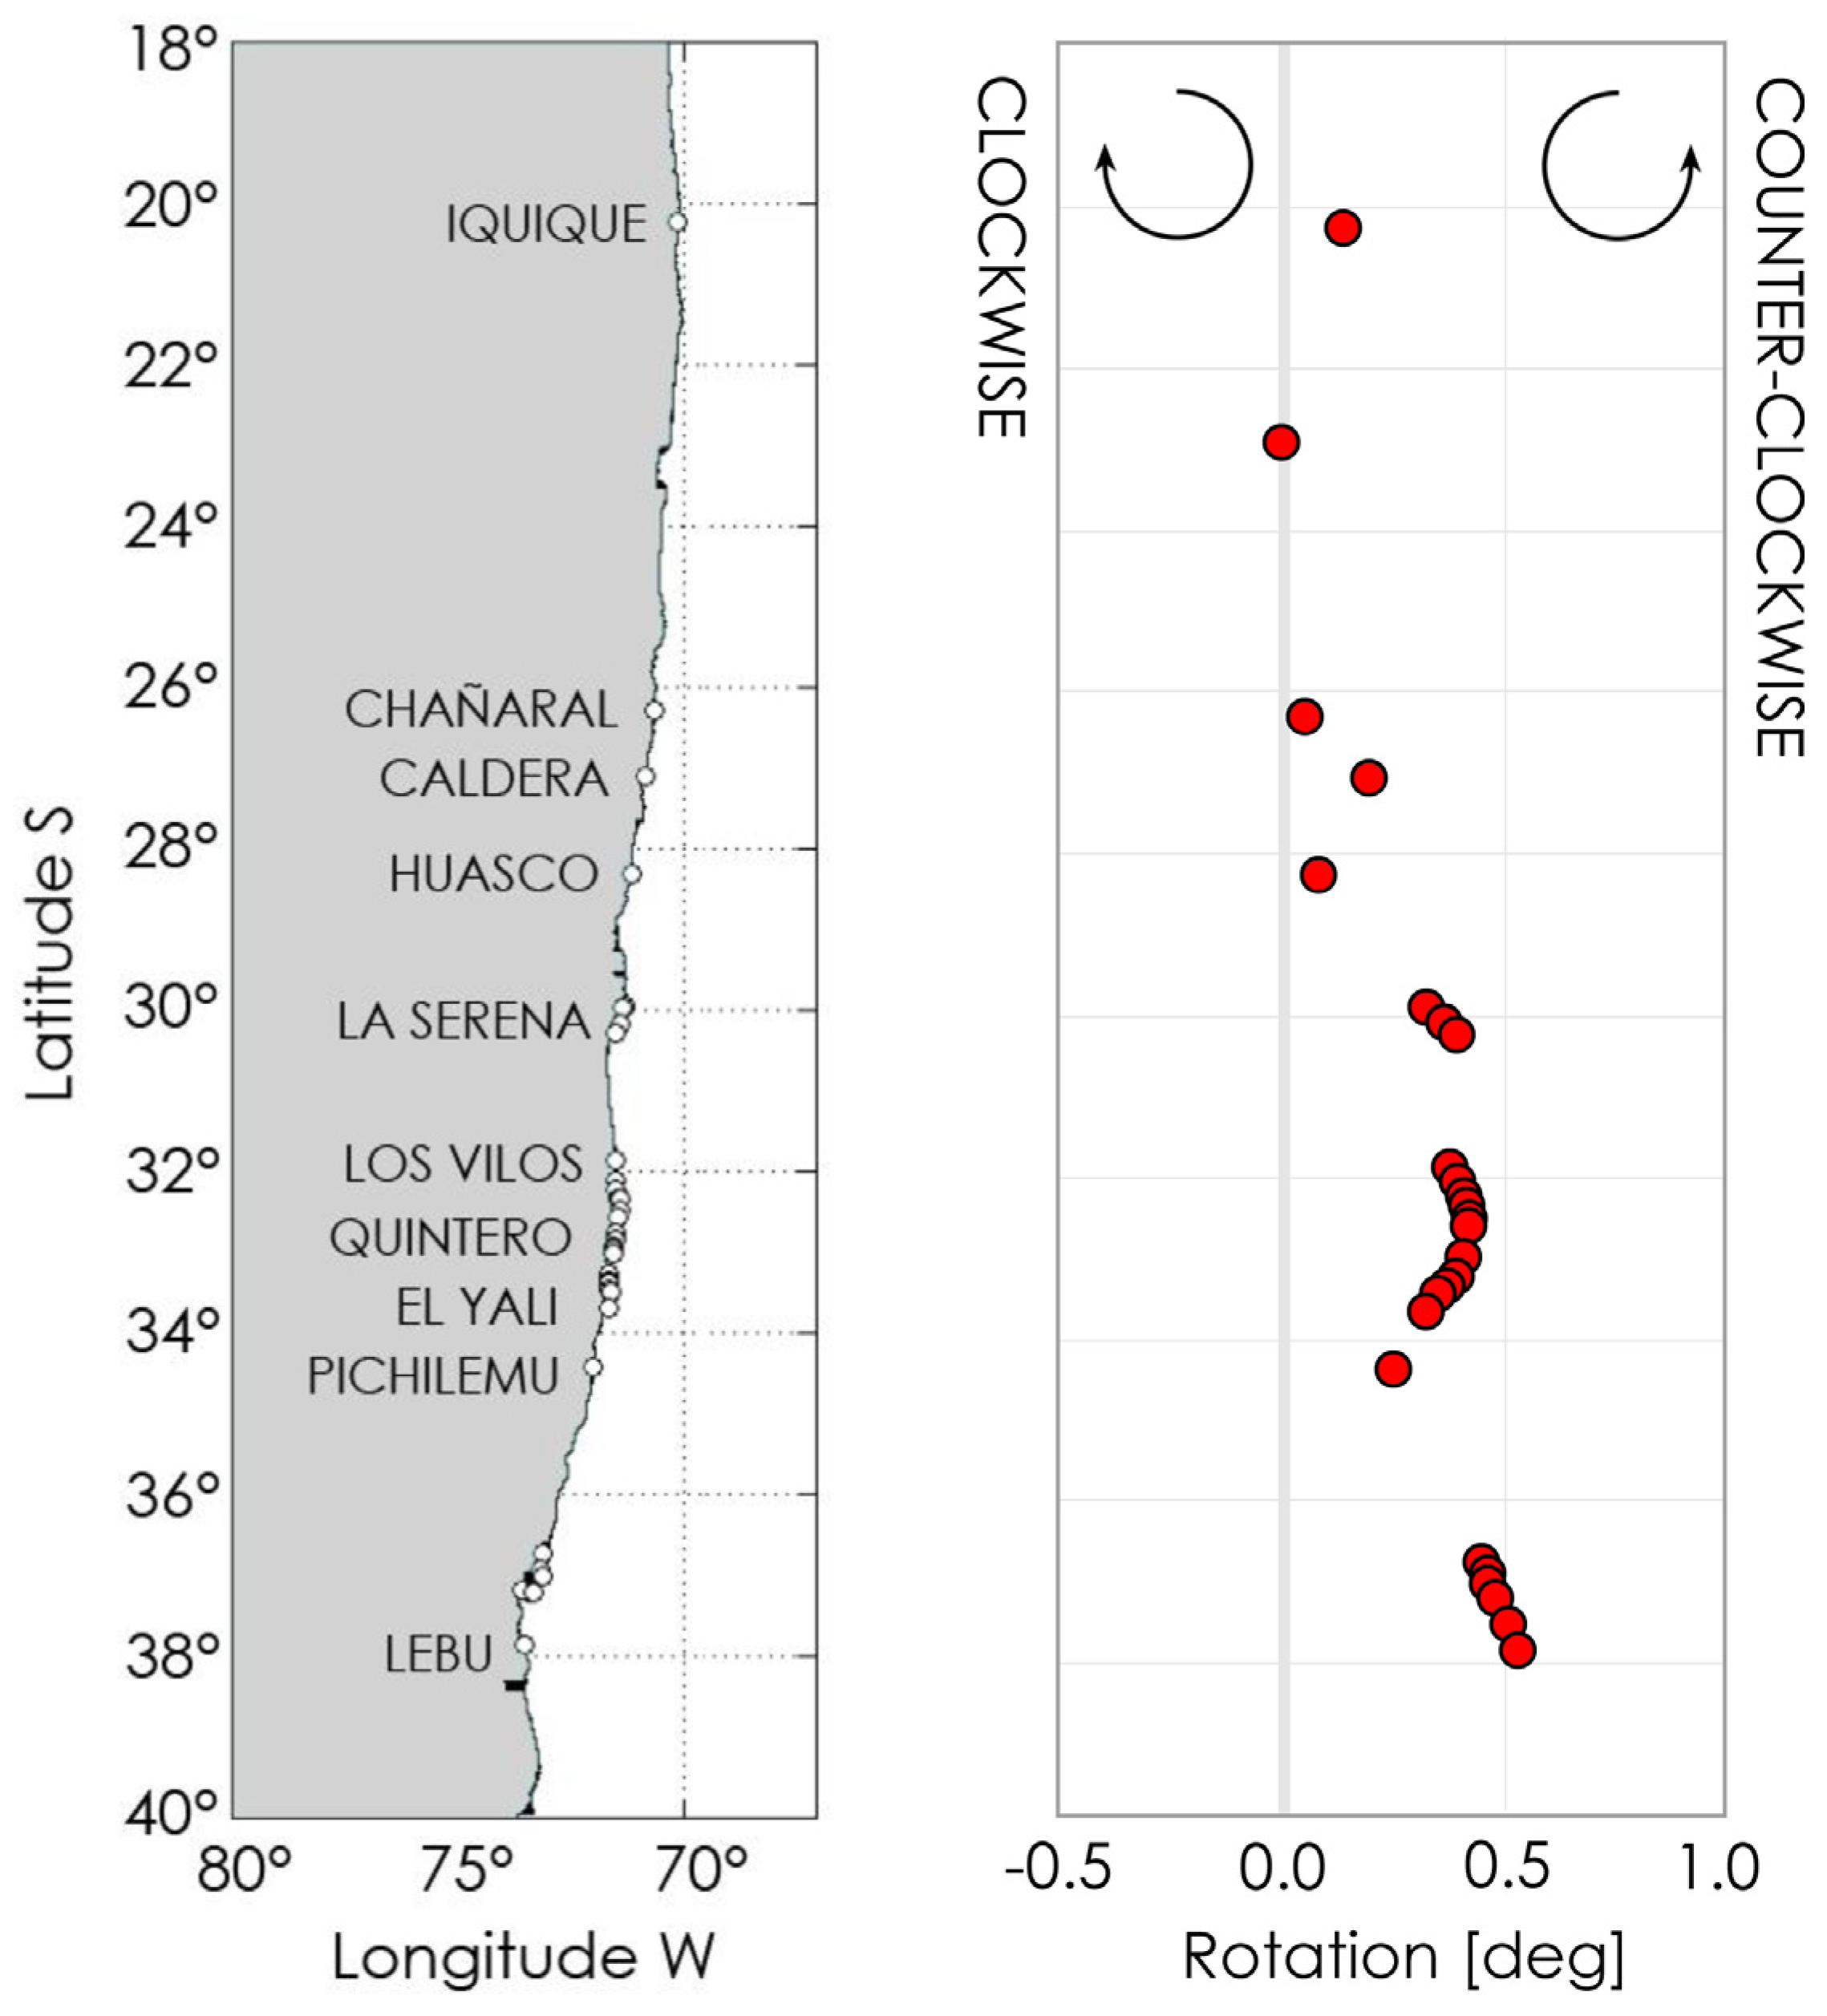
Because of the southward rotation in the offshore wave direction of θ m = −2° (Figure 3c), sandy beaches are expected to turn counterclockwise (Figure 7). The magnitude of this rotation is smaller, in magnitude, than the rotation of offshore waves, due to wave refraction. The rotation is also dependent on the orientation of each beach (Table 1). Figure 6 shows, as an example, the projection of beach rotation for the RCP 8.5 mid-century projection. Generally, the counterclockwise rotation of beaches is smaller than 0.5°, with negligible effects in pocket beaches or those with small lengths. Long beaches, however, would experience erosion at their southern ends and accretion at their northern ends. For a beach of, for example, 1 km, a gyre of 0.5° would generate an average accretion of ~5 m at the northern end and an erosion of the same order at the southern end of the beach.

4.4. Projections of Economic Losses Due to Beach Erosion

Table 2 shows the calculation of the WTP for the change in the beach width per trip per household for a 1% increase and decrease in beach width on short and long trips per household, using Parsons et al.’s methodology. Note that a long trip is defined as one lasting more than four nights. As expected, WTP for increases (decreases) in beach width is larger (smaller) for long trips than for short trips. Therefore, for a reduction of beach width, WTP is negative and represents a loss of economic benefits, or a situation in which households would need to be compensated for a change in width to remain equally satisfied.
This per-trip per-household WTP was multiplied by the proportional width change for the 45 beaches for the mid-century and end-of-century projections. Since the modeling of beach erosion only resulted in shoreline retreat, only the WTP calculated for the decrease in beach width was used. The total losses, including the sum of all short and long trips to each beach, are shown in Table 3 and Table 4 for the mid-century and end-of-century projections, respectively. For the mid-century, beach width reduction is between 4.3% (Bahía de Lebu) and 41.4% (Miramar) and results in a total annual loss of USD 5.6 million, with maximum and minimum values of USD 6.1 and USD 5.1 million, respectively. For the end-of-century projection, the range of beach width reductions is larger (23.5% in Los Marineros to 100%) and the total annual loss is USD 10.5 million, with maximum and minimum values of USD 8.1 and USD 11.8 million, respectively.

5. Discussion

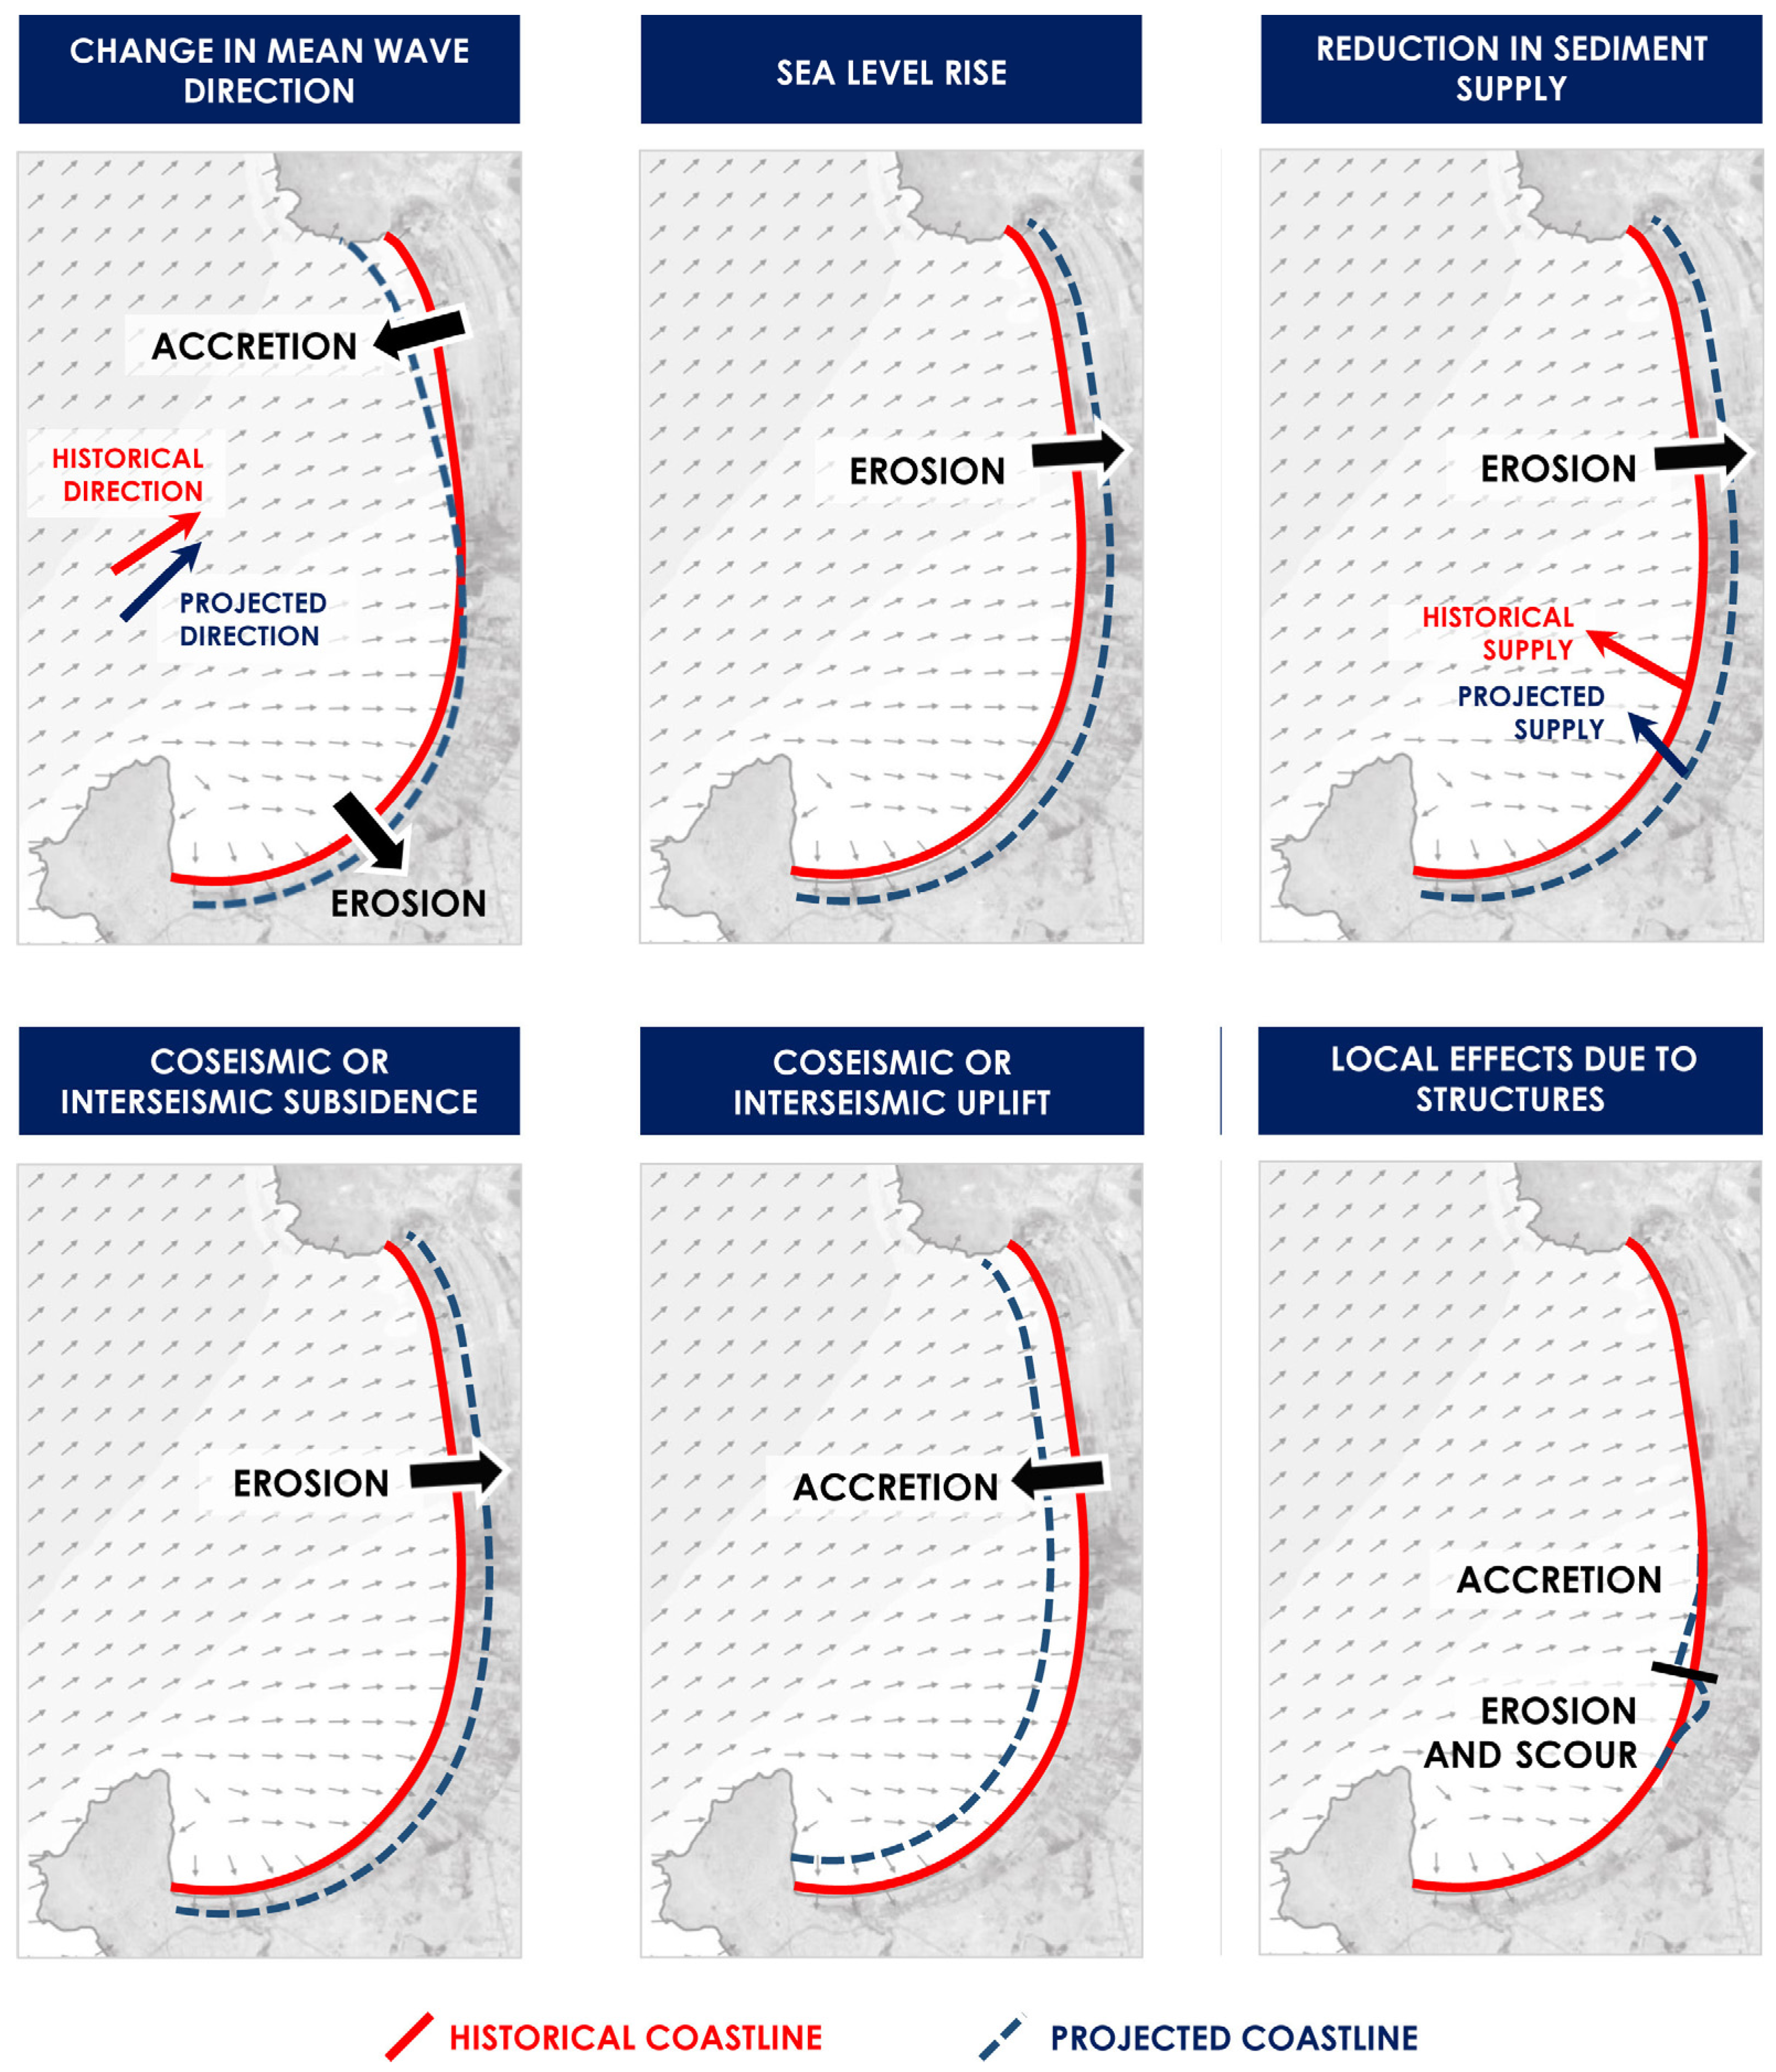
Beach erosion can be due to human activities or caused by oceanographic, geophysical, and hydrologic phenomena [78]. Natural processes include changes in the frequency, direction, and intensity of waves, SLR, coseismic, post-seismic and inter-seismic vertical changes in the Earth’s crust, consolidation of alluvial deposits, and glacial isostatic rebound. Human activities include urban expansion, land reclamation, sand mining, building of coastal structures, extraction of algae fields, and groundwater production, among others, which altogether can reduce sediment supply from rivers to the coastal system. Some of these processes, and the expected response of the shoreline are depicted in Figure 8. In this study, we thus focus only on beach erosion due to changes in mean wave direction and SLR.
Determining the possible causes of beach erosion in a region covering nearly 1960 km of the Chilean coastal zone is extremely challenging, as there are several concurring agents acting on the physical system. Special attention needs to be devoted to vertical land changes due to the seismic cycle. Indeed, coseismic uplift and/or subsidence (and interseismic changes to a lesser extend) determine the fate of shoreline changes: while subsidence boosts beach erosion, uplift has shown to induce accretion. This cannot be disregarded in the tectonically active Chilean coast. For example, the M8.8 Maule earthquake [79] produced a maximum coseismic uplift of 3.44 m (and minor subsidence is some areas), value which is comparable to centuries of SLR. However, 2010-type earthquakes have a mean recurrence rate of 300 to 350 years [80], for which the probability of occurrence within the mid-century projection is rather small (i.e., between 0.9% and 7.1% for the years 2026 and 2045, respectively). For the end-of-century projection, however, the encounter probability should not be disregarded (i.e., between 15.3% and 22.6% for the years 2081 and 2100, respectively). Additionally, smaller earthquakes triggering vertical changes comparable to SLR are more probable within the projected horizons. For example, the M7.7 2007 Tocopilla earthquake, with a recurrence period of ~35 y [80], produced an uplift of 0.35 m [81]. Novel probabilistic approaches combining the occurrence of earthquakes and SLR [82] should be therefore adopted to estimate shoreline retreat in this tectonically active coast.

5.1. Projections of Shoreline Change

Shoreline evolution in the RCP 8.5 scenario for the mid-century projection suggests that beaches located between Iquique and Lebu–Tirúa would experience average retreats of up to 12 m, depending on the grain size and berm height of the beach. Beaches with fine sediment size (e.g., Hornitos and those located in the bay of Valparaíso; inset in Figure 1) would experience a larger retreat than those with coarse sands, while beaches with lower berm heights would erode more than those with higher berm heights. By the end of the century, a shoreline retreat of up to 50 m is expected, resulting in total erosion of a significant number of beaches (13–25 out of 45) driven by SLR (0.58 ± 0.25 m). These results are consistent with previous studies that projected long-term shoreline retreat under the RCP 8.5 scenario [8]. Additionally, a mild rotation of offshore wave climate driven by the poleward migration of the Southeast Pacific Subtropical Anticyclone could enhance (reduce) the erosion in the southern (northern) ends of long sandy beaches.
The present calculations are based on Bruun Rule, which has generated considerable debate, Cooper and Pilkey’s paper [83] being one of the most skeptical of its use. The criticism is based on the lack of a rigorous mathematical derivation and some of its assumptions, namely, no existence of a net longshore sediment transport, the use of a depth of closure beyond which no cross-shore sediment transport occurs, a closed sediment budget, the availability of unlimited sand sources, and the idea that SLR always results in retreat. Cooper and Pilkey’s criticism, however, has been questioned for providing no meaningful alternative [84]. In addition to the above-mentioned limitations, Bruun Rule neglects vertical changes in the Earth’s crust, which are relatively normal in Chile, and neglects the adaptive capacity of non-urbanized beaches—20% of the analyzed cases—to evolve or migrate towards land with SLR, given that sedimentary sources are not altered [9]. Toimil et al. [85] mentioned that despite all its limitations, Bruun Rule can still provide first-order estimates of shoreline erosion in uninterrupted coastlines. Admitting all these limitations and the considerable effort required to conduct site specific studies in the 45 beaches analyzed herein, we assume that Bruun Rule provides a first-order estimate of the shoreline retreat, which could be later improved by considering sediment budget balances and process-based models to account for sediment transport processes at each site.
In addition, our projections are embedded in intrinsic uncertainties such as the use of the RCP 8.5 scenario and the associated GCMs, as well as the simplified transformation used to compute local wave climate on each beach, which, in turn, is highly dependent on the bathymetry [86]. Furthermore, the uncertainty also stems from the lack of in situ data available, which was addressed by a sensitivity analysis of the berm height and sediment grain size. Further improvements could thus be achieved with a systematic characterization of the bathymetry, topography, and sediment characteristics of each beach under study.
Finally, this study omits the adaptative capacity of beaches to face erosion caused by SLR, as evidenced by Cooper et al. [9]. Although many beaches migrated landward since the last glaciation, most sandy beaches are nowadays urban or periurban. In such conditions, their ability to migrate landward is impeded by coastal infrastructure and the limited availability of sediments. These conditions are met by several beaches analyzed in this study.

5.2. Projections of Economic Losses Due to Beach Erosion

Projected economic losses for each beach differ according to beach erosion and the number of visitors. Thus, it is not necessarily the case that the most visited beaches have the highest losses. Nevertheless, there are important differences in projected losses between beaches; some have mean losses below ten thousand dollars a year while others over half a million. This mismatch is important to consider when planning adaptation measures, because more resourceful (poorer) communities may face smaller (larger) threats. It should be noted, that WTP may also differ by beach, but because no WTP study has been conducted for the country, we cannot account for these potential differences.
Although no public statistics on visitor spending or economic activity are available at the beach level, the losses are small compared to the available data. For example, Gonzalez et al. [37] report that visitor of the Coquimbo region (La Serena, La Herradura, Guanaqueros, Tongoy, Los Vilos and Pichidangui beaches) spent USD 59.5 million in 2017, compared to annual losses of USD 1.7 and 0.9 million in the mid-century and end-of-the century projections, respectively. This comparison should be made with care since this expenditure includes other areas in the region.
Likewise, a better estimation of beach visitors would bring a more accurate total benefit loss. In addition, because nearby beaches represent close substitutes, future studies should consider the combined effects of reducing the size of groups of beaches in the contingent behavior question of the survey. Another issue of concern is beach erosion’s aggregate effect on WTP. The values used do not consider this potentially significant effect given by non-marginal changes in multiple beach widths. Therefore, a more detailed analysis should be conducted to consider the qualitative difference in valuation that may arise from the losses in all beaches.

6. Conclusions

The present study relates projections of coastal erosion and economic losses on 45 beaches covering 1960 km of Chilean coastline. Based on the mid-century RCP 8.5 scenario, shoreline retreat would be between 2 and 13 m (0.05–0.33 m/y), while for the end-of-century projection, the reduction would be between 10 and 53 m (0.25–1.33 m/y), all figures depending on the combinations of sediment size and berm height. A mild counterclockwise rotation of long beaches is also expected. Likewise, by mid-century, the reduction in beach width will be between 4.3% and 41.3%, implying a total annual loss of USD 5.6 [5.1–6.1] million. By the end of the century, the range of beach width reduction is more significant (8.4%–100%), implying a total annual loss of USD 10.5 [8.1–11.8] million. Additionally, by the end-of-century, 13–25 beaches could disappear, implying potential economic, social, and environmental impacts.
The variety in type (urban, periurban, rural, and industrial), shape (embayed, rectilinear), latitudinal difference, and local conditions makes us think that these results are representative of the nearly 1172 beaches in Chile. However, further research is needed to combine the local effects of the seismic cycle and SLR, as well as other phenomena characterizing the Chilean coasts. As for anthropogenic causes, particular attention should be given to activities triggering erosion, given their repercussions on massive sun and beach tourism which is gradually expanding to more rural beaches. While urban beach loss can be alleviated with sediment management practices, rural beaches should be devoted to soft uses (e.g., ecotourism), with little or no hard infrastructure needs. We hope that this study helps in the definition of future guidelines for a sustainable management of sandy beaches threatened by SLR.

Supplementary Materials

The following supporting information can be downloaded at: https://www.mdpi.com/article/10.3390/su15075883/s1. Figures S1–S5. Reference [48] is also added in Supplementary File.

Author Contributions

Conceptualization, P.W., R.A.M. and O.M.; methodology, P.W., R.A.M. and O.M.; software, C.E.; formal analysis, P.W., R.A.M., O.M., C.E. and M.I.S.; data curation, R.A.M., C.E. and M.I.S.; draft preparation, P.W., O.M., and C.M.; review and editing, P.W. and O.M.; project administration, P.W. All authors have read and agreed to the published version of the manuscript.

Funding

This work was supported by the Ministry of Environment (Chile) via the project “Determinación del Riesgo de los Impactos del Cambio Climático en las Costas de Chile” (R.E. N°568, 11 July 2018).

Informed Consent Statement

The authors declare no potential conflicts of interest with respect to the research, authorship, and/or publication of this article.

Acknowledgments

The authors acknowledge the support of Research Center for Integrated Disaster Risk Management: ANID/1522A0005 FONDAP 2022 and ANID/Millennium Science Initiative Program–ICN2019_015. C.M. acknowledges FONDECYT 1200306. This research was partially supported by the supercomputing infrastructure of the NLHPC (ECM-02).

Conflicts of Interest

The authors declare no conflict of interest.

References

  1. Ranasinghe, R.; Stive, M. Rising seas and retreating coastlines. Clim. Chang. 2009, 97, 465–468. [Google Scholar] [CrossRef] [Green Version]
  2. Chust, A.; Caballero, A.; Marcos, M.; Liria, P.; Hernández, C.; Borja, A. Regional scenarios of sea level rise and impacts on Basque (Bay of Biscay) coastal habitats, throughout the 21st century. Estuar. Coast. Shelf Sci. 2010, 87, 113–124. [Google Scholar] [CrossRef] [Green Version]
  3. Masselink, G.; Castelle, B.; Scott, T.; Dodet, G.; Suanez, S.; Jackson, D.; Floc’h, F. Extreme wave activity during 2013/2014 winter and morphological impacts along the Atlantic coast of Europe. Geophys. Res. Lett. 2016, 43, 2135–2143. [Google Scholar] [CrossRef]
  4. Uyarra, M.C.; Cote, I.M.; Gill, J.A.; Tinch, R.R.; Viner, D.; Watkinson, A.R. Islands pecific preferences of tourists for environmental features: Implications of climate change for tourism-dependent states. Environ. Conserv. 2005, 32, 11–19. [Google Scholar] [CrossRef] [Green Version]
  5. Bird, E.C. World-wide trends in sandy shoreline changes during the past century. Géographie Phys. Et Quat. 2011, 35, 241–244. [Google Scholar] [CrossRef] [Green Version]
  6. Vitousek, S.; Barnard, P.; Limber, P. Can beaches survive climate change? J. Geophys. Res. Earth Surf. 2017, 122, 1060–1067. [Google Scholar] [CrossRef]
  7. Luijendijk, A.; Hagenaars, G.; Ranasinghe, R.; Baart, F.; Donchyts, G.; Aarninkhof, S. The State of the World’s Beaches. Sci. Rep. 2018, 8, 6641. [Google Scholar] [CrossRef]
  8. Vousdoukas, M.; Ranasinghe, R.; Mentaschi, L.; Plomaritis, T.; Athanasiou, P.; Luijendijk, A.; Feyen, L. Sandy coastlines under threat of erosion. Nat. Clim. Chang. 2020, 10, 260–263. [Google Scholar] [CrossRef]
  9. Cooper, A.; Masselink, G.; Coco, G.; Short, A.; Castelle, B.; Rogers, K.; Anthony, E.; Green, A.; Kelly, J.; Pilkey, O.; et al. Sandy beaches can survive sea-level rise. Nat. Clim. Chang. 2020, 10, 993–995. [Google Scholar] [CrossRef]
  10. Bagheri, M.; Zaiton Ibrahim, Z.; Bin Mansor, Z.; Abd Manaf, L.; Badarulzaman, N.; Vaghefi, N. Shoreline change analysis and erosion prediction using historical data of Kuala Terengganu, Malaysia. Environ. Earth Sci. 2019, 78, 477. [Google Scholar] [CrossRef]
  11. Jiménez, J.; Sancho-García, A.; Bosom, E.; Valdemoro, E.; Guillén, J. Storm-induced damages along the Catalan coast (NW Mediterranean) during the period 1958–2008. Geomorphology 2012, 143–144, 24–33. [Google Scholar] [CrossRef]
  12. Drius, M.; Bongiorni, L.; Depellegrin, D.; Menegon, S.; Pugnetti, A.; Stifter, S. Tackling challenges for Mediterranean sustainable coastal tourism: An ecosystem service perspective. Sci. Total Environ. 2019, 652, 1302–1317. [Google Scholar] [CrossRef]
  13. Silvestri, F. The Impact of Coastal Erosion on Tourism: A Theoretical Model. Theor. Econ. Lett. 2018, 8, 806–813. [Google Scholar] [CrossRef] [Green Version]
  14. Manning, R.E.; Lawson, S.R. Carrying capacity as “informed judgment”: The values of science and the science of values. Environ. Manag. 2002, 30, 157–168. [Google Scholar] [CrossRef] [PubMed]
  15. Jennings, S. Coastal Tourism and Shoreline Management. Ann. Tour. Res. 2004, 31, 899–922. [Google Scholar] [CrossRef]
  16. Botero, C.; Hurtado, Y. Tourist Beach Sorts as a classification tool for Integrated Beach Management in Latin America. EUCC—Die Küsten Union Dtschl. e.V. 2009, 13, 133–142. [Google Scholar]
  17. Botero, C.; Noguera, L.; Zielinski, S. Selección por recurrencia de los parámetros de calidad ambiental y turística de los esquemas de certificación de playas en América Latina. Rev. Intrópica 2012, 7, 59–68. [Google Scholar]
  18. Zielinski, S.; Botero, C. Are eco-labels sustainable? Beach certification schemes in Latin America and the Caribbean. J. Sustain. Tour. 2015, 23, 1550–1572. [Google Scholar] [CrossRef]
  19. Dragani, W.; Bacinob, G.; Alonso, G. Variation of population density on a beach: A simple analytical formulation. Ocean Coast. Manag. 2021, 208, 105589. [Google Scholar] [CrossRef]
  20. Nelson, C.; Botterill, D. Evaluating the contribution of beach quality awards to the local tourism industry in Wales—The Green Coast Award. Ocean Coast. Manag. 2002, 45, 157–170. [Google Scholar] [CrossRef]
  21. Williams, A.; Rangel-Buitrago, N.; Anfuso, G.; Cervantes, O.; Botero, C. Litter impacts on scenery and tourism on the Colombian north Caribbean coast. Tour. Manag. 2016, 55, 209–224. [Google Scholar] [CrossRef]
  22. Anfuso, G.; Williams, A.; Casas Martínez, G.; Botero, C.; Cabrera Hernández, J.; Pranzini, E. Evaluation of the scenic value of 100 beaches in Cuba: Implications for coastal tourism management. Ocean Coast. Manag. 2018, 142, 173–185. [Google Scholar] [CrossRef]
  23. De Paula, D.; Lima, J.; Barros, E.; De Santos, J. Coastal Erosion and Tourism: The case of the distribution of tourist accommodations and their daily rates. Geogr. Environ. Sustain. 2021, 14, 110–120. [Google Scholar] [CrossRef]
  24. Spencer, N.; Strobl, E.; Campbell, A. Sea level rise under climate change: Implications for beach tourism in the Caribbean. Ocean Coast. Manag. 2022, 225, 106207. [Google Scholar] [CrossRef]
  25. Ruiz-Ramírez, J.D.; Euán-Ávila, J.I.; Rivera-Monroy, V.H. Vulnerability of Coastal Resort Cities to Mean Sea Level Rise in the Mexican Caribbean. Coast. Manag. 2019, 47, 23–43. [Google Scholar] [CrossRef]
  26. Duan, P.; Cao, Y.; Wang, Y.; Yinet, P. Bibliometric Analysis of Coastal and Marine Tourism Research from 1990 to 2020. J. Coast. Res. 2022, 38, 229–240. [Google Scholar] [CrossRef]
  27. Łabuz, T.A. Environmental Impacts—Coastal Erosion and Coastline Changes. In Second Assessment of Climate Change for the Baltic Sea Basin; Springer Cham: Cham, Switzerland, 2015; pp. 381–396. [Google Scholar]
  28. González, S.; Loyola, D.; Yañez-Navea, K. Perception of environmental quality in a beach of high social segregation in northern Chile: Importance of social studies for beach conservation. Ocean Coast. Manag. 2021, 207, 105619. [Google Scholar] [CrossRef]
  29. Martínez, C.; Winckler, P.; Agredano, R.; Esparza, E.; Torres, I.; Contreras-López, M. Coastal erosion in sandy beaches along a tectonically active coast: The Chile study case. Prog. Phys. Geogr. 2022, 46, 250–271. [Google Scholar] [CrossRef]
  30. Winckler, P.; Contreras-López, M.; Campos-Caba, R.; Beya, J.; Molina, M. El temporal del 8 de agosto de 2015 en las regiones de Valparaíso y Coquimbo, Chile Central. Lat. Am. J. Aquat. Res. 2017, 45, 622–648. [Google Scholar] [CrossRef]
  31. Ministerio del Medio Ambiente. Exposición De Zonas Costeras. In Determinación del Riesgo de Los Impactos del Cambio Climático en Las Costas de Chile; Centro UC Cambio Global: Santiago, Chile, 2019; Volume 2. [Google Scholar]
  32. Araya-Vergara, J. Determinación preliminar de las características del oleaje en Chile Central. Not. Mens. Mus. Nac. Hist. Nat. 1971, 174, 8–12. [Google Scholar]
  33. Beyá, J.; Álvarez, M.; Gallardo, A.; Hidalgo, H.; Aguirre, C.; Valdivia, J.; Parra, C.; Méndez, L.; Contreras, C.; Winckler, P.; et al. Atlas de Oleaje de Chile; Universidad de Valparaíso: Valparaiso, Chile, 2016; ISBN 978-956-368-194-9. Available online: https://oleaje.uv.cl/descargables/Atlas%20de%20Oleaje%20de%20Chile.pdf (accessed on 1 March 2022).
  34. Winckler, P.; Aguirre, C.; Farías, L.; Contreras-López, M.; Masotti, I. Evidence of climate-driven changes on atmospheric, hydrological, and oceanographic variables along the Chilean coastal zone. Clim. Chang. 2020, 163, 633–652. [Google Scholar] [CrossRef]
  35. SHOA. Tablas de Mare de la Costa de Chile. 2009. Available online: http://www.shoa.cl (accessed on 1 March 2022).
  36. Carvajal, M.; Contreras-Lopez, M.; Winckler, P.; Sepulveda, I. Meteotsunamis Occurring Along the Southwest Coast of South America during an Intense Storm. Pure Appl. Geophys. 2017, 174, 3313–3323. [Google Scholar] [CrossRef]
  37. González, S.A.; Holtmann-Ahumada, G. Quality of tourist beaches of northern Chile: A first approach for ecosystem-based management. Ocean Coast. Manag. 2017, 137, 154–164. [Google Scholar] [CrossRef]
  38. Tolman, H.L.; WAVEWATCH III R Development Group. User Manual and System Documentation of WAVEWATCH III °R Version 4.18; Technical Note; Environmental Modeling Center, Marine Modeling and Analysis Branch, NOAA: Washington, DC, USA, 2014. [Google Scholar]
  39. Taylor, K.E.; Stouffer, R.J.; Meehl, G.A. An Overview of CMIP5 and the experiment design. Bull. Amer. Meteor. Soc. 2012, 93, 485–498. [Google Scholar] [CrossRef] [Green Version]
  40. Hemer, M.A.; Trenham, C.E. Evaluation of a CMIP5 derived dynamical global wind wave climate model ensemble. Ocean Model. 2016, 103, 190–203. [Google Scholar] [CrossRef] [Green Version]
  41. WCRP. World Climate Research Programme. Available online: https://esgf-node.llnl.gov/search/cmip5/ (accessed on 1 March 2022).
  42. NGDC. 2-Minute Gridded Global Relief Data (ETOPO2) v2. National Geophysical Data Center, NOAA. Available online: https://www.ngdc.noaa.gov/mgg/global/etopo2.html (accessed on 1 March 2022).
  43. Wessel, P.; Smith, W.H. A global, self-consistent, hierarchical, high-resolution shoreline database. J. Geophys. Res. Solid 1996, 101, 8741–8743. [Google Scholar] [CrossRef] [Green Version]
  44. Ardhuin, F.; Rogers, E.; Babanin, A.; Filipot, J.-F.; Magne, R.; Roland, A.; Van der Westhuysen, A.; Queffeulou, P.; Lefevre, J.-M.; Aouf, L.; et al. Semiempirical dissipation source functions for ocean wave Part I: Definition, calibration and validation. J. Phys. Oceanogr. 2010, 40, 1917–1941. [Google Scholar] [CrossRef] [Green Version]
  45. Rascle, N.; Ardhuin, F. A global wave parameter database for geophysical applications. Part 2: Model validation with improved source term parameterization. Ocean Model. 2013, 70, 174–188. [Google Scholar] [CrossRef] [Green Version]
  46. Hasselmann, S.; Hasselmann, K.; Allender, J.; Barnett, T. Computatuons and parameterizations of the nonlinear energy transfer in gravity-wave spectrum, part II: Parameterizations of the nonlinear energy transfer for application in wave models. J. Phys. Oceanogr. 1985, 15, 1378–1392. [Google Scholar] [CrossRef]
  47. Beyá, J.; Álvarez, M.; Gallardo, A.; Hidalgo, H.; Winckler, P. Generation and validation of the Chilean Wave Atlas database. Ocean Model. 2017, 116, 16–32. [Google Scholar] [CrossRef]
  48. Winckler, P.; Contreras-López, M.; Garreaud, R.; Meza, F.; Larraguibel, C.; Esparza, C.; Gelcich, S.; Falvey, M.; Mora, J. Analysis of Climate-Related Risks for Chile’s Coastal Settlements in the ARClim Web Platform. Water 2022, 14, 3594. [Google Scholar] [CrossRef]
  49. Booij, N.; Holthuijsen, L.H.; Ris, R.C. The “SWAN” Wave Model for Shallow Water. In Coastal Engineering; OJS/PKP: Phoenix, AZ, USA, 1996; pp. 668–676. [Google Scholar]
  50. Massel, S. Ocean Surface Waves: Their Physics and Prediction; Advanced Series on Ocean Engineering; World Scientific: Singapore, 1996; Volume 11. [Google Scholar]
  51. Lemos, G.; Menendez, M.; Semedo, A.; Camus, P.; Hemer, M.; Dobrynin, M.; Miranda, P.M. On the need of bias correction methods for wave climate projections. Glob. Planet. Chang. 2020, 186, 103109. [Google Scholar] [CrossRef]
  52. Saha, S.; Moorthi, S.; Pan, H.L.; Wu, X.; Wang, J.; Nadiga, S.; Tripp, P.; Kistler, R.; Woollen, J.; Behringer, D.; et al. The NCEP climate forecast system reanalysis. Bull. Amer. Meteor. 2010, 91, 1015–1058. [Google Scholar] [CrossRef] [Green Version]
  53. Dalrymple, R.A.; Dean, R.G. Water Wave Mechanics for Engineers and Scientists; Advanced Series on Ocean Engineering; World Scientific: Singapore, 1991; Volume 2. [Google Scholar]
  54. Church, J.A.; Clark, P.U.; Cazenave, A.; Gregory, J.M.; Jevrejeva, S.; Levermann, A.; Merrifield, M.A.; Milne, G.A.; Nerem, R.S.; Nunn, P.D.; et al. Chapter 13—Sea Level Change. In Climate Change 2013: The Physical Science Basis; Contribution of Working Group I to the Fifth Assessment Report of the Intergovernmental Panel on Climate Change; Cambridge University Press: New York, NY, USA, 2013; Volume 13, pp. 1137–1216. [Google Scholar]
  55. Slangen, A.B.A.; Carson, M.; Katsman, C.A.; Van de Wal, R.S.W.; Köhl, A.; Vermeersen, L.L.A.; Stammer, D. Projecting twenty-first century regional sea-level changes. Clim. Chang. 2014, 124, 317–332. [Google Scholar] [CrossRef]
  56. Short, A.D.; Masselink, G. Embayed and Structurally Controlled Beaches. In Handbook of Beach and Shoreface Morphodynamics; Short, A.D., Ed.; John Wiley: Chichester, UK, 1999; pp. 230–249. [Google Scholar]
  57. Bruun, P. Sea-level rise as a cause of shore erosion. J. Waterw. Harb. Div. 1962, 88, 117–130. [Google Scholar] [CrossRef]
  58. Birkemeier, W.A. Field data on seaward limit of profile change. J. Waterw. Port Coast. Ocean Eng. 1985, 111, 598–602. [Google Scholar] [CrossRef] [Green Version]
  59. Dean, R.G. Coastal Sediment Processes: Toward Engineering Solutions. In Coastal Sediments ’87, Proceedings of a Specialty Conference on Advances in Understanding of Coastal Sediment Processes, New Orleans, LA, USA, 12–14 May 1987; American Society of Civil Engineers: New York, NY, USA, 1987. [Google Scholar]
  60. Enriquez-Acevedo, T.; Botero, C.M.; Cantero-Rodelo, R.; Pertuz, A.; Suarez, A. Willingness to pay for Beach Ecosystem Services: The case study of three Colombian beaches. Ocean Coast. Manag. 2018, 161, 96–104. [Google Scholar] [CrossRef]
  61. Raheem, N.; Colt, S.; Fleishman, E.; Talberth, J.; Swedeen, P.; Boyle, K.J.; Rudd, M.; Lopez, R.D.; Crocker, D.; Bohan, D.; et al. Application of non-market valuation to California’s coastal policy decisions. Mar. Policy 2012, 36, 1166–1171. [Google Scholar] [CrossRef]
  62. Landry, C.E.; Keeler, A.G.; Kriesel, W. An economic evaluation of beach erosion management alternatives. Mar. Resour. Econ. 2003, 18, 105–127. [Google Scholar] [CrossRef]
  63. Landry, C.E.; Hindsley, P. Valuing beach quality with hedonic property models. Land Econ. 2011, 87, 92–108. [Google Scholar] [CrossRef]
  64. Gopalakrishnan, S.; Smith, M.D.; Slott, J.M.; Murray, A.B. The value of disappearing beaches: A hedonic pricing model with endogenous beach width. J. Environ. Econ. Manag. 2011, 61, 297–310. [Google Scholar] [CrossRef] [Green Version]
  65. Parsons, G.R.; Chen, Z.; Hidrue, M.K.; Standing, N.; Lilley, J. Valuing Beach Width for Recreational Use: Combining Revealed and Stated Preference Data. Mar. Resour. Econ. 2013, 28, 221–241. [Google Scholar] [CrossRef]
  66. Huang, J.C.; Poor, P.J.; Zhao, M.Q. Economic valuation of beach erosion control. Mar. Resour. Econ. 2007, 22, 221–238. [Google Scholar] [CrossRef]
  67. Desvousges, W.H.; Naughton, M.C.; Parsons, G.R. Benefit transfer: Conceptual problems in estimating water quality benefits using existing studies. Water Resour. Res. 1992, 28, 675–683. [Google Scholar] [CrossRef] [Green Version]
  68. Johnston, R.J.; Ramachandran, M.; Parsons, G.R. Benefit Transfer Combining Revealed and Stated Preference Data. In Benefit Transfer of Environmental and Resource Values; Springer Dordrecht: Dordrecht, The Netherlands, 2015; pp. 163–189. [Google Scholar]
  69. Servicio Nacional de Turismo (SERNATUR). Encuesta Nacional de Viajes de los Residentes de Chile. 2018. Available online: http://www.subturismo.gob.cl/turismo-interno/ (accessed on 18 December 2020).
  70. Lucero, F.; Catalán, P.A.; Ossandón, A.; Beyá, J.; Puelma, A.; Zamorano, L. Wave energy assessment in the central-south coast of Chile. Renew. Energ. 2017, 114, 120–131. [Google Scholar] [CrossRef]
  71. Aguirre, C.; García-Loyola, S.; Testa, G.; Silva, D.; Farias, L. Insight into anthropogenic forcing on coastal upwelling off south-central Chile. Elem. Sci. Anth. 2018, 6, 59. [Google Scholar] [CrossRef]
  72. Rykaczewski, R.R.; Dunne, J.P.; Sydeman, W.J.; García-Reyes, M.; Black, B.A.; Bograd, S.J. Poleward displacement of coastal upwelling-favorable winds in the ocean’s eastern boundary currents through the 21st century. Geophys. Res. Lett. 2015, 42, 6424–6431. [Google Scholar] [CrossRef]
  73. Sierra, J.P.; Casas-Prat, M. Analysis of potential impacts on coastal areas due to changes in wave conditions. Clim. Chang. 2014, 124, 861–876. [Google Scholar] [CrossRef] [Green Version]
  74. Ranasinghe, R. Assessing climate change impacts on open sandy coasts: A review. Earth Sci. Rev. 2016, 160, 320–332. [Google Scholar] [CrossRef] [Green Version]
  75. Winckler, P.; Esparza, C.; Mora, J.; Agredano, R.; Contreras-López, M.; Larraguibel, C.; Melo, O.; Contreras.López, M. Impactos del Cambio Climático en Las Costas de Chile. In Hacia una Ley de Costas en Chile: Bases Para una Gestión Integrada de Áreas Litorales; Martínez, C., Arenas, F., Bergamini, K., Urrea, J., Eds.; Serie GEOlibro N°38, Instituto de Geografía, Pontificia Universidad Católica de Chile: Santiago, Chile, 2022. [Google Scholar]
  76. Albrecht, F.; Shaffer, G. Regional Sea-Level Change along the Chilean Coast in the 21st Century. J. Coast. Res. 2016, 32, 1322–1332. [Google Scholar] [CrossRef]
  77. Rangel-Buitrago, N.; Anfuso, G.; Williams, A. Coastal erosion problems along the Caribbean Coast of Colombia. Ocean Coast. Manag. 2015, 114, 120–144. [Google Scholar] [CrossRef]
  78. Cai, F.; Su, X.; Liu, J.; Li, B.; Lei, G. Coastal erosion in China under the condition of global climate change and measures for its prevention. Prog. Nat. Sci. 2009, 19, 415–426. [Google Scholar] [CrossRef]
  79. Fritz, H.M.; Petroff, C.M.; Catalán, P.A.; Cienfuegos, R.; Winckler, P.; Kalligeris, N.; Weiss, R.; Barrientos, S.E.; Meneses, G.; Valderas-Bermejo, C.; et al. Field survey of the 27 February 2010 Chile tsunami. Pure Appl. Geophys. 2011, 168, 1989–2010. [Google Scholar] [CrossRef]
  80. Poulos, A.; Monsalve, M.; Zamora, N.; de la Llera, J.C. An Updated Recurrence Model for Chilean Subduction Seismicity and Statistical Validation of Its Poisson Nature. Bull. Seismol. Soc. Am. 2019, 109, 66–74. [Google Scholar] [CrossRef]
  81. Schurr, B.; Asch, G.; Rosenau, M.; Wang, R.; Oncken, O.; Barrientos, S.; Vilotte, J.P. The 2007 M7.7 Tocopilla Northern Chile Earthquake Sequence: Implications for Along-strike and Downdip Rupture Segmentation and Megathrust Frictional Behavior. J. Geophys. Res. Solid. 2012, 117, 1–19. [Google Scholar] [CrossRef] [Green Version]
  82. Sepúlveda, I.; Haase, J.; Liu, P.L.-F.; Grigoriu, M.; Winckler, P. Non-stationary Probabilistic Tsunami Hazard Assessments Incorporating Climate-change-driven Sea Level Rise and Application to South China Sea. Earth’s Future 2021, 9, e2021EF002007. [Google Scholar] [CrossRef]
  83. Cooper, J.A.G.; Pilkey, O.H. Sea-level rise and shoreline retreat: Time to abandon the Bruun Rule. Glob. Planet. Chang. 2004, 43, 157–171. [Google Scholar] [CrossRef]
  84. Rosati, J.D.; Dean, R.G.; Walton, T.L. The modified Bruun Rule extended for landward transport. Mar. Geol. 2013, 340, 71–81. [Google Scholar] [CrossRef] [Green Version]
  85. Toimil, A.; Losada, I.J.; Camus, P.; Diaz-Simal, P. Managing coastal erosion under climate change at the regional scale. Coast. Eng. 2017, 128, 106–122. [Google Scholar] [CrossRef]
  86. Toimil, A.; Camus, P.; Losada, I.J.; Le Cozannet, G.; Nicholls, R.J.; Idier, D.; Maspataud, A. Climate change-driven coastal erosion modelling in temperate sandy beaches: Methods and uncertainty treatment. Earth Sci. Rev. 2020, 202, 103110. [Google Scholar] [CrossRef]
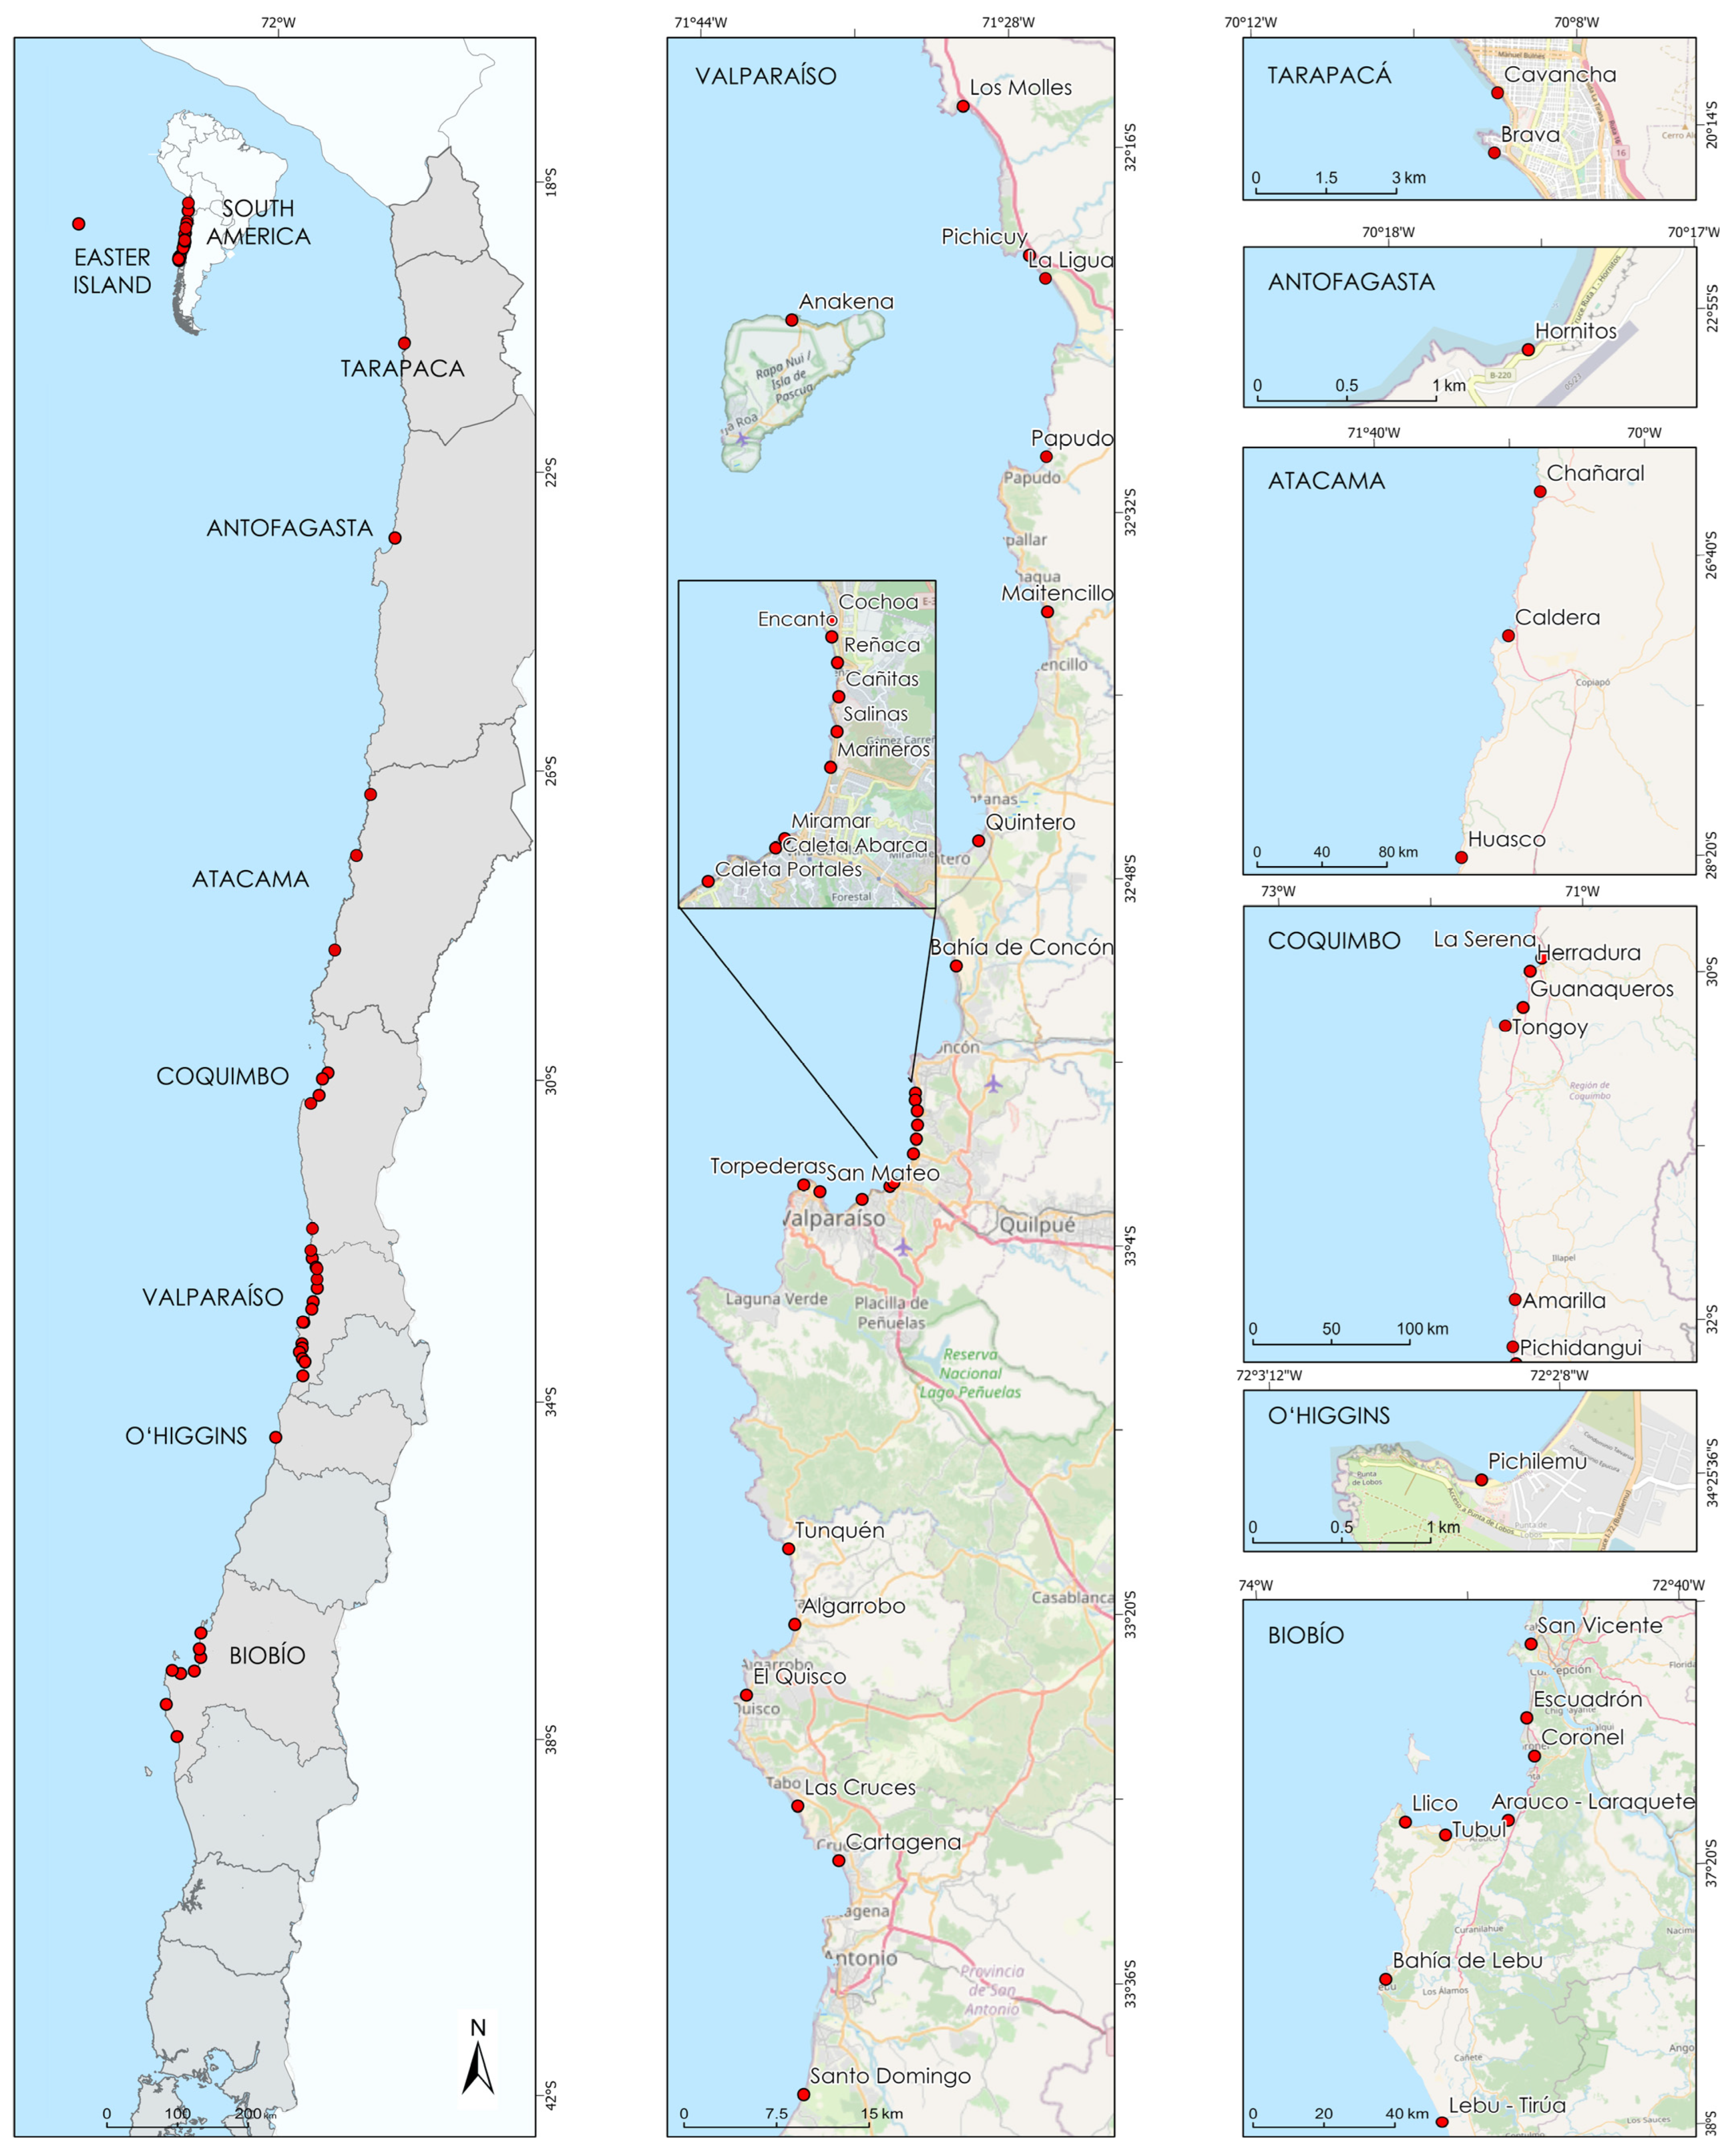
Figure 1. Location of the 45 beaches analyzed in this study.
Sustainability 15 05883 g001
Figure 2. Wave climate projections in the Pacific Ocean, as obtained from 6 GCMs. (a) Model and temporal ensemble median of the significant wave height exceeded 12 h a year H s 12 in the Pacific Ocean from 6 GCMs for the historical period (1985–2004). (b,c) show changes in H s 12 between the RCP 8.5 mid-century (2026–2045) and end-of-century projections (2081–2100) with respect to the historical period (1985–2004), respectively.
Sustainability 15 05883 g002
Figure 3. Wave climate projections offshore continental Chile, as obtained from 6 GCMs. (ac) show the significant wave height exceeded 12 h a year H s 12 , the mean period T m and the mean direction θ m along the Chilean coastal zone. Plots on the left show the temporal median of each of the 6 GCMs in dashed colored lines and the model median in black lines for the historical period (1985–2004). Central and right plots show the differences between the mid- and the end-of-century projections with the historical period.
Sustainability 15 05883 g003
Figure 4. RCP 8.5 mid-century (2026–2045) and end-of-century (2081–2100) projections of mean sea level for the historical period (1986–2005), based on 20 GCMs, in Valparaíso. The gray line corresponds to the median and the gray shade encloses the range of GCMs. The model and temporal medians are shown in red lines. The temporal medians of the upper and lower envelopes of the projections are depicted in red-dotted lines.
Sustainability 15 05883 g004
Figure 5. Projection of shoreline retreat in continental beaches for the RCP 8.5 mid-century projection (2026–2045) with respect to the historical period (1985–2004) in both meters and as percentage of the historical average beach width, as shown in Table 1. Retreat per location is shown in (a) while the corresponding histograms are shown in (b). Plots are calculated for a grain size of D 50 = 0.3 mm and berm heights of B = 1, 2, 3, and 4 m. Pink diamonds represent beaches where sediment size and berm height were measured in situ. Colored diamonds represent Hornitos (22.92° S), where only sediment size was measured. Main cities or sites are included in the map.
Sustainability 15 05883 g005
Figure 6. Projection of shoreline retreat in continental beaches for the RCP 8.5 end-of-century projection (2081–2100) with respect to the historical period (1985–2004) in both meters and as percentage of the historical average beach width, as shown in Table 1. Retreat per location is shown in (a) while the corresponding histograms are shown in (b). Plots are calculated for a grain size of D 50 = 0.3 mm and berm heights of B = 1, 2, 3, and 4 m. Pink diamonds represent beaches where sediment size and berm height were measured in situ. Colored diamonds represent Hornitos (22.92° S), where only sediment size was measured. Main cities or sites are included in the map.
Sustainability 15 05883 g006
Figure 7. Projection of shoreline rotation in continental beaches for the RCP 8.5 mid-century projection (2026–2045) with respect to the historical period (1985–2004) in degrees. Main cities or sites are included in the map.
Sustainability 15 05883 g007
Figure 8. Sketch showing some of the relevant processes and the expected response of the shoreline (not on scale). Patterns of typical wave direction are depicted.
Sustainability 15 05883 g008
Table 1. Selected beaches and principal attributes. Type is classified as urban (U), periurban (PU), rural (R), and industrial (I). A range of angles for the orientation are included when there were significant changes within a beach. For sediment size ( D 50 ) and berm height ( B ), the symbol ✘ means beaches no information was available.
#BeachLat
(° S)
Lon
(° W)
TypeShapeLength
(m)
Width
(m)
D 50 B Area
(m2)
Orientation
(° N)
1Cavancha20.2370.15UEmbayed94056–11078,020240°
2Brava20.2470.15URectilinear279562–117250,15380°
3Hornitos22.9270.29REmbayed640039–1470.12595,200281°
4Chañaral26.3070.65UEmbayed514724–35151,837220°
5Caldera27.1070.86U, PUEmbayed618147–98448,123300°
6Huasco28.3371.17REmbayed357044–74210,630275°
7La Serena29.9671.32UEmbayed18,85044–1081,214,620266°–330°
8La Herradura29.9871.36UEmbayed157426–9578,800325°
9Guanaqueros30.2971.53U, PUEmbayed590025–86382,596325°
10Tongoy30.1971.40UEmbayed11,63028–32367,625337°
11Los Vilos31.8771.50PUEmbayed278053–70170,97065°
12Pichidangui32.1271.51PUEmbayed299620–61122,252315°
13Los Molles32.2471.51PUEmbayed146020–8042,245199°
14Pichicuy32.3471.45PUEmbayed218410–120129,128228°
15La Ligua32.3671.43PUEmbayed580030–50232,000230°
16Papudo32.4971.43UEmbayed212930–5085,160310°
17Maitencillo32.5971.45UEmbayed22413–253483335°
18Quintero32.7871.50IEmbayed736013–85215,458252°–340°
19Concón32.8671.51R, PURectilinear10,39210–132504,547264°–270°
20Cochoa32.9671.55UEmbayed16011–463214315°
21El Encanto32.9671.55URectilinear2329–265494257°
22Reñaca32.9771.55URectilinear130020–700.503.5470,488264°
23Las Cañitas32.9871.55PUEmbayed18513–284193275°
24Las Salinas32.9971.55UEmbayed19020–400.632.747324290°
25Los Marineros33.0071.55URectilinear268025–680.754.54125,889278°–300°
26Miramar33.0271.57UEmbayed14714–211517325°
27Caleta Abarca33.0271.57URectilinear42018–3311,570312°
28Caleta Portales33.0371.59URectilinear6330–830.423.3711,718330°
29Torpederas33.0271.64UEmbayed9538–380.503.003460333°
30Tunquén33.2971.66REmbayed218410–6871,252241°
31Algarrobo33.3671.66UEmbayed248439–97153,137275°
32El Quisco33.3971.69UEmbayed105043–10765,410295°
33Las Cruces33.4771.65PUEmbayed37647–5314,161224°
34Cartagena33.5271.61U, PUEmbayed445610–90193,372230°–266°
35St. Domingo33.6971.65U, PURectilinear21,80710–88513,612285°–305°
36Pichilemu34.4372.04PUEmbayed420110–90230,996287°–333°
37San Vicente36.7673.14I, PUEmbayed54606–41133,622313°–348°
38Escuadrón36.9573.17U, PURectilinear855525–40278,347286°
39Playa Blanca37.0373.15PUEmbayed179020–10792,248293°
40Tubul37.2373.44PUEmbayed12279–5241,25050°
41Llico37.1873.56RRectilinear225725–4470,51025°
42Arauco37.2473.31U, PURectilinear12,65849–86696,862322°
43Bahía de Lebu37.5973.65PUEmbayed286268–126270,026310°
44Lebu–Tirúa37.8873.54REmbayed428343–1300.606.50349,227264°
45Anakena27.07109.32REmbayed24112–407273344°
Table 2. Willingness to pay (WTP) values adjusted for changes in proportional beach width per trip per household.
Type of TripChange in Beach WidthAdjusted WTP
(USD)
Short trip1% Decrease−0.84
1% Increase0.46
Long trip
(more than four nights)
1% Decrease−2.07
1% Increase1.14
Table 3. Costs associated with the percentage of beach reduction R for mid-century projection (2026–2045). Maximum ( D 50 = 0.15 mm and B = 1 m) and minimum values of R (%) ( D 50 = 0.8 mm and B = 4 m) are also included.
Beach ReductionCosts
R (%) Thousands of USD/y
#BeachMinMeanMaxMinMeanMax
1Cavancha11.16.72.2120.0115.2110.3
2Brava10.36.22.0139.1133.8128.5
3Hornitos12.410.38.28.88.78.5
4Chañaral36.121.77.372.564.957.2
5Caldera14.99.03.061.258.054.9
6Huasco18.611.23.89.28.78.1
7La Serena14.99.03.1439.0416.5394.0
8La Herradura18.711.33.9151.2141.8132.3
9Guanaqueros20.612.44.3153.6143.2132.9
10Tongoy38.323.18.0176.1156.8137.5
11Los Vilos19.211.64.030.228.326.4
12Pichidangui29.217.76.232.829.826.9
13Los Molles23.714.45.037.434.631.8
14Pichicuy18.211.13.935.833.631.4
15La Ligua29.718.06.339.235.732.2
16Papudo29.718.06.3219.3199.5179.7
17Maitencillo62.637.913.3274.9233.2191.5
18Quintero24.314.75.2210.2194.0177.8
19Concón16.810.23.6114.4108.0101.5
20Cochoa41.925.48.9139.0122.9106.7
21El Encanto68.241.314.5164.8138.5112.2
22Reñaca8.48.48.4106.2106.2106.2
23Las Cañitas58.235.312.4155.0132.6110.1
24Las Salinas11.611.611.6109.3109.3109.3
25Los Marineros5.55.55.5103.4103.4103.4
26Miramar68.241.414.6164.8138.6112.3
27Caleta Abarca46.828.410.0143.9125.8107.8
28Caleta Portales10.510.510.5108.3108.3108.3
29Torpederas10.510.510.5108.3108.3108.3
30Tunquén30.618.66.5351.9319.5287.1
31Algarrobo17.510.63.8316.7298.1279.5
32El Quisco15.99.73.4312.3295.5278.6
33Las Cruces23.914.55.1333.7308.5283.2
34Cartagena23.814.55.1333.7308.5283.2
35St. Domingo24.314.85.2334.9309.2283.5
36Pichilemu45.527.79.8175.5154.0132.5
37San Vicente24.615.05.541.938.735.5
38Escuadrón52.732.311.851.444.537.6
39Playa Blanca38.223.48.646.541.536.5
40Tubul19.612.04.427.025.323.6
41Llico40.825.09.131.828.324.7
42Arauco36.122.18.130.827.624.4
43Bahía de Lebu4.34.34.323.623.623.6
44Lebu–Tirúa12.67.72.825.524.423.2
45Anakena12.57.52.534.032.531.0
Total609956185136
Table 4. Costs associated with the percentage of beach reduction R for end-of-century projection (2081–2100). Maximum ( D 50 = 0.15 mm and B = 1 m) and minimum values of R (%) ( D 50 = 0.8 mm and B = 4 m) are also included.
Beach ReductionCosts
R (%) Thousands of USD/y
#BeachMinMeanMaxMinMeanMax
1Cavancha52.029.59.1215.8 183.9 154.8
2Brava47.827.28.4244.8 210.7 179.6
3Hornitos58.947.837.316.4 15.3 14.2
4Chañaral100.0100.032.4140.0 140.0 92.7
5Caldera71.640.312.8120.2 98.2 79.0
6Huasco93.551.716.219.8 15.5 11.9
7La Serena71.540.413.0861.6 705.0 567.3
8La Herradura94.252.116.4325.2 254.6 194.9
9Guanaqueros100.058.018.1334.9 264.5 197.8
10Tongoy100.0100.035.1334.9 334.9 226.1
11Los Vilos96.653.316.965.5 51.1 39.0
12Pichidangui100.087.226.466.6 62.3 42.1
13Los Molles100.068.021.279.5 66.8 48.2
14Pichicuy90.750.416.275.8 59.8 46.2
15La Ligua100.088.826.979.5 75.1 50.5
16Papudo100.089.127.0444.4 420.1 282.3
17Maitencillo100.0100.061.6444.4 444.4 359.1
18Quintero100.070.221.9444.4 378.2 271.0
19Concón82.146.114.9234.5 188.1 148.0
20Cochoa100.0100.039.4257.6 257.6 179.6
21El Encanto100.0100.068.4257.6 257.6 216.9
22Reñaca37.037.037.0176.4 176.4 176.4
23Las Cañitas100.0100.057.0257.6 257.6 202.2
24Las Salinas52.852.852.8196.8 196.8 196.8
25Los Marineros23.523.523.5159.1 159.1 159.1
26Miramar100.0100.068.6257.6 257.6 217.1
27Caleta Abarca100.0100.044.7257.6 257.6 186.3
28Caleta Portales47.447.447.4189.8189.8189.8
29Torpederas47.447.447.4189.8189.8189.8
30Tunquén100.092.628.2708.2 682.2 453.9
31Algarrobo86.648.415.7660.8 525.5 409.7
32El Quisco77.043.414.2626.7 507.8404.3
33Las Cruces100.068.821.7708.2597.7430.8
34Cartagena100.068.821.7708.2597.6430.8
35St. Domingo100.070.422.2708.2603.4432.6
36Pichilemu100.0100.044.4317.2317.2229.0
37San Vicente100.073.023.888.476.554.7
38Escuadrón100.0100.054.788.488.468.4
39Playa Blanca100.0100.038.288.4 88.4 61.1
40Tubul100.056.118.859.4 46.4 35.3
41Llico100.0100.041.259.4 59.4 41.9
42Arauco100.0100.036.059.4 59.4 40.4
43Bahía de Lebu27.427.427.437.9 37.9 37.9
44Lebu–Tirúa60.234.912.147.6 40.1 33.3
45Anakena58.433.210.663.0 53.0 44.0
Total11,778 10,549 8127
Disclaimer/Publisher’s Note: The statements, opinions and data contained in all publications are solely those of the individual author(s) and contributor(s) and not of MDPI and/or the editor(s). MDPI and/or the editor(s) disclaim responsibility for any injury to people or property resulting from any ideas, methods, instructions or products referred to in the content.