Article

Industry and Regional Peer Effects in Corporate Digital Transformation: The Moderating Effects of TMT Characteristics

1
School of Business Administration, University of Science and Technology Liaoning, Anshan 114051, China
2
School of Economics and Management, Liaoning University of Technology, Jinzhou 121000, China
*
Authors to whom correspondence should be addressed.
Sustainability 2023, 15(7), 6003; https://doi.org/10.3390/su15076003
Submission received: 18 February 2023 / Revised: 24 March 2023 / Accepted: 28 March 2023 / Published: 30 March 2023
(This article belongs to the Section Sustainable Management)

Abstract

:
Currently, the research on corporate digital transformation is mainly explored from the perspective of independent decision-making, but pays less attention to the interactive impact among peer firms. Taking the listed equipment manufacturing enterprises in China as its research sample, this paper uses theoretical analysis and empirical tests to test the impact of peer effect in corporate digital transformation and the moderating effect of top management team (TMT) characteristics. The results show that there are industry peer effects and regional peer effects in corporate digital transformation in which TMT characteristics play a moderating effect. Furthermore, the higher the proportion of females, the younger the average age, the higher the average education, and the longer the average tenure in TMT, the more significant the positive impact of industry peer effect and regional peer effect in corporate digital transformation. The above conclusions remain valid when using change variables, Tobit tests, lag period tests, and IV methods for robustness tests. Further analysis of the results shows that there is a non-linear impact between digital transformation and green technological innovation, and there are multiple mediating effects among industry and regional peer effects, digital transformation, R&D, and green technological innovation. In addition, it is necessary to further examine the social network peer effect in corporate digital transformation as well as the mechanism and economic consequences of peer effect in the future. These findings contribute to a more comprehensive understanding of the driving factors that affect the digital transformation of equipment manufacturing enterprises in China and provide new evidence and theoretical contributions for enterprises to enhance the efficiency of digital transformation and strengthen the construction of a TMT.

1. Introduction

In order to improve the systems and mechanisms for the market allocation of production factors in China, data have been defined as a new type of productivity. The integration of digital technology and the real economy is bound to bring opportunities for China’s economic growth. A large number of literature research studies have shown that digital transformation has an important impact on improving productivity [1,2,3]; changing organizational and operational models [4]; enhancing corporate performance [5,6], innovation, and entrepreneurship [7,8,9,10,11,12,13,14]; and gaining a competitive advantage [15,16,17]. The equipment manufacturing industry is the engine that drives the high-quality development of China’s economy. Accelerating the digital transformation of equipment manufacturing enterprises is an important factor to improve the quality of economic growth and maintain stable and rapid economic development. Therefore, what are the driving factors for digital transformation of equipment manufacturing enterprises? How do these factors affect the equipment manufacturing enterprises to achieve digital transformation? Answering the above questions is very important for the equipment manufacturing enterprises to achieve sustainable development.
Peer effect is a phenomenon in which the decision-making behavior of an organization or individual changes in response to changes in peers’ decision-making behaviors in a reference group, thus exhibiting a convergence in decision-making behavior [18]. In early literature research, peer effect has been widely used in sociology [19,20] and education [21,22]. For example, Foell, Pitzer, and Nebbitt et al. (2021) have found that exposure to criminal peers and community violence has a negative impact on the mental health of adolescents [19]. Wu, Cheng, and Yang (2022) have found that peer effect increased the participation rate of Chinese farmers with men and larger-scale farmers having a greater impact on other peers [20]. Zwier, Geven, and Bol et al. (2022) have found that under the influence of peer effect, primary school students are more likely to choose to enter the same secondary school as their peers [21]. Coveney and Oosterveen (2021) have shown, through a study of college freshmen, that peer-to-peer social activities could improve college students’ grades and personal abilities [22].
In recent years, the peer effect has received wide attention in the field of corporate decision-making. Differing from traditional management theories, one of the important contributions of peer effect is that it breaks through the boundary of independent decision-making. Additionally, it brings the interactive influence of decision-making among peer firms into the study of influencing factors of corporate decision-making. Due to similar characteristics, peer firms can share information with lower communication costs and dynamically adjust their own decisions with reference to each other. The peer effect is the convergence of decision-making formed by peer firms in mutual learning and imitation. Studies have found evidence of peer effects in mergers and acquisitions [23,24], capital structure choices [25,26,27], cash holdings [28,29,30], tax avoidance [31], information disclosures [32], corporate social responsibility [33], and other financial decisions. Gu, Ben, and Lv (2022) have found that there are peer effects in M&As, which are more pronounced when economic policy is highly uncertain. Further analysis has shown that the peer effects of M&A have a negative impact on the sustainable development of companies [23]. Zhang, Yao, and Du (2021) have studied peer effects in serial M&As, finding that in order to reduce information cost and maintain competitive advantage, corporations choose to imitate or follow peer firms’ serial M&A decision-making [24]. Leary and Roberts (2014) have found that corporate capital structure decisions are affected by peer effects. When peer firms increase their leverage ratio by a standard deviation, the corporate leverage ratio increases by 11% [25]. Ajirloo and Switzer (2022) have studied that when peer firms are competitors and have at least one common customer within two years, the peer effect has a stronger impact on capital structure [26]. Fairhurst and Nam (2020) have also shown that when external corporate governance is weak, the choice of capital structure is more easily affected by peer effects [27]. Zhuang, Nie, and Wu (2022) have studied the cash holdings of peer firms and found that corporations with lower cash holdings than the median of peer firms are more likely to imitate their peers and increase their cash holdings due to peer effects [28]. Chen, Chan, and Chang (2019) have found that in order to respond to competitors, corporations will determine their own cash holdings based on their competitors’ cash holdings, and this peer effect is more obvious in corporations with high R&D investment [29]. A study by Machokoto, Chipeta, and Ibeji (2021) found that when peer firms increase cash holdings by a standard deviation, the corporate cash holdings increase by 5~7% [30]. Liang, Li, and Lu et al. (2021) have shown that the degree of tax avoidance of peer firms in the same industry or geography has a significant positive impact on their own tax avoidance behavior [31]. Seo (2021) has discovered that the level of corporate information disclosure is significantly positively affected by peer effects, especially in the case of strategic uncertainty and dependence on external financing [32]. Li and Wang (2022) have found that the degree of participation in corporate social responsibility is consistent with that of local peer firms [33]. With attention to the peer effect, Pan, Xu, and Zhu (2022) [34] have examined the impact of the spatial peer effect in digital transformation and have drawn some useful conclusions. However, there is no further research in the literature on the impact of top management team (TMT) characteristics.
The impact of TMT characteristics on corporate strategic decisions [35], especially the decision-making of digital transformation [36,37,38], has been widely noticed. Hambrick and Mason (1984) have argued that TMT characteristics to a certain extent reflect the cognitive level and values of the TMT, which influence the behavioral decisions of the corporation [39]. TMTs play a key role in the decision-making and implementation of corporate digital transformation. Firstly, TMT characteristics are closely related to managers’ risk aversion motivations, imitation motivations, and competition motivations [40]. Secondly, TMT characteristics have an important impact on information exchange and resource acquisition in corporate digital transformation [11,36]. These factors affect whether corporations choose to imitate or follow the decisions of their peer firms. In the existing research, although scholars have recognized the importance of peer-to-peer decision-making interaction in digital transformation, they have ignored the behavioral decision-making logic behind the peer effect, that is, the role that TMT features may play in the relationship between peer effect and digital transformation. Hence, in the research process of exploring whether there is a peer effect in the digital transformation of equipment manufacturing enterprises, it is necessary to introduce TMT features for theoretical analysis and empirical testing to compensate for the possible limitations of existing research. This paper intends to investigate the impact of industry and regional peer effects in digital transformation of Chinese equipment manufacturing enterprises and further test the moderating effect of TMT characteristics.
The possible contributions of this study are as follows:
Firstly, it helps to break through the perspective of corporate decision-making independence to study the drivers of digital transformation. Most existing research has studied the motivation of digital transformation based on corporate decision-making independence, such as corporate technological capability [10,11,12] and TMT characteristics [36,37,38]. From the perspective of the peer effect, the average decision-making level of peer firms’ digital transformation will have interactive effects on the digital transformation decision-making of individual corporations, which leads to the convergence of digital transformation decision-making. Analyzing the interactive influence of digital transformation from the perspective of the peer effect helps clarify the decision-making tendency of corporate digital transformation, enrich the relevant research related to the motivation of digital transformation, and provide a new perspective for investigating the decision-making of corporate digital transformation.
Secondly, it expands the identification of digital transformation in peer effects. In contrast to some scholars who have studied the spatial peer effect in digital transformation [34], this paper will identify peer effects from the perspective of the same industry and the same region, and verify whether there is an industry peer effect and a regional peer effect in the digital transformation of equipment manufacturing enterprises in China. Unlike Zhao, Ye, and Xu (2022) [41], who use first-level industry classification to measure the same industry, this paper follows the approach of Zhang, Yao, and Du (2021) and uses a three-level industry classification to measure peer firms [24]. It is also different from Liang, Li, and Lu et al. (2021) [31] who have measured peer effect according to peer firms located in the same industry and region at the same time. This paper measures the industry or regional peer firms, respectively, according to the same industry or the same region, revealing the diversity of peer effects in digital transformation and deepening the understanding of peer effects in digital transformation. Further analysis finds that the peer effect indirectly affects corporate green technology innovation by enhancing digital transformation and R&D intensity, which enriches the impact factors and consequences of corporate digital transformation.
Finally, it complements the driving factors of peer effect in digital transformation. The existing peer effect research ignores the influence of TMT characteristics on the corporate decision-making of imitating peer firms. Therefore, this paper attempts to explore the moderating effect of TMT characteristics on the peer effect in digital transformation, which will remedy the limitations of existing relevant studies. The relevant research conclusions will provide important inspiration for corporations to enhance the degree of digital transformation and optimize the construction of TMT.
The remainder of the paper is organized as follows: Section 2 puts forward the research hypotheses; Section 3 introduces the variable selection, model design, data sources, and sample selection; Section 4 contains the empirical analysis, focusing on the existence of industry and regional peer effects and the moderating effect of TMT characteristics; and Section 5 includes the conclusions and discussion.

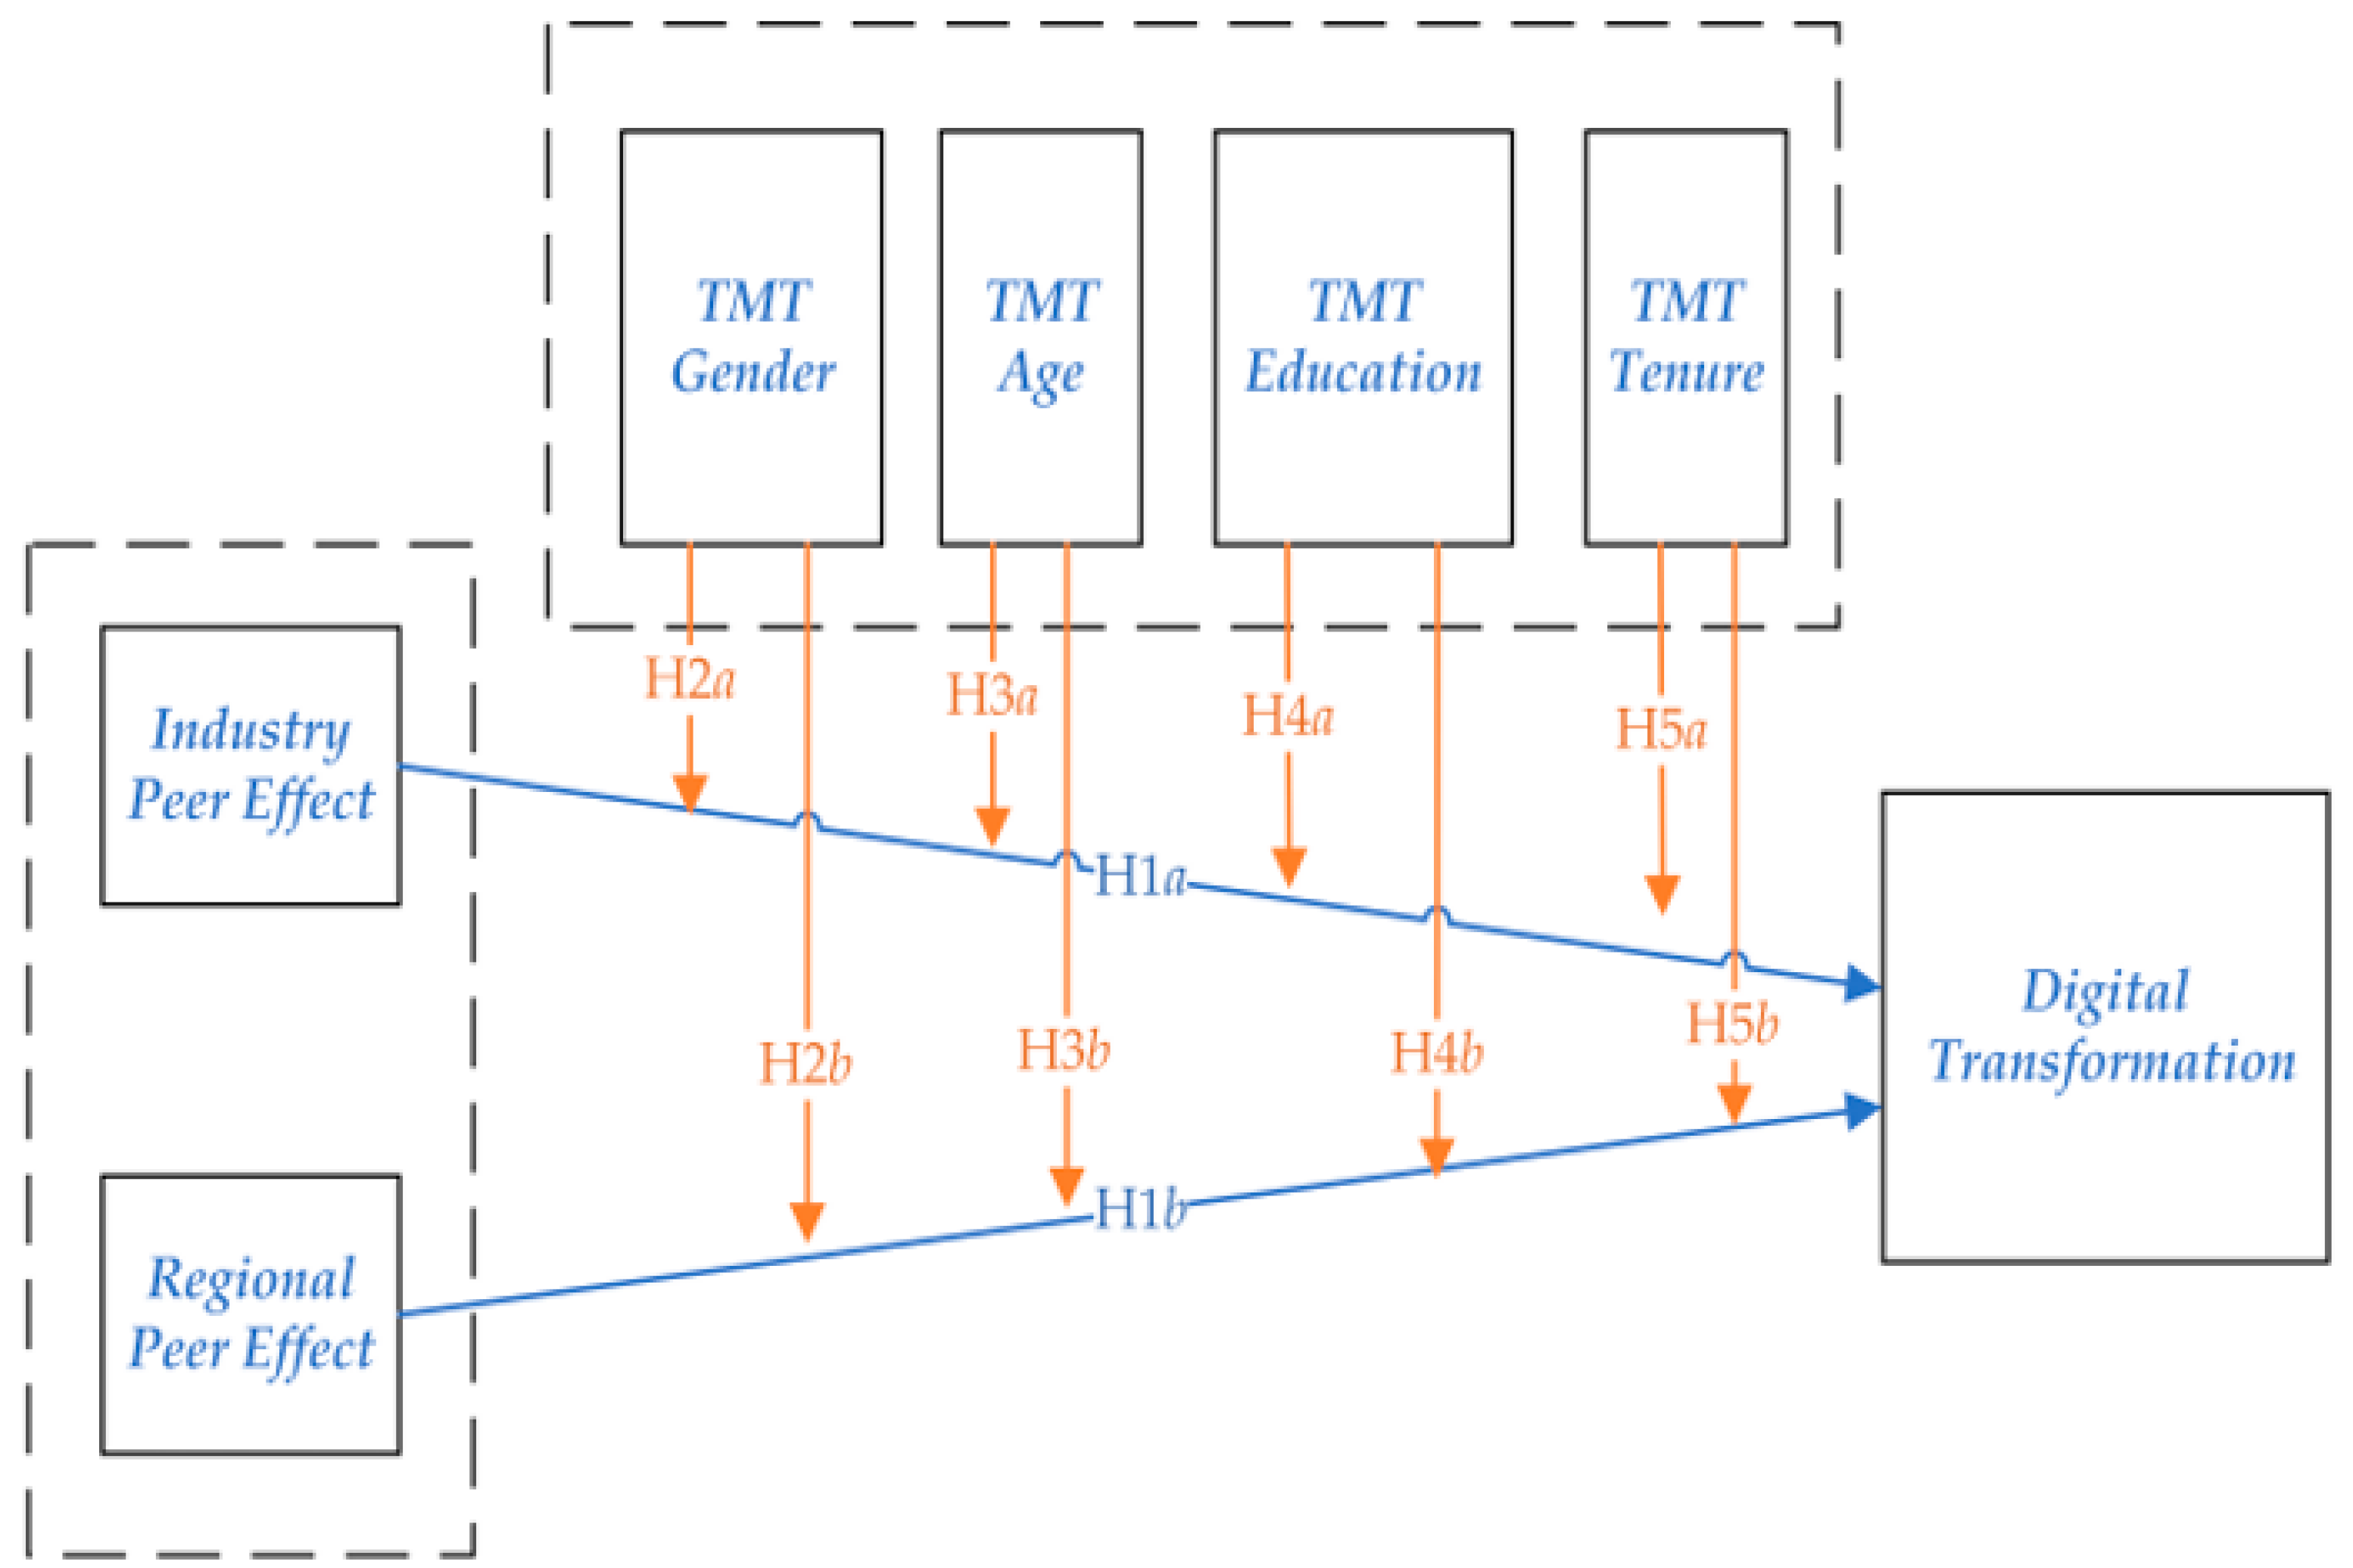
2. Hypothesis Development

2.1. Peer Effect in Digital Transformation

When making and implementing corporate decisions, corporations usually prefer to refer to their peer firms with more similar characteristics. According to social identity theory, peer groups are more likely to identify with the behavioral decisions of peers in the group because they share common interests and goals, and this preference will affect the outcome of organizational and individual behavioral decision-making. According to institutional theory, organizations tend to replicate the practices of other organizations in order to obtain or maintain social legitimacy. When enough corporations have taken certain actions, such specific actions are considered to be legitimate and effective decisions, and the likelihood of other actors taking such actions will increase significantly [42]. In particular, in the case of uncertain decision-making, managers are more likely to imitate the group behavior of peer firms in order to obtain legitimacy or maintain social identity [43,44]. According to the theory of herd behavior, in order to avoid losses from failed decisions, managers choose to simply imitate the investment behavior of other peers and ignore large amounts of private information [45]. This behavior of managers, although characterized by a certain degree of irrationality, is reasonable from the perspective of maintaining managers’ personal reputations. Unlike herd behavior, which emphasizes irrationality, the peer effect focuses more on the convergent influence of peer group behavior on organizational or individual behavior, which may be rational or irrational. Studies have shown that the channels through which peer effects affect corporate decision-making include industry peers, regional peers, and social network peers [24,31,46]. This paper focus on the impact of industry and regional peers’ decision-making on corporate digital transformation.
Industry peer firms face similar market environments and relationships between supply and demand. Therefore, imitating or referring to peer firms’ digital transformation decision-making can reduce information asymmetry and decision-making risk. According to the theory of information-based imitation, corporations will follow peer firms that are perceived to have high-quality information [47]. The digital transformation behavior of corporations with a certain reputation or competitive position in the same industry will cause other peer firms to imitate and follow, thus creating convergence in digital transformation. According to rivalry-based imitation theory, imitating competitors may be the best strategy to maintain competition or limit it [36]. In the same industry, when peer firms have achieved competitive advantage through digital transformation [10], the market power of individual corporations will be weakened if they do not adjust their strategies to implement digital transformation in time. It is evident that imitating the digital transformation decisions of rivals in the same industry can help alleviate competitive pressure. As pointed out by Zhang, Yao, and Du (2021), in order to maintain a competitive advantage, overcome information defects, avoid bankruptcy risks, maintain managers’ personal reputation, and reduce the uncertainty of decision-making and the cost of information, managers have a strong incentive to imitate the serial M&A decision-making of peer firms, leading to peer effects in serial M&As [24].
No matter what characteristics a corporation possesses, it will be influenced by its neighborhood [48]. Corporations within the same region confront identical economic, climatic, transportation, and policy environments, and even similar accumulation, business models, and management philosophies. The proximity between peer firms also facilitates the exchange of information and observation between them [49]. Under the influence of informal institutions such as culture and customs, it is easier to form consistent preferences and attitudes among peer firms in the same region, which in turn leads to the convergence of decision-making in digital transformation. At the same time, location proximity facilitates face-to-face communication and learning among regional peer firms, which helps corporations obtain relevant decision-making information at relatively lower costs and faster speeds [50]. Regional peer firms share the same language and customs, which reduces cultural and cognitive conflicts with each other and provides a linguistic context and knowledge base for the understanding of digital transformation decision-making among regional peer firms. Even hidden information can be transmitted and communicated between regional peer firms [51]. It can be seen that regional proximity and the same policy, economic, and cultural–environmental conditions can reduce cognitive conflicts, enhance trust, and promote information sharing among peer firms in the same region, thus forming the regional peer effect in digital transformation of equipment manufacturing enterprises. To sum up the analysis, within the same industry or region, corporations will choose to imitate or follow the digital transformation decision-making of their peer firms. Accordingly, the following two hypotheses are proposed:
Hypothesis 1a (H1a).
There are industry and regional peer effects in digital transformation.
Hypothesis 1b (H1b).
There are no industry and regional peer effects in digital transformation.

2.2. The Moderating Effects of TMT Gender

There are behavioral decision differences between female and male executives in terms of social interactions, risk propensities, and management styles [52,53,54]. Previous studies have concluded that female executives are more adept at social interactions. Compared to men, women are more inclined to foster interpersonal relationships and information communication, pay more attention to cooperation and sharing, and build social network relationships [55]. Therefore, female executives are more helpful in facilitating information exchange and interaction among peer firms, thus enhancing their ability to follow and imitate the digital transformation decision-making of peer firms. In addition, female executives are typically more cautious and sensitive in decision-making and prefer to avoid risks, while male executives prefer aggressive risk attitudes in decision-making [56]. Therefore, when the proportion of females in a TMT is high, the female executives’ cautious attitude towards risk and the preference for low-risk strategic decisions will strengthen the incentive for corporations to imitate the digital transformation decision-making of their peer firms. Hence, as the proportion of women in a TMT increases, the TMT is more inclined to adjust their decisions through information exchange, thereby amplifying the impact of the digital transformation of peer firms. Based on the above discussion, the following two hypotheses are proposed:
Hypothesis 2a (H2a).
A TMT’s female proportion positively moderates industry and regional peer effects in digital transformation.
Hypothesis 2b (H2b).
A TMT’s female proportion negatively moderates industry and regional peer effects in digital transformation.

2.3. The Moderating Effects of TMT Age

Younger executives and older executives tend to differ in terms of management experience, risk preference, and information acquisition and processing [57,58,59]. As Hambrick and Mason (1984) have pointed out, age to some extent reflects an executive’s experience and risk preference [39]. Older executives are more inclined to take conservative corporate strategic decisions, as they are familiar with competition, risks, and regulations in the industry [54]. While on the other hand, younger executives are better at learning and acquiring new knowledge, despite having relatively less managerial experience. As a result, when peer firms develop or implement digital transformation strategies, their strategies will inspire young executives to follow, thereby demonstrating their personal competencies. In addition, younger executives are more sensitive to the external environment [60] and possess a better ability to process and integrate information. Furthermore, younger executives display more information sensitivity and decision-making flexibility. Older executives tend to rely on decision-making paths derived from their experience and place more emphasis on the role of internal experience, which may diminish the reference value of external information. As a result, older executives may be less able to identify and reflect information about their peer firms’ decisions. In contrast, with the increase in the proportion of younger executives in TMTs, corporations are more likely to emulate and learn from the digital transformation decision-making of their peers. In summary, the following hypotheses are proposed:
Hypothesis 3a (H3a).
A TMT’s average age negatively moderates industry and regional peer effects in digital transformation.
Hypothesis 3b (H3b).
A TMT’s average age positively moderates industry and regional peer effects in digital transformation.

2.4. The Moderating Effects of TMT Education

Education can reflect the cognitive ability and knowledge range of executives to some extent [59,61,62]. Wiersema and Bantel (1992) have found that highly-educated TMTs are more willing to make strategic changes [63]. When equipped with a certain learning ability, executives are able to process various information more quickly, more objectively, and more comprehensively to make rational decisions [62,64]. At the same time, highly educated executives usually have the spirit of upward pursuit, which also helps to facilitate corporate digital transformation. When making digital transformation decisions, highly educated TMTs are more inclined to analyze the digital transformation of their peer firms from the perspective of costs and benefits and combine internal knowledge with external information to form a scientific and reasonable judgment to avoid missing opportunities or taking excessive risks. Compared with lower education, executives with higher education are more sensitive to the behaviors and decisions of competing peer firms, and usually have the ability to respond faster in fierce market environments. Therefore, when adopting digital transformation, highly educated TMTs are more inclined to refer to the digital transformation strategies of their peer firms in order to adjust their strategic policies. In summary, the following hypotheses are proposed:
Hypothesis 4a (H4a).
A TMT’s average education positively moderates industry and regional peer effects in digital transformation.
Hypothesis 4b (H4b).
A TMT’s average education negatively moderates industry and regional peer effects in digital transformation.

2.5. The Moderating Effects of TMT Tenure

Length of tenure reflects the executives’ familiarity with business operations and rich social network resources [62,65,66]. Compared to short-term executives, long-term executives usually have more stable social network resources, are better at identifying external information, are better at negotiating with stakeholders, and are more likely to reach agreements through communication [67]. Hambrick and Mason (1984) have found that the longer the tenure of executives, the better information communication and knowledge sharing within the TMT, which can reduce the over-reliance on individual decision information and avoid decision risks [39]. For executives with shorter tenure, they are more inclined to implement risk-taking behaviors in order to demonstrate their competencies. In contrast, executives with longer tenure have relatively less pressure to prove their competencies and tend to use proven strategies in the business management process [60]. Executives with longer tenure also place more emphasis on stability and intentionally avoid taking decision risks in strategic actions. Thus, based on legitimacy and reputation considerations, executives with longer tenure are more likely to learn from or refer to peer firms’ digital transformation. In summary, the following hypotheses are proposed:
Hypothesis 5a (H5a).
A TMT’s average tenure positively moderates industry and regional peer effects in digital transformation.
Hypothesis 5b (H5b).
A TMT’s average tenure negatively moderates industry and regional peer effects in digital transformation.
The research path based on the above analysis is shown in Figure 1.

3. Research Methodology

3.1. Variable Definition

3.1.1. Explained Variable

The explanatory variable is digital transformation (DTit). DTit uses the number of digital transformation keywords in the corporate annual reports plus 1 to take the logarithm measure. Referring to Verhoef, Broekhuizen, and Bart et al. (2021) [68]; Wu, Hu, and Lin et al. (2021) [69]; and Wei and Zhang (2023) [70], this paper uses the method of text analysis to select the keywords in annual reports that represent digital transformation. Firstly, the keywords of corporate digital transformation are screened and summarized from “Underlying technology architecture” and “Technology practice architecture “, in which “Underlying technology architecture” is also called “ABCD” technologies, namely Artificial Intelligence, Blockchain, Cloud Computing, and Big Data. Secondly, digital transformation keywords in the corporate annual report are matched and summarized with the Python method to count the number of keywords. Finally, the value of 1 is added to the keyword frequency of the corporate digital transformation as the logarithm.

3.1.2. Explanatory Variable

The explanatory variables are industry peer effect (Jpeer-ijt) and regional peer effect (Gpeer-igt).
Jpeer-ijt is measured with the average value of digital transformation of peer firms in industry j at year t. Gpeer-igt is measured with the average value of digital transformation of peer firms in g (provinces, autonomous regions, and municipalities directly under the Central Government) at year t. Referring to Manski (1993) [11], the calculation process is as follows:
J p e e r i j t = k j , k i D T k j t ÷ ( n j t 1 )
where the subscripts i, j, t, and k successively represent firm, industry, year, and peer firm. DTkjt is the digital transformation of peer firms in the same industry, and njt is the number of firms in the industry. Equation (2) calculates Gpeer-igt:
G p e e r i g t = k g , k i D T k g t ÷ ( n g t 1 )
where the subscripts i, g, t, and k successively represent the firm, region, year, and peer firm. DTkgt is the digital transformation of peer firms in the same industry, and ngt is the number of firms in the region.

3.1.3. Moderating Variable

TMT characteristics are measured according to gender (Genit), age (Ageit), education (Eduit), and tenure (Tenuit).
Genit represents the TMT gender characteristics of firm i at year t. Huang and Kisgen (2013) [71] and Raza-Ullah, Stadtler, and Fernandez (2023) [72] have used dummy variables to measure the TMT gender characteristic. With reference to the results of Gul, Srinidhi, and Ng (2011) [73], this paper measures the proportion of women in a TMT. The larger the value, the more prominently are females represented in the TMT.
Ageit represents the TMT age characteristic of firm i at year t. Referring to Malmendier and Tate (2005) [74] and Wang, Su, and Sun (2022) [59], the average age of all executives plus 1 is used as a logarithmic measure. The smaller the value, the younger the TMT age average.
Eduit represents the TMT education characteristic of firm i at year t. Referring to Malmendier and Tate (2005) [74]; Wang, Su, and Sun (2022) [59]; and Liu, Huang, and Kim et al. (2023) [75], the average education characteristic is measured by assigning values from 1 to 5 depending on whether the education includes other academic qualifications, specialist education, bachelor’s degrees, master’s degrees, or doctoral degrees, respectively. The higher the value, the higher the higher education level of the TMT.
Tenuit represents the TMT tenure characteristic of firm i at year t. Referring to McClelland, Liang, and Barker (2010) [76] and Raza-Ullah, Stadtler, and Fernandez (2023) [72], the tenure characteristic is measured according to the average number of years of tenure from the start date to the end date of the tenure or the end of the year. The higher the value, the longer the average tenure of the TMT.

3.1.4. Control Variable

In this paper, we conduct a series of controls for variables related to corporate financial characteristics, corporate governance characteristics, and external monitoring characteristics. (1) Characteristic variables of corporate finance include firm size FSit (representing the firm’s total assets at year-end), asset–liability ratio FLit (representing the ratio of the firm’s total liabilities divided by total assets at year-end), return on assets FRit (representing the ratio of the firm’s net profit divided by average total assets), and cash flow FCit (representing the ratio of year-end cash and cash equivalents balance divided by operating income). (2) Characteristic variables of corporate governance include management shareholding GMit (representing the ratio of the number of shares held by executives divided by the total number of shares), board size GBit (representing the total number of board members), and independent directors Glit (representing the ratio of the number of independent directors divided by the size of the board). (3) Characteristic variables of external supervision include audit quality OAit (representing dummy variables, taking 1 when the auditor is from the top 10 audit companies and taking 0 otherwise) and institutional shareholding OIit (representing the ratio of the number of shares held by institutional investors divided by the total number of shares). The variables are defined as shown in Table 1.

3.2. Model Design

3.2.1. Baseline Empirical Model

To test hypotheses Hla and Hlb, regression models (3) and (4) were constructed:
D T i j t = α 0 + α 1 J P e e r i j t + α 2 F S i t + α 3 F L i t + α 4 F R i t + α 5 F C i t + α 6 G M i t + α 7 G B i t + α 8 G I i t + α 9 O A i t + α 10 O I i t + α 11 Y e a r + ε
D T i j t = α 0 + α 1 G P e e r i j t + α 2 F S i t + α 3 F L i t + α 4 F R i t + α 5 F C i t + α 6 G M i t + α 7 G B i t + α 8 G I i t + α 9 O A i t + α 10 O I i t + α 11 Y e a r + ε
In models (3) and (4), α 0 represents the constant term, and α 1 is the focus of the examination. In model (3), if the estimated coefficient α 1 > 0 and is significant, this indicates that there is an industry peer effect in digital transformation, supporting Hla. In model (4), if the estimated coefficient α 1 > 0 and is significant, this indicates that there is a regional peer effect of digital transformation, supporting Hla.

3.2.2. Moderating Effect Model

To test hypotheses H2a to H5b, regression models (5) to (12) were constructed:
D T i j t = β 0 + β 1 J P e e r i j t × G e n i t + β 2 J P e e r i j t + β 3 G e n i t + β 4 F S i t + β 5 F L i t + β 6 F R i t + β 7 F C i t + β 8 G M i t + β 9 G B i t + β 10 G I i t + β 11 O A i t + β 12 O I i t + β 13 Y e a r + ε
D T i j t = β 0 + β 1 G P e e r i j t × G e n i t + β 2 G P e e r i j t + β 3 G e n i t + β 4 F S i t + β 5 F L i t + β 6 F R i t + β 7 F C i t + β 8 G M i t + β 9 G B i t + β 10 G I i t + β 11 O A i t + β 12 O I i t + β 13 Y e a r + ε
D T i j t = χ 0 + χ 1 J P e e r i j t × A g e i t + χ 2 J P e e r i j t + χ 3 A g e i t + χ 4 F S i t + χ 5 F L i t + χ 6 F R i t + χ 7 F C i t + χ 8 G M i t + χ 9 G B i t + χ 10 G I i t + χ 11 O A i t + χ 12 O I i t + χ 13 Y e a r + ε
D T i j t = χ 0 + χ 1 G P e e r i j t × A g e i t + χ 2 G P e e r i j t + χ 3 A g e i t + χ 4 F S i t + χ 5 F L i t + χ 6 F R i t + χ 7 F C i t + χ 8 G M i t + χ 9 G B i t + χ 10 G I i t + χ 11 O A i t + χ 12 O I i t + χ 13 Y e a r + ε
D T i j t = δ 0 + δ 1 J P e e r i j t × E d u i t + δ 2 J P e e r i j t + δ 3 E d u i t + δ 4 F S i t + δ 5 F L i t + δ 6 F R i t + δ 7 F C i t + δ 8 G M i t + δ 9 G B i t + δ 10 G I i t + δ 11 O A i t + δ 12 O I i t + δ 13 Y e a r + ε
D T i j t = δ 0 + δ 1 G P e e r i j t × E d u i t + δ 2 G P e e r i j t + δ 3 E d u i t + δ 4 F S i t + δ 5 F L i t + δ 6 F R i t + δ 7 F C i t + δ 8 G M i t + δ 9 G B i t + δ 10 G I i t + δ 11 O A i t + δ 12 O I i t + δ 13 Y e a r + ε
D T i j t = γ 0 + γ 1 J P e e r i j t × T e n u i t + γ 2 J P e e r i j t + γ 3 T e n u i t + γ 4 F S i t + γ 5 F L i t + γ 6 F R i t + γ 7 F C i t + γ 8 G M i t + γ 9 G B i t + γ 10 G I i t + γ 11 O A i t + γ 12 O I i t + γ 13 Y e a r + ε
D T i j t = γ 0 + γ 1 G P e e r i j t × T e n u i t + γ 2 G P e e r i j t + γ 3 T e n u i t + γ 4 F S i t + γ 5 F L i t + γ 6 F R i t + γ 7 F C i t + γ 8 G M i t + γ 9 G B i t + γ 10 G I i t + γ 11 O A i t + γ 12 O I i t + γ 13 Y e a r + ε
In models (5) and (6), β 0 represents the constant term, and β 1 is the focus of the examination. In models (5), if the estimated coefficient β 1 > 0 and is significant, this indicates that the TMT’s female proportion positively moderates the industry peer effect in digital transformation, supporting Hypothesis H2a. In model (6), if the estimated coefficient β 1 > 0 and is significant, this indicates that the TMT’s female proportion positively moderates the regional peer effect in digital transformation, supporting Hypothesis H2a.
In models (7) and (8), χ 0 represents the constant term, and χ 1 is the focus of the examination. In model (7), if the estimated coefficient χ 1 < 0 and is significant, this indicates that TMT age characteristics negatively moderate the industry peer effect in digital transformation, supporting Hypothesis H3a. In model (8), if the estimated coefficient χ 1 < 0 and is significant, this indicates that TMT age characteristics negatively moderates the regional peer effect in digital transformation, supporting Hypothesis H3a.
In models (9) and (10), δ 0 represents the constant term, and δ 1 is the focus of the examination. In model (9), if the estimated coefficient δ 1 > 0 and is significant, this indicates that TMT education characteristics positively moderate the industry peer effect in digital transformation, supporting Hypothesis H4a. In model (10), if the estimated coefficient δ 1 > 0 and is significant, this indicates that TMT education characteristics positively moderate the regional peer effect in digital transformation, supporting Hypothesis H4a.
In models (11) and (12), γ 0 represents the constant term, and γ 1 is the focus of the examination. In model (11), if the estimated coefficient γ 1 > 0 and is significant, this indicates that TMT tenure characteristics positively moderate the industry peer effect in digital transformation, supporting Hypothesis H5a. In model (12), if the estimated coefficient γ 1 > 0 and is significant, this indicates that TMT tenure characteristics positively moderate the regional peer effect in digital transformation, supporting Hypothesis H5a.

3.3. Data

This paper selects listed companies in the equipment manufacturing industry in China’s Shanghai and Shenzhen A-shares from 2011 to 2020 as the research sample and conducts the following screening process: Exclude the samples of companies that are ST and *ST in the current year. Exclude the samples of new listings, delistings, or suspensions in the current year. Exclude the samples with asset-liability ratios not in the range of 0 to 1. Eliminate the samples with missing data on the main variables. The final sample containing 5314 valid observations was obtained. The data in this paper were obtained from the database of CSMAR. The data of corporate digital transformation were obtained through text analysis of annual reports.

4. Empirical Results and Analyses

4.1. Descriptive Statistics and Correlation Analysis

Descriptive statistics of major variables are shown in Table 2.
As seen in Table 2, the standard deviation of DT is 1.347, the mean is 1.630, and the median is 1.386, indicating that nearly half of the sample data are less than 1.386. The mean value of Gen is 0.189, indicating that the proportion of females in TMTs is about 18.9%. The mean value of Age is 3.898 (48.427), indicating that the TMT average age is around 48. The mean value of Edu is 3.348, indicating that the majority of TMT members possess bachelor’s degrees or above. The mean value of Tenu is 3.732, indicating that the TMT average tenure is around 3 to 4 years.
Pearson correlation analysis in Table 2 shows that the correlation coefficient between DT and Jpeer is 0.530 (p = 0.000), and the correlation coefficient between DT and Gpeer is 0.379 (p = 0.000). The above results indicate that industry and regional peer firms’ digital transformation are positively correlated with corporate digital transformation, which supports Hla to a certain extent. The correlation coefficients of DT with Gen, Edu, and Tenu are successively 0.086 (p = 0.000), 0.209 (p = 0.000), and 0.249 (p = 0.000), indicating that gender, education, and tenure characteristics are positively correlated with DT. The correlation coefficient between DT and Age is −0.015 (0.287), indicating that TMT age is negatively correlated with DT. However, the moderating effect of TMT remains to be further tested.

4.2. Test of the Peer Effect in Digital Transformation

Table 3 presents the results from testing the existence of Jpeer and Gpeer in DT. Columns (1) and (2) examine whether Jpeer had a positive impact on DT. Column (1) controls Year only, and the estimated coefficient of Jpeer is 0.931(t = 30.07), which shows that Jpeer had a positive impact on DT. According to Model (3), column (2) further introduces control variables, and the estimated coefficient of Jpeer is 0.931 (t = 29.69), which is also significant (p < 1%), indicating that the corporate DT will increase by 0.931% when the average DT of industry peer firms increases by 1%. This implies that there is a significant industry peer effect in digital transformation, supporting research Hypothesis Hla.
Similarly, columns (3) and (4) test the effect of Gpeer in DT. Column (3) controls Year only, and the estimated coefficient of Gpeer is 0.673 (t = 24.99), which shows that Gpeer positively effects DT. According to Model (4), column (4) further introduces control variables, and the results show that the estimated coefficient of Gpeer is 0.674 (t = 25.37), which is also significant (p < 1%), indicating that the corporate DT will increase by 0.674% when the average DT of regional peer firms increases by 1%. This implies that there is a significant regional peer effect in digital transformation. Table 3 shows that with the increase in digital transformation of peer firms in the same industry or region, the corporate digital transformation will also increase; that is, there are significant industry and regional peer effects in digital transformation. The empirical results support research Hypothesis Hla.

4.3. Testing the Moderating Effect of TMT Characteristics

As seen in Table 4, the moderating effect of TMT gender is shown in columns (1) and (2). According to Model (5), the estimated coefficient of Jpeer × Gen is 0.146 (t = 1.69), which is also significant (p < 10%). This indicates that Gen positively moderates the effect of Jpeer in DT, supporting H2a. Similarly, according to Model (6), the estimation result of Gpeer × Gen is 0.347 (t = 3.52) and significant (p < 1%), which supports H2a. It can be seen that with the increase in the proportion of females, the impact of industry or regional peer effects on the corporate digital transformation subsequently increases. This means that an increase in the female proportion of TMT members strengthens the industry and regional peer effects in digital transformation.
Columns (3) and (4) show the results of the moderating effect of TMT age characteristics. According to Model (7), the estimated coefficient of Jpeer × Age is −0.754 (t = −5.14), which is also significant (p < 1%), indicating that Age negatively moderates the effect of Jpeer in DT, supporting H3a. Similarly, according to Model (8), the estimation result of Gpeer × Age is −1.064 (t = −6.84) and significant (p < 1%), which supports H3a. It can be seen that the younger the average age of the TMT, the more significant the positive effect of industry and regional peer effects in digital transformation; i.e., young executives significantly improve industry and regional peer effects in digital transformation.
Columns (5) and (6) show the results of the moderating effect of TMT educational characteristics. According to Model (9), the estimated coefficient of Jpeer × Edu is 0.224 (t = 10.23), which is also significant (p < 1%), indicating that Edu positively moderates the effect of Jpeer in DT, supporting H4a. Similarly, according to Model (10), the estimation result of Gpeer × Edu is 0.247 (t = 10.13) and significant (p < 1%), which supports H4a. It can be seen that with the improvement in the average education level of the TMT, the degree to which the corporate digital transformation is affected by industry and regional peer effects also increases. In other words, the educational level of TMT strengthens the industry and regional peer effects in digital transformation.
Columns (7) and (8) show the results of the moderating effect of TMT tenure characteristics. According to Model (11), the estimated coefficient of Jpeer × Tenu is 0.026 (t = 4.01), which is also significant (p < 1%), indicating that Tenu positively moderates the effect of Jpeer in DT, supporting H5a. Similarly, according to Model (12), the estimation result of Gpeer × Tenu is 0.026 (t = 3.43) and significant (p < 1%), which supports H5a. With the increase in the value of the tenure characteristic of the TMT, the corporate digital transformation is enhanced by the industry and regional peer effects; i.e., the increase in tenure time strengthens the industry and regional peer effects in digital transformation.

4.4. Robustness Tests

In Table 5, columns (1) and (2) show the robustness tests of the previous baseline model by replacing variables. In order to avoid the estimation deviation caused by the definition of the explanatory variables, the calculation method of DT is used to replace the keyword frequencies of “Artificial Intelligence, Blockchain, Cloud Computing and Big Data, and Technology practice” with the keyword frequencies of “Technology practice”. The estimated coefficients of Jpeer and Gpeer are 1.736 (t = 613) and 4.088 (t = 16.32), respectively, and both of which are significantly positive at 1%, indicating that there are industry and regional peer effects in digital transformation.
The results in columns (3) and (4) are robust to the previous benchmark model according to the change-of-model approach since the lower bound of the observed value of DT is 0. In other words, the explanatory variables belong to the truncated data with a limit point of 0 on the left. In order to reduce the estimation deviation caused by the regression method, this paper uses the Tobit model to re-test the rationality of Models (3) and (4). The estimated coefficients of Jpeer and Gpeer are 1.241 (t = 42.11) and 1.141 (t = 28.83), respectively, and both of which are significantly positive at 1%. These indicate that there are industry and regional peer effects in digital transformation.
The data in columns (5) and (6) were tested for the robustness of the baseline model in the previous section by using the lagged period test. There may be a certain time lag in the peer effect in digital transformation, and in view of this, this paper uses the method of one-period lag treatment to test the industry peer effect and regional peer effect. The estimated coefficients of Jpeer and Gpeer are 0.559 (t = 27.16) and 0.482 (t = 19.81), respectively, and both of which are significantly positive at 1%, indicating that the results of the robustness test considering the lag effect are consistent with the above.
The results in columns (7) and (8) used the IV method to test the robustness of the baseline model. In order to attenuate the endogenous problem of the estimation results, the 2SLS regression of the model is carried out, using one-period lag as an instrumental variable. The p-value of the Kleibergen–Paap rk LM test is 0.000, which rejects the initial hypothesis of insufficient recognition of IV. The results of the Cragg–Donald Wald F-test are 4757.69 and 2670.506, which are significantly greater than the critical value of 10% of the Stock–Yogo test, rejecting the initial hypothesis of weak instrumental variables. After controlling the endogenous effects, the estimated coefficients of Jpeer and Gpeer are still significantly positive at 1%.

4.5. Further Analysis

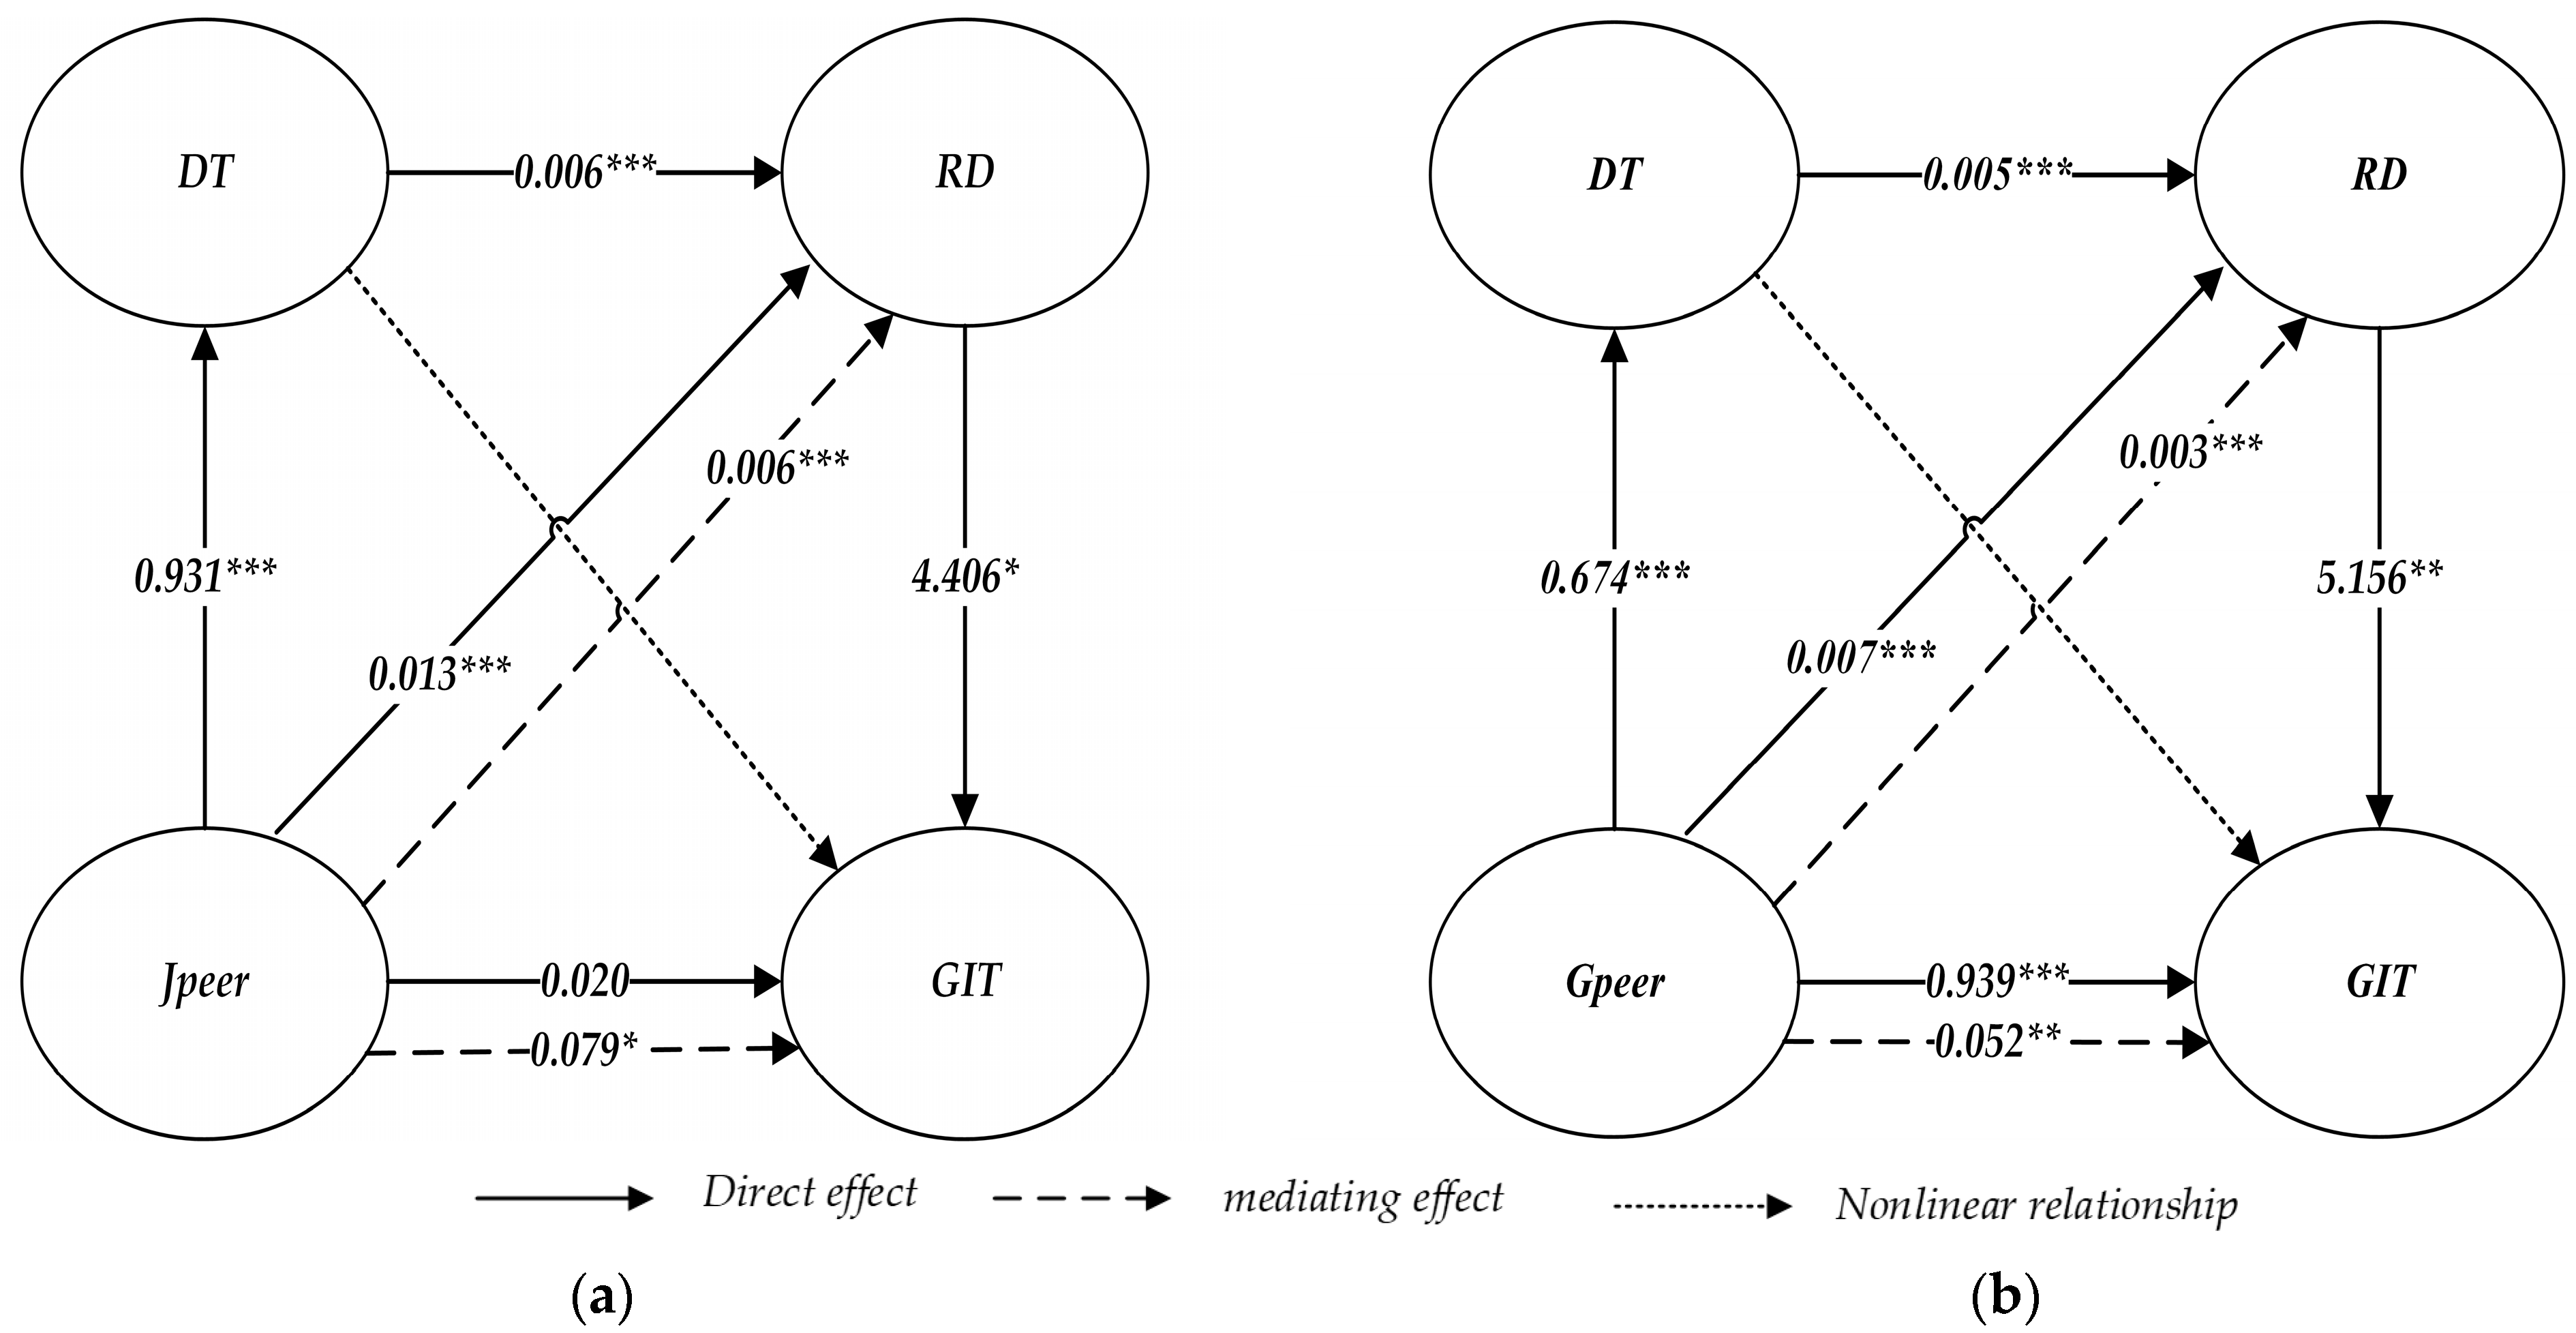
4.5.1. The Impact of Digital Transformation on Corporate Green Technology Innovation

To achieve carbon peaking and carbon neutrality goals, green technology innovation (GTI) is key. EI-Kassar and Singh (2019) [77] and Mubarak, Tiwari, and Petraite et al. (2021) [78] have argued that DT can improve the GTI of corporations. In contrast, Ghobakhloo and Fathi (2021) [79] and Chiarini (2021) [80] hold an opposing view. The reasons for the differences in the above findings may be the differences in research perspectives, variables, or sample choices. Table 6 shows the result of further examination of the impact of digital transformation on corporate green technology innovation. The green technology innovation data are from the State intellectual property Office of China. According to the International Patent Classification Green list issued by the World intellectual property Organization (WIPO) in 2010, the keywords such as “green”, “low carbon”, “energy saving”, and “emission reduction” were manually sorted out and screened to obtain green innovation data. Specifically, with reference to the research methods of Bai, Song, and Jiao et al. (2019) [81], this paper attempts to measure GTI by using the number of green inventions and utility models independently obtained by corporations in the same year. The results show that DT has a non-linear effect on GTI. The estimated coefficient of DT2 affecting GTI is −0.170 (t = −2.31), which is significant at 5%, and the estimated coefficient of DT affecting GTI is 0.677 (t = 0.286), which is significant at 5%, indicating that DT has an inverted U-shaped effect on GTI.

4.5.2. The Impact Mechanism of Digital Transformation on Corporate Green Innovation

Further, this paper will examine the mechanism of the role of DT on GTI. The corporate R&D investment intensity (RD) is the key for GTI, which is measured by using the ratio of the corporate R&D investment to sales revenue in the current year. Referring to Baron and Kenny (1986) [82], the multiple mediating effects model of Jpeer(Gpeer)→DTRDGTI were constructed as follows:
{ R D = a 0 + a 1 J p e e r ( G p e e r ) + λ C o n t r o l s + ε D T = b 0 + b 1 J p e e r ( G p e e r ) + λ C o n t r o l s + ε R D = c 0 + c 1 J p e e r ( G p e e r ) + c 2 D T + λ C o n t r o l s + ε
{ G T I = d 0 + d 1 D T + λ C o n t r o l s + ε R D = e 0 + e 1 D T + λ C o n t r o l s + ε G T I = f 0 + f 1 D T + f 2 R D + λ C o n t r o l s + ε
In model (13), a1 and c1 represent the path coefficients of industry and regional peer effects influencing R&D investment intensity, b1 represents the path coefficient of industry or regional peer effects influencing digital transformation, and c2 represents the path coefficient of digital transformation influencing R&D investment intensity. If the path coefficients a1, b1, and c2 are significantly positive, then b1 × c2 represents the mediating path coefficient. As the results show in Figure 2 and Table 7, the mediating effect of Jpeer (Gpeer)→DTRD, total effect, direct effect, and mediating effect of Jpeer (Gpeer) affecting RD are all significant at the 1% level (p = 0.000). The mediating effect of Jpeer affecting RD is about 0.006 (approximately equal to the estimated coefficient of JpeerDT 0.931 multiplied by the estimated coefficient of DTRD, 0.006), accounting for 33.33% of the total effect (Jpeer→RD, 0.018). The mediating effect of Gpeer affecting RD is about 0.003 (approximately equal to the estimated coefficient of GpeerDT, 0.674 multiplied by the estimated coefficient of DTRD, 0.005), accounting for about 30.00% of the total effect (GpeerRD, 0.010).
Similarly, in model (14), d1 and f1 represent the path coefficients of digital transformation influencing green technology innovation, e1 represents the path coefficient of digital transformation influencing R&D investment intensity, and f2 represents the path coefficient of R&D investment intensity influencing green technology innovation. If the path coefficients d1, e1, and f2 are significantly positive, then e1 × f2 represents the mediating path coefficient. As the results show in Figure 2 and Table 7, the mediating effect of Jpeer (Gpeer)→RDGTI, the total effect, and the direct effect of Jpeer affecting RD are not significant while the mediating effect is significant. This shows that Jpeer affects GTI completely through RD, and the mediating effect is about 0.079 (approximately equal to the estimated coefficient of JpeerRD, 0.018 multiplied by the estimated coefficient of 4.406 for RDGTI). Gpeer affects GTI indirectly through RD, and the mediating effect is about 0.052 (approximately equal to the estimated coefficient of GpeerRD, 0.010 multiplied by the estimated coefficient of 5.156 for RDGTD), accounting for about 5.25% of the total effect (Gpeer→GTI, 0.991).

5. Conclusions and Discussion

5.1. New Finding and Discussion

This study uses the data of China’s listed equipment manufacturing companies from 2011 to 2020 to test the industry peer effect and regional peer effect that may exist in the digital transformation of equipment manufacturing enterprises as well as the moderating effects of TMT characteristics.
Most of the previous literature takes the independence of corporate decision-making as the premise and regards corporate digital transformation decision-making as an independent event. During the discussion of the influencing factors of promoting corporate digital transformation, scholars have mainly carried out much research from the perspectives of corporate governance [83,84,85,86], managers and employees [87,88,89,90], policy and environmental factors [91,92,93], and so on. However, there is a relatively small literature analyzing corporate digital transformation from the perspective of peer effect. According to the longitude and latitude coordinates of the locations where listed companies are registered, Pan, Xu, and Zhu (2022) have used the spatial weight matrix model to calculate the straight-line ground distance between peer firms, which reflects the influence of the spatial peer effect in digital transformation [34]. Distinguished from the research of Pan, Xu, and Zhu (2022), this paper takes the third-tier industry where the equipment manufacturing listed company is located and the province where the company is registered as the criteria for defining peer firms and examines the peer effect in corporate digital transformation from the perspective of industry and regional peer effects. The results show that corporate digital transformation is affected by industry and regional peer effects, and it helps to enrich the relevant research on the influencing factors of digital transformation and identify the impact of peer effects in corporate digital transformation more comprehensively.
To a certain extent, the characteristics of TMTs reflect their perceptions and values. Different TMT characteristics lead to differences in motivations such as maintaining reputation [57,94,95], risk aversion [96,97,98], and catching up with and imitating peers [99,100,101]. The current research mainly focuses on the mechanism of peer effects in corporate decision-making, such as information transmission [24], product market competition [24,41], and economic policy uncertainty [102] while less attention is paid to TMT characteristics. Therefore, this paper discusses the moderating effect of TMT characteristics on industry and regional peer effects in corporate digital transformation from the perspective of gender, age, education, and tenure. The results show that the higher the proportion of females in the TMT, the stronger the positive influence of industry and regional peer effect in corporate digital transformation. The younger the average age of the TMT, the stronger the positive impact of industry and regional peer effects in corporate digital transformation. The higher the average educational level of the TMT, the stronger the positive impact of industry and regional peer effects in corporate digital transformation. The longer the average tenure length of the TMT, the stronger the positive impact of industry and regional peer effects in corporate digital transformation.
The existing studies on the impact of digital transformation on innovation performance [103,104] and green technology innovation [105,106,107] have drawn many meaningful conclusions. This paper finds that there is a non-linear relationship between digital transformation and green technology innovation, and there is an inverted U-shaped relationship between digital transformation and green technology innovation. Furthering the discussion on the relationship among industry and regional peer effects, digital transformation, and innovation performance, this paper finds that industry and regional peer effects have a significant positive impact on innovation performance in which digital transformation plays a mediating effect. This paper also finds that industry and regional peer effects have a significant positive impact on green technology innovation in which innovation performance plays a mediating effect. This paper brings digital transformation, innovation performance, green technology innovation, and industry and regional peer effects into a research framework and reveals the influence path of digital transformation on green technology innovation. It enriches the related research on the economic consequences of digital transformation.

5.2. Management Enlightenment and Policy Implications

The management enlightenment and policy implications of this paper are as follows: Firstly, corporations should pay attention to the industry peer effect and regional peer effect in digital transformation. Equipment manufacturing enterprises should be fully aware of the positive impact of peer firms’ decision-making information on their own digital transformation, especially for those leading peer firms in industries and regions. Furthermore, a corporation should maintain full social interaction with leading peer firms to improve the quality of accessible peer information and reduce the cost of searching for information. Secondly, corporations should strengthen the construction of their TMTs. Corporations need to recognize the important role of female executives, young executives, highly educated executives, and long-term executives in the digital transformation process. At the same time, corporations should optimize the structures of their TMTs to enhance digital transformation and peer effect impacts. Finally, the impact of the peer effect should be fully considered by the government supervision department when formulating relevant policies. In order to better enhance the level of digital transformation of equipment manufacturing enterprises, government supervision departments need to provide good learning and communication environments for peer firms. Corporations should pay full attention to the industry peer effect and regional peer effect in the positive impact of digital transformation through typical demonstration, policy guidance, and other means.

5.3. Limitations and Future Research

The limitations of and future research directions suggested by this paper are as follows: Firstly, the identification channels of peer effect also exist in social networks widely, such as in interlocking director networks, auditor networks, alumni networks, etc. Therefore, research on the impact of peer effect of social networks in digital transformation of equipment manufacturing enterprises needs to be expanded in the future. In addition, the industry peer effect and regional peer effect of digital transformation can also be further subdivided. For example, research could study these effects on corporations in the same industry but different regions, the same region but different industries, or when both belong to the same industry and the same region. Furthermore, the influence and coexistence of the social network peer effect, industry peer effect, and regional peer effect on digital transformation can be tested. Secondly, this paper only verifies the existence of industry and regional peer effects in the digital transformation of equipment manufacturing enterprises and the moderating effect of TMT characteristics while the generating mechanism and economic consequences of industry and regional peer effects still need to be further analyzed. In future research, the analysis of the peer effect mechanism of digital transformation should include the learning mechanism, information mechanism, and social network mechanism, and the economic consequence analysis should include enterprise value, total factor productivity, enterprise ESG performance, and so on. The learning mechanism mainly analyzes whether the digital transformation leader learns from the laggard or the digital transformation laggard learns from the leader. The information mechanism mainly analyzes whether the digital transformation shows stronger peer effect with the improvement of the quality of information disclosure. The social network mechanism mainly analyzes whether the digital transformation shows a stronger peer effect with the abundance of corporate social network resources. Finally, the industry and regional peer effects in digital transformation may also be affected by economic policy uncertainty, government subsidies, or industrial policies, which should be taken into account in future studies. Some studies have shown that the greater the uncertainty of economic policy, the more significant the peer effect on corporate decision-making, which remains to be tested whether this is applicable to the peer effect in digital transformation. In addition, under the influence of government subsidies and industrial policies, corporate digital transformation decision-making is more or less affected by the peer effect, which also needs to be further tested.

Author Contributions

Conceptualization, X.Z.; methodology, X.Z. and X.D.; software, X.Z.; validation, X.Z.; formal analysis, X.Z. and X.D.; investigation, X.Z.; resources, X.Z.; data curation, X.Z.; writing—original draft preparation, X.Z.; writing—review and editing, X.Z. and X.D.; visualization, X.Z.; supervision, X.Z.; project administration, X.Z.; funding acquisition, X.Z. and X.D. All authors have read and agreed to the published version of the manuscript.

Funding

This work was supported by the Social Science Foundation of Liaoning Province (CN) [grant number L22BGL031], the Basic Scientific Research Project of the Educational Department of Liaoning Province (CN) [grant number LJKQR20222553], The Liaoning Provincial Federation Social Science Circle Project (CN) [grant number 2021lslhzyb-06], and the Liaoning Provincial Education Department Project (CN) [grant number LJKR0561].

Institutional Review Board Statement

Not applicable.

Informed Consent Statement

Not applicable.

Data Availability Statement

Data are available from authors upon reasonable request.

Conflicts of Interest

The authors declare no conflict of interest.

References

  1. Adner, R.; Puranam, P.; Zhu, F. What is different about digital strategy? From quantitative to qualitative change. Strategy Sci. 2019, 4, 253–261. [Google Scholar] [CrossRef] [Green Version]
  2. Zhao, M.; Liu, R.; Dai, D. Synergistic effect between China’s digital transformation and economic development: A study based on sustainable development. Sustainability 2021, 13, 13773. [Google Scholar] [CrossRef]
  3. Zhao, S.; Zhang, Y.; Iftikhar, H.; Ullah, A.; Mao, J.; Wang, T. Dynamic Influence of Digital and Technological Advancement on Sustainable Economic Growth in Belt and Road Initiative (BRI) Countries. Sustainability 2022, 14, 15782. [Google Scholar] [CrossRef]
  4. Pilipczuk, O. Transformation of the Business Process Manager Profession in Poland: The Impact of Digital Technologies. Sustainability 2021, 13, 13690. [Google Scholar] [CrossRef]
  5. Zhai, H.; Yang, M.; Chan, K.C. Does digital transformation enhance a firm’s performance? Evidence from China. Technol. Soc. 2022, 68, 101841. [Google Scholar] [CrossRef]
  6. Palanisamy, S.; Chelliah, S.; Muthuveloo, R. Optimization of Organisational Performance among Malaysian Manufacturing SMEs in Digital Age via Talent Farming. J. Entrep. Bus. Econ. 2021, 9, 82–120. [Google Scholar]
  7. Chen, H.; Zhu, H.; Sun, T.; Chen, X.; Wang, T.; Li, W. Does Environmental Regulation Promote Corporate Green Innovation? Empirical Evidence from Chinese Carbon Capture Companies. Sustainability 2023, 15, 1640. [Google Scholar] [CrossRef]
  8. Ren, Y.; Li, B. Digital Transformation, Green Technology Innovation and Enterprise Financial Performance: Empirical Evidence from the Textual Analysis of the Annual Reports of Listed Renewable Energy Enterprises in China. Sustainability 2022, 15, 712. [Google Scholar] [CrossRef]
  9. Xu, P.; Chen, L.; Dai, H. Pathways to Sustainable Development: Corporate Digital Transformation and Environmental Performance in China. Sustainability 2022, 15, 256. [Google Scholar] [CrossRef]
  10. Dana, L.-P.; Salamzadeh, A.; Mortazavi, S.; Hadizadeh, M.; Zolfaghari, M. Strategic futures studies and entrepreneurial resiliency: A focus on digital technology trends and emerging markets. Tec. Empres. 2022, 16, 87–100. [Google Scholar]
  11. Salamzadeh, Y.; Farzad, F.S.; Salamzadeh, A.; Palalić, R. Digital leadership and organizational capabilities in manufacturing industry: A study in Malaysian context. Period. Eng. Nat. Sci. 2021, 10, 195–211. [Google Scholar]
  12. Soon, C.C.; Salamzadeh, Y. The impact of digital leadership competencies on virtual team effectiveness in mnc companies in penang, Malaysia. J. Entrep. Bus. Econ. 2021, 8, 219–253. [Google Scholar]
  13. Li, D.; Shen, W. Can corporate digitalization promote green innovation? The moderating roles of internal control and institutional ownership. Sustainability 2021, 13, 13983. [Google Scholar] [CrossRef]
  14. Niu, S.; Park, B.I.; Jung, J.S. The Effects of Digital Leadership and ESG Management on Organizational Innovation and Sustainability. Sustainability 2022, 14, 15639. [Google Scholar] [CrossRef]
  15. Hanelt, A.; Bohnsack, R.; Marz, D.; Antunes Marante, C. A systematic review of the literature on digital transformation: Insights and implications for strategy and organizational change. J. Manag. Stud. 2021, 58, 1159–1197. [Google Scholar] [CrossRef]
  16. Baierle, I.C.; da Silva, F.T.; de Faria Correa, R.G.; Schaefer, J.L.; Da Costa, M.B.; Benitez, G.B.; Benitez Nara, E.O. Competitiveness of Food Industry in the Era of Digital Transformation towards Agriculture 4.0. Sustainability 2022, 14, 11779. [Google Scholar] [CrossRef]
  17. Zhang, Z.; Shang, Y.; Cheng, L.; Hu, A. Big data capability and sustainable competitive advantage: The mediating role of ambidextrous innovation strategy. Sustainability 2022, 14, 8249. [Google Scholar] [CrossRef]
  18. Manski, C.F. Identification of endogenous social effects: The reflection problem. Rev. Econ. Stud. 1993, 60, 531–542. [Google Scholar] [CrossRef] [Green Version]
  19. Foell, A.; Pitzer, K.A.; Nebbitt, V.; Lombe, M.; Yu, M.; Villodas, M.L.; Newransky, C. Exposure to community violence and depressive symptoms: Examining community, family, and peer effects among public housing youth. Health Place 2021, 69, 102579. [Google Scholar] [CrossRef]
  20. Wu, G.; Cheng, J.; Yang, F. The Influence of the Peer Effect on Farmers’ Agricultural Insurance Decision: Evidence from the Survey Data of the Karst Region in China. Sustainability 2022, 14, 11922. [Google Scholar] [CrossRef]
  21. Zwier, D.; Geven, S.; Bol, T.; Van de Werfhorst, H.G. Let’s Stick Together: Peer Effects in Secondary School Choice and Variations by Student Socio-Economic Background. Eur. Sociol. Rev. 2023, 39, 67–84. [Google Scholar] [CrossRef]
  22. Coveney, M.; Oosterveen, M. What drives ability peer effects? Eur. Econ. Rev. 2021, 136, 103763. [Google Scholar] [CrossRef]
  23. Gu, Y.; Ben, S.; Lv, J. Peer effect in merger and acquisition activities and its impact on corporate sustainable development: Evidence from China. Sustainability 2022, 14, 3891. [Google Scholar] [CrossRef]
  24. ZHANG, X.; YAO, H.; DU, X. The Peer Effect of Serial Mergers and Acquisitions and the Internal Control of Enterprises. J. Northeast. Univ. (Soc. Sci.) 2021, 23, 22. [Google Scholar]
  25. Leary, M.T.; Roberts, M.R. Do peer firms affect corporate financial policy? J. Financ. 2014, 69, 139–178. [Google Scholar] [CrossRef]
  26. Ajirloo, B.F.; Switzer, L.N. Self-disclosed peer effects on corporate capital structure. J. Int. Financ. Mark. Inst. Money 2022, 78, 101562. [Google Scholar] [CrossRef]
  27. Fairhurst, D.; Nam, Y. Corporate governance and financial peer effects. Financ. Manag. 2020, 49, 235–263. [Google Scholar] [CrossRef]
  28. Zhuang, Y.; Nie, J.; Wu, W. Peer influence and the value of cash holdings. J. Empir. Financ. 2022, 69, 265–284. [Google Scholar] [CrossRef]
  29. Chen, Y.-W.; Chan, K.; Chang, Y. Peer effects on corporate cash holdings. Int. Rev. Econ. Financ. 2019, 61, 213–227. [Google Scholar] [CrossRef]
  30. Machokoto, M.; Chipeta, C.; Ibeji, N. The institutional determinants of peer effects on corporate cash holdings. J. Int. Financ. Mark. Inst. Money 2021, 73, 101378. [Google Scholar] [CrossRef]
  31. Liang, Q.; Li, Q.; Lu, M.; Shan, Y. Industry and geographic peer effects on corporate tax avoidance: Evidence from China. Pac.-Basin Financ. J. 2021, 67, 101545. [Google Scholar] [CrossRef]
  32. Seo, H. Peer effects in corporate disclosure decisions. J. Account. Econ. 2021, 71, 101364. [Google Scholar] [CrossRef]
  33. Li, C.; Wang, X. Local peer effects of corporate social responsibility. J. Corp. Financ. 2022, 73, 102187. [Google Scholar] [CrossRef]
  34. Pan, X.; Xu, G.; Zhu, N. Spatial Peer Effect of Enterprises’ Digital Transformation: Empirical Evidence from Spatial Autoregressive Models. Sustainability 2022, 14, 12576. [Google Scholar] [CrossRef]
  35. Cerqueti, R.; Lucarelli, C.; Marinelli, N.; Micozzi, A. Teams in new ventures: Gender, human capital and motivation. Int. J. Gend. Entrep. 2020, 12, 145–171. [Google Scholar] [CrossRef]
  36. Firk, S.; Gehrke, Y.; Hanelt, A.; Wolff, M. Top management team characteristics and digital innovation: Exploring digital knowledge and TMT interfaces. Long Range Plan. 2022, 55, 102166. [Google Scholar] [CrossRef]
  37. Chen, Y.; Li, R.; Song, T. Does TMT internationalization promote corporate digital transformation? A study based on the cognitive process mechanism. Bus. Process Manag. J. 2023, 29, 309–338. [Google Scholar] [CrossRef]
  38. De Lomana, G.G.; Strese, S.; Brinckmann, J. Adjusting to the digital age: The effects of TMT characteristics on the digital orientation of firms. Acad Manag Proc 2019, 2019, 13589. [Google Scholar] [CrossRef]
  39. Hambrick, D.C.; Mason, P.A. Upper echelons: The organization as a reflection of its top managers. Acad. Manag. Rev. 1984, 9, 193–206. [Google Scholar] [CrossRef]
  40. Shepherd, D.A.; Mcmullen, J.S.; Ocasio, W. Is that an opportunity? An attention model of top managers’ opportunity beliefs for strategic action. Strateg. Manag. J. 2017, 38, 626–644. [Google Scholar] [CrossRef]
  41. Zhao, W.; Ye, G.; Xu, G.; Liu, C.; Deng, D.; Huang, M. CSR and Long-Term Corporate Performance: The Moderating Effects of Government Subsidies and Peer Firm’s CSR. Sustainability 2022, 14, 5543. [Google Scholar] [CrossRef]
  42. Uzo, U.; Mair, J. Source and Patterns of Organizational Defiance of Formal Institutions: Insights from Nollywood, the N igerian Movie Industry. Strateg. Entrep. J. 2014, 8, 56–74. [Google Scholar] [CrossRef]
  43. DiMaggio, P.J.; Powell, W.W. The iron cage revisited: Institutional isomorphism and collective rationality in organizational fields. Am. Sociol. Rev. 1983, 48, 147–160. [Google Scholar] [CrossRef] [Green Version]
  44. Chelli, M.; Durocher, S.; Richard, J. France’s new economic regulations: Insights from institutional legitimacy theory. Account. Audit. Account. J. 2014, 27, 283–316. [Google Scholar] [CrossRef]
  45. Scharfstein, D.S.; Stein, J.C. Herd behavior and investment. Am. Econ. Rev. 1990, 80, 465–479. [Google Scholar]
  46. Johnsson, I.; Moon, H.R. Estimation of peer effects in endogenous social networks: Control function approach. Rev. Econ. Stat. 2021, 103, 328–345. [Google Scholar] [CrossRef] [Green Version]
  47. Lieberman, M.B.; Asaba, S. Why do firms imitate each other? Acad. Manag. Rev. 2006, 31, 366–385. [Google Scholar] [CrossRef] [Green Version]
  48. Core, J.E.; Abramova, I.; Verdi, R.S. Geographic spillovers and corporate decisions. SSRN Electron. J. 2016. [Google Scholar] [CrossRef]
  49. Parsons, C.A.; Sulaeman, J.; Titman, S. The geography of financial misconduct. J. Financ. 2018, 73, 2087–2137. [Google Scholar] [CrossRef]
  50. Bathelt, H.; Malmberg, A.; Maskell, P. Clusters and knowledge: Local buzz, global pipelines and the process of knowledge creation. Prog. Hum. Geogr. 2004, 28, 31–56. [Google Scholar] [CrossRef]
  51. Gao, W.; Ng, L.; Wang, Q. Does corporate headquarters location matter for firm capital structure? Financ. Manag. 2011, 40, 113–138. [Google Scholar] [CrossRef]
  52. Beugnot, J.; Fortin, B.; Lacroix, G.; Villeval, M.C. Gender and peer effects on performance in social networks. Eur. Econ. Rev. 2019, 113, 207–224. [Google Scholar] [CrossRef]
  53. Ullah, I.; Fang, H.; Jebran, K. Do gender diversity and CEO gender enhance firm’s value? Evidence from an emerging economy. Corp. Gov. Int. J. Bus. Soc. 2020, 20, 44–66. [Google Scholar] [CrossRef]
  54. Bogdan, V.; Popa, D.-N.; Beleneşi, M.; Rus, L.; Scorțe, C.-M. Gender Diversity and Business Performance Nexus: A Synoptic Panorama Based on Bibliometric Network Analysis. Sustainability 2023, 15, 1801. [Google Scholar] [CrossRef]
  55. Usman, M.; Gull, A.A.; Zalata, A.M.; Wang, F.; Yin, J. Female board directorships and related party transactions. Br. J. Manag. 2022, 33, 678–702. [Google Scholar] [CrossRef]
  56. Proença, C.; Augusto, M.; Murteira, J. Political connections and banking performance: The moderating effect of gender diversity. Corp. Gov. Int. J. Bus. Soc. 2020, 20, 1001–1028. [Google Scholar] [CrossRef]
  57. Ma, R.; Lv, W.; Zhao, Y. The Impact of TMT Experience Heterogeneity on Enterprise Innovation Quality: Empirical Analysis on Chinese Listed Companies. Sustainability 2022, 14, 16571. [Google Scholar] [CrossRef]
  58. Xie, X.; Han, Y.; Hoang, T.T. Can green process innovation improve both financial and environmental performance? The roles of TMT heterogeneity and ownership. Technol. Forecast. Soc. Change 2022, 184, 122018. [Google Scholar] [CrossRef]
  59. Wang, Y.; Su, Q.; Sun, W. CEO relational leadership and product innovation performance: The roles of TMT behavior and characteristics. Front. Psychol. 2022, 13, 2040. [Google Scholar] [CrossRef]
  60. Heyden, M.L.; Reimer, M.; Van Doorn, S. Innovating beyond the horizon: CEO career horizon, top management composition, and R&D intensity. Hum. Resour. Manag. 2017, 56, 205–224. [Google Scholar]
  61. Bengtsson, M.; Raza-Ullah, T.; Srivastava, M.K. Looking different vs thinking differently: Impact of TMT diversity on coopetition capability. Long Range Plan. 2020, 53, 101857. [Google Scholar] [CrossRef]
  62. Xi, Z.; Tiebo, S.; Weihong, C.; Yimin, W. CEO Tenure, TMT Characteristics and Strategic Change. Foreign Econ. Manag. 2019, 41, 3–16. [Google Scholar]
  63. Wiersema, M.F.; Bantel, K.A. Top management team demography and corporate strategic change. Acad. Manag. J. 1992, 35, 91–121. [Google Scholar] [CrossRef]
  64. Mojambo, G.; Tulung, J.E.; Saerang, R.T. The Influence of Top Management Team (TMT) Characteristics toward Indonesian Banks Performance during the Digital Era (2014–2018); University Library of Munich: München, Germany, 2020. [Google Scholar]
  65. Pham, T.-D.T.; Lo, F.-Y. How does top management team diversity influence firm performance? A causal complexity analysis. Technol. Forecast. Soc. Change 2023, 186, 122162. [Google Scholar] [CrossRef]
  66. Wangrow, D.B.; Schepker, D.J.; Barker III, V.L. When does CEO succession lead to strategic change? The mediating role of top management team replacement. J. Gen. Manag. 2022, 03063070221126267. [Google Scholar] [CrossRef]
  67. Michel, J.G.; Hambrick, D.C. Diversification posture and top management team characteristics. Acad. Manag. J. 1992, 35, 9–37. [Google Scholar] [CrossRef]
  68. Verhoef, P.C.; Broekhuizen, T.; Bart, Y.; Bhattacharya, A.; Dong, J.Q.; Fabian, N.; Haenlein, M. Digital transformation: A multidisciplinary reflection and research agenda. J. Bus. Res. 2021, 122, 889–901. [Google Scholar] [CrossRef]
  69. Wu, F.; Hu, H.; Lin, H.; Ren, X. Enterprise digital transformation and capital market performance: Empirical evidence from stock liquidity. Manag. World 2021, 37, 130–144. [Google Scholar]
  70. Wei, J.; Zhang, Y. The Impact of Tom Management Team Heterogeneity on Corporate Performance-An Empirical Study Based on Chinese Listed Companies from 2008–2019. Adv. Manag. Appl. Econ. 2023, 13, 71–92. [Google Scholar]
  71. Huang, J.; Kisgen, D.J. Gender and corporate finance: Are male executives overconfident relative to female executives? J. Financ. Econ. 2013, 108, 822–839. [Google Scholar] [CrossRef]
  72. Raza-Ullah, T.; Stadtler, L.; Fernandez, A.-S. The individual manager in the spotlight: Protecting sensitive knowledge in inter-firm coopetition relationships. Ind. Mark. Manag. 2023, 110, 85–95. [Google Scholar] [CrossRef]
  73. Gul, F.A.; Srinidhi, B.; Ng, A.C. Does board gender diversity improve the informativeness of stock prices? J. Account. Econ. 2011, 51, 314–338. [Google Scholar] [CrossRef]
  74. Malmendier, U.; Tate, G. CEO overconfidence and corporate investment. J. Financ. 2005, 60, 2661–2700. [Google Scholar] [CrossRef] [Green Version]
  75. Liu, X.; Huang, Y.; Kim, J.; Na, S. How Ethical Leadership Cultivates Innovative Work Behaviors in Employees? Psychological Safety, Work Engagement and Openness to Experience. Sustainability 2023, 15, 3452. [Google Scholar] [CrossRef]
  76. McClelland, P.L.; Liang, X.; Barker III, V.L. CEO commitment to the status quo: Replication and extension using content analysis. J. Manag. 2010, 36, 1251–1277. [Google Scholar] [CrossRef]
  77. El-Kassar, A.-N.; Singh, S.K. Green innovation and organizational performance: The influence of big data and the moderating role of management commitment and HR practices. Technol. Forecast. Soc. Change 2019, 144, 483–498. [Google Scholar] [CrossRef]
  78. Mubarak, M.F.; Tiwari, S.; Petraite, M.; Mubarik, M.; Raja Mohd Rasi, R.Z. How Industry 4.0 technologies and open innovation can improve green innovation performance? Manag. Environ. Qual. Int. J. 2021, 32, 1007–1022. [Google Scholar] [CrossRef]
  79. Ghobakhloo, M.; Fathi, M. Industry 4.0 and opportunities for energy sustainability. J. Clean. Prod. 2021, 295, 126427. [Google Scholar] [CrossRef]
  80. Chiarini, A. Industry 4.0 technologies in the manufacturing sector: Are we sure they are all relevant for environmental performance? Bus. Strategy Environ. 2021, 30, 3194–3207. [Google Scholar] [CrossRef]
  81. Bai, Y.; Song, S.; Jiao, J.; Yang, R. The impacts of government R&D subsidies on green innovation: Evidence from Chinese energy-intensive firms. J. Clean. Prod. 2019, 233, 819–829. [Google Scholar]
  82. Baron, R.M.; Kenny, D.A. The moderator–mediator variable distinction in social psychological research: Conceptual, strategic, and statistical considerations. J. Personal. Soc. Psychol. 1986, 51, 1173. [Google Scholar] [CrossRef] [PubMed]
  83. Brunetti, F.; Matt, D.T.; Bonfanti, A.; De Longhi, A.; Pedrini, G.; Orzes, G. Digital transformation challenges: Strategies emerging from a multi-stakeholder approach. TQM J. 2020, 32, 697–724. [Google Scholar] [CrossRef]
  84. Garzoni, A.; De Turi, I.; Secundo, G.; Del Vecchio, P. Fostering digital transformation of SMEs: A four levels approach. Manag. Decis. 2020, 58, 1543–1562. [Google Scholar] [CrossRef]
  85. Manita, R.; Elommal, N.; Baudier, P.; Hikkerova, L. The digital transformation of external audit and its impact on corporate governance. Technol. Forecast. Soc. Change 2020, 150, 119751. [Google Scholar] [CrossRef]
  86. Fenwick, M.; Vermeulen, E.P. Technology and corporate governance: Blockchain, crypto, and artificial intelligence. Tex. J. Bus. L. 2019, 48, 1. [Google Scholar] [CrossRef] [Green Version]
  87. Porfírio, J.A.; Carrilho, T.; Felício, J.A.; Jardim, J. Leadership characteristics and digital transformation. J. Bus. Res. 2021, 124, 610–619. [Google Scholar] [CrossRef]
  88. Nicolas-Agustin, A.; Jimenez-Jimenez, D.; Maeso-Fernandez, F. The role of human resource practices in the implementation of digital transformation. Int. J. Manpow. 2022, 43, 395–410. [Google Scholar] [CrossRef]
  89. Blanka, C.; Krumay, B.; Rueckel, D. The interplay of digital transformation and employee competency: A design science approach. Technol. Forecast. Soc. Change 2022, 178, 121575. [Google Scholar] [CrossRef]
  90. Fenech, R.; Baguant, P.; Ivanov, D. The changing role of human resource management in an era of digital transformation. J. Manag. Inf. Decis. Sci. 2019, 22, 166–175. [Google Scholar]
  91. Chen, C.-L.; Lin, Y.-C.; Chen, W.-H.; Chao, C.-F.; Pandia, H. Role of government to enhance digital transformation in small service business. Sustainability 2021, 13, 1028. [Google Scholar] [CrossRef]
  92. Bin, M.; Hui, G. A systematic review of factors influencing digital transformation of SMEs. Turk. J. Comput. Math. Educ. (TURCOMAT) 2021, 12, 1673–1686. [Google Scholar]
  93. Khanna, M. Digital transformation of the agricultural sector: Pathways, drivers and policy implications. Appl. Econ. Perspect. Policy 2021, 43, 1221–1242. [Google Scholar] [CrossRef]
  94. Schneck, S.; Nejadhossein Soudani, S. CEO Overconfidence and Corporate Social Performance: The Moderating Effect of TMT Overconfidence. In Academy of Management Proceedings; Academy of Management: Briarcliff Manor, NY, USA, 2022; p. 15689. [Google Scholar]
  95. Saeed, A.; Baloch, M.S.; Riaz, H. Global insights on TMT gender diversity in controversial industries: A legitimacy perspective. J. Bus. Ethics 2021, 179, 711–731. [Google Scholar] [CrossRef]
  96. Ozdemir, O.; Erkmen, E. Top management team gender diversity and firm risk-taking in the hospitality industry. Int. J. Contemp. Hosp. Manag. 2022, 34, 1739–1767. [Google Scholar] [CrossRef]
  97. Zhang, Y.; Cao, C.; Gu, J.; Garg, H. The Impact of Top Management Team Characteristics on the Risk Taking of Chinese Private Construction Enterprises. Systems 2023, 11, 67. [Google Scholar] [CrossRef]
  98. Fraseur, S.; Terry, R.P. Behind in the count: TMT gender diversity in male-dominated industries. Int. J. Employ. Stud. 2022, 30, 6–32. [Google Scholar]
  99. Rong, P.; Wang, C. CEO turnover, leadership identity, and TMT creativity in a cross-cultural context. Front. Psychol. 2021, 12, 610526. [Google Scholar] [CrossRef]
  100. Ahmed, U. Imitation in Foreign Location Choice: The Role of Upper Echelons’ Diversity. Ph.D. Thesis, Victoria University of Wellington, Wellington, New Zealand, 2019. [Google Scholar]
  101. Cortes-Mejia, S.; Cortes, A.F.; Herrmann, P. Pursuing greater good by reducing power: CEO humility, TMT decentralization, and ethical culture. In Academy of Management Proceedings; Academy of Management: Briarcliff Manor, NY, USA, 2020; p. 13927. [Google Scholar]
  102. Chen, S.; Ma, H. Peer effects in decision-making: Evidence from corporate investment. China J. Account. Res. 2017, 10, 167–188. [Google Scholar] [CrossRef]
  103. Usai, A.; Fiano, F.; Petruzzelli, A.M.; Paoloni, P.; Briamonte, M.F.; Orlando, B. Unveiling the impact of the adoption of digital technologies on firms’ innovation performance. J. Bus. Res. 2021, 133, 327–336. [Google Scholar] [CrossRef]
  104. Shen, L.; Sun, C.; Ali, M. Role of servitization, digitalization, and innovation performance in manufacturing enterprises. Sustainability 2021, 13, 9878. [Google Scholar] [CrossRef]
  105. Xue, L.; Zhang, Q.; Zhang, X.; Li, C. Can digital transformation promote green technology innovation? Sustainability 2022, 14, 7497. [Google Scholar] [CrossRef]
  106. Feng, H.; Wang, F.; Song, G.; Liu, L. Digital transformation on enterprise green innovation: Effect and transmission mechanism. Int. J. Environ. Res. Public Health 2022, 19, 10614. [Google Scholar] [CrossRef] [PubMed]
  107. He, J.; Su, H. Digital Transformation and Green Innovation of Chinese Firms: The Moderating Role of Regulatory Pressure and International Opportunities. Int. J. Environ. Res. Public Health 2022, 19, 13321. [Google Scholar] [CrossRef] [PubMed]
Figure 1. Research path.
Sustainability 15 06003 g001
Figure 2. Path diagram of the peer effect of digital transformation affecting green technology innovation. In the Figure above: (a) describes the multiple mediating effects mechanism from the perspective of industry peer effect and (b) describes the multiple mediating effects’ mechanism from the perspective of regional peer effect. * p < 10%, ** p < 5%, *** p < 1%.
Sustainability 15 06003 g002
Table 1. Variable definition.
TypeNameSymbolDefinition
Explained variableDigital transformationDTLogarithm is taken after adding 1 to the number of keywords for digital transformation in the annual report
Explanatory variablesIndustry peer effectJpeerSee model (1)
Regional peer effectGpeerSee model (2)
Moderating variablesTMT Gender GenNumber of female executives/total number of executives
TMT Age AgeAverage age of all executives plus 1 to take logarithm
TMT Education EduAverage education of executives averaged according to 1 = other, 2 = specialist, 3 = bachelor, 4 = master, and 5 = doctor
TMT Tenure TenuAverage number of years of service from the beginning of the executive’s tenure to the end of the tenure or the end of the year
Control variables Enterprise scaleFSTotal corporate assets
Asset-liability ratioFLTotal liabilities/total assets
Return on assetsFRNet profit/average total assets
Cash flowFCCash and cash equivalents balance/Operating income
Management shareholdingGMNumber of shares held by executives/total number of shares
Board sizeGBTotal number of board of directors
Independent directorGINumber of independent directors/total number of board of directors
Audit qualityOADummy variable; when the auditor is from the top 10 audit companies, take 1, otherwise, take 0
Institutional shareholdingOINumber of shares held by institutional investors/total number of shares
YearYear-fixed effects
Table 2. Descriptive statistics and correlation matrix.
VariableMeanStd.Dev.Median(1)(2)(3)(4)(5)(6)(7)
(1)DT1.6301.3471.3861.000
(2)Jpeer1.6300.7371.6870.530 ***1.000
(3)Gpeer1.5020.5501.5100.379 ***0.247 ***1.000
(4)Gen0.1890.1060.1770.086 ***0.144 ***0.041 ***1.000
(5)Age3.8980.0673.900−0.015 ***0.072 ***−0.124 ***−0.226 ***1.000
(6)Edu3.3480.4483.3570.209 ***0.165 ***0.091 ***−0.086 ***0.060 ***1.000
(7)Tenu3.7321.4983.6140.249 ***0.138 ***−0.008−0.023 *0.377 ***0.077 ***1.000
Note: The correlation analysis shown in the table is Pearson test. * p < 10%,*** p < 1%.
Table 3. Results of testing peer effect of digital transformation.
Variable(1)(2)(3)(4)
Model 3Model 4
Jpeer0.931 ***0.931 ***
(30.07)(29.69)
Gpeer 0.673 ***0.674 ***
(24.99)(25.37)
Control VariablesYesYesYesYes
YearYesYesYesYes
Constant0.050−3.448 ***−0.562 ***−3.531 ***
(1.03)(−8.91)(−9.95)(−8.45)
N5314531453145314
R20.2810.2990.2950.312
Note: t-values in parentheses (same as in the following table). *** p < 1%.
Table 4. Results of testing the moderating effect of TMT characteristics.
Variables(1)(2)(3)(4)(5)(6)(7)(8)
Model 5Model 6Model 7Model 8Model 9Model 10Model 11Model 12
Jpeer × Gen0.146 *
(1.69)
Jpeer × Age −0.754 ***
(−5.14)
Jpeer × Edu 0.224 ***
(10.23)
Jpeer × Tenu 0.026 ***
(4.01)
Gpeer × Gen 0.347 ***
(3.52)
Gpeer × Age −1.064 ***
(−6.84)
Gpeer × Edu 0.247 ***
(10.13)
Gpeer × Tenu 0.026 ***
(3.43)
Control VariablesYesYesYesYesYesYesYesYes
YearYesYesYesYesYesYesYesYes
Constant−3.482 ***−3.586 ***−3.688 ***−3.898 ***−2.624 ***−2.693 ***−3.075 ***−3.182 ***
(−8.98)(−8.60)(−9.48)(−9.34)(−6.67)(−6.37)(−7.80)(−7.42)
N53145314531453145314531453145314
R20.3000.3140.3030.3180.3130.3260.3020.314
Note: t-values in parentheses (same as in the following table). * p < 10%,*** p < 1%.
Table 5. Results of the robustness test.
Variables(1)(2)(3)(4)(5)(6)(7)(8)
Change VariableTobit ModelLag PeriodIV
Jpeer1.736 *** 1.241 *** 0.559 *** 0.974 ***
(6.13) (42.11) (27.16) (30.70)
Gpeer 4.088 *** 1.141 *** 0.482 *** 1.138 ***
(16.32) (28.83) (19.81) (22.03)
(4.01)(−5.68)(−4.58)(−12.49)(−8.56)(−11.97)(−4.67)(−12.53)
Control VariablesYesYesYesYesYesYesYesYes
YearYesYesYesYesYesYesYesYes
Constant−27.845 ***−26.253 ***−4.997 ***−6.782 ***−2.041 ***−3.074 ***−3.386 ***−5.169 ***
(−7.51)(−6.99)(−9.70)(−12.25)(−4.78)(−6.79)(−8.86)(−11.25)
N53145314531453145314531453145314
R20.0890.083 0.1930.1400.2980.201
Kleibergen–Paap rk LM 1540.549
(0.000)
499.979
(0.000)
Cragg–Donald Wald F 4757.691
(16.38)
2670.506
(16.38)
Note: The penultimate row in columns (7)–(8) is the p-value in parentheses. The last row of column (7)–(8) is the critical value of Stock–Yogo test at the 10% level in parentheses. *** p < 1%.
Table 6. Results of testing of the impact of digital transformation on green technology innovation.
VariableCoefficientT-Valuep-Value95% Confidence Interval
DT2−0.170 −2.310.021−0.315 −0.026
DT0.6772.370.0180.1171.238
Table 7. Result of testing the mediating effect.
EffectCoefficientT-Valuep-Value
Jpeer

DT

RD
Total effectJpeer→RD0.01816.270.000
Direct effectJpeer→RD0.01310.830.000
Mediating effectJpeer→DT0.93129.690.000
DT→RD0.00610.180.000
Jpeer→RD0.931 × 0.006 ≈ 0.006
Jpeer

RD

GTI
Total effectJpeer→GTI0.1010.330.739
Direct effectJpeer→GTI0.0200.0060.951
Mediating effectJpeer→RD0.01816.270.000
RD→GTI4.4061.640.100
Jpeer→GTI0.018 × 4.406 ≈ 0.079
Gpeer

DT

RD
Total effectGpeer→RD0.0105.630.000
Direct effectGpeer→RD0.0073.750.000
Mediating effectGpeer→DT0.67425.370.000
DT→RD0.0059.060.000
Gpeer→RD0.674 × 0.005 ≈ 0.003
Gpeer

RD

GTI
Total effectGpeer→GTI0.9913.760.000
Direct effectGpeer→GTI0.9393.550.000
Mediating effectGpeer→RD0.0105.630.000
RD→GTI5.1562.170.030
Gpeer→GTI0.010 × 5.156 ≈ 0.052
Disclaimer/Publisher’s Note: The statements, opinions and data contained in all publications are solely those of the individual author(s) and contributor(s) and not of MDPI and/or the editor(s). MDPI and/or the editor(s) disclaim responsibility for any injury to people or property resulting from any ideas, methods, instructions or products referred to in the content.

