Abstract
Damage to underground structures caused by liquefaction is one of the important types of hazards in the field of geotechnical engineering. Utility tunnels are the lifeline projects of cities. To ensure the sustainable and safe operation of utility tunnels over a design life of 100 years, this paper investigates the seismic response pattern of utility tunnels in the liquefied site. In this paper, shaking table tests were carried out on the utility tunnel in a layered liquefiable site. Based on the test data, the distribution law of acceleration field and pore pressure field in the model and the deformation of the soil were analyzed first. Then the soil-structure interaction, the strain and uplift of the structure were investigated. The results show that liquefaction of sand layers under strong earthquakes, resulting in seismic energy loss. The acceleration of the upper clay layer is attenuated by the seismic isolation of the liquefied soil. The utility tunnel affects the propagation of soil acceleration, which decays faster beneath the structure for the same height. The process of pore water pressure growth is a process of energy accumulation and the pore water pressure ratio curve and Arias intensity are significantly correlated. During the test, the phenomenon of sand boil appeared, and the cracks appeared on the ground surface and developed continuously. The utility tunnel in liquefied soil is lifted under the action of excess pore water pressure. There are vertical and horizontal displacement differences at the deformation joints. The strain in the utility tunnel at the stratigraphic junction is mainly influenced by the action of the bending moment, large shear deformation in the transverse section. The strain at the connection between the partition wall and the top slab is the largest and is the weak position of the structure, followed by the connection between the side walls and the top slab, and the bottom slab of the structure have a smaller strain. The results provide insights into the dynamic properties of soils and structures in liquefaction sites.
1. Introduction
The utility tunnel system is an important lifeline project for the city, providing people with electricity, water, gas, and other aspects of life. Currently, the use of utility tunnels in China’s urban construction is becoming more widespread, and utility tunnel projects are sure to encounter a variety of complex site conditions. Lots of utility tunnel projects were constructed in non-homogeneous liquefiable sites. Historically, the 2004 earthquake in Niigata-ken Chuetsu [1], the 2010 Chilean Muller earthquake [2] and the 2011 Great East Japan (or Tohoku) earthquake extensive ground liquefaction was observed causing building damage. The Niigata-ken Chuetsu earthquake caused extensive damage to the sewer system due to ground settlement and uplift of structures caused by liquefaction, and post-earthquake excavation investigations of the sewer system showed local damage and overall tilting of the pipes [1]. The Great East Japan Earthquake caused a large number of underground structures such as inspection wells, underground car parks, and underground pipes to rise and be damaged due to the liquefaction of the soil [3,4,5]. This shows that seismic-induced soil liquefaction and foundation damage can cause non-negligible damage to underground structures at the sites containing liquefiable layers. Therefore, it is necessary to investigate the dynamic interaction between ground containing liquefiable layers and the utility tunnel, and the force and deformation mechanism of the linear utility tunnel structure under seismic action.
Damage to underground structures caused by liquefaction is one of the important types of hazards in the field of geotechnical engineering. Liquefaction induced underground structures damage is an intersecting research topic involving multiple fields such as soil-structure interaction, soil nonlinearity, and structural seismic resistance. The damage caused by several large earthquakes throughout history has prompted research in the field of liquefaction. Initially, researchers investigated the method of discriminating liquefaction in saturated soils and the mechanism of liquefaction. Seed investigated the liquefaction of isotropic saturated sand by undrained dynamic triaxial test. The test results show that the higher the porosity, the lower the buried pressure and the higher the cyclic stress or strain, the more susceptible the soil is to liquefaction. In the 1990s, severe damage to underground structures occurred in the Kobe earthquake [6] in Japan and the chichi earthquake [7] in Taiwan, and the research on soil-structure interaction was thus emphasized with fruitful results [8,9,10,11]. With the progress of scientific research, more methods are applied to the research in the field of soil liquefaction. Much research has been conducted by researchers on the seismic performance of underground structures in liquefied sites, and many profound insights have been provided. Kang et al. [1,2,3,7] carried out an extensive survey of the post-earthquake scenes and related materials to assess the geological characteristics of the site, delineate the extent of the liquefaction zone, summarize the stratigraphic characteristics of the liquefaction zone and assess the damage to the buildings. Physical model tests are also an important method for the analysis of the seismic performance of underground structures [8,12,13,14,15,16]. Chen [17] conducted a series of large shaking table tests to investigate the damage mechanism of three-arch metro station structures in liquefiable soils under strong earthquakes. Chen substantiates that model structures and soils are more sensitive to input motions with larger low-frequency components, while the deformation of each member of the arch-shaped metro station was analyzed and the end of the central column was identified as the weak point of the structure. Tao [18] qualitatively reproduced the macroscopic phenomena of the foundation-prefabricated metro station model system in an earthquake using shaking table tests and analyzed the seismic response, mechanical properties, and deformation mechanisms of the prefabricated members, and the results showed that prefabricated metro stations in the liquefied ground have good resistance to deformation. On the other hand, Chou [9] used centrifuge model tests to analyze the stability of the BART Transbay Subway in liquefiable strata, investigating the mechanisms of pore water seepage and pore pressure growth under seismic liquefaction. The numerical approach to the structural uplift mechanism is also evaluated. Chian [19] analyzed the liquefaction uplift pattern of circular structures at different buried depths and used particle image velocimetry in centrifuge tests to study the circulation flow mechanism of liquefied soils. In terms of numerical simulation, different researchers used various numerical simulation software such as finite element, finite difference, and boundary element to investigate the soil-underground structure interaction system using different constitutive models of liquefiable soils [19,20,21,22,23]. Lu [24] used the finite difference software Flac to study the uplift mechanism of shield tunnels at different buried depths in a layered liquefiable ground and established the dynamic distribution of tunnel bending moments and shear forces. Zhao [25] proposed a modeling approach for fully coupled effective stress analysis, using a modified Msing model to capture the nonlinear behavior of liquefied sandy soils, and thus analyzing the uplift mechanism of submarine immersed tunnels under the action of progressive waves.
At present, research on the seismic performance of underground structures is often aimed at framed station structures or single-segment tunnels with circular cross-sections, and less at multi-segment utility tunnels. Utility tunnels are usually shallowly buried, large in volume and can extend longitudinally for several hundred meters or even a dozen kilometers, with deformation joints set between adjacent sections, and have significant structural characteristics. Furthermore, previous research has focused on the uplift of structures due to soil liquefaction in the homogeneous ground, whereas underground structures in the non-homogeneous liquefiable ground can be easily damaged by soil deformation.
This study investigates the seismic response of a multi-segment utility tunnel in a layered liquefiable site ground by large shaking table tests, analyses the acceleration propagation pattern, pore pressure distribution, and soil deformation characteristics in a clay-liquefiable sand ground, as well as investigates the dynamic characteristics of the structure such as spatial effects, uplift and strain patterns. The research results provide a scientific basis for the seismic design of utility tunnel projects in non-homogeneous strata.
2. Test Design
2.1. Similarity Ratio Design of the Model Soil-Structure System
The tests were carried out using the Key Laboratory of Earthquake Engineering and Structural Retrofit of Beijing’s shaking table equipment. The dimensions of the shaking table are 3 m × 3 m, the maximum working load is 100 kN, the maximum acceleration of the shaking table in the horizontal direction is 1.0 g, where g is the acceleration of gravity, and the operating frequency range is 0.1–50 Hz. In dynamic tests, the model boxes limit soil deformation and generate wave reflection and refraction at the boundaries, resulting in a difference in dynamic action between the model ground and the prototype ground, known as the boundary effect of the model boxes [26,27]. The results of shaking table tests conducted by Lei [26] on four typical rigid box boundary conditions showed that polyethylene foam panels could provide elastic support for finite domain soil media and provide some damping to attenuate the reflection of seismic waves and reduce boundary effects. A rigid boundary container with dimensions of 2.0 m (horizontal vibration direction) × 2.7 m (longitudinal) × 1.2 m (height) was used for this test, with tempered plate glass on all four sides and 5 cm polyethylene foam panels on the inner walls.
In this paper, a 1-g shaking table scale-down test of the soil-utility tunnel system was carried out. Based on Buckingham π theorem, the similarity ratios for the model test were determined as shown in Table 1. The model structure is based on length, elastic modulus, and acceleration as the basic physical quantities, and the model soil is based on shear wave velocity, density, and acceleration [16]. In this test, the dynamic response of the soil-structure system under seismic action is investigated. The flexural stiffness of the member sections controls the dynamic response of the underground structure, so the similarity ratio design should ensure that the flexural stiffness of the model and the prototype structures conform to a similar relationship [28]. The flexural stiffness FS per meter of the member can be expressed as:
where E is the elastic modulus of the material, I is the moment of inertia of the member section per meter, b is the width of the member section, and the similarity ratio of the flexural stiffness of the member per meter is λL4 according to π theorem, from which the thickness of each member of the model structure is determined as:
where bm and bp are the widths of the model and prototype sections respectively; Em and Ep are the elastic modulus of the model and prototype materials respectively, and λL is the length similarity ratio.

Table 1.
Similarity ratio design of the test.
2.2. Model Soil and Model Structure
The layered liquefiable site in this test has an upper layer of 300 mm thick low permeability clay and a lower layer of 400 mm thick saturated sand. The liquefiable sand layer was made of fine sand, which was air-dried and sieved before the test to ensure its uniformity. The sand layer was prepared by the water sinking method, and the fine sand was evenly scattered into the water with a funnel at a certain height, and the density of the model sandy soil was controlled by the drop distance. The clay layer was made from the natural clay excavated from the Beijing utility tunnel pit project and was prepared by the layered consolidation method with a compacted thickness of about 150 mm per layer. Before the test begins, specimens of clay and sand were removed from the model box for geotechnical testing. The material properties of clay were obtained using the liquid-plastic combine tester, and the material properties of fine sand were obtained using the cutting ring method and the direct shear test. The density of the clay is 1730 kg/m3, the water content is 20.5%, the liquid limit is 27.6%, and the plastic limit is 17.5%. The density of fine sand is 1800 kg/m3, the cohesion is 0 kPa, and the internal friction angle is 30°.
The model structure is based on the actual design of the Chengdu Tianfu New Area Yizhou Avenue utility tunnel project, which is a typical one-layer three-span utility tunnel structure. The structure is 4.1 m high, 11.6 m wide, and 20 m longitudinal (i.e., the longitudinal dimension of the standard segment of the utility tunnel), with a thickness of 0.45 m for the top slab, bottom slab, and side walls and 0.25 m for the partition walls, as shown in Figure 1b. Cast-in-place concrete utility tunnels are provided with deformation joints at 20–30 m intervals, and rubber water stops with steel edges and polysulfide sealing paste are used at the joints to ensure the waterproof performance of the structure. In addition, shear keys are installed at the joints to control the dislocations between the segments. One end of the shear key is anchored in the utility tunnel and the other end is inserted into the prefabricated steel pipe sleeve of the adjacent utility tunnel without bonding to the utility tunnel, as shown in Figure 1c. In this test, it is hypothesized that the utility tunnel is located at the stratigraphic junction, and the model box, model foundation, and the location of the model structure are shown in Figure 2.

Figure 1.
Prototype utility tunnel side wall deformation joints waterproofing design, (a) partial three-dimensional view of the utility tunnel, (b) standard cross-section of the utility tunnel, (c) waterproof design of the side wall deformation joints.

Figure 2.
Perspective view of the model test.
To enable the model structure to better represent the stresses and deformations of the underground structure under seismic action, gypsum composites and galvanized steel wires were used in the tests to simulate the prototype concrete and steel reinforcement. The mix ratio design for gypsum composites was taken from Zhao’s experiments [28]. The ratio of mineral powder (granulated blast-furnace slag), slaked lime, water and gypsum is 15:5:55:25. Slaked lime is the aggregate, water and gypsum are the cement, and mineral powder improves the water resistance of the composite. After 14 days of curing, the average elastic modulus and average compressive strength of the gypsum composite cube specimens were 7.7 GPa and 5.7 MPa, respectively. Considering the load-bearing capacity of the shaking table and the size of the model box, the length similarity ratio of the structure was set to 1/25, and the longitudinal dimension of the model structure was 800 mm. The shaking table test was set up UT1, UT2 and UT3, three segments of utility tunnels, with galvanized steel wires to simulate shear keys, and using sealant to waterproof the joints of the model structure, as shown in Figure 3. After the sensors inside the structure have been installed, the model structure is sealed at the ports using plastic sheets. The plastic sheet is a flexible material which has little effect on the flexural stiffness of the structure at the ports.
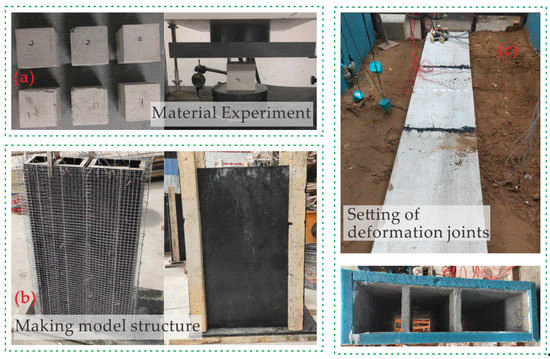
Figure 3.
The process of making the model structure, (a) Uniaxial testing of gypsum composite cube specimens, (b) tying wire mesh and casting, (c) setting of deformation joints.
2.3. Types and Layout of Sensors
In order to obtain the required data and to avoid too many sensors arranged on the same cross-section to affect the test results, three observation cross-sections were set up along the longitudinal direction in this test, as shown in Figure 2. O1-1 was located in the middle of the model and was the primary observation cross-section. The longitudinal position of O2-2 was at the port of UT1 and the longitudinal position of O3-3 was at the middle of UT3 and they were the secondary observation cross-sections. The layout of the sensors in the test is shown in Figure 4 and Figure 5. Acceleration sensors (e.g., Aa1) measure the propagation of seismic waves. Pore water pressure sensors (e.g., Wa1) measure the change in pore water pressure in liquefiable sand. Laser displacement sensors (e.g., L1) measure the vertical displacement of the ground surface. Cable displacement sensors are used to measure the vertical displacement (e.g., DV1) and horizontal displacement (e.g., DH1) of the utility tunnel. Strain gauges (e.g., S1) are attached to the structure to measure the strain during the seismic motion. The model structure was also arranged with dynamic soil pressure sensors (e.g., P1), but no valid data were obtained due to poor contact between the dynamic soil pressure sensors and the soil. Data from accelerometers, pore water pressure sensors, and strain gauges are collected using the German IMC dynamic collector and the data collected by the dynamic system needs to be low-pass filtered to reduce the effect of high-frequency noise on the results. The Cable Displacement Sensor and laser displacement sensor record the final value at the end of each stage of the test.
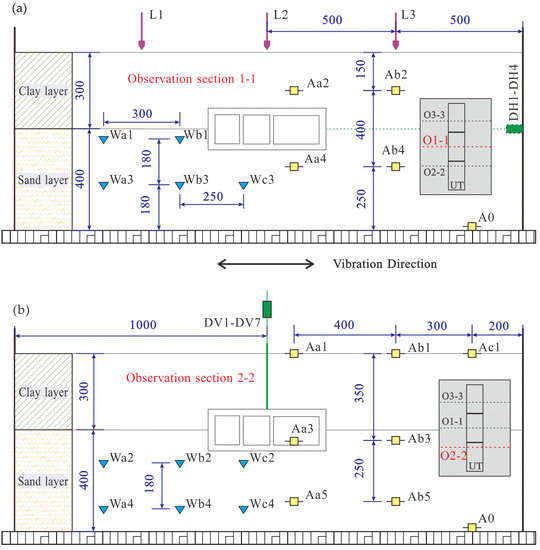
Figure 4.
Layout of sensors in the model soil, (a) the layout of sensors at the location of observation section 1-1, (b) the layout of sensors at the location of observation section 2-2.
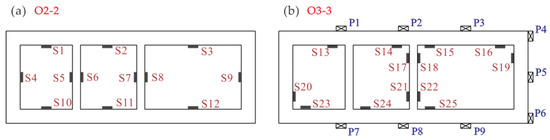
Figure 5.
Strain gauge arrangement, (a) strain gauge arrangement of the model structure at position O2-2, (b) strain gauge arrangement of the model structure at position O3-3.
2.4. Input Motion and Loading Conditions
The seismic records used in this paper were obtained from the Pacific Earthquake Engineering Research Center (PEER) ground motion database. The seismic response of the underground structure under different seismic motions was evaluated using Kobe and chichi waves. The Kobe wave is the record of “Kobe University” station in the 1995 Kobe earthquake in Japan, which is a near-field motion, and the closest distance from the station to the fault is 0.98 km. The waveform has an obvious wave packet, peak ground acceleration is 0.276 g, and low-frequency components are abundant. Chichi wave is the record of station “TCU045” in the 1995 Chichi earthquake in Taiwan, and the distance from the station to the fault is 73.5 km, with a large peak ground acceleration (361 Gal in the N-S direction). The frequency component of the chichi wave is relatively uniform and the duration of the earthquake is long. Both earthquakes induced extensive soil liquefaction and a large number of underground structures were damaged as a result [26,27].
Seismic records in the horizontal direction (Kobe wave in the N-S direction, Chi-Chi wave in the N-S direction) were used as the input motions for this test, and the input seismic motions were filtered and baseline corrected. The vibration direction of the shaker is perpendicular to the longitudinal direction of the model structure, as shown in Figure 2. Figure 6 shows the acceleration time history curves and Fourier spectra of the two seismic waves. The test was carried out in a graded loading approach to investigate the effect of seismic intensity on the soil-underground structure interaction. The low-intensity motion with 0.1 g peak ground acceleration was first input in sequence, and then the high-intensity motion with 0.6 g peak ground acceleration was input in sequence, and the loading scheme of the test is shown in Table 2. Since there is some difference between the input and output of the shaker, the acceleration data monitored on the table (acceleration at point A0) is used as the input motion in the analysis below.
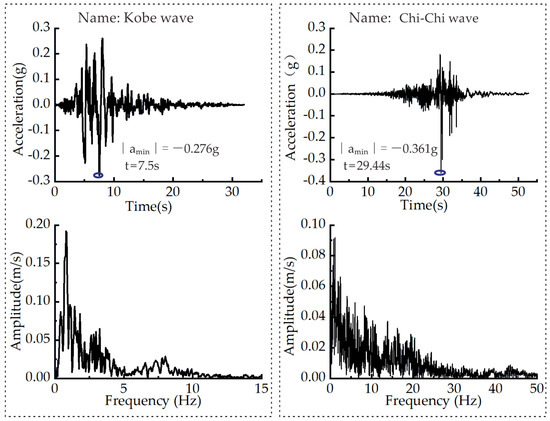
Figure 6.
Acceleration time histories and Fourier spectra of Kobe and Chi-Chi waves.
Table 2.
Loading scheme for the test.
3. Data Analysis of the Model Soil
3.1. Similarity Ratio Design of the Model Soil-Structure System
To further understand the propagation pattern of seismic motion in the layered liquefiable site, the peak ground acceleration and acceleration amplification coefficient of the soil at different depths were evaluated, where the acceleration amplification coefficient (K) is defined as the ratio of the peak ground acceleration (PGA) at different depths to the peak ground acceleration of the shaking table (A0). Figure 7 shows the peak ground accelerations and acceleration amplification factors for the different depth control points in the soil. The peak ground acceleration at each point in the model soil increases with increasing seismic intensity. When the acceleration amplitude of the input seismic motion is small (PGA = 0.1 g), the amplification factor (K) is 1.34 for the surface of the clay layer and 1.38 for the surface of the sand layer, and the acceleration in the soil shows a significant amplification effect. This is consistent with the pattern of amplification effect of soil acceleration under low-intensity loading conditions in shaking table experiments by Chen et al. [14] and Jia et al. [29]. As the seismic intensity increases (PGA = 0.54 g, 0.52 g), the acceleration amplification coefficient in the soil gradually decays. The amplification coefficient K at point Ab4 in the sand layer is 0.51, which indicates that the soil liquefies, the shear strength decreases, and the propagation capacity of acceleration in the soil diminishes. Both the peak ground acceleration and amplification factor of the shallow sandy soils are significantly attenuated and the degree of liquefaction is relatively high. The PGA and K are significantly larger at point Ab3 in the soil because Ab3 is located at the junction of the sand and clay layers. During the shaking, the pore pressure of the sand layer grows, the water encounters the clay layer with a small permeability coefficient during the upward seepage, and the shear strength of the soil increases instantly, causing a spike in the acceleration of the soil at this point. The rate of change of acceleration of the clay layer is smaller than that of the sand layer, and the acceleration distribution of the clay layer is more influenced by the sand layer. The lower sand layer liquefies and the acceleration of the clay layer attenuates, showing the effect of liquefaction isolation. The degree of attenuation of soil acceleration under Chi-Chi wave action is greater, firstly because the Chi-Chi wave was loaded after the Kobe wave in the test and the deformation of the soil accumulated, and secondly because the duration of the Chi-Chi wave is longer, which indicates that the duration of the ground motion has a significant effect on soil liquefaction. Using cumulative damage theory, Shigeki et al. analyzed the effects of the number of cyclic loads and duration on the cyclic triaxial shear strength of liquefiable soils. The results of the shaking table test were essentially similar to those of the cyclic triaxial test [30].
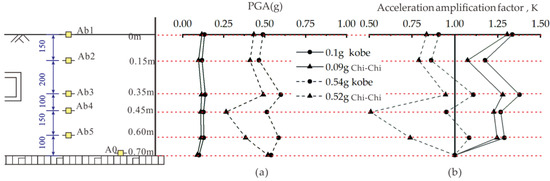
Figure 7.
Peak ground acceleration and acceleration amplification factor for control points at different depths in the soil, (a) distribution of peak acceleration along depth, (b) distribution of acceleration amplification factor along depth.
Figure 8 shows the time histories and normalized Fourier spectra of soil acceleration under the action of 0.54 g Kobe waves and 0.52 g Chi-Chi waves. It is worth noting that the measured dynamic loads at point A0 differ from the input seismic waves and that the acceleration Fourier spectra at point A0 have a relatively high-frequency component due to the influence of the shaker and model box. As can be seen from Figure 8a, the acceleration time history curve for liquefiable soils can be divided into two phases. In the first stage (0–5 s), the motions of points Aa4, Ab4, and A0 are relatively consistent, and the soil is not liquefied at this time. In the second stage (5–20 s), with increasing seismic intensity, the acceleration amplitudes of Aa4 and Ab4 decay significantly and the frequency of the time history curve decreases, indicating that the shear strength of the soil in this region has decreased and liquefaction may have occurred.
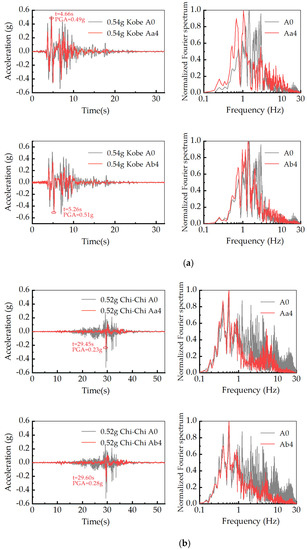
Figure 8.
Acceleration time history curves and normalized Fourier spectra for the same height control points in the soil for different seismic wave actions. (a) Acceleration and normalized Fourier spectrum of point Aa4 and point Ab4 under 0.54 g Kobe wave. (b) Acceleration and normalized Fourier spectrum of point Aa4 and point Ab4 under 0.52 g Chi-Chi wave.
In Figure 7b, the degree of liquefaction of the soil develops and there is a more significant decrease in the amplitude and frequency of the acceleration time history curve at points Aa4 and Ab4 compared to point A0. Under the same conditions, the acceleration at point Aa4 beneath the structure is less than the acceleration at point Ab4 which is away from the structure, indicating that the structure influences the distribution of the soil acceleration field. The normalized Fourier spectra of points Aa4, Ab4, and A0 are significantly different under the action of high-intensity seismic waves. The spectral components of the seismic waves change significantly during the propagation process, with the Fourier spectra shifting towards the lower frequency band and the high-frequency components decaying, showing an obvious low-frequency amplification effect, which is consistent with the Fourier spectra characteristics of the acceleration propagation process in the shaking table tests of Chen et al. [15,16,17].
3.2. Pore Pressure Characteristics of the Model Soil
Loosely saturated granular soils contract in pore volume under the shear action of seismic motion, generating excess pore water pressure. The soil loses much of its shear strength and stiffness, changing from a solid state to a liquefied state [2]. In shaking table tests, the pore water pressure ratio is commonly used as a discriminator for soil liquefaction [31]. The pore water pressure ratio is defined as the ratio of the excess pore water pressure to the initial vertical effective stress, as shown in Equation (3),
When the pore water pressure ratio is 1.0, the pore water pressure increment is equal to the initial vertical effective stress, the soil is in a liquefied state and the effective stress is zero.
Figure 9 shows the time history of pore water pressure ratios at different locations in the sand layer under different intensities of Kobe waves (sensor Wa4 damaged). It can be seen that the degree of liquefaction increases from the bottom to the top of the sand layer. With 0.1 g Kobe waves, the pore water pressure ratio at the Wa1 point in the sand already reaches 0.7. This is because the shear effect of the seismic motion reduces the pore volume of the sand layer. The pore water pressure increases, generating upward seepage. The pore pressure cannot be dissipated in time due to the obstruction of the low permeability clay layer. At the same time, the initial vertical effective stress in the shallow sandy soil is small, so the pore water pressure ratio increases rapidly. The utility tunnel has a significant impact on the distribution of the pore water pressure field, with a significant difference in the pore water pressure ratio curve between the soil beneath the structure and away from the structure. Compared to Wa1, the pore water pressure ratio at point Wc1 increases and dissipates more slowly. The pore water pressure ratio increases with the intensity of the seismic motion and reaches 1.0 at Wa1, Wb1, and Wc1 under the action of 0.54 g Kobe waves, indicating that the soil has liquefied in these areas. It was also found that the pore water pressure ratio at point Wb1 decreased more rapidly during the later stages of the shaking. It may be that the uplift of the utility tunnel has caused cracks in the clay layer and that the pore water pressure has thereby dissipated.
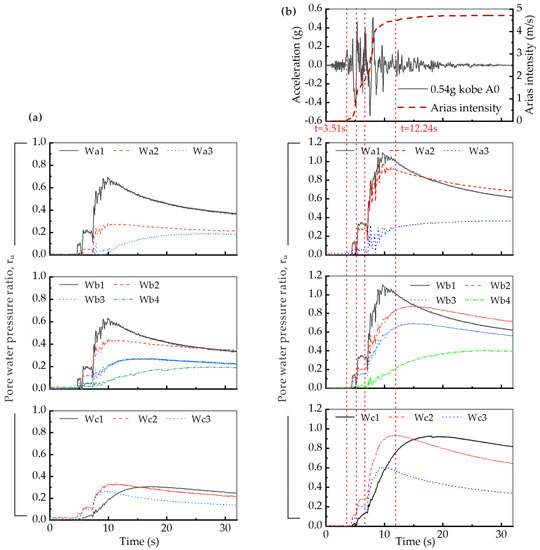
Figure 9.
Time histories of pore water pressure ratios at different locations in the sand layer under different intensities of Kobe waves, (a) time histories of pore water pressure ratios at different locations in the soil under 0.1 g Kobe waves, (b) time histories of Arias intensity and acceleration at point A0 under 0.54 g Kobe waves, time histories of pore water pressure ratios at different locations in the soil.
The time histories of the acceleration and the Arias intensity at point A0 under the action of a 0.52 g Kobe wave are shown in Figure 9b. The Arias intensity is obtained by integrating the square of the seismic wave acceleration, as shown in Equation (4), and could represent the energy of the seismic motion. A comparison of the Arias intensity and excess pore water pressure ratio curves shows a clear correlation between the pore water pressure ratio and seismic energy [14]. From 3.51–12.24 s, the Arias intensity curve rises rapidly, as does the pore water pressure ratio, but with a slight lag, suggesting that the increase in pore water pressure in sandy soils is a process of seismic energy accumulation.
3.3. Deformation of the Model Soil
Figure 10 shows the macroscopic phenomena on the surface of the model foundation during the test. The ground surface was flat before the vibrations, and after the 0.1 g Kobe wave loading was completed, the model soil had good integrity and no significant changes in the surface. Continue to input 0.1 g Chi-Chi waves and a small amount of water starts to seep out along the gap between the model box and the soil. As the intensity of the input dynamic load increases, the pore water pressure in the model soil develops under the action of the 0.54 g Kobe wave, the amount of water seepage increases, and cracks with a maximum width of approximately 12 mm appear on the surface of the soil above the utility tunnel in a north-south direction. During the loading process of the 0.52 g Chi-Chi wave, the cracks on the surface of the model ground expanded further, a large amount of water gushed out, the soil above the structure bulged and formed obvious vertical relative displacement with the ground surface on both sides, with a displacement difference of about 52 mm at the maximum, and sand boiling was observed locally, and the model foundation liquefied. The experimental results are consistent with the damage conditions of the underground structures observed in several earthquakes [1,2,3,5]. In the 2011 Tohoku Pacific Earthquake, buried conduits, underground parking lots, and a large number of manholes were uplifted, creating a huge settlement difference with the ground surface, with a maximum settlement difference of 1.5 m. When utility tunnels are located in liquefiable sites, the possibility of uplift can be reduced by soil densification, increasing the buried depth, and installing gravel piles.
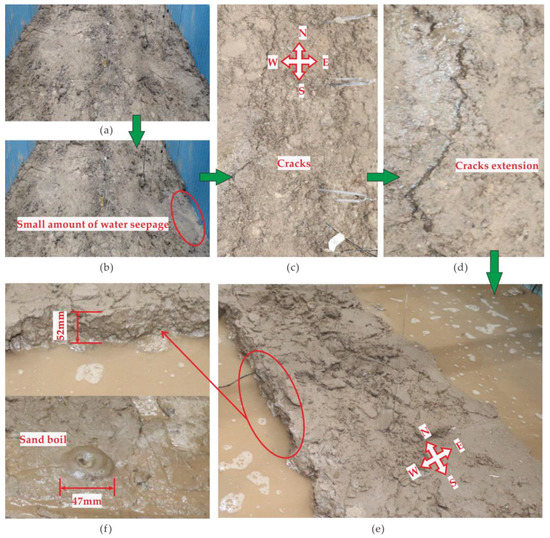
Figure 10.
Macroscopic phenomena at the surface at different stages, (a) flat surface before the test, (b) water seepage from the surface, (c) minor cracks in the surface, (d) development of cracks in the surface, (e) vertical displacement difference in the surface soil, (f) sand boil.
4. Data Analysis of the Model Structure
4.1. Acceleration Response of the Model Structure
The acceleration time histories of the structure and adjacent soil are shown in Figure 11, where Figure 11a shows a comparison of the acceleration at point Aa3 and point Aa4 for the Kobe wave (PGA = 0.1 g) and Figure 11b shows a comparison of the acceleration at point Aa3 and point Aa4 for the Chi-Chi wave (PGA = 0.52 g). As can be seen from the figure, when the seismic intensity is low, the model system is well integrated, the movements of the structure and the surrounding soil are synchronized and the amplitude of the structural acceleration is slightly higher. As the seismic intensity increases, the motion of the two is no longer synchronized, the amplitude of the structural acceleration is less than that of the surrounding soil and the frequency of the motion curve decreases. Tabatabaiefar considers that the soil-structure interaction during the earthquake increases the internal force of the underground structure. For flexible or small structures located in high shear strength soils, the effect of interaction is usually insignificant, while for underground structures in liquefiable soils, interaction is critical [32,33].

Figure 11.
Acceleration time histories for the utility tunnel and adjacent soil at different stages of the test, (a) comparison of the acceleration time histories of Aa3 and Aa4 under 0.1 g Kobe wave action. (b) comparison of the acceleration time histories of Aa3 and Aa4 under 0.52 g Chi-Chi wave action.
4.2. Displacement Characteristics of the Model Structure
Underground utility tunnels in saturated liquefiable soils have a lower total density than the surrounding soil, and in liquefied soils, the structures tend to uplift under buoyancy [21]. Figure 12 shows the vertical displacement of the structure at different loading stages and it can be seen that the utility tunnel in the clay-liquefiable sand ground rises as a whole under the dynamic load. When the PGA is 0.1 g of Kobe wave input, the maximum bulge value of the utility tunnel is 3.63 mm, and even a slight settlement occurs at point DV7. During the second loading stage, the utility tunnel lifts as a whole, and the vertical displacements of the control points approach. With the input of high-intensity seismic waves in the third and fourth loading stages, the utility tunnel showed significant uplift, and the rate of uplift increased, with a maximum uplift value of 43 mm. The uplift of the structure is accompanied by the settlement of the surrounding soil, which is consistent with the vertical displacement of the soil surface. The distribution of uplift in the utility tunnel along the longitudinal direction was not uniform, with a larger uplift in the middle segment UT-2 and a smaller uplift in UT1 and UT3, probably due to the uneven packing of the model soil in the test. There is a difference in vertical displacement between the control points on both sides of the deformation joints (DV2-DV3, DV5-DV6), the maximum vertical displacement difference is 2.05 mm.
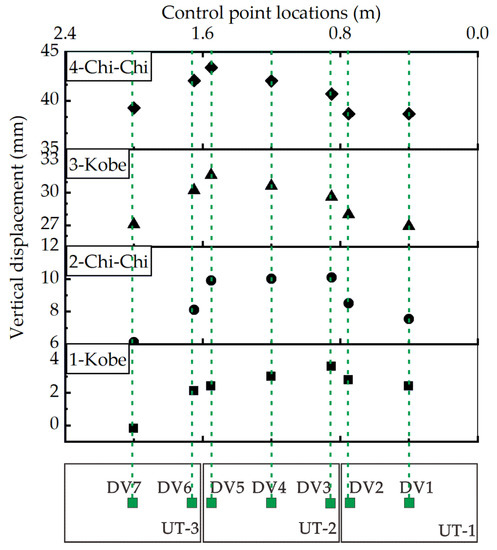
Figure 12.
Vertical displacement of the surface of the utility tunnel at different loading stages.
Table 3 is the horizontal displacement difference between the two sides of the deformation joints of the utility tunnel at different loading stages. The data measured by the Cable displacement sensors is less stable due to soil deformation, but it can be seen that the difference in horizontal displacement at the deformation joints increases as the seismic intensity increases. The model soil gradually develops from a solid state to a liquefied state during the 2-Chi-Chi and 3-Kobe stages, and the horizontal displacement difference between the two sides of the deformation joints grows considerably during this process, reflecting the large lateral displacement of the model soil. In the 4-Chi-Chi stage, the soil liquefies and the growth rate of the horizontal displacement difference decreases. The setting of deformation joints in the utility tunnel can increase the flexibility of the structure and reduce the forces on the structure. During the test, the interior of the utility tunnel was dry and the joints had good waterproofing properties.
Table 3.
Difference in horizontal displacement between the two sides of the deformation joints at different loading stages.
4.3. Strain Analysis of the Model Structure
As can be seen in Figure 5, the O3-3 observed section, the strain gauges on the partition wall of the model structure were symmetrically distributed on both sides. Theoretically, under axial forces, the strains on both sides of the member are equal in magnitude and the same state of compression or tension, while under bending moments, the strains on both sides of the member are in opposite directions [28]. From this, the strain effects of the axial forces and bending moments at the top of the left partition wall are calculated from the strain records of S17 and S18. Figure 13 shows the time history curves of the strain increments for S17 and S18 strain gauges under 0.52 g Chi-Chi waves, as well as the calculated strain increments under the action of axial forces and bending moments. As can be seen from the figure, the dynamic response of the top of the partition wall is dominated by bending deformation. The utility tunnel is located at the junction of clay and sand layers, and the difference in lateral deformation of the soil at the top and bottom of the structure is transmitted to the structure causing a large bending deformation. This calculation is in agreement with the findings reported by Wood [34] and Mahmoud [33]. Under the shear action of the earthquake, the underground structure is subjected to soil deformation and inertial action, and the rectangular cross-section structure produces transverse deformation. Bending deformation in cross section is usually more important than axial deformation or longitudinal curvature deformation in the seismic design of structures.
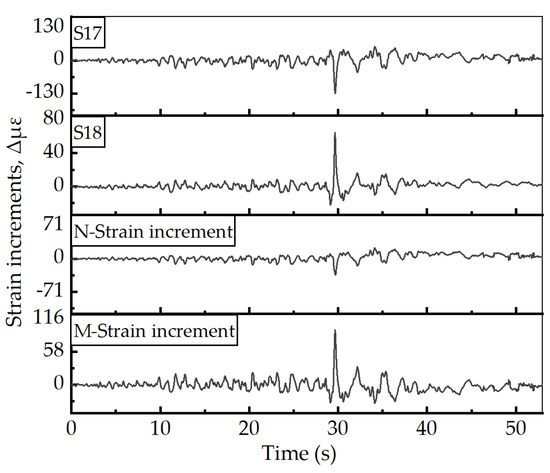
Figure 13.
Time history of S17 and S18 strain gauge increments under the action of 0.52 g Chi-Chi wave, and strain increments under the action of axial force and bending moment.
Table 4 shows the peak and residual values of the strain increments at different loading stages. The strain values at each control point are small under low-intensity seismic action, and the residual strain is essentially zero, indicating that the model structure is in a state of elastic deformation. Point S18 is located at the right partition top slab joint and S19 is located at the right side-wall top slab joint, where both strain and residual strain are higher under the action of the 3-Kobe wave. At this stage, the shear strength of the sand layer has not been completely lost and the structure is affected by the deformation of the surrounding soil, so the residual strain is relatively high. The loading continued and the strain at the top of the right partition wall continued to increase. At the end of the test, minor cracks were observed at the top of the right partition wall, the rest of the structure was intact. In general, underground structures at stratigraphic junctions have the most unfavorable deformation and force states. Construction of structures at stratigraphic junctions should be avoided in engineering. Chen [20] showed that underground structures located in homogeneous liquefiable soils or homogeneous non-liquefiable soils are subjected to less force and deformation than when the structure is locally located in a liquefiable layer.
Table 4.
Peak and residual values of strain increment at different stages.
5. Conclusions
With a design life of 100 years, utility tunnel projects in earthquake-prone regions are more likely to encounter earthquakes, and improving their seismic performance is critical to the sustainable and safe operation of utility tunnels. In this study, the seismic response pattern of utility tunnels in the layered liquefiable site was investigated by a series of shaking table tests. Based on the test data, the acceleration response, the pore pressure development pattern, and the deformation pattern of the soil in the layered liquefiable foundation were analyzed, which led to the study of the dynamic interaction between the structure and the soil, the vertical and horizontal displacement of the structure and the deformation of the structure. The main conclusions are as follows:
- (1)
- When the seismic intensity is small, the acceleration in the soil has an obvious amplification effect, and the amplification factor is greater for shallow soils. As the seismic intensity increases, the sand layer liquefies, the seismic energy is lost, the acceleration in the soil decays, and the liquefied sand layer exhibits a significant seismic isolation effect.
- (2)
- Soil liquefaction is higher at the junction of clay and sand layers. The structure influences the spatial distribution of the pore pressure field, with the structure obstructing the seepage path and the pore pressure growing and dissipating more slowly in the soil beneath it. The growth of pore pressure in liquefied foundations is an accumulation of seismic energy, and the phase of a rapid rise in the Arias intensity curve corresponds to the phase of dramatic growth in the pore water pressure ratio.
- (3)
- During the shaking table test, as the loading stages progressed, water seeped out of the surface of the model soil, cracks formed and developed on the ground surface, significant uplift of the soil above the utility tunnel, and sand boiling was observed locally.
- (4)
- In the liquefaction site, the restraining effect of the surrounding soil on the structure is reduced and the movement of the two is not consistent. The total density of the utility tunnel is relatively low, and the structure is lifted as a whole under the action of excess pore water pressure. There are vertical and horizontal displacement differences between the two sides of the deformation joints, the joints have good waterproof performance, and the deformation joints increase the flexibility of the structure to reduce the structural forces. In the test, the utility tunnel is located at the junction of the clay and sand layers, where bending action dominates the structural deformation. The strain is greatest at the internal partition wall top slab joints, followed by the side wall top slab joints, with the lowest strain at the bottom slab.
Author Contributions
Conceptualization, A.Y. and T.T.; Methodology, A.Y., T.T. and Y.G.; Resources, A.Y.; Writing—original draft, T.T.; Writing—review & editing, A.Y., T.T., Y.G. and H.L. All authors have read and agreed to the published version of the manuscript.
Funding
This research received no external funding.
Institutional Review Board Statement
Not applicable.
Informed Consent Statement
Not applicable.
Data Availability Statement
Data will be provided upon request.
Conflicts of Interest
The authors declare no conflict of interest.
References
- Kang, G.-C.; Tobita, T.; Iai, S. Damage to sewerage systems during the 2004 Earthquake in Niigata-ken Chuetsu, Japan. Eng. Geol. 2013, 164, 230–242. [Google Scholar] [CrossRef]
- Arduino, P.; Ashford, S.A.; Assimaki, D.; Bray, J.D.; Eldridge, T.; Frost, D.; Hashash, Y.M.A.; Hutchinson, T.C.; Johnson, L.A.; Kelson, K.I.; et al. Geo-Engineering Reconnaissance of the 2010 Maule, Chile Earthquake; GEER Association: Ledyard, CT, USA, 2010; pp. 1–347. [Google Scholar]
- Kohji, T.; Shuji, T.; Hiroko, S.; Kota, K. Building damage associated with geotechnical problems in the 2011 Tohoku Pacific Earthquake. Soils Found. 2012, 52, 956–974. [Google Scholar] [CrossRef]
- Susumu, Y.; Kenji, H.; Keisuke, I.; Yoshiki, K. Characteristics of liquefaction in Tokyo Bay area by the 2011 Great East Japan Earthquake. Soils Found. 2012, 52, 793–810. [Google Scholar] [CrossRef]
- Yamaguchi, A.; Mori, T.; Kazama, M.; Yoshida, N. Liquefaction in Tohoku district during the 2011 off the Pacific Coast of Tohoku Earthquake. Soils Found. 2012, 52, 811–829. [Google Scholar] [CrossRef]
- Elgamal, A.; Zeghal, M.; Parra, E. Liquefaction of reclaimed island in Kobe, Japan. J. Geotech. Eng. 1996, 122, 39–49. [Google Scholar] [CrossRef]
- Wang, T.-T.; Kwok, O.-L.A.; Jeng, F.-S. Seismic response of tunnels revealed in two decades following the 1999 Chi-Chi earthquake (Mw 7.6) in Taiwan: A review. Eng. Geol. 2021, 287, 106090. [Google Scholar] [CrossRef]
- Kutter, B.L.; Chou, J.-C.; Travasarou, T. Centrifuge Testing of the Seismic Performance of a Submerged Cut-and-Cover Tunnel in Liquefiable Soil. In Proceedings of the Geotechnical Earthquake Engineering and Soil Dynamics Congress IV, Sacramento, CA, USA, 18–22 May 2008. [Google Scholar] [CrossRef]
- Chou, J.-C.; Kutter, B.L.; Travasarou, T.; Chacko, J. Centrifuge Modeling of Seismically Induced Uplift for the BART Transbay Tube. J. Geotech. Geoenvironmental Eng. 2011, 137, 754–765. [Google Scholar] [CrossRef]
- Wang, R.; Fu, P.; Zhang, J.-M. Finite element model for piles in liquefiable ground. Comput. Geotech. 2016, 72, 1–14. [Google Scholar] [CrossRef]
- Azadi, M.; Hosseini, S.M.M. Analyses of the effect of seismic behavior of shallow tunnels in liquefiable grounds. Tunn. Undergr. Space Technol. 2010, 25, 543–552. [Google Scholar] [CrossRef]
- Chandra, J.; Guéguen, P. Nonlinear Response of Soil–Structure Systems using Dynamic Centrifuge Experiments. J. Earthq. Eng. 2019, 23, 1719–1741. [Google Scholar] [CrossRef]
- Chen, S.; Tang, B.; Zhao, K.; Li, X.; Zhuang, H. Seismic response of irregular underground structures under adverse soil conditions using shaking table tests. Tunn. Undergr. Space Technol. 2020, 95, 103145. [Google Scholar] [CrossRef]
- Tang, B.; Li, X.; Chen, S.; Zhuang, H.; Chen, H.-P. Investigations of seismic response to an irregular-section subway station structure located in a soft clay site. Eng. Struct. 2020, 217, 110799. [Google Scholar] [CrossRef]
- Chen, S.; Tang, B.; Zhuang, H.; Wang, J.; Li, X.; Zhao, K. Experimental investigation of the seismic response of shallow-buried subway station in liquefied soil. Soil Dyn. Earthq. Eng. 2020, 136, 106153. [Google Scholar] [CrossRef]
- An, J.; Tao, L.; Jiang, L.; Yan, H. A shaking table-based experimental study of seismic response of shield-enlarge-dig type’s underground subway station in liquefiable ground. Soil Dyn. Earthq. Eng. 2021, 147, 106621. [Google Scholar] [CrossRef]
- Chen, G.; Chen, S.; Qi, C.; Du, X.; Wang, Z.; Chen, W. Shaking table tests on a three-arch type subway station structure in a liquefiable soil. Bull. Earthq. Eng. 2015, 13, 1675–1701. [Google Scholar] [CrossRef]
- Tao, L.; Ding, P.; Shi, C.; Wu, X.; Wu, S.; Li, S. Shaking table test on seismic response characteristics of prefabricated subway station structure. Tunn. Undergr. Space Technol. 2019, 91, 102994. [Google Scholar] [CrossRef]
- Chian, S.C.; Tokimatsu, K.; Madabhushi, S.P.G. Soil Liquefaction–Induced Uplift of Underground Structures: Physical and Numerical Modeling. J. Geotech. Geoenvironmental Eng. 2014, 140, 04014057. [Google Scholar] [CrossRef]
- Chen, R.R.; Taiebat, M.; Wang, R.; Zhang, J.M. Effects of layered liquefiable deposits on the seismic response of an underground structure. Soil Dyn. Earthq. Eng. 2018, 113, 124–135. [Google Scholar] [CrossRef]
- Mahmoud, A.O.; Hussien, M.N.; Karray, M.; Chekired, M.; Bessette, C.; Jinga, L. Mitigation of liquefaction-induced uplift of underground structures. Comput. Geotech. 2020, 125, 103663. [Google Scholar] [CrossRef]
- Shen, Y.; Zhong, Z.; Li, L.; Du, X.; Hesham El Naggar, M. Seismic response of shield tunnel structure embedded in soil deposit with liquefiable interlayer. Comput. Geotech. 2022, 152, 105015. [Google Scholar] [CrossRef]
- Tian, T.; Yao, A.; Li, Y.; Gong, Y. Seismic Response of Utility Tunnels with Different Burial Depths at the Non-Homogeneous Liquefiable Site. Appl. Sci. 2022, 12, 11767. [Google Scholar] [CrossRef]
- Lu, C.-C.; Hwang, J.-H. Safety assessment for a shield tunnel in a liquefiable deposit using a practical dynamic effective stress analysis. Eng. Fail. Anal. 2019, 102, 369–383. [Google Scholar] [CrossRef]
- Zhao, K.; Wang, Q.; Wu, Q.; Chen, S.; Zhuang, H.; Chen, G. Stability of immersed tunnel in liquefiable seabed under wave loadings. Tunn. Undergr. Space Technol. 2020, 102, 103449. [Google Scholar] [CrossRef]
- Lei, M.; Lin, Y.; Zhou, B.-C. Model test to investigate reasonable reactive artificial boundary in shaking table test with a rigid container. J. Cent. South Univ. 2020, 27, 210–220. [Google Scholar] [CrossRef]
- Domenico, L.; Subhamoy, B.; Fabrizio, S.; Matteo, B. Dynamic response of a geotechnical rigid model container with absorbing boundaries. Soil Dyn. Earthq. Eng. 2015, 69, 46–56. [Google Scholar] [CrossRef]
- Zhao, D. Experimental Study and Numerical Simulation of Seismic Response of Urban Underground Metro Structures. Ph.D. Thesis, Tsinghua University, Beijing, China, 2013. [Google Scholar]
- Kemin, J.; Chengshun, X.; Hesham, M.; Xiaoling, Z.; Xiuli, D.; Pengfei, D.; Chunyi, C. Large-scale shake table testing of pile group-bridge model in inclined liquefiable soils with overlying crusts. Soil Dyn. Earthq. Eng. 2022, 163, 107555. [Google Scholar] [CrossRef]
- Shigeki, U.; Masahiro, K.; Shojiro, K.; Kazuhiro, N.; Kazunari, M. Effect of earthquake ground motions on soil liquefaction. Soils Found. 2012, 52, 830–841. [Google Scholar] [CrossRef]
- Seed, H.B.; Lee, K.L. Liquefaction of saturated sands during cyclic loading. J. Smfd 1966, 92, 105–134. [Google Scholar] [CrossRef]
- Tabatabaiefar, R.; Hamid, S.; Behzad, F.; Bijan, S. Seismic behavior of building frames considering dynamic soil-structure interaction. Int. J. Geomech. 2013, 13, 409–420. [Google Scholar] [CrossRef]
- Mahmoud, A.; Hussien, M.; Karray, M.; Chekired, M.; Bessette, C.; Jinga, L. Failure mechanisms of underground structures during earthquake: An overview. In Proceedings of the 68th Canadian Geotechnical Conference and 7th Canadian Permafrost Conference (Geo-Québec), Quebec City, QC, Canada, 20–23 September 2015. [Google Scholar]
- Wood, J. Earthquake design of rectangular underground structures. Bull. New Zealand Soc. Earthq. Eng. 2007, 40, 1–6. [Google Scholar] [CrossRef]


Disclaimer/Publisher’s Note: The statements, opinions and data contained in all publications are solely those of the individual author(s) and contributor(s) and not of MDPI and/or the editor(s). MDPI and/or the editor(s) disclaim responsibility for any injury to people or property resulting from any ideas, methods, instructions or products referred to in the content. |
© 2023 by the authors. Licensee MDPI, Basel, Switzerland. This article is an open access article distributed under the terms and conditions of the Creative Commons Attribution (CC BY) license (https://creativecommons.org/licenses/by/4.0/).