Article

Modeling the Impact and Risk Assessment of Urbanization on Urban Heat Island and Thermal Comfort Level of Beijing City, China (2005–2020)

1
School of Landscape Architecture, Beijing Forestry University, Beijing 100107, China
2
School of Architecture, Tianjin University, Tianjin 300272, China
3
School of Architecture, Southeast University, Nanjing 210018, China
*
Author to whom correspondence should be addressed.
Sustainability 2023, 15(7), 6043; https://doi.org/10.3390/su15076043
Submission received: 12 February 2023 / Revised: 24 March 2023 / Accepted: 28 March 2023 / Published: 31 March 2023
(This article belongs to the Section Sustainable Urban and Rural Development)

Abstract

:
Rapid urbanization poses a threat to various ecosystem services. Beijing has undergone extensive infrastructure development in recent years. The study aims to extract land surface temperature (LST) and land use cover (LUC) data from satellite imagery, identify urban heat island (UHI) areas in Beijing, and determine the correlation between LST, LUC, NDVI, and BUI. It will also investigate the relationship between UHI and built/unbuilt areas, evaluate thermal comfort in Beijing using UTFVI, and assess the ecological quality of different land use types using the Ecological Evaluation Index (EEI). The results can inform urban planning and management in rapidly urbanizing and climate-changing regions. Changes in LUC and other activities affect the distribution of LST. For the study years (2005–2020), the estimated mean LST in Beijing was 24.72 °C, 27.07 °C, 26.22 °C, and 27.03 °C, respectively. A significant positive correlation (r = 0.96 p > 0.005) was found between LST and urban areas with other infrastructures. Geographically weighted regression (GWR) outperformed with Adj R2 > 0.74, suggesting that the extent of an urban heat island (UHI) is strongly dependent on the settlements, LUC composition, size, and terrain of surrounding communities. Urban hotspots in the city were identified and validated using Google Earth imagery. The Ecological Evaluation Index (EEI) value was relatively low compared to other ecosystem-related units. EEI showed a continuous increase of six percent in the most negative categories, indicating an unstable environment. This study concludes that urbanization affects the city’s environment, and study findings would help to regulate the urban ecosystem in Beijing.

1. Introduction

Land use cover (LUC) change is mainly due to the alteration of natural vegetation at local and extra-local scales through deforestation, urbanization, and agricultural expansion [1,2]. The change in LUC leads to many environmental problems, such as biodiversity loss, greenhouse gas increase, surface temperature change (LST), and favored precipitation anomaly [3]. Urbanization has become a global issue due to population growth, industrialization, and infrastructure development. In conjunction with urbanization, the change in LUC is one of the leading causes of LST fluctuations in urban regions [4,5,6]. Due to the adverse effects of LST on the urban environment, the link between LUC and LST is currently gaining scientific interest [7]. In China, the second largest economy in the world, urbanization is progressing rapidly, and the number of built-up areas, residential neighborhoods, and new cities is increasing tremendously [2,8]. Therefore, it is essential to take appropriate urbanization measures to adjust the land use structure and landscape patterns. Understanding the relationship between urbanization and landscape patterns can contribute to improved sustainable urban environmental management policies [9,10,11]. The expansion of populations and the socioeconomic activities accompanying them in newly developed cities present significant challenges to the sustainable development of housing, infrastructure, food security, ecosystem services, and the management of natural resources [5].
Recent research has shown that human-induced LUC alteration can significantly change ecosystems’ radioactive, thermodynamic, climatic, and hydrologic processes. Changing LUC has implications for studying climate change and its environmental effects since LST is a vital proxy indicator for studying land surface dynamics [12,13,14,15,16]. Measuring LST and LUC was challenging until remote sensing and similar technologies were introduced. In addition to tracking LST over time, spatial datasets derived from various satellites now allow comparison with the effects of land use changes caused by urbanization [16,17,18,19].
Urban heat island (UHI) effects are a well-documented phenomenon, whereby air temperatures and land surface temperatures (LST) are higher in urban areas than in nearby rural areas [4,20]. This is primarily caused by the high rate of near-surface energy emissions, waste heat emissions, absorption of solar radiation by ground objects, and low evapotranspiration concentration [21,22,23,24]. Extensive research has shown that an increase in urban concentrations leads to variations in regional temperatures, causing the UHI effect to accumulate in large cities in recent decades [10,25,26]. The impact of landscape patterns on UHI effects has also been extensively studied, with built-up places and barren land tending to accelerate the effects of UHI, while open spaces and water have a calming effect. It has been found that the composition and configuration of the landscape significantly influences LST. Therefore, urban planning and design strategies can play a crucial role in mitigating the UHI effect by promoting green spaces and water bodies [13,27,28]. It is also worth noting that social and socioeconomic factors can have specific impacts on LST trends. For instance, the presence of industrial areas, transportation hubs, and other urban features may contribute to higher LST in specific neighborhoods or regions, leading to health disparities and other negative consequences. Therefore, it is essential to consider not only the physical environment but also the social and economic aspects of urban planning when addressing UHI effects [2,14,21,27]. The UHI effect is a complex and multifaceted problem that requires a comprehensive and interdisciplinary approach. By understanding the various factors that contribute to UHI effects, we can develop effective strategies to mitigate their impacts and create a more sustainable and livable urban environment.
Most studies conducted at LST using satellite imagery focused on low cloud cover. The data collected is then used to develop a comprehensive understanding of the various factors affecting the development and maintenance of the region. The results of these studies are then used to propose strategies to mitigate and adapt to climate change [2,14,21]. This concept needs to be revised because studies show that UHI and LST variability is very high over the day and time. Therefore, understanding the space-time variability of the two instruments is very important for developing effective climate change mitigation strategies [2,14,23,27]. Therefore, the studies must be conducted with imagery that orbits the Earth several times a day, as this will allow them to capture a more comprehensive understanding of the climate.
Rapid economic growth, especially in large cities such as Beijing, significantly impacts urban ecosystems, changing their function and structure. Regular macro and intermediate scale monitoring is needed to assess the impact of changes from LUC to LST. Beijing is the largest urbanization hotspot in the country at the moment. No detailed information has been published on LUC and its associated impacts on LST. The objectives of this study are to (1) extract LST and LUC from Landsat 5 TM and Landsat 8 OLI/TIRS data; (2) identify UHI and non-UHI areas in the Beijing metropolitan region; (3) correlate LST with LUC, NDVI, and BUI for all of Beijing and determine the existence of UHI and non-UHI effects within the city; (4) investigate how UHI is related to the built and unbuilt areas of the city; and (5) evaluate thermal comfort in Beijing based on UTFVI values.

2. Materials and Methods
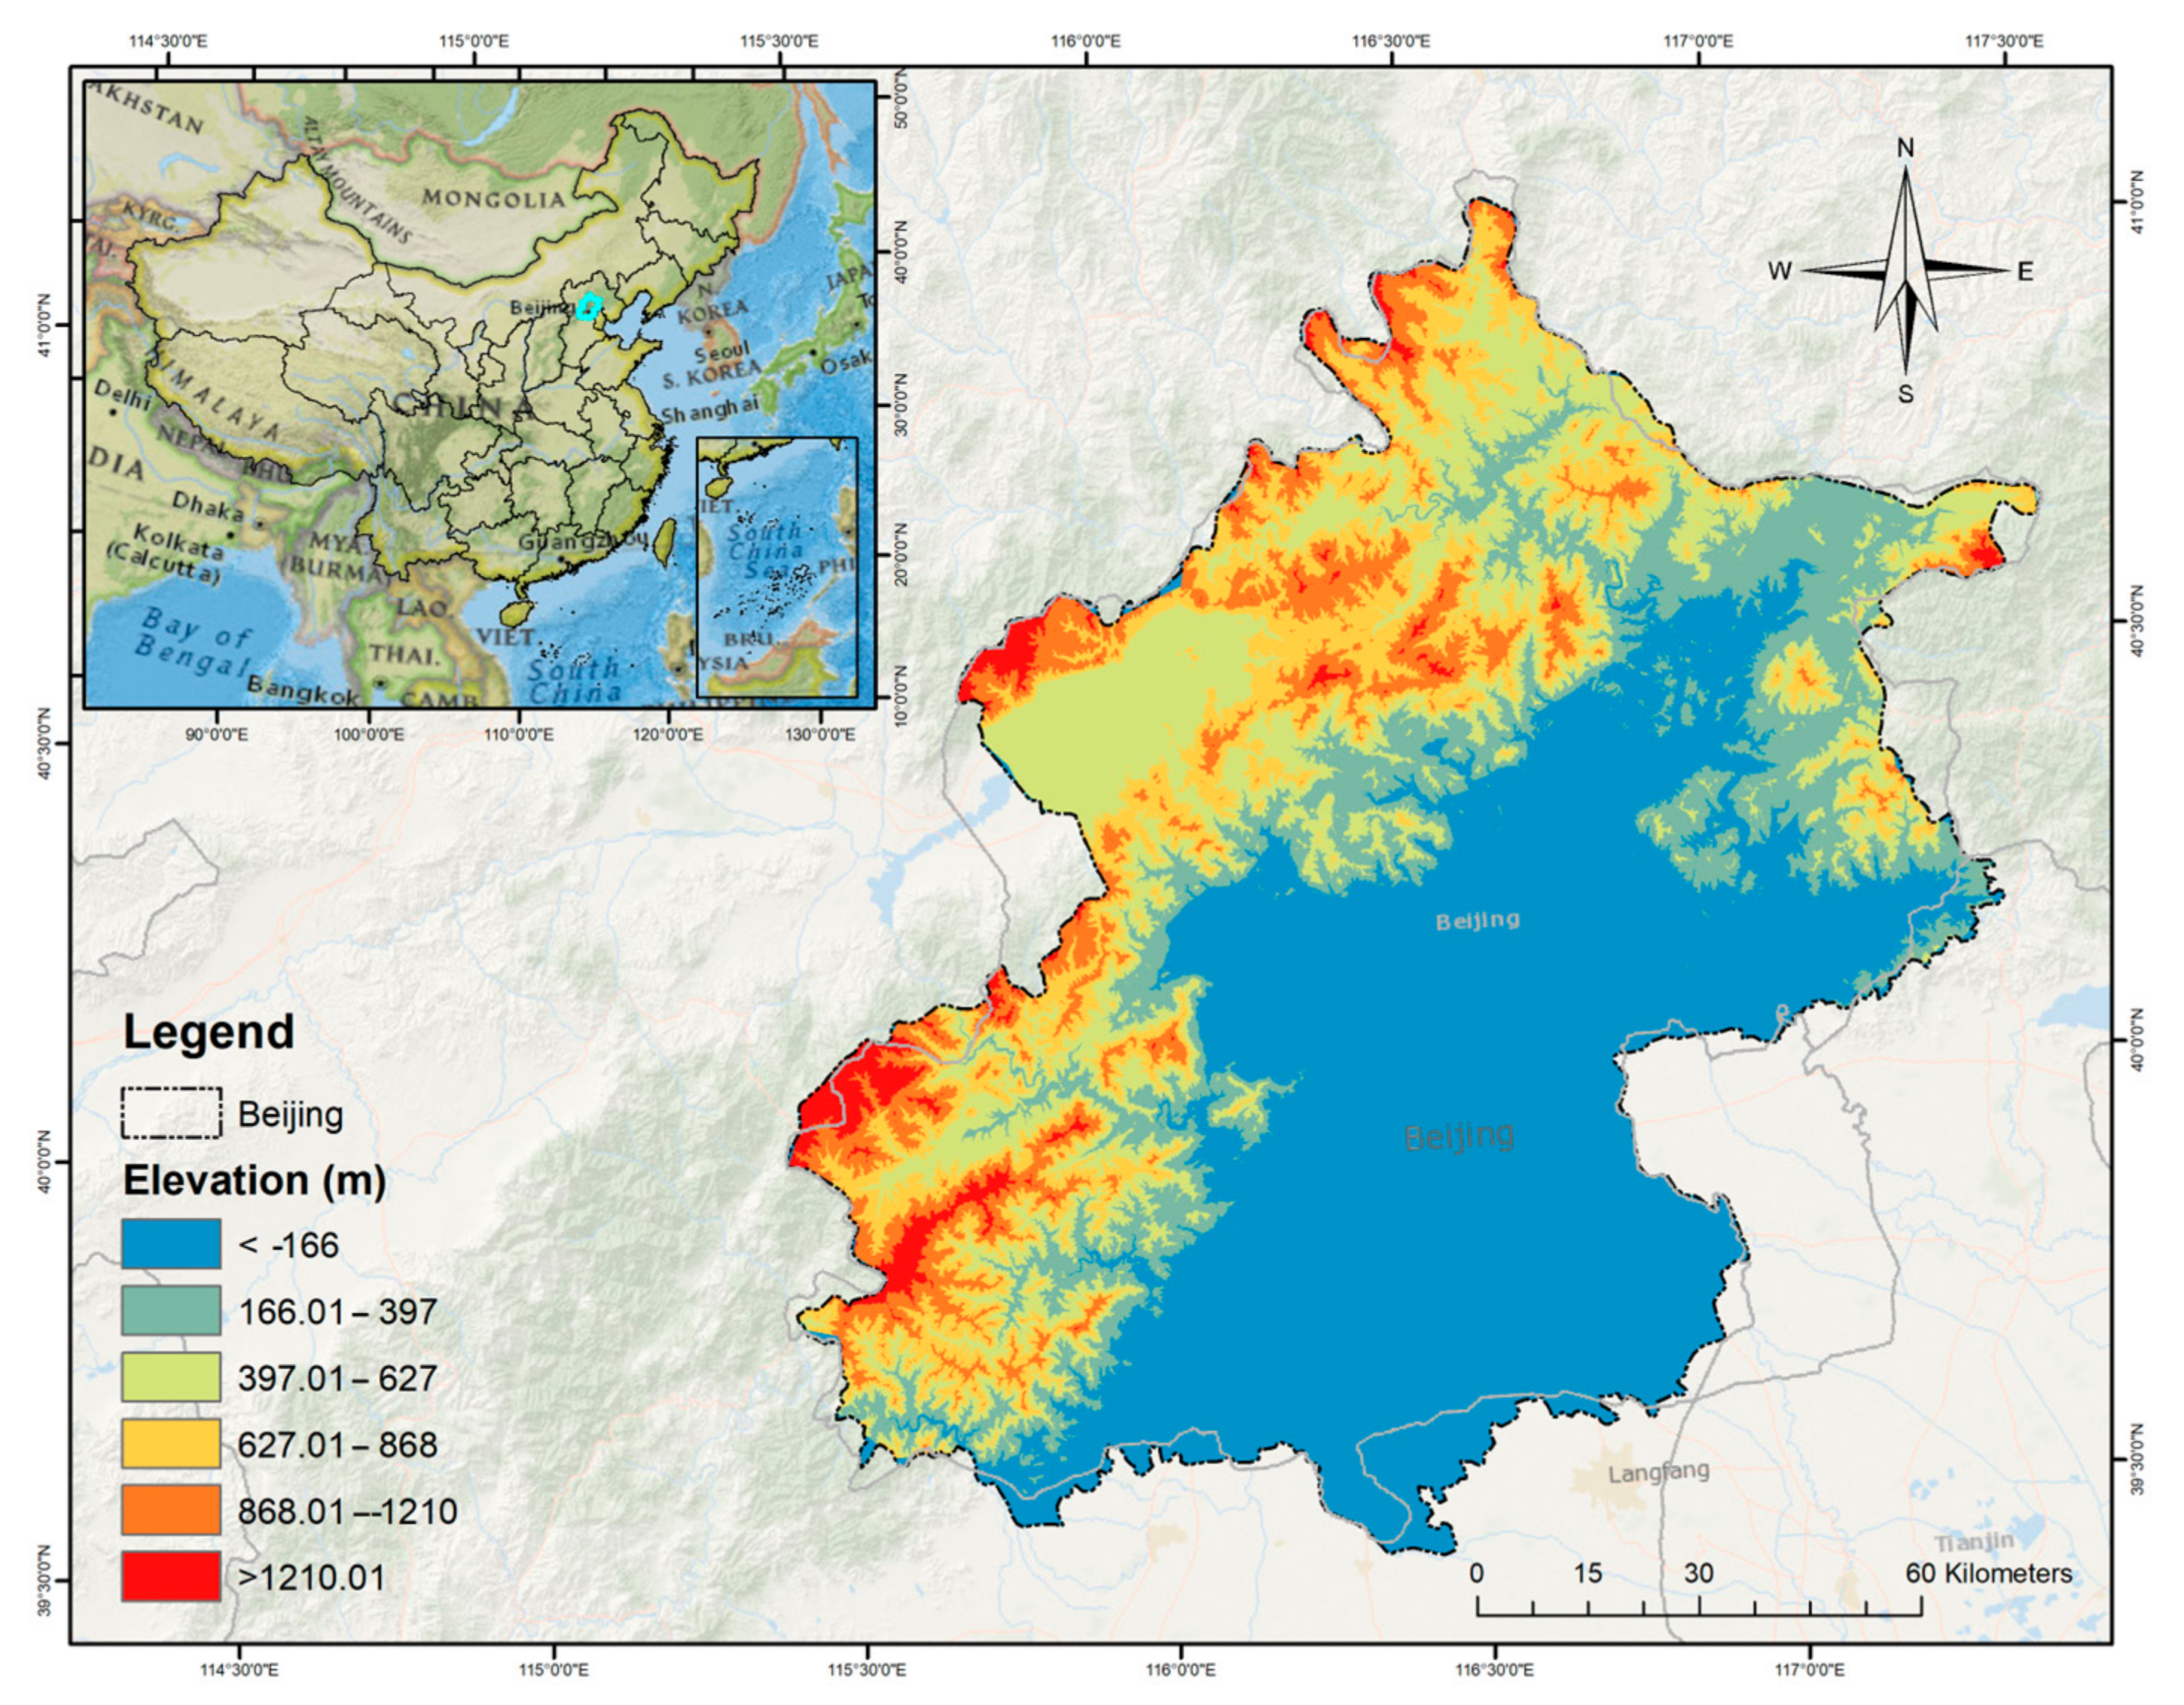
2.1. Study Area

Beijing is the capital of the People’s Republic of China (Figure 1). Its latitude is 39°26′ N, and its longitude is 115°25′ E. It has 16410.54 km2 of urban space spread over 14 districts and two counties (Beijing Statistical Bureau, Beijing, China, 2010). The metropolitan area is bounded west and north by high mountains with elevations ranging from 1000 to 1500 m. It has a sparsely populated plain of 6390.3 km2 in the metro area’s east and south. According to the Beijing Urban Master Plan (2005–2020), it can be split into four functional zones [21,29,30,31]. The region is characterized by a sub-humid, temperate continental monsoon climate, which brings about four distinct seasons. Winters are typically calm and windy, while summers are sunny and humid. The environmental challenges faced by Beijing have garnered international attention [12,21]. In the spring, sand and dust storms occur, the production of UHI in the summer, and pollution haze in the winter. Climate, location, ventilation, pollution sources, and urbanization processes are all intertwined [12].

2.2. Data Pre-Processing

For the estimation of LST and LUC, a set of remote sensing data with a spatial resolution of 30 m was acquired from Landsat 4–5 Thematic Mapper (TM) and Operation Land Imager (OLI, Landsat 8), covering different periods between 2005 and 2020 (Table 1) [32]. The primary goal was to utilize Google Earth Engine (GEE) to identify cloud-free images captured during the same season as each sample year. Before the identification of Land Use Change (LUC), a pre-treatment procedure was implemented to remove atmospheric impacts from Landsat imagery. A field survey was conducted to evaluate the accuracy of the thematic layers, collecting an average of 300 ground control points for each land use cover class. Digital elevation model data (DEM) were obtained from Shuttle Radar Topography Mission (SRTM) [33] using GEE. To achieve stronger visual contrast, each scene of Landsat imagery was adjusted using the histogram equalization approach [21,34].

2.3. Experimental Design

Following the intended method (Figure 2), the datasets were processed in Google Earth Engine (GEE) to create a false color composite (FCC). Afterward, the procedure involved computing the Normalized Difference Vegetation Index (NDVI), Built-up Index (BUI), and Land Surface Temperature (LST) to identify UHI and non-UHI areas within the city. Then, each scene was classified using the supervised image classification method. The Normalized Difference Vegetation Index (NDVI), Built-up Index (BUI), and LST were calculated, and then we determined UHI and non-UHI zones within the city [5,8,26,30,35,36]. Pearson correlation analysis was used to draw statistical conclusions for 2005 and 2020 by using the mean LST and the relative percentages of the different land use cover categories, NDVI, and BUI. The Ecological Evaluation Index (EEI) mapping was performed for Beijing using UTFVI. All spatial statistical analyses and maps were generated utilizing ArcGIS 10.7

2.4. Land Use Cover Change (LUCC) Calculation

An advanced supervised machine learning algorithm known as Random Forest (RF) was applied in this study to produce the land use cover (LUC) classification data. RF is used in remote sensing for processing spectral images [21,37]. Five scenes of Landsat satellite images were used for different dates from 2005 to 2020 to classify each reference year. The images were obtained from July 2005 to July 2015 using Landsat-5 TM multispectral images and from July 2015 to July 2020 using Landsat-8 OLI multispectral images. A classification model was used to categorize the types of LUC across all spatial scenes, including built-up areas, water bodies, urban vegetation, forest, cropland/agricultural land, and barren land. The accuracy of the classified images and signatures was assessed using a confusion matrix [14,38,39]. Image classification was performed in the code editor of the GEE platform. After generating a classification matrix, we utilized it to assess the precision of both the signature and image. The matrix’s rows indicate the categories we derived from the images, and the columns represent the reference values for each category. To demonstrate the effectiveness of our algorithm, we divided the total number of pixels by the entries in the primary segment. We then applied Equations (1)– (3) to determine the kappa coefficient [32,40,41].
P 0 = i = 1 r ( P i + P + j )
P c = i = 1 r ( P i + P + j )
K Λ = P 0 P c 1 P c
In above Equations (1)–(3), “r” denotes the number of rows present in the error matrix. The variable “Pij” represents the proportion of pixels located at the intersection of row ‘i’ and column ‘j’, while “Pi” represents the proportion of the marginal total present in row ‘i’. Additionally, “P+j” denotes the proportion of the marginal total located in column ‘j’.

2.5. Estimation of NDVI, NDBI, and Built-Up Index

Globally, the Normalized Difference Vegetation Index (NDVI) is widely recognized as the most commonly utilized vegetation index for evaluating greenery. Similarly, the Normalized Difference Building Index (NDBI) and Buildup Index are commonly used to indicate the proportion of buildings and developed areas [3,8,9]. The assessment of these indices often involves using the following Equations (4)–(6), which rely on the ratio of the near-infrared (NIR), red band (RED), and short-wave infrared (SWIR) wavelengths (4–6) [25,42]. These Index values range from −1 to +1, depending on the objects found at the ground surface level [9].
N D V I = N I R R E D / N I R + R E D
N D B I = S W I R N I R / S W I R + N I R
B U I = N D B I N D V I

2.6. Calculation of Land Surface Temperature (LST)

We calculated the Land Surface Temperature (LST) by utilizing data collected from the thermal band of the Landsat 5/8 satellite. The Radiative Transfer Equation (RTE) was applied to compute parameters such as atmospheric transmittance, spectral radiance, and brightness temperature. From this Equation (7), we derived the LST [22,29,41].
Land   Surface   Temperature   ( LST )   = T B 1 + λ σ T B / h c ln ε
where λ represents the effective wavelength of 10.9 mm for a thermal band in Landsat 8 data, σ denotes the Boltzmann constant with a value of 1.38 × 10⁻²³ J/K, h represents Plank’s constant which is 6.626 × 10⁻³⁴ Js, and c represents the velocity of light in a vacuum with a value of 2.998 × 10⁻⁸ m/s.

2.7. Mapping UHI and Non-UHI

Urban heat islands (UHI) and non-UHI were identified from the range values of LST by using Equations (8) and (9) [43,44,45].
L S T > μ + 0.5 δ
0 < L S T μ + 0.5 δ
Here, the symbol μ represents the arithmetic mean, while δ represents the standard deviation.

2.8. Delineating Urban Hot Spot Areas (UHS)

The LST maps were used in this study to delineate UHS areas around Beijing to facilitate their further monitoring. These areas are too warm and uncomfortable for people and are mainly caused by the UHI. These UHSs were delineated using the following Equation (10) [9,43,46].
L S T > μ + 2 δ
where μ and δ are the mean and standard deviation of LST.

2.9. The Urban Thermal Field Variance Index (UTFVI)

The UTFVI value was also measured to elucidate the influence of urban heat islands (UHI) on the urban environment in Beijing. The higher the LST value, the higher the heat, and vice versa. There are several thermal comfort indices to evaluate the impact of UHI on urban quality. UTFVI was used in this analysis for the environmental assessment of UHI zones in Beijing. UTFVI was estimated using the following Equation (11) [47,48,49]:
U T F V I = T s T m e a n T m e a n
The UTFVI, which stands for Urban Thermal Field Variance Index, is calculated based on the LST (°C) represented by Ts, and the Mean LST (°C) represented by Tmean.

3. Results

3.1. Land Use Cover Changes

The spatially explicit maps of LUC were prepared for 2005, 2010, 2015, and 2020 and comprised six classes: (i) water, (ii) vegetation, (iii) forest, (iv) urban, (v) barren land, and (vi) cropland (Figure 3A). The area of water bodies was 559.65 km2 in 2005 and 472.63 km2 in 2020, and a significant decrease (87.01 km2) in water area was observed during 2005–2020. The area of vegetation/urban planting was 2266.87 km2 in 2005 and 363.57 km2 in 2020, showing a net decrease (1903.30 km2) in vegetation cover during this period. This poses a severe socio-environmental threat to urban dwellers, as the lack of green space in urban regions can increase air pollution, surface temperature, and flooding in cities. In 2005 and 2020, the area of forest, wasteland, and cropland was documented as 7775.58 km2 and 7921.90 km2; 7921.90 km2 and 319.81 km2; and 4491.05 km2 and 5618.86 km2, respectively.
During this period, the forest area increased significantly (146.32 km2), while wasteland area decreased by 191.98 km2 and the cropland area increased by 1127.82 km2. Similarly, the built-up area accounted for 1743.73 km2 and 2651.88 km2 in 2005 and 2020, respectively, with an inverse cumulative change of 16% between 2005 and 2020 (Figure 4A).
During 2005–2010, the vegetation/urban greening area decreased by 874.64 km2 (−5%). A similar trend (decreasing) was also observed for water bodies (5.98 km2, <0.06%) and barrens/lowlands (193.30 km2, 1%). However, forest area (663.39 km2, 4%) and urban area (723.97 km2, 4%) increased during the same period, while cropland decreased by 263.44 km2 (2%) (Figure 4B). Thus, in the period 2010–2015, forest land increased by about 308.72 km2 (4%), wasteland/lowland decreased by 5.17 km2 (<0.08%), vegetation/urban plantation decreased by 534.36 km2 (3%), cropland increased by 448.57 km2 (3%), and urban land decreased by 178.73 km2 (1%). From 2015 to 2020, urban plantation decreased by 494.31 km2 (3%), forest land decreased by 825.80 km2 (5%), barren land/lowland increased by 6.50 km2 (<0.06%), arable land increased by 942.69 km2 (5%), and urban land increased by 362.92 km2 (2%).

3.2. NDVI, NDBI, and Built-Up Index

The mean NDVI values were 0.518, 0.527, 0.452 and 0.529 for 2020, 2015, 2010 and 2005, respectively, and the mean NDBI values were −0.723 (2020), −0.730 (2015), −0.604 (2010), and −0.731 (2005) for Beijing City. Similarly, the BUI was measured as 0.291 in 2020, 0.268 in 2015, 0.239 in 2010, and 0.254 in 2005. The spatial distribution of NDVI and BUI is shown in Figure 3B and 3C, respectively.

3.3. Land Surface Temperature (LST)

The spatial distribution of Land Surface Temperature (LST) in the Beijing ecoregions for 2005, 2010, 2015, and 2020 can be seen in Figure 3D. The mean LST values for these years were calculated as 24.72 °C, 27.07 °C, 26.22 °C, and 27.03 °C, respectively. The LST values were divided into five categories: (i) <20 °C; (ii) 20–25 °C; (iii) 25–30 °C; (iv) 30–35 °C; and (v) >35 °C, which defines the main pattern of surface temperatures in the study region.
The total area with temperatures below < 20 °C was estimated to be about 968.45 km2 in 2005, 541.49 km2 in 2010, 65.60 km2 in 2015, and 69.33 km2 in 2020. For 20–25 °C, these values correspond to about 9158.75 km2, 4323.23 km2, 4485.90 km2, and 5079.99 km2, respectively. For 25–30 °C and 30–35 °C, the corresponding areas were about 5940.89 km2 and 1137.23 km2 in 2005, 8504.28 km2 and 3791.73 km2 in 2010, 12056.13 km2 and 669.56 km2 in 2015, and finally 8637.82 km2 and 3362.27 km2 in 2020. Similarly, the values for the areas categorized at >35 °C are 73.91 km2 (2005), 117.87 km2 (2010), 2.62 km2 (2015), and 129.88 km2 (2020) (Figure 5A).
From 2005 to 2020, the cumulative change of LST was calculated and shown in Figure 5B. The area under <20 °C decreased by 899.12 km2 (5%), the area between 20 and 25 °C decreased by 4078.76 km2 (24%), there was an increase of 2696.94 km2 (16%) for the 25–30 °C category, an increase of 2225.04 km2 (13%) for 30–35 °C, and an increase of 55.98 km2 for >35 °C.

3.4. Spatial Distribution of UHI and Non-UHI

Urban heat intensity refers to the disparity between the mean temperature of urban heat islands (UHI) and non-UHI regions (as indicated in Table 2). In Beijing, UHI areas exhibited a persistent expansion pattern from the southwest to the northeast in 2005 and from the southwest to the southeast in 2010 and 2015. However, in 2020, this zone spread from the southwest to the east/southeast and further into the central part of the city. The threshold for non-UHI was estimated to be 19.10 °C, 18.95 °C, 19.60 °C, and 22.47 °C for 2005, 2010, 2015 and 2020, respectively. Our results showed that average UHI values fluctuated from high to low and then back to high over the years. Several factors contribute to these changes, including changes in land use, urbanization, and climate variability. For example, changes in land use can alter the surface characteristics of urban areas, such as the number of impervious surfaces and green space, which can affect UHI levels. Similarly, urbanization can create microclimates, such as heat islands, affecting UHI. Climate variability, including temperature and precipitation pattern changes, can also affect UHI intensity.
For the UHI in Beijing City, the standard deviation values of LST show more significant variability than those of non-UHI. The mean values of LST for UHI were 35.075 °C, 36.25 °C, 34.77 °C, and 36.86 °C in 2005, 2010, 2015 and 2020, respectively, which are higher than the mean values of LST for non-UHI areas throughout the 15 years.

3.4.1. Identification of Urban Hot Spots (UHS)

Urban hot spots in built-up areas along Beijing’s western and central regions were abundant because of the lack of vegetation and shade. In contrast, the albedo was higher on the surface. The thresholds of 35.075 °C, 36.25 °C, 34.77 °C, and 36.86 °C per year were estimated at UHS from 2005 to 2020, respectively. The prominent locations for UHS are parking lots, plazas, highways, power plants, metal roofs, aluminum and glass structures, and manufacturing facilities. These hotspots have little or insignificant water and vegetation.

3.4.2. Ecological Evaluation through the Use of UTFVI

The study uses UTFVI to quantitatively explain heat islands’ environmental, health, microclimate, and resilience impacts on cities. UTFVI values were [48,50,51] divided into six separate ecological assessment indices (Table 3). Figure 6 shows that the percentage of areas in Beijing in 2015–2019 was almost the same for two severe ecological assessment categories: the “excellent” (UTFVI < 0) and “poor” (UTFVI > 0.020) categories. Areas in the first category benefit from good hot springs (i.e., UTFVI < 0) with abundant forest, dense vegetation, water bodies, and wetlands. Such thermal conditions are most prevalent in Beijing’s southwestern and northeastern areas (yellow-colored portions). However, a considerable part of the city also falls into the last category (UTFVI > 0.020) of the ecological assessment index (Tuscan red-colored areas). However, a considerable part of the city also includes the latter category (UTFVI > 0.020) of the ecological assessment index (Tuscan red-colored parts). The strip extends from the southwest to the east of Beijing and mainly belongs to the “worst” category in its urban area. Like wasteland, farmland, or urban plants, most fields are impenetrable to nature. In some small patches around the areas with “excellent” conditions, the “good” and “normal” thermal conditions (i.e., 0 < UTFVI < 0.02) are found, while around the built-up areas, the “bad” and “worse” conditions are found.
The area estimates for “bad” (1265.64 km2, 7%), “worse” (844.79 km2, 5%), and “worst” (1346.85 km2, 8%) for urban thermal intensity zones in 2005. In 2010, the areas calculated for “bad,” “worse,” and “worst” zones were approximately 1919.10 km2 (11%), 1269.79 km2 (7%), and 1008.11 km2 (6%), respectively. Similarly, in 2015 and 2020, 1147.16 km2 (7%) and 1430.42 km2 (8%) were respectively classified as “bad,” 416.06 km2 (2%) and 1173.48 km2 (7%) as “worse”, and 163.23 km2 (1%) and 1182.42 km2 (7%) as “worst”.

3.5. Statistical Analysis of the Data

3.5.1. Relationship between the LST and Land Use Indices

Land surface temperature (LST) statistically correlates significantly with urban/developed areas (Figure 7). There was no significant relationship between LST and water or vegetation, but there was a strong association between LST and forested areas. There was also a negative and insignificant relationship between LSTs in urban areas and water and vegetation. The simple correlation coefficient confirms the favorable and significant relationship between urban/developed areas and LST. As a result, an increase in temperature in a metropolitan area may also be caused by the increase in buildings, roadways, stores, and other commercial and industrial regions. A significant positive relationship exists between the LST and barren land. On the other hand, there is a negative relationship between the LST, agricultural land, and farmland. The NDVI exhibited a negative statistically insignificant correlation with LST. A positive but insignificant correlation was observed between the LST correlation between the NDBI and the other development index. In the correlation between land surface temperature (LST) and building density or building index (BUI), our analysis showed an initial decrease in correlation followed by an increasing trend. This trend can be attributed to land use and urbanization changes that may affect the relationship between LST and BUI. For example, higher development density may initially decrease the correlation between LST and BUI by limiting the area available for vegetation cover. However, higher building density may lead to greater heat accumulation in urban areas over time, resulting in a stronger correlation between LST and BUI.

3.5.2. Spatial Regression Analysis

Geographically weighted regression (GWR) is valid for analyzing spatial, size-dependent phenomena in this direction. Using GWR has helped assess and evaluate the variance on a spatial scale by following the influencing factors. Because of its better fitting performance and providing comprehensive information on the influence of geographic and environmental factors on the spatial variation of LST, it outperforms the conventional OLS system and Urban Heat Island. The adjusted R2, AICc, and MI of the expected residual were used to evaluate the validity of the global OLS and local GWR models. In the case of the built-up area, the adjusted R2 value is 74.90, with a significance level of > 95% (Figure 8). The global Ordinary Least Squares (OLS) model assessed the statistically significant correlation among Urban Heat Island (UHI), Land Use Change (LUC), and other biophysical factors.

4. Discussion

The relationships between LST and LUC have been studied previously. This study utilized remote sensing applications to identify the alterations in temperature and land use cover (LUC) in Beijing from 2005 to 2020. The results are expected to provide scientific evidence for developing testable hypotheses, help measure ecological vulnerability, and help determine the specific contributions of LUC change to LST hotspots [16,18,36,47]. The study aimed to analyze the various measures used to mitigate urbanization’s impacts on the urban climate. It revealed that urban sprawl causes an increase in LST. This phenomenon is believed to contribute to the increase in UHI and climate change [20]. The other factors significantly influencing the LST are the NDVI, NDBI, or BUI [11,50]. In anthropogenic climate change and global warming, appropriate management practices and understanding the dynamics of the LUC are critical.
The study also suggests that UHI is related to other phenomena, such as climate change and patterns of energy movement. These include the macro/anthropogenic climate, the meso- and oscillatory climate, and the land use landscape [17,21,23,25,26,31]. This analysis shows the pattern of LUC change from 2005 to 2020. This abrupt change in LUC could be because of rapid urbanization during the study period. Intensive deforestation and destruction of cropland for various development projects (mainly for housing and industrial development) could be associated with the concomitant decline in total vegetation cover in the study region [1,38,41,50]. This decrease in vegetation cover (VC) has many consequences, including a reduction in the natural cooling effect because of shading and evapotranspiration from plants and shrubs [14,15,27,50]. To further explain this, a research study indicates a negative relationship between NDVI, LST, and VC because of their influence on UHI. This could lead to a decrease in the transpiration and evaporation of plants [2,5,6,14]. Previous research has demonstrated that grassland and ornamental plants have a lower effect on reducing LST (land surface temperature) when compared to other types of vegetation, such as forests, urban tree stands, and gardens [28,29,34]. This suggests that vegetation helps to keep urban temperatures down, as buildings and roads rarely insulate the ground and other parts of the landscape. Built-up areas are essential in generating heat fluxes in urban regions [1,13,19,20]. This indicates that green spaces assist in moderating the temperature in cities. Because buildings and roadways rarely insulate, as well as the ground and other components, the results show a positive linear relationship between LST and the built-up area, consistent with earlier research [18,22,28,31]. Natural evaporation from water surfaces contributes to the cooling of the surrounding air, thus lowering the overall air temperature in the region. Previous research has also found that the influence of water bodies in suburban areas plays a vital role in controlling LST [11,38,51].
The study shows that LST increases significantly in built-up areas of Beijing but not in green areas. This could be because of the expansion of buildings and green spaces, which help reduce vegetation’s impact on LST. The areas with the densest vegetation and forest cover were found to have the lowest temperatures. In contrast, the highest land surface temperature (LST) values were observed in undeveloped areas, consistent with two previous studies on land use cover in Chaoyang District, Beijing [3,21]. Therefore, the current research results are consistent with previous findings showing that built-up areas of Beijing have a strong linear relationship with LST. A likely explanation is increased time spent on hard, dark surfaces such as stone and asphalt [33,48]. Due to the low reflection and high absorption of solar radiation and heat emissions during the day and at dusk, this building material LST has increased. This study has shown that UHI is negatively associated with NDVI [18,37,45,50]. In addition to Beijing’s urban expansion, significant changes have been made in the city center. The government or private companies have reclaimed significant land in these areas to construct new residential, commercial, and industrial buildings. As a result, traditional wooden houses (with rice hatch and tile roofs) have been demolished and replaced by skyscrapers and high-rise buildings made of non-evaporating, non-transpiring, impermeable materials such as steel, glass, and solid aluminum frames [5]. These materials have a direct impact on heat fluxes in urban airspaces. It has been found that the growth in LST is highly related to the development of building materials and green spaces, as LST is lower in rural than urban China. Forests and farmland have also been converted to urban areas, increasing LST [5,32,44,49].
In the outskirts of the cities, the government located several factories and industries to make them more competitive. Some of the new industries were on well-maintained agricultural or forest land along with associated infrastructure, reducing the amount of agricultural and forest land while increasing LSTs in these specific regions. Historically, vegetation or forest was considered a demarcation between urban and rural areas. They were supposed to absorb the excess heat generated by cars and factories [8,9,19,35].
The study found that urban sprawl significantly contributes to LST, resulting in uneven heat fluxes in metropolitan areas. This radiative/heat exchange is a critical factor for urban climate change and essential to the UHI. Therefore, LUC may have a strong influence on surface radiative temperature. This also suggests that human-induced modification of the LUC is the main factor for the increase of LST in the urban micro atmosphere [5,16,24,37,44]. The spatiotemporal changes of LST are critical climate variables used by remote sensing data to assess the urban thermal environment through UTVFI.
Urbanization has affected the central regions of Beijing. Due to urbanization, the 2020 heat island phenomenon was more pronounced in these areas. In 2020, only a few areas in the city had an ecological index of 0 to 0.010, indicating that the situation had reached its worst point. Using the information collected by UTFVI, environmental engineers and officials can now make informed decisions regarding the city’s ecological environment. It is essential that they put in place policies and procedures to protect urban areas from the harmful effects of heat islands. The data collected by the platform showed that the thermal conditions in the city could have been better due to the decreasing vegetation cover. The environmental condition of Beijing city was assessed using the UTFVI. It was found that over the years, the urban areas had performed the worst in terms of ecological assessment. Although remote sensing data such as Landsat thermal imagery can help assess UHI, selecting images that show the same conditions on the ground and in the atmosphere can be challenging. One of the main limitations of the data is its resolution. In addition, the data collected by these remote sensing platforms are only sometimes accurate. Therefore, they must have the necessary ground data to perform micro-level analysis. The results of this study can help decision-makers, and environmental planners make informed decisions.
Many people know that the primary reason for changes in the temperature of cities is the growing number of people living in urban areas, as well as alterations to the climate caused by urbanization and the decline in vegetation cover [5,42,43]. Rapid urbanization and the increasing number of city buildings are the main factors contributing to the environmental degradation caused by land use changes. According to studies, the rise in urban temperatures is linked to developing new urban areas and using various structures in the city [2,14,21,43]. Another critical component of UHI is the conversion of natural open spaces into semi-artificial and artificial concrete surfaces because of anthropogenic activities. Urban planning not only forms the basis for the development of cities but also plays a crucial role in the management and construction of urban facilities. Any planning strategy can have a significant impact on the environment and climate. Therefore, science must have the necessary tools and resources to predict the impact of a planning concept on different aspects of the urban environment. Reducing urban heat pollution is one of the most critical factors that can be considered to improve living conditions in Beijing. Future research programs on urban pollution and anthropogenic heat load will focus on analyzing these conditions’ spatial and temporal changes. Urban planners and meteorologists can benefit from the knowledge gained from collaborating with different scientific disciplines. In addition, policymakers and urban planners in China’s rapidly growing cities should benefit from the knowledge gained from this project. Sharing this knowledge will be crucial for sustainable urban development.

5. Conclusions

The increase of LST in urban areas is a primary concern for environmental scientists and urban planners and can cause serious health problems in urban environments. It is scientifically proven that the earth’s average surface temperature is increasing because of rapid growth. In this study, the issues of UHI and LUCC in Beijing, China, were investigated. To analyze the heat patterns of the region, we utilized the UTFVI index and the web-based remote sensing tool GEE. We utilized Landsat time series data to estimate the spatial distribution of LST. From this data, we could calculate the spatial distribution of LST. Our findings indicate that urbanization had a significant impact on the spatial distribution of LST between the years 2005 and 2020. In particular, the temperature increased dramatically in the central part of Beijing. Relatively low temperatures were observed in the surrounding areas far from the densely built-up regions. The decreasing trend of NDVI is reflected in the changes in vegetation cover between 2005 and 2020, reflecting the city’s ecological changes. It was discovered that Beijing experiences the most significant urban heat island effect and has the poorest ecological conditions. As a result, there is an urgent need for more rational urban design and improved urban planning policies. The city’s ecological condition was evaluated by measuring the Urban Thermal Field Variation Index (UTFVI). The worst EEI was found in dense urban areas, contributing to the ecological and thermal environment deterioration over the years. Remote sensing techniques are suitable for assessing UHI and non-UHI areas, but selecting images with the same atmospheric and surface conditions is difficult. If we want to study these ecological and environmental changes at the micro-scale, the spatial resolution of the data is one of their significant drawbacks. High-resolution imagery data with ground realities are needed for a more detailed study. Another limitation of this work is the limited data distribution from ground-based monitoring stations. Additional biophysical parameters can be used for the ecological assessment of UHI zones. In the future, this research could help environmental planners and decision-makers develop a better sustainable city strategy.

Author Contributions

Conceptualization, methodology, formal analysis, M.A.S.; software, M.A.S.; data curation, M.A.S.; writing—original draft preparation, M.A.S. and F.B.; writing—review and editing, M.A.S. and L.D.; visualization, M.A.S., F.B. and L.D.; supervision and funding, L.D. All authors have read and agreed to the published version of the manuscript.

Funding

This research received no external funding.

Institutional Review Board Statement

Not applicable.

Informed Consent Statement

Not applicable.

Data Availability Statement

The authors will provide the data of this research upon request.

Acknowledgments

The author would like to express his respect and gratitude to Bébio Amaro and the anonymous reviewers and editors for their valuable comments and suggestions to improve the quality of the paper.

Conflicts of Interest

The authors declare no conflict of interest.

Abbreviations

AbbreviationExplanation
LUCLand Use Cover
RFRandom Forest
LSTLand Surface Temperature
RTERadiative Transfer Equation
DEMDigital Elevation Model
NDVNormalize Difference of Vegetable Index
BUIBuilt-up Index
TMThematic Mapper
EEIEcological Evaluation Index
UTFVIUrban Thermal Field Variance Index
GWRGeographically Weighted Regression
UHIUrban Heat Island
UHSUrban Hotspot
SRTMShuttle Radar Topography Mission
GEEGoogle Earth Engine

References

  1. Khan, T.U.; Mannan, A.; Hacker, C.E.; Ahmad, S.; Amir Siddique, M.; Khan, B.U.; Din, E.U.; Chen, M.; Zhang, C.; Nizami, M. Use of GIS and Remote Sensing Data to Understand the Impacts of Land Use/Land Cover Changes (LULCC) on Snow Leopard (Panthera uncia) Habitat in Pakistan. Sustainability 2021, 13, 3590. [Google Scholar] [CrossRef]
  2. Li, J.; Zhang, C.; Zheng, X.; Chen, Y. Temporal-Spatial Analysis of the Warming Effect of Different Cultivated Land Urbanization of Metropolitan Area in China. Sci. Rep. 2020, 10, 2760. [Google Scholar] [CrossRef] [Green Version]
  3. Amir Siddique, M.; Dongyun, L.; Li, P.; Rasool, U.; Khan, T.U.; Javaid Aini Farooqi, T.; Wang, L.; Fan, B.; Rasool, M.A. Assessment and simulation of land use and land cover change impacts on the land surface temperature of Chaoyang District in Beijing, China. PeerJ 2020, 8, e9115. [Google Scholar] [CrossRef]
  4. Ullah, N.; Siddique, M.A.; Ding, M.; Grigoryan, S.; Zhang, T.; Hu, Y. Spatiotemporal Impact of Urbanization on Urban Heat Island and Urban Thermal Field Variance Index of Tianjin City, China. Buildings 2022, 12, 399. [Google Scholar] [CrossRef]
  5. Huang, Y.; Qiu, Q.; Sheng, Y.; Min, X.; Cao, Y. Exploring the Relationship between Urbanization and the Eco-Environment: A Case Study of Beijing. Sustainability 2019, 11, 6298. [Google Scholar] [CrossRef] [Green Version]
  6. Chapa, F.; Hariharan, S.; Hack, J. A New Approach to High-Resolution Urban Land Use Classification Using Open Access Software and True Color Satellite Images. Sustainability 2019, 11, 5266. [Google Scholar] [CrossRef] [Green Version]
  7. Chen, X.; Zhang, Y. Impacts of urban surface characteristics on spatiotemporal pattern of land surface temperature in Kunming of China. Sustain. Cities Soc. 2017, 32, 87–99. [Google Scholar] [CrossRef] [Green Version]
  8. Li Pengli, M.A.S.; Fan, B.; Huang, H.; Liu, D. Effects of land surface type changes on urban heat island: A case study of Chaoyang District, Beijing. J. Beijing For. Univ. 2020, 2020, 42. [Google Scholar] [CrossRef]
  9. Wang, R.; Hou, H.; Murayama, Y.; Derdouri, A. Spatiotemporal Analysis of Land Use/Cover Patterns and Their Relationship with Land Surface Temperature in Nanjing, China. Remote Sens. 2020, 12, 440. [Google Scholar] [CrossRef] [Green Version]
  10. Zullo, F.; Fazio, G.; Romano, B.; Marucci, A.; Fiorini, L. Effects of urban growth spatial pattern (UGSP) on the land surface temperature (LST): A study in the Po Valley (Italy). Sci. Total Environ. 2019, 650, 1740–1751. [Google Scholar] [CrossRef]
  11. Park, J.; Kim, J.-H.; Lee, D.K.; Park, C.Y.; Jeong, S.G. The influence of small green space type and structure at the street level on urban heat island mitigation. Urban For. Urban Green. 2017, 21, 203–212. [Google Scholar] [CrossRef]
  12. Guo, L.; Liu, R.; Men, C.; Wang, Q.; Miao, Y.; Zhang, Y. Quantifying and simulating landscape composition and pattern impacts on land surface temperature: A decadal study of the rapidly urbanizing city of Beijing, China. Sci. Total Env. 2019, 654, 430–440. [Google Scholar] [CrossRef]
  13. Yu, Z.; Xu, S.; Zhang, Y.; Jorgensen, G.; Vejre, H. Strong contributions of local background climate to the cooling effect of urban green vegetation. Sci. Rep. 2018, 8, 6798. [Google Scholar] [CrossRef] [Green Version]
  14. Zhang, X.; Wang, D.; Hao, H.; Zhang, F.; Hu, Y. Effects of Land Use/Cover Changes and Urban Forest Configuration on Urban Heat Islands in a Loess Hilly Region: Case Study Based on Yan'an City, China. Int. J. Env. Res. Public Health 2017, 14, 840. [Google Scholar] [CrossRef] [Green Version]
  15. Debbage, N.; Shepherd, J.M. The urban heat island effect and city contiguity. Comput. Environ. Urban Syst. 2015, 54, 181–194. [Google Scholar] [CrossRef]
  16. Zhou, W.; Huang, G.; Cadenasso, M.L. Does spatial configuration matter? Understanding the effects of land cover pattern on land surface temperature in urban landscapes. Landsc. Urban Plan. 2011, 102, 54–63. [Google Scholar] [CrossRef]
  17. Sannigrahi, S.; Rahmat, S.; Bhatt, S. Urban biophysical composition and its impact on thermal changes and ecosystem production. In Proceedings of the EGU General Assembly Conference Abstracts, Vienna, Austria, 23–28 April 2017; p. 7641. [Google Scholar]
  18. Chen, W.; Zhang, Y.; Pengwang, C.; Gao, W. Evaluation of urbanization dynamics and its impacts on surface heat islands: A case study of Beijing, China. Remote Sens. 2017, 9, 453. [Google Scholar] [CrossRef] [Green Version]
  19. Beckline, M.; Yujun, S.; Yvette, B.; John, A.B.; Mor-Achankap, B.; Saeed, S.; Richard, T.; Wose, J.; Paul, C. Perspectives of remote sensing and GIS applications in tropical forest management. Am. J. Agric. For. 2017, 5, 33–39. [Google Scholar] [CrossRef] [Green Version]
  20. Xu, J.; Zhao, Y.; Sun, C.; Liang, H.; Yang, J.; Zhong, K.; Li, Y.; Liu, X. Exploring the Variation Trend of Urban Expansion, Land Surface Temperature, and Ecological Quality and Their Interrelationships in Guangzhou, China, from 1987 to 2019. Remote Sens. 2021, 13, 1019. [Google Scholar] [CrossRef]
  21. Amir Siddique, M.; Wang, Y.; Xu, N.; Ullah, N.; Zeng, P. The Spatiotemporal Implications of Urbanization for Urban Heat Islands in Beijing: A Predictive Approach Based on CA–Markov Modeling (2004–2050). Remote Sens. 2021, 13, 4697. [Google Scholar] [CrossRef]
  22. Ullah, S.; Tahir, A.A.; Akbar, T.A.; Hassan, Q.K.; Dewan, A.; Khan, A.J.; Khan, M. Remote Sensing-Based Quantification of the Relationships between Land Use Land Cover Changes and Surface Temperature over the Lower Himalayan Region. Sustainability 2019, 11, 5492. [Google Scholar] [CrossRef] [Green Version]
  23. Athukorala, D.; Murayama, Y. Urban heat island formation in Greater Cairo: Spatio-temporal analysis of daytime and nighttime land surface temperatures along the urban–rural gradient. Remote Sens. 2021, 13, 1396. [Google Scholar] [CrossRef]
  24. Almazroui, M.; Islam, M.N.; Jones, P. Urbanization effects on the air temperature rise in Saudi Arabia. Clim. Chang. 2013, 120, 109–122. [Google Scholar] [CrossRef]
  25. Tariq, A.; Shu, H.; Gagnon, A.S.; Li, Q.; Mumtaz, F.; Hysa, A.; Siddique, M.A.; Munir, I. Assessing burned areas in wildfires and prescribed fires with spectral indices and SAR images in the Margalla Hills of Pakistan. Forests 2021, 12, 1371. [Google Scholar] [CrossRef]
  26. Mumtaz, F.; Arshad, A.; Mirchi, A.; Tariq, A.; Dilawar, A.; Hussain, S.; Shi, S.; Noor, R.; Noor, R.; Daccache, A. Impacts of reduced deposition of atmospheric nitrogen on coastal marine eco-system during substantial shift in human activities in the twenty-first century. Geomat. Nat. Hazards Risk 2021, 12, 2023–2047. [Google Scholar] [CrossRef]
  27. Tariq, A.; Riaz, I.; Ahmad, Z.; Yang, B.; Amin, M.; Kausar, R.; Andleeb, S.; Farooqi, M.A.; Rafiq, M. Land surface temperature relation with normalized satellite indices for the estimation of spatio-temporal trends in temperature among various land use land cover classes of an arid Potohar region using Landsat data. Environ. Earth Sci. 2019, 79, 40. [Google Scholar] [CrossRef]
  28. Jain, S.; Sannigrahi, S.; Sen, S.; Bhatt, S.; Chakraborti, S.; Rahmat, S. Urban heat island intensity and its mitigation strategies in the fast-growing urban area. J. Urban Manag. 2019, 9, 54–66. [Google Scholar] [CrossRef]
  29. Wu, Q.; Tan, J.; Guo, F.; Li, H.; Chen, S. Multi-Scale Relationship between Land Surface Temperature and Landscape Pattern Based on Wavelet Coherence: The Case of Metropolitan Beijing, China. Remote Sens. 2019, 11, 3021. [Google Scholar] [CrossRef] [Green Version]
  30. Tian, G.; Wu, J.; Yang, Z. Spatial pattern of urban functions in the Beijing metropolitan region. Habitat Int. 2010, 34, 249–255. [Google Scholar] [CrossRef]
  31. Qiao, Z.; Tian, G.; Xiao, L. Diurnal and seasonal impacts of urbanization on the urban thermal environment: A case study of Beijing using MODIS data. ISPRS J. Photogramm. Remote Sens. 2013, 85, 93–101. [Google Scholar] [CrossRef]
  32. Ullah, N.; Siddique, M.A.; Ding, M.; Grigoryan, S.; Khan, I.A.; Kang, Z.; Tsou, S.; Zhang, T.; Hu, Y.; Zhang, Y. The Impact of Urbanization on Urban Heat Island: Predictive Approach Using Google Earth Engine and CA-Markov Modelling (2005–2050) of Tianjin City, China. Int. J. Environ. Res. Public Health 2023, 20, 2642. [Google Scholar] [CrossRef] [PubMed]
  33. Farr, T.G.; Rosen, P.A.; Caro, E.; Crippen, R.; Duren, R.; Hensley, S.; Kobrick, M.; Paller, M.; Rodriguez, E.; Roth, L. The shuttle radar topography mission. Rev. Geophys. 2007, 45, 25–36. [Google Scholar] [CrossRef] [Green Version]
  34. Chen, B.; Zhang, X.; Tao, J.; Wu, J.; Wang, J.; Shi, P.; Zhang, Y.; Yu, C. The impact of climate change and anthropogenic activities on alpine grassland over the Qinghai-Tibet Plateau. Agric. For. Meteorol. 2014, 189, 11–18. [Google Scholar] [CrossRef]
  35. Ding, H.; Shi, W. Land-use/land-cover change and its influence on surface temperature: A case study in Beijing City. Int. J. Remote Sens. 2013, 34, 5503–5517. [Google Scholar] [CrossRef]
  36. Xiao, R.-b.; Ouyang, Z.-Y.; Zheng, H.; Li, W.-F.; Schienke, E.W.; Wang, X.-K. Spatial pattern of impervious surfaces and their impacts on land surface temperature in Beijing, China. J. Environ. Sci. 2007, 19, 250–256. [Google Scholar] [CrossRef]
  37. Carlson, T.N.; Arthur, S.T. The impact of land use—Land cover changes due to urbanization on surface microclimate and hydrology: A satellite perspective. Glob. Planet. Chang. 2000, 25, 49–65. [Google Scholar] [CrossRef]
  38. Tariq, A.; Mumtaz, F. Modeling spatio-temporal assessment of land use land cover of Lahore and its impact on land surface temperature using multi-spectral remote sensing data. Environ. Sci. Pollut. Res. 2022, 30, 23908–23924. [Google Scholar] [CrossRef]
  39. Xiong, Y.; Huang, S.; Chen, F.; Ye, H.; Wang, C.; Zhu, C. The Impacts of Rapid Urbanization on the Thermal Environment: A Remote Sensing Study of Guangzhou, South China. Remote Sens. 2012, 4, 2033–2056. [Google Scholar] [CrossRef] [Green Version]
  40. Afify, H.A. Evaluation of change detection techniques for monitoring land-cover changes: A case study in new Burg El-Arab area. Alex. Eng. J. 2011, 50, 187–195. [Google Scholar] [CrossRef] [Green Version]
  41. Tariq, A.; Mumtaz, F.; Majeed, M.; Zeng, X. Spatio-temporal assessment of land use land cover based on trajectories and cellular automata Markov modelling and its impact on land surface temperature of Lahore district Pakistan. Environ. Monit. Assess. 2023, 195, 114. [Google Scholar] [CrossRef] [PubMed]
  42. Elvidge, C.D.; Chen, Z. Comparison of broad-band and narrow-band red and near-infrared vegetation indices. Remote Sens. Environ. 1995, 54, 38–48. [Google Scholar] [CrossRef]
  43. Guha, S.; Govil, H.; Dey, A.; Gill, N. Analytical study of land surface temperature with NDVI and NDBI using Landsat 8 OLI and TIRS data in Florence and Naples city, Italy. Eur. J. Remote Sens. 2018, 51, 667–678. [Google Scholar] [CrossRef] [Green Version]
  44. Firozjaei, M.K.; Sedighi, A.; Kiavarz, M.; Qureshi, S.; Haase, D.; Alavipanah, S.K. Automated Built-Up Extraction Index: A New Technique for Mapping Surface Built-Up Areas Using LANDSAT 8 OLI Imagery. Remote Sens. 2019, 11, 1966. [Google Scholar] [CrossRef] [Green Version]
  45. Singh, P.; Kikon, N.; Verma, P. Impact of land use change and urbanization on urban heat island in Lucknow city, Central India. A remote sensing based estimate. Sustain. Cities Soc. 2017, 32, 100–114. [Google Scholar] [CrossRef]
  46. Guha, S.; Govil, H.; Mukherjee, S. Dynamic analysis and ecological evaluation of urban heat islands in Raipur city, India. J. Appl. Remote Sens. 2017, 11, 036020. [Google Scholar] [CrossRef]
  47. Liu, F.; Zhang, X.; Murayama, Y.; Morimoto, T. Impacts of land cover/use on the urban thermal environment: A comparative study of 10 megacities in China. Remote Sens. 2020, 12, 307. [Google Scholar] [CrossRef] [Green Version]
  48. Portela, C.I.; Massi, K.G.; Rodrigues, T.; Alcântara, E. Impact of urban and industrial features on land surface temperature: Evidences from satellite thermal indices. Sustain. Cities Soc. 2020, 56, 102100. [Google Scholar] [CrossRef]
  49. Mohammad, P.; Goswami, A. Predicting the impacts of urban development on seasonal urban thermal environment in Guwahati city, northeast India. Build. Environ. 2022, 226, 109724. [Google Scholar] [CrossRef]
  50. Macarof, P.; Statescu, F. Comparasion of NDBI and NDVI as Indicators of Surface Urban Heat Island Effect in Landsat 8 Imagery: A Case Study of Iasi. Present Environ. Sustain. Dev. 2017, 11, 141. [Google Scholar] [CrossRef] [Green Version]
  51. Tariq, A.; Shu, H. CA-Markov chain analysis of seasonal land surface temperature and land use land cover change using optical multi-temporal satellite data of Faisalabad, Pakistan. Remote Sens. 2020, 12, 3402. [Google Scholar] [CrossRef]
Figure 1. The geographic location of the study area shows elevation (DEM) classes.
Sustainability 15 06043 g001
Figure 2. Methodology flow chart for the present study.
Sustainability 15 06043 g002
Figure 3. (A) Maps of Beijing representing the RF classification for all land use cover (LUC) classes; (B) Normalized difference vegetation index (NDVI), (C) Built-up Index (BUI), (D) Land surface temperature (LST) of Beijing between the study period of 2005 and 2020, at 5-year intervals.
Sustainability 15 06043 g003
Figure 4. (A) Shows the land use cover area, and (B) proportional changes of LUC during 2005–2020.
Sustainability 15 06043 g004
Figure 5. (A) Distribution of Land surface temperature, and (B) proportional changes of LST during 2005–2020.
Sustainability 15 06043 g005
Figure 6. Spatial extents of urban thermal field index (UTFVI) and ecological evaluation of Beijing based on UTFVI, during 2005–2020.
Sustainability 15 06043 g006
Figure 7. Pearson’s rank correlation matrix between BUI, NDVI, NDBI, and LST of (A) 2005, (B) 2010, (C) 2015 and (D) 2020.
Sustainability 15 06043 g007
Figure 8. A spatiotemporal variance of global parameters derived from (A) GWR models: Local R2, (B) observed and predicted UHI intensity with all land use indices from 2005 to 2020.
Sustainability 15 06043 g008
Table 1. Acquisition date and source of temporal images.
Acquisition Date and TimeSatellite Sensor IDSpatial Resolution
30 July 2005 03:49Landsat-5 TM30 m|100 m
15 September 2010 01:45Landsat-5 TM30 m|100 m
31 July 2015 02:30Landsat-8 OLI/TIRS30 m|100 m
25 August 2020 03:15Landsat-8 OLI/TIRS30 m|100 m
Table 2. Descriptive statistics of LST’s ranges during the study period for Beijing.
YearNon-UHIUHI
Min.Max.MeanSTDMin.Max.MeanSTD
200512.3125.8919.1009.6025.944.2535.07512.97
201011.1526.7518.9511.0326.7645.7436.2513.42
201511.2527.9519.6011.8027.9641.5834.7709.63
202015.4229.5222.479.9729.5344.1936.8610.36
Min: Minimum, Max: Maximum, STD: Standard Deviation, UHI: Urban Heat Island.
Table 3. The threshold value of ecological evaluation index and proportional changes for 2005–2020.
Thermal Comfort Levels2005–20102010–20152015–2020
UTFVIUHIEEIArea (km2)%AgeArea (km2)%AgeArea (km2)%Age
<0.00NoneExcellent−810.99−5%181.941%1015.166%
0.000–0.005WeakGood613.464%1873.4011%−2207.23−13%
0.005–0.010MiddleNormal−541.82−3%415.412%−868.31−5%
0.010–0.015StrongBad653.464%−771.93−4%283.252%
0.015–0.020StrongerWorse424.992%−853.73−5%757.424%
>0.020StrongestWorst−338.74−2%−844.87−5%1019.196%
UHI: Urban Heat Intensity, EEI: Ecological Evaluation Index.
Disclaimer/Publisher’s Note: The statements, opinions and data contained in all publications are solely those of the individual author(s) and contributor(s) and not of MDPI and/or the editor(s). MDPI and/or the editor(s) disclaim responsibility for any injury to people or property resulting from any ideas, methods, instructions or products referred to in the content.

