1. Introduction
The financial system has become a complex and interwoven network nowadays. These interconnections can manifest themselves through both direct avenues, such as interbank debt relationships, and indirect paths—for instance, through the occurrence of common investment holdings in portfolios [
1]. The presence of these shared linkages creates opportunities for the growth and success of the financial sectors [
2,
3]. However, they simultaneously represent potential vectors of transmission during periods of instability. These channels of transmission become particularly relevant when initial losses incurred by a single bank or within a specific asset category spread through these interconnections and impact other entities, investments, economic domains, and nations, thus leading to financial crises such as the 2008 financial crisis and the widespread market collapse during the COVID-19 pandemic in 2020 [
4,
5,
6].
The assessment of systemic risk encompasses the nuanced evaluation of the ramifications that may arise from the occurrence of a catastrophic failure or significant adverse event within the financial system [
7]. With a view to identify sources of risk that hold the potential to substantially undermine the stability and efficacy of financial markets and institutions, systemic risk assessment aims to provide a comprehensive assessment of the extent and nature of risk exposure [
8]. The financial crisis of 2008 galvanized the necessity for comprehending the mechanisms and channels through which financial contagion is transmitted and the construction of indices capable of pre-identifying such contagion [
9,
10]. This has necessitated the formulation of effective measures for preventing and mitigating financial contagion.
The aftermath of numerous financial crises has led to a significant rise in attention towards systemic risk from policy makers, regulators, and scholars alike. This has sparked the growth of various advanced techniques and approaches for assessing systemic risk and its impact on financial stability [
7,
11]. The study of systemic risk and its potential impact on financial stability has gained paramount significance in recent years, given the interconnected nature of financial institutions, markets, and systems. The failure or adverse event of a single entity in such a complex and interconnected financial system can lead to widespread consequences. In light of the growing intricacy of modern financial systems, it is essential to have a comprehensive and sophisticated comprehension of systemic risk and its possible effects. The research of systemic risk networks constitutes a vital component of financial stability and risk management research. It endeavors to comprehend the complex relationships and interdependencies between financial institutions and markets and the impact of these connections on the stability of the financial system as a whole [
12]. The growing intricacy and interconnections within contemporary financial systems highlights the need for thorough and reliable systemic risk network analysis, with the purpose of identifying and addressing sources of risk that may pose significant threats to financial stability and sustainable investing. Therefore, here we would like to focus on the risk spillover effects of risk contagion in financial networks on ESG investments in the market.
The growing popularity of environmental, social, and governance (ESG) investing has led to increased scrutiny of the potential risks associated with these investing strategies [
13,
14]. One area of concern is the risk of spillover effects, where risks from non-ESG investments may spill over to ESG portfolios, affecting their performance and potentially undermining their objectives [
15]. Risk spillover can occur in a number of ways. For example, ESG portfolios may be exposed to risks from non-ESG investments through shared economic, political, or regulatory factors. Economic downturns, for example, may impact both ESG and non-ESG investments, leading to a decrease in the value of both [
16]. Similarly, changes in government policy or regulations may affect all companies in a given sector, regardless of their ESG performance. In addition, risk spillover can occur through interconnectedness between companies. Even if an ESG portfolio excludes certain companies based on their ESG performance, those companies may still have relationships with other companies in the portfolio [
17,
18]. For example, a company that is excluded due to poor environmental practices may still supply goods or services to companies that are included in the portfolio. Overall, the risk of spillover effects is an important consideration for ESG investors and policymakers. While the specific risks and their potential impacts may be difficult to quantify, it is clear that the interconnectedness of companies and the potential for shared risks make it important to consider the potential for spillover effects when investing in ESG portfolios. By doing so, investors and policymakers can help ensure that ESG investing continues to deliver on its objectives and benefits both investors and society as a whole.
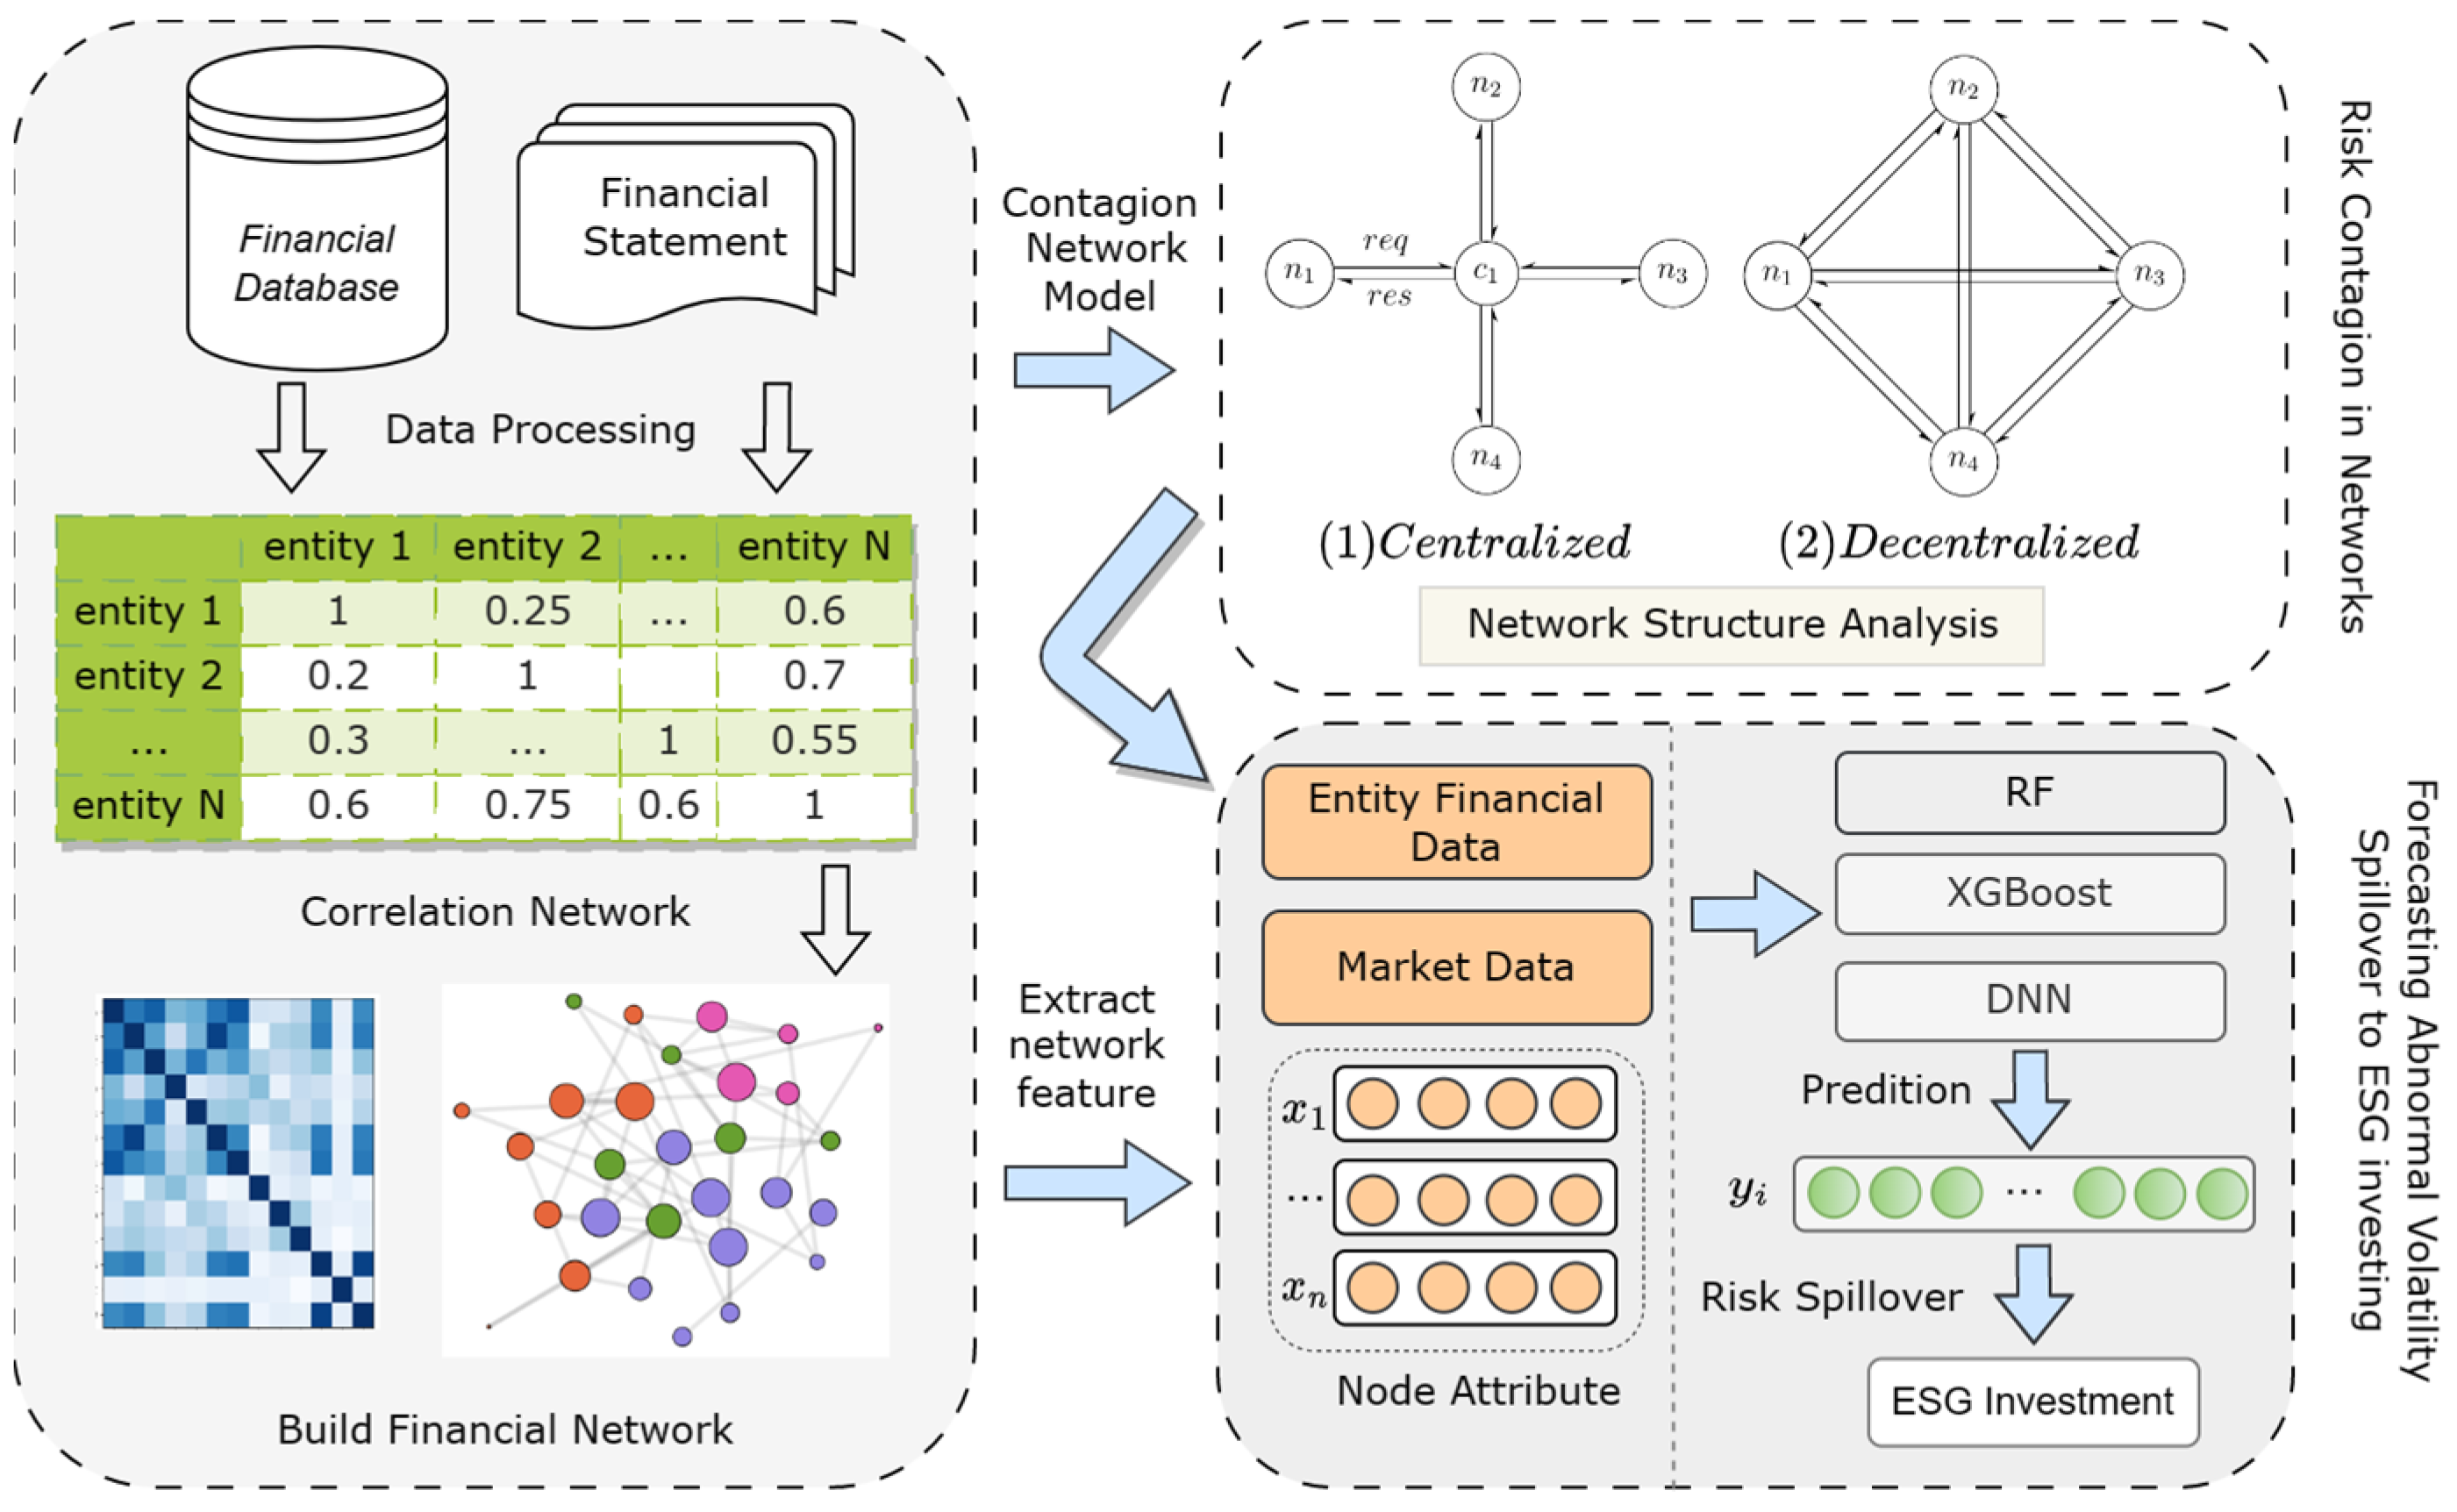
In this paper, we proposed a network-based approach to analyze risk contagion in the financial sector, abnormal volatility, and their risk spillover effects on ESG investments. First, the approach constructs a financial network based on a correlation network among financial institutions and examines the network structure. We then analyze the changes in the overall network value as asset liquidation shocks persist and the evolution of the network over time. We also use three machine learning techniques, including Random Forest (RF), Extreme Gradient Boosting (XGBoost), and Deep Neural Network (DNN), to assess the abnormal volatility of important financial institutions in the financial network. Finally, we evaluate the spillover effects of risk volatility in financial networks on ESG investments. This approach we propose provides a novel and useful tool for risk analysis and assessment in financial networks, as well as for the assessment of its spillover effects on ESG investment risk. Our study can enrich the relevant literature on risk assessment as well as sustainable investment.
Our findings also reveal that the Deep Neural Network (DNN) exhibits slightly inferior performance compared to the XGBoost model in the test sample and indicate that the Random Forest (RF) model performs less effectively compared to the XGBoost model. This could be due to the increased parameterization flexibility of XGBoost, which enables it to better capture nonlinear patterns in the dataset. Furthermore, we utilized the models for the prediction of unusual price fluctuations for critical nodes in the financial network—specifically, the significant financial institutions included in the dataset, which illustrate the viability of incorporating machine learning models with the structural features of financial networks for the analysis and assessment of the risk posed by abnormal nodes in financial networks. We also analyze the impact of risk spillovers in financial networks on ESG investments. Our results show that risk spillovers in financial networks have a significant negative impact on ESG investments. The average performance of the high portfolio ESG is 5.9% higher than the average performance of the low portfolio. The high portfolio performance of SFI is more volatile, and the average performance of the high portfolio is 11.6% higher than the low portfolio.
The rest of the paper is organized as follows.
Section 2 presents a review of prior research on the topic of systemic risk and financial networks. The methodology of the study and dataset are thoroughly described in
Section 3.
Section 4 presents the findings of the study. Finally, the conclusion of the paper is outlined in
Section 5.
2. Literature Reviews
We have surveyed the related work on risk contagion in financial networks, focusing on spillover to ESG investment and recent advancements in machine learning models for financial risk analysis and assessment. While some studies have found evidence of risk spillover from non-ESG investments to ESG investments, the results are not consistent across all markets and time periods [
19,
20,
21]. For example, a study of the S&P 500 index found that companies with higher ESG scores tended to outperform their peers during the COVID-19 pandemic, suggesting that ESG investments may be more resilient during times of crisis [
22,
23]. Khalfaoui [
24] shed light on the climate risk and clean energy spillovers and the impact of uncertainty in US stock markets. Zhang [
25] employed extreme quantile spillovers to understand drivers among clean energy, electricity, and energy metals markets. We will first introduce the related work on financial network following our framework.
There has been a surge in research in this area after the 2008 financial crisis, leading to the proposal of numerous modeling frameworks and interdisciplinary approaches. Research on systemic risk encompasses a range of models, including network valuation models, dynamic contagion models, contingent payment models, cross-holding models, and dumping models, among others. Eisenberg and Noe [
26] pioneered the examination of interbank networks in the context of modeling the propagation of defaults risk in the financial network system. Their work analyzed the linkages of the debt between various banks, utilizing bidirectional graphs to represent these connections. In the event of a bank failure, losses would be incurred by its counterparties and the initial shock could spread through these debt linkages, potentially leading to cascading failures throughout the network. Eisenberg and Noe [
26] laid the foundation for the systemic risk literature and serves as a simple yet effective baseline model. Since its introduction, the model has been expanded in multiple ways to account for the complexities present in the financial system.
The valuation of corporate debt and its market value determination is a significant challenge in financial mathematics. Traditional structural models for debt valuation typically focus on individual banks, but this approach overlooks the many interconnections within the financial system, potentially leading to significant mis-assessment of a firm’s financial health. The Eisenberg–Noe framework presents a sophisticated method for incorporating these interconnections and has been adopted in numerous studies. The problem was considered within the context of cross-holdings [
27], and Fischer [
28] further generalized the setting to encompass multiple seniority levels and the incorporation of derivatives. The computations in these works are exclusively performed through Monte Carlo simulations. Gourieroux et al. [
29] and Barucca et al. [
30] considered a model that includes stochastic exogenous shocks to the assets of each bank and examines the network valuation problem and the impact of such shocks on external assets.
The study of systemic risk has also seen significant progress in the direction of dynamic contagion models. Some studies have explored the expansion of this framework to incorporate multiple liquidation. Feinstein [
31] proposed another methodology for analyzing financial networks involving various maturities by regarding each liquidation date as a distinct asset. However, it is noteworthy that all these studies examine liquidation only at discrete instances. In their study, [
27] also put forth a novel approach for modeling financial networks by introducing a continuous-time liquidation model, which precisely captures the characteristics of the established Eisenberg–Noe framework.
Contingent payment models have also been widely studied. Eisenberg and Noe [
26] studied the impact of linkages between banks and insurance firms on systemic risk, as these connections differ from typical bank loans, such as credit default swaps. Schuldenzucker et al. [
32,
33] demonstrated that, in the presence of generalized CDS contracts, the definition of the clearing vector is not explicit and its existence may not be necessary. They then put forward a framework to model the payments of CDS for the possibility of a clearing solution within the network topology. Leduc et al. [
34] proposed a method to study network topologies in Eisenberg–Noe systems in a static framework. Klages-Mundt and Minca [
12] investigated reinsurance networks and analyzed the impact of network structure on the presence and singularity of obligations and liquidation payments.
The interconnections through equity claims between banks are also studied in the financial system. Elliott et al. [
35] explored the effect of cross-shareholdings on the financial network through a model and analyzed how diversification and consolidation can impact liquidation solutions. Weber and Weske [
36] revealed that cross-holdings can stabilize the system, thus preventing the spread of defaults. He also investigated the impact of indirect linkages between organizations and global interactions, such as dumping spillovers, as another important channel of contagion in financial networks. Amini et al. [
37] explored the phenomenon of dumping in a financial system where banks are required to sell assets to fulfill their debt obligations. By analyzing this single-asset setup, Braouezec and Wagalath [
38] investigated the issue of dumping in a scenario where a single-asset bank was mandated to comply with a risk-weighted capital ratio. Cont and Schaanning [
39] proposed a novel method to quantify the impact of deleveraging. Duarte and Eisenbach [
40] analyzed the relationship between systemic risk and vulnerability in the financial system, constructing an aggregate vulnerability index and comparing it with SRISK, a widely cited measure of systemic risk. Greenwood et al. [
41] developed empirical methods to quantify the vulnerability and interconnections of banks and analyzed the impact of various interventions aimed at mitigating the risk of price reductions and sales contagion.
In recent years, many scholars have used machine learning methods to analyze systemic risk. Kou et al. [
42] conducted a survey of existing research and methodologies in the area of financial systemic risk assessment and measurement, including the integration of machine learning technologies. Alexandre et al. [
43] evaluated the impact of financial variables and network topology on systemic risk. Liu and Pun [
44] examined the potential for enhancing systemic risk measures through the integration of machine learning algorithms. It is posited that as artificial intelligence technology advances, it will play a greater role in the field of systemic risk assessment.
Overall, we discuss various modeling frameworks and interdisciplinary approaches used in the field of financial network and systemic risk contagion, including network valuation models, dynamic contagion models, contingent payment models, cross-holding models, and dumping models, among others. We also highlight recent advancements in machine learning methods to analyze systemic risk. These methods may have certain limitations. Based on these insights, this paper proposes an innovative research framework that combines financial network analysis with machine learning methods to evaluate the risk spillover effects and their impact on ESG investments.
4. Results
4.1. Institutions Network Model
Let us build up a small financial network comprising a few institutions, each of which has an additional obligation to a node defined as the external. The time interval under consideration is
, and the overall wealth of network at the beginning can be represented as
, while cash flows are characterized by
. The nominal liabilities matrix
is defined as follows:
The static clearing total wealths at the end, considering the liabilities
and assets
, are approximately calculated as
. Based on these results, it can be deduced that institution 1 is a first-order default, institution 2 is a second-order default, and bank 3 is a third-order default. Two dynamic scenarios are now considered, differentiated only by the selection of the cash flows
:
In our analysis, dynamic settings have a singular instance path for the process. The equity of the society node, which begins with an initial wealth of 0, can be easily shown on the equal figure as the other network nodes. In order to gain a more comprehensive understanding of the changes in real-world indicators, randomized observations were utilized to provide a better illustration. Thus, we compare the value of the financial network over time under two different cash flow assumptions, one with a static cash flow variation and the other incorporating stochastic Brownian motion, as depicted in
Figure 3. It is evident from the results that the effect of liquidation on the value of the nodes in the financial network becomes apparent when the network is subjected to a risk event. As the nodes in the network start to liquidate over time, the overall value of the nodes continues to deviate from the losses incurred. The pace at which the value changes is distinctive for each of the different cash flow scenarios. From the analysis, it is intuitive to conclude that the resilience of a node in the network against risk shocks relies heavily on low debt and high cash flow. In the next step, we will build upon the basic financial network model and create a multi-node financial network model to examine the progression of the financial network over time.
4.2. Network Evolving Process
We will consider the scenario in which the relative liabilities undergo temporal fluctuations. Building upon the basic network scenario outlined previously, we expand our analysis to encompass a multi-node financial network and investigate the temporal evolution of the entire financial system. Utilizing real data from a dataset comprising key financial institutions in the United States, we incorporate relevant parameters into our evolving network and determine the parameters that drive its temporal progression. As shown in
Figure 4, we obtain the evolutionary process of the network at different time points. We can find that the degree of association between the networks keeps getting larger over time, the density of connections keeps getting larger, and the node centrality measures are shown in
Figure 5. Our analysis demonstrates that in the initial stages, the network displays relative sparsity with a low density of connections. At this point, the network exhibits low robustness, characterized by a limited number of critical nodes. As the network progresses and evolves, it becomes increasingly complex and exhibits a higher degree of interconnectivity, reflecting the growing complexity of business relationships and the increasing joint susceptibility to certain factors among financial institutions.
At a later stage, the overall network robustness is enhanced, as demonstrated by the fact that the complex correlations present can offset the impact of node failure. Our measurements reveal that the network robustness at is 81% greater than that at . It should be noted that the intricate relationships within the network also entail potential risks. The failure of a critical node can result in a significant impact due to its strong centrality. Nevertheless, on balance, a more complex financial network is better equipped to resist the effects of systemic risk events. We then employ machine learning techniques to predict systemic risk in financial networks, utilizing the node characteristics of real, evolving networks as well as economic and financial data.
4.3. Predition of Abnormal Volatility in Financial Network
Having constructed and analyzed the risk contagion and network structure evolution in the financial network, we employed three machine learning (ML) approaches—Random Forest (RF), Extreme Gradient Boosting (XGBoost), and Deep Neural Network (DNN)—to assess the abnormal volatility. We used the standard deviation of daily returns over a period of time to calculate volatility and considered volatility that exceeds two standard deviations from the mean as “abnormal volatility.” The evaluation was based on the node characteristics and financial market data present within the network among financial institutions, such as stock price data. According to
Figure 6, our results indicate that the Deep Neural Network (DNN) model exhibits superior performance on the training set when compared to the other candidate models. However, the XGBoost-based classification model proves to be more accurate in terms of evaluation on the test set, highlighting the robustness advantage of the XGBoost model.
Our findings also reveal that the Deep Neural Network (DNN) exhibits slightly inferior performance compared to the XGBoost model in the test sample. This may be attributed to the extensive use of parameters in the DNN’s setup, resulting in overfitting in the training samples. Furthermore, the limited size of the dataset studied so far, owing to the complexity of DNNs, may also have contributed to the comparatively weaker performance of the DNN. Our results indicate that the Random Forest (RF) model performs less effectively compared to the XGBoost model. This could be due to the increased parameterization flexibility of XGBoost, which enables it to better capture nonlinear patterns in the dataset. The AUC and F1-score of the various models are depicted in
Figure 6. Furthermore, we utilized the models for the prediction of unusual price fluctuations for critical nodes in the financial network—specifically, the significant financial institutions included in the dataset. The accuracy results of these predictions are depicted in
Figure 7. The results comprehensively illustrate the viability of incorporating machine learning models with the structural features of financial networks for the analysis and assessment of the risk posed by abnormal nodes in financial networks.
4.4. Assessment of Risk Spillover to ESG Investment
We analyzed the impact of risk spillovers in financial networks on ESG investments. The results, shown in
Figure 8, demonstrate that risk spillovers in financial networks have a significant negative impact on ESG investments. Specifically, we compared ESG investment returns for the top 20% (high ESG ranking), the middle 60%, and the bottom 20% (low ESG ranking). To assess this impact, we compared ESG investment returns for different ESG rankings and found that the top 20% (high ESG ranking) portfolio had an average performance 5.9% higher than the bottom 20% (low ESG ranking) portfolio. Furthermore, the high portfolio performance of SFI (systemically important financial institutions) was found to be more volatile, with an average performance of the high portfolio 11.6% higher than the low portfolio. Additionally, the study highlights the existence of financial risk spillover effects in financial networks, indicating that risks in financial networks can significantly affect the performance of ESG investments. This finding emphasizes the need to consider systemic risk in financial systems when making investment decisions. The study also demonstrates the robustness of ESG portfolios relative to portfolios in financial networks, indicating that ESG investments perform more consistently in the face of financial risk spillovers. This finding highlights the potential for ESG investments to provide a more stable investment option for investors concerned about systemic risk. Overall, the study contributes to our understanding of the relationship between financial networks and ESG investments and underscores the importance of considering systemic risk when making investment decisions.
4.5. Further Discussions
The use of financial networks and machine learning has gained significant attention in the research community in recent years. The combination of these two techniques provides a powerful tool for predicting financial outcomes and understanding the complex relationships between financial entities. One of the most significant limitations of financial network and machine learning research is the quality and availability of data. Financial data are often complex, heterogeneous, and scattered across various sources, making it challenging to collect and analyze. Furthermore, the accuracy and completeness of financial data can be affected by various factors, such as data entry errors, fraudulent activities, and data tampering. Another limitation of financial network and machine learning research is the limited interpretability of the results. Machine learning models can generate accurate predictions, but they may not provide insights into the underlying mechanisms that drive those predictions. As a result, it can be challenging to understand the relationships between different financial entities and the factors that influence their behavior. Financial data are often reported in different formats, making it challenging to standardize and compare data across different sources. This lack of standardization can affect the accuracy and reliability of the results generated by machine learning models. Machine learning models are prone to overfitting, which occurs when a model becomes too complex and fits the training data too well, resulting in poor generalization performance. This can lead to inaccurate predictions when the model is applied to new data.
Despite the limitations discussed above, the application of financial networks and machine learning in research provides valuable insights into the complex relationships between financial entities. To overcome these limitations, researchers need to address issues such as data quality and availability, interpretability, standardization, overfitting, and ethical considerations. By addressing these issues, the use of financial networks and machine learning can continue to provide valuable insights into the behavior of financial entities and contribute to the development of new financial products and services.
Furthermore, systemic risk in financial networks can have significant implications for the real economy and social welfare. When financial institutions fail or experience significant losses due to risk contagion, it can lead to a chain reaction of negative effects on the broader economy. For example, a financial crisis can result in widespread job losses, reduced economic growth, and a decrease in consumer confidence. Furthermore, systemic risk can also have negative effects on social welfare. Financial instability and economic downturns can lead to social unrest, political instability, and increased poverty rates. In extreme cases, systemic risk can even lead to social collapse. Therefore, it is essential to understand and mitigate systemic risk in financial networks to promote a stable and prosperous economy and society. This requires robust risk management practices, regulatory oversight, and effective crisis management strategies. Additionally, promoting sustainable and socially responsible investments, such as ESG investments, can help reduce systemic risk by promoting long-term stability and sustainability.
5. Conclusions
In this paper we propose a financial network-based risk analysis and assessment framework to analyze the spillover effects of risk on ESG investments. The framework combines financial network evolution and machine learning prediction, which makes it possible to analyze and assess the spillover effects of risk in financial networks on ESG investments with reliability. First, we construct a theoretical model of the financial network and compute the network evolution over time using a small number of nodes simulations, and then we extend the model to a multi-node model using real data to simulate the evolution of the overall financial network. The results show that the robustness of the network increases as the level of complex correlations in the network rises. The overall ability of the financial network to withstand shocks from systemic risk events also increases. Subsequently, we use machine learning methods to predict abnormal volatility in the financial network based on the constructed financial network, and the results show that the better XGBoost method has the best results on the test set prediction. Subsequently, we evaluate the impact of risk spillovers on ESG investments.
The combination of financial networks and machine learning is a powerful tool for predicting financial outcomes and understanding the relationships between financial entities. However, there are limitations, such as the quality and availability of data, limited interpretability of results, lack of standardization in reporting financial data, and the risk of overfitting. Despite these limitations, the application of financial networks and machine learning provides valuable insights into the behavior of financial entities. To overcome these limitations, researchers need to address issues such as data quality, interpretability, standardization, overfitting, and ethical considerations. Further we will study the impact of ESG information disclosure on idiosyncratic risk.
Our findings have important implications for investors, policymakers, and companies. Investors should consider the impact of financial networks on ESG investments when making investment decisions. Policymakers should take steps to reduce systemic risk and promote transparency in financial networks. Companies should focus on long-term sustainability and reduce their exposure to risk in the financial network. Overall, our study provides evidence of the negative impact of risk spillovers in financial networks on ESG investments, highlighting the need for a more sustainable and resilient financial system.


