Abstract
A microchannel reactor improves the overall mass and heat transfer as compared with a conventional reactor. This is attributed to the creation of a high area-to-volume ratio and enhanced mixing due to the presence of the vortices inside the slug. In this paper, the mass-transfer performance was studied using a cross-junction microchannel. Subsequently, the computational fluid dynamic (CFD) method was used to observe the oil concentration contour inside a slug using volume-of-fluid (VOF) with the species-transport model. Based on the simulation results, the oil concentration was accumulated in both the slug’s rear and front regions. Hence, the creation of four vortices resulted in the creation of dead zones at the low-oil-concentration region. Furthermore, it has been observed that an optimum flow rate in a microchannel reactor is required to achieve a high mass transfer. A higher oil concentration was measured during the slug formation at a low flow regime due to the long residence time. In contrast, a high mass transfer has been reported during the slug-moving stage due to the higher vortices velocity, resulting in enhanced mixing and mass transfer. Hence, slug forming and the moving stage substantially influenced mass transfer at low and high flow rates, respectively.
1. Introduction
In recent years, continuous-flow methodology has received substantial attention in both the petrochemical and pharmaceutical industries. This is because such an approach is proven to be comparatively more economical as compared with batch or semibatch reactors. In this regard, a microchannel reactor, which is the design that allows for the miniaturization of reactor dimensions to a micrometer scale [1,2,3,4,5,6,7], is an attractive method for process-intensification in flow chemistry, thus creating a sustainable and highly efficient chemical synthesis. Notably, microchannels improve the mass transfer in both reactants and products, particularly in multiphase reactions. As an illustration, based on the information in Table 1 which compares the transesterification performances between batch and microchannel reactors, the microchannel showcases shorter residence times together with the feasibility to achieve comparable conversions under lower operating conditions (i.e., temperature and catalyst concentration). This is potentially attributed to the large interfacial area of the microchannels that allows for a short diffusion distance between reactants and products [8]. Hence, biodiesel production (liquid–liquid multiphase reaction) is expected to be highly appropriate to be utilized in microchannel reactors, as an effective mass-transfer process across the phases is highly desirable.

Table 1.
Summary of transesterification reactions for batch and microchannel reactors.
A transesterification reaction is conducted using a wide variety of vegetable oils with methanol or ethanol under a homogeneous catalyst such as potassium hydroxide (KOH) or sodium hydroxide (NaOH) [18]. The main target for this process is to tune the reaction rates and the yield of biodiesel (fatty acid methyl ester (FAME)). In the study conducted by Csernica et al. [19], the FAME reaction was observed to occur in the methanol phase; nevertheless, other oil components such as triglyceride, diglyceride and monoglyceride needed to be transferred from the oil phase into the methanol phase. Hence, this raises the pertinent question on whether the improvement in mass transfer across the interface can enhance the reaction rate and yield of FAMEs in the microchannel reactor.
In general, several microchannel designs such as T-junction or cross-junction channels have been adopted to improve the overall reaction rates and yields of FAMEs. Experimental findings have suggested that the cross-junction channel showcases superior performance in mass transfer rate regarding the T-junction due to the creation of shear forces on both sides of the slug interface. This has resulted in an increased movement of the biphasic interface and the intensification of the vortices inside the dispersed phase slug [20]. Apart from this, the production rates of FAMEs can be improved through the increased flowrate of the total system. This translates to an improved flow velocity. Furthermore, based on the experimental study conducted by several researchers [20,21,22], mass-transfer rates increase almost linearly with flow velocity. In a closer observation, the mass-transfer coefficient during the slug formation was comparatively higher than slug movement [22,23]. Thus, this work investigated mass-transfer performance microscopically through a computational fluid dynamic (CFD) simulation using volume-of-fluid (VOF) with the species-transport model. The effect of the mass-transfer rate on flow velocity was studied through variations in the total volumetric flowrate, QT, by comparing both the slug-forming and -moving stages. Subsequently, the flow hydrodynamics simulated through CFD studies were cross-validated with the experimental results via a cross-junction microchannel.
2. Materials and Methods
2.1. Experimental Setup
In this multiphase flow experiment, the dispersed and continuous phase were methanol and palm oil, respectively. Methanol was purchased from R&M Chemical, whereas palm oil was purchased from Lam Soon Sdn. Bhd. (Buruh). Potassium hydroxide pellets (KOH) were purchased from Merck. The catalyst was prepared by dissolving a KOH pellet in methanol based on the weight percentage of oil in wt.%. The experimental setup for slug observation was utilized based on our previous work [24].
The simulation was performed in Ansys Fluent version 18.2 using the volume-of-fluid (VOF) model. The solver used was pressure-based, and the time taken was in the transient mode. The geometrical domain contained c.a. 11,000 cells with a quadrilateral mesh. The maximum face area and aspect ratio were c.a. 70 μm2 and 10, respectively. The liquids’ (palm oil and methanol) properties used in this simulation were utilized based on the parameters listed in Table 2.
Table 2.
Details of liquid properties at 25 °C.
2.2. Simulation Setup and Boundary Conditions
In this simulation, all liquid properties were assumed to be constant, as both liquids were incompressible. Oil and methanol were used as the primary and secondary phases, respectively. Thus, the boundary conditions defined in this case were methanol (volume fraction = one) and oil (volume fraction = zero). The wall was assumed to have a no slip condition, and the wall-adhesion option was activated to define the contact angle as the representation of the wetting properties between oil and methanol with a PDMS wall. The contact angle was set to be constant and assumed to possess perfect oil wetting with the FEP wall. The manipulated variable that was changed in the simulation was the velocity at the methanol and oil inlet channels. Due to the fact that the simulation was solved using the transient mode, it was calculated iteratively using the step size of second by maintaining the Courant number below five. In the VOF model, a single momentum equation, as shown in Equation (1), is solved throughout the domain, where the resulting velocity field is shared among the phases [25]. It depends on the volume fractions of all phases through the properties of ρ and µ. The source term in Equation (1) is the surface tension term which has adopted the continuum surface force (CSF) model.
3. Results and Discussion
3.1. Slug Formation
Figure 1a shows the typical contour plot of a methanol volume fraction from the VOF model representing the slug formation at the cross-junction and the measured microchannel. Due to the lower wettability with FEP wall of the microchannel with reference to the wettability of the oil, methanol slugs were formed as the dispersed phase. On the other hand, oil, which was the continuous phase from both side inlets, exerts a shear force on the methanol phase, thus creating a constant slug size in the microchannel. Figure 1b shows the micrographs of slugs from the experimental results based on the same microchannel size and flow conditions. It can be observed that the slug formation pattern is qualitatively identical. However, quantitative analyses on the size of the slugs and the distance between consecutive slugs are not well comparable.
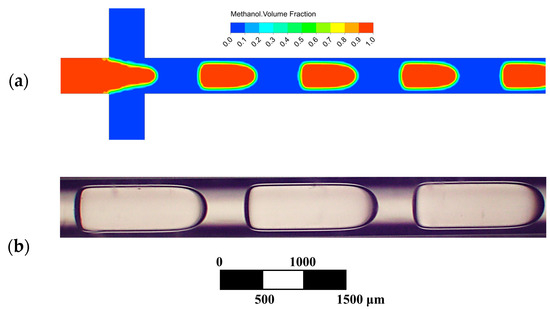
Figure 1.
(a) Contour plot of methanol volume fraction from VOF model; (b) micrographs of slug from experimental at the total volumetric flow rate, QT of 100 μL/min based on the same cross-junction microchannel design.
It is postulated that the trade-off between meshing quality and computational time has resulted in this discrepancy. Furthermore, the contact angle specified for the simulated boundary conditions was not feasible to be specified accurately due to the circular shape of the microchannel geometry. Hence, the variation in the mesh quality is expected to influence the overall slug sizes, leading to difficulties in achieving asymptotic mesh quality, even if the highest possible meshing quality has been created. Previous observations supported such an investigation where the multiphase flow simulation via the VOF model was highly mesh dependent [9].
3.2. Concentration Contour Plot due to Mass Transfer
Figure 2a shows the contour plot of the oil concentrations in methanol slugs due to the mass transfer.
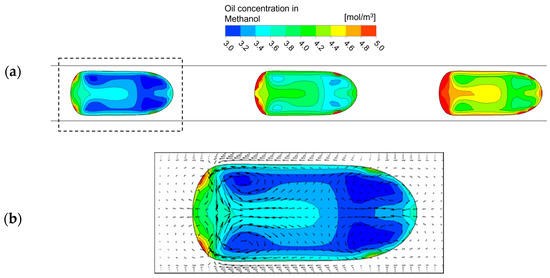
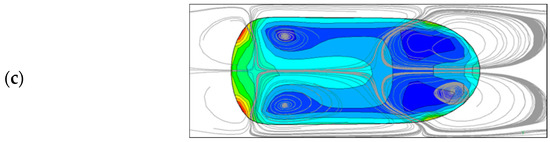
Figure 2.
The contour plot of oil concentration in methanol slug at QT = 100 μL/min where (a) three slugs at different positions in microchannel, (b) with vector lines and (c) streamlines describing the vortices inside the slug.
Three slugs were captured under different residence times to observe the concentration profile. The front slug exhibits the highest oil concentration due to its residence time being the highest with reference to the other two slugs. The magnified figure of a slug is illustrated in Figure 2b,c based on the profile from Figure 2a, where the vectors and streamlines describing the vortices inside the slug are illustrated. A clear pattern of oil concentration can be observed due to the vortices generated by the shearing motion of the continuous phase. The oil species was uniformly transferred into the methanol slug through the interface boundary. However, an accumulation of oil species in certain regions inside the slug can be observed, where the oil was concentrated at the rear and front regions of the slug. It was expected to be propagated to the center region based on the flow created from the two side vortices. The lowest-concentration regions were located inside the vortices based on the vector and streamline plot in Figure 2b,c. This behavior can be comparatively illustrated with the mixing behavior of a blade impeller in a tank where dead zones appeared between the impellers, as illustrated in Figure 3.
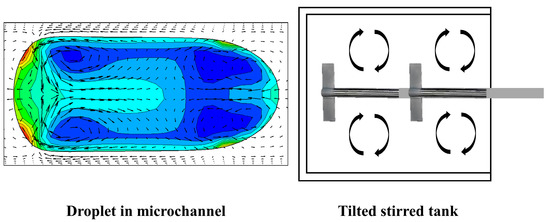
Figure 3.
Comparison of dead zones in slug microchannel and tilted stirred tank with impeller.
In a common practice, baffles are installed beside the tank to eliminate the vortices in order to allow for improved mixing. Thus, it can be foreseen that microchannels with varying diameters, sizes or configurations can be used to imitate the same function as baffles in the stirred tank. These simulation results are in line with the experimental studies as reported in a previous paper [2].
3.3. Effect of Velocity on Mass Transfer during Forming and Moving Stages
The mass-transfer effects of the slug were investigated in two stages: (i) the forming stage during slug formation; (ii) the moving stage after slug formation. Table 3 tabulates the average time of each slug formation at different total volumetric flow rates.
Table 3.
Average slug formation times and oil concentrations under the cross-junction configuration based on the variation in its total volumetric flow rate.
At the slug-formation stage, mass transfer occurs at the interface once two liquids are in contact. The amount of oil species transferred into the methanol phase was linked with the residence time for slug formation. As anticipated, the utilization of a higher flow rate generates the slug at a much faster rate. Nonetheless, the oil concentration inside the methanol phase appeared lower at higher flow rate due to the lower residence time. The lowest flow rate of 25 µL/min displayed the longest slug formation time of 3 s (Table 3), signifying the longest residence time and the highest oil concentration (4.99 mol m−3). Subsequently, to investigate the concentration profile of a specific flow rate during the slug formation, comparative oil concentration contours are illustrated in Figure 4 based on the representative flow rates of 50 and 200 μL/min.
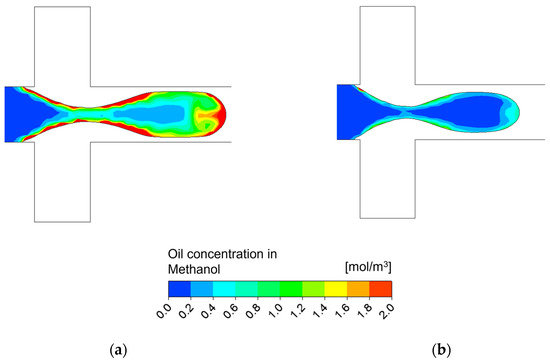
Figure 4.
Oil concentration contour plots during slug-forming stage under two different flow rates of (a) 50 μL/min; (b) 200 μL/min.
In the moving stage, the initial evaluation time began once the slug was formed. The concentration measured was relative to the initial oil concentration at the slug-formation stage, which indicated that all of the slugs possessed zero concentration at the initial time. Figure 5 displays the oil concentrations inside a methanol slug under varying residence times.
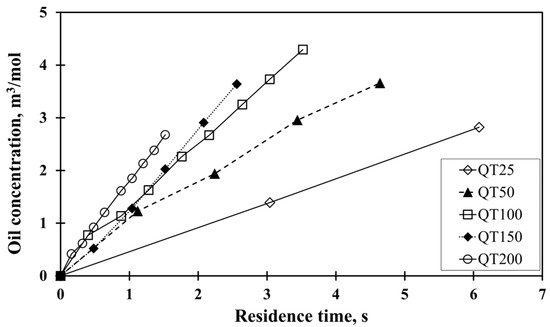
Figure 5.
Oil-concentration line plot in a slug during slug-forming stage at different residence times.
The highest flow rate (200 µL/min) recorded a residence time up to 1.5 s due to the short length of the microchannel. On the other hand, under the case of the slowest flow rate (25 µL/min), the residence time was completed at 12 s. Nevertheless, the concentration shown in Figure 5 was only plotted up to 6 s to ensure that a comparative study could be performed. Despite the lowest residence time being reported when the flow rate was at 200 µL/min, this behavior yielded the highest mass-transfer rate. The calculated mass-transfer rate was computed based on the slope in Figure 5 through the summary provided in Table 4. At the moving stage, the mass transfer of oil into the methanol slug increased as the flow rate increased due to recirculation inside the slug. Furthermore, the slug recirculation at all flow rates exhibited a similar pattern. It was expected that a higher flow rate would increase the mixing intensity leading to an increased mass-transfer rate, which was well noted in the streamline inside the methanol slug.
Table 4.
Mass-transfer rate at slug-moving stage.
Figure 6 shows the streamlines of the liquid flow in the methanol-phase slug based on specified seed locations. It was expected that the seeds would provide the liquid that passed through the specified location as a tracer, allowing for the observation of the pathway that was taken by the liquid as the streamline. This profile would assist in understanding the mixing behavior of the liquid inside the methanol slug. On the other hand, grey and pink streamlines are traced lines derived from the seeds at vertical and horizontal lines, respectively. Based on the profile, Figure 6b clearly portrays that a higher flow rate exerts a higher mixing intensity, based on the number of streamlines recirculating inside the methanol slug. At a low flow rate, however, only a few streamlines were noted inside the slug, despite both conditions illustrating comparable quantities and locations of seeds. The streamline structure seemed slightly scattered and not focused within the methanol slug. This evidenced that a higher flow rate generated a higher mixing intensity inside the methanol slug, thus increasing the mass-transfer rate of oil into the methanol phase. Subsequently, the contributions of the mass-transfer rates at various stages were measured by varying the oil concentrations during the forming and moving stages (Table 5). The mass-transfer contribution from the slug-formation stage was calculated using Equation (2), where CF refers to the oil concentration at the formation stage (Table 2) whereas CT,t denotes the total oil concentration during the formation stage at a distance.
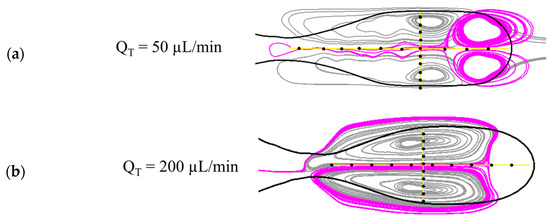
Figure 6.
Comparison of streamlines at (a) high and (b) low flow rates. The dots indicated in the figure illustrate the seed locations.
Table 5.
Mass-transfer contributions at the slug formation stage.
Based on the summarized result, the mass-transfer contribution during the slug-formation stage is relatively higher toward the total mass transfer. This phenomenon is particularly evident at a low flow rate, where 34.1% of the total mass transfer resulted from the slug formation. A substantial reduction in the contribution from the slug formation was readily observed with the increased total volumetric flow rate. This finding is comparable with the empirical finding conducted by Xu et al., whereby at least 30% mass transfer was contributed during the slug-formation stage [7]. Although the mass-transfer contribution was relatively high during the slug-formation stage, such an effect would be diminished with an increased microchannel length. This is because during the slug-moving stage, an additional enhancement was contributed by high recirculation velocity inside the slug. Hence, mass transfer during the slug formation is beneficial only at low flow rate conditions with a short microchannel length. However, for a high-throughput process, such as the production of biodiesel, a high flow rate is favorable to enhance the production rate, thus demanding a longer microchannel length. In this case, the mass-transfer contribution during the slug-formation stage is no longer significant with reference to the long residence time during the slug-moving stage.
3.4. Effect of Flow Rate on Transesterification Reaction
To observe the effect of flow rate on the transesterification reaction, the total volumetric flow rates, QTotal, of both the methanol and oil phases were varied experimentally. Throughout the experiments, the parameters, namely the methanol-to-oil ratio, KOH concentration and residence time, were kept constant at 7.6, 3 wt% and 60 s, respectively. Varying lengths of microchannels and QTotal were calibrated to ensure that the residence time was kept constant at 60 s. As anticipated, based on the trend between the channel length and calibrated QTotal, a longer channel length is required to accommodate the same residence time across the studied volumetric flow rates.
Further investigations on the molecular level have indicated that the flow inside the microchannel was observable with a slug-flow regime. Hence, quantitative data of the slug characteristics was plotted in Figure 7a. Based on the trend reported, a linear decrease of slug diameter with respect to the flow rate has been reported. The differences between the slugs at the lowest and highest flow rates are less distinct. This striking difference generally lies in the slug diameter, whereby the highest flow rate resulted in a smaller diameter than at the lowest flow rate.
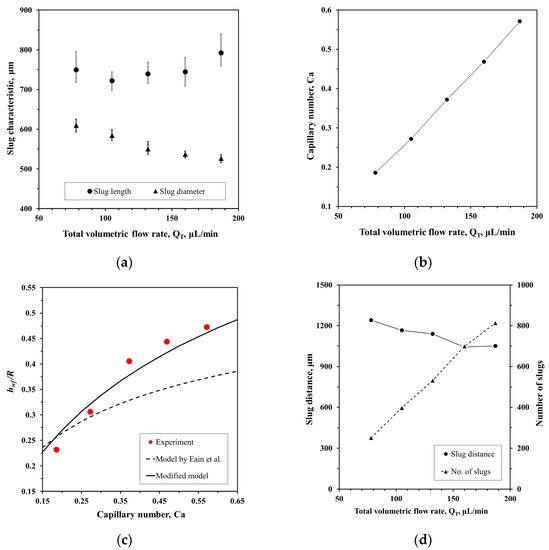
Figure 7.
(a) The slug characteristic at different total volumetric flow rates; (b) Capillary number for the respective flow rate in this study; (c) Capillary number for the respective flow rate in this study; (d) The slug distance and number of slugs at different total volumetric flow rates.
In general, the decrease of slug diameter resulted from an increase in wall-film thickness that was occupied by the oil-phase layer at the wall. Upon an increase in the flow rate, the presence of a viscous effect at the solid–liquid interface resulted in an increased wall-film thickness [26]. The magnitude of the thin film relies on inertial, capillary and body forces where two distinct flow regimes (i.e., visco-capillary and visco-inertial regimes) are present, as illustrated by Aussillous et al. [27]. Based on this definition, a flow is within the visco-capillary regime when the capillary number, Ca, is smaller than the threshold capillary number, Ca* (Ca > Ca*), while the visco-inertial regime shows otherwise. The threshold capillary number can be estimated using Equation (3), where µ and ρ denote the continuous-phase viscosity and density, respectively, while R and σ are defined as the microchannel inner radius and interfacial tension, respectively.
With this in place, a plot of Ca against the total volumetric flow rate was plotted and illustrated in Figure 7b. An increase of Ca was attributed to an increase of slug velocity with the increase in the total volumetric flow rate. As the calculated Ca* in this study was 33.7, it signifies that the oil and methanol flows were categorized under the visco-capillary regime, with Ca < Ca*. In this regime, the flows were subject to increased viscous and reduced inertial effects, suggesting that the inertial forces had minimal effects on the magnitude of the film. The normalized film thickness in the visco-capillary flow regime depends only on Ca, which can be estimated using Taylor’s Law [27,28,29,30]. For the liquid–liquid flow inside a circular microchannel, Eain et al. [26] proposed a correlation model to estimate normalized film thickness, as shown in Equation (4). The model proposed by Eain et al. was compared with the experimental outcomes of this study and plotted in Figure 7c.
Based on the reported data, the model proposed by [26]. unfortunately failed to predict the right normalized film thickness at higher Ca values. This is because the proposed model is only feasible to cover at a small range of Ca values (0.00–0.14). The empirical and exponential constants in this correlation, as presented in Equation (4), were 1.6 and 2/3, respectively. Hence, a modified correlation, as presented in Equation (5), was required. It has been reported that this proposed modified model exhibited exceptional agreement with the experimental data (i.e., ±6% error), as illustrated in Figure 7c.
In terms of slug distance, increments in the total volumetric flow rate did not showcase any significant change, as illustrated in Figure 7d. The trend, nonetheless, displayed a slight decrease in slug distance with increments in flow rate. Here, the number of slugs did not adhere to the characteristics of slug distance due to varying flow rates, along with differing total lengths of the microchannels. Table 6 shows that at higher flow rates, a longer total microchannel length is required to keep the residence time constant. On the other hand, due to an increase in the total microchannel length, the total number of slugs increases (Figure 7d). Nevertheless, the impact of the surface-area-to-volume (S/V) ratio towards the total flow rate is relatively minimal, based on the plot in Figure 8a. This is because the domain volume increased simultaneously with the increase in the number of slugs. Hence, the normalization of the domain volume factor is required by introducing the number of slugs per cm of microchannel length, as portrayed in Figure 8b. In this context, the trend of the number of slugs adhered is inversely proportional to the slug distance. As such, only a slight change was observed in the interfacial area for the factor of total volumetric flow rate, thus considered as not highly significant.
Table 6.
Calibrated flow rates at respective microchannel lengths.
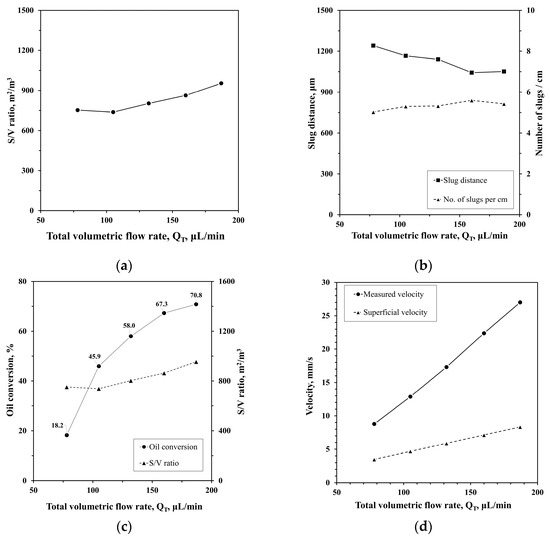
Figure 8.
(a) The S/V ratio; (b) The trends between slug distance and number of slugs per cm for different total flow rates; (c) Oil conversion with its S/V ratio at various total volumetric flow rates; (d) Comparison between measured slug velocity and calculated superficial velocity.
Figure 8c illustrates the oil conversion based on the variations in the total volumetric flow rates. The oil conversion displayed an increasing trend with an increase in total volumetric flow rate. Increases in the total volumetric flow rate resulted in higher velocities of the slug flow in the microchannel reactor. Although the interfacial area had an impact on the mass-transfer rate of triglyceride into the methanol phase, it was not the major factor in this situation. Based on the plot in Figure 8c, the impact of flow rate on the interfacial area showcases a small influence, while this is not the case for the S/V ratio. Hence, the interfacial area factor is not the major factor towards an increase in oil conversion with a co-current increase in flow rate. Therefore, slug velocity is the main contributing factor that enhances mass transfer at a high flow rate, as demonstrated from the CFD simulation results previously discussed. With the increase in volumetric flow rate, the measured slug velocity increases proportionally (Figure 8d). Nevertheless, the measured slug velocity was dissimilar from the superficial velocity. Slug velocity, US, was measured using the frame-per-second speed of the captured photos from the CCD camera under a microscope. Meanwhile, the superficial velocity was determined by dividing the total volumetric flow rate with the cross-sectional area of the microchannel using Equation (5), where r denotes the internal radius of the microchannel.
In general, a high mass-transfer rate was observed at high flow rates, which was validated from the simulation results as elaborated on in the previous section. This occurrence is reported in various applications of multiphase systems, as summarized in Table 7. All of the studies have arrived onto the same conclusion; the increase of the mass-transfer rate at high flow rates is contributed to from the internal circulations within the slugs. The increase in shear velocity, as a whole enhancement the degree of mixing inside the slugs through increase in the strength of the circulation vortexes. This internal circulation was also observed from our previous finding [31]. Hence, the CFD results to assess mass-transfer enhancement at higher flow rates are validated here with the experimental findings.
Table 7.
Studies of mass transfer in the liquid–liquid multiphase system inside the microchannel.
4. Conclusions
The mass-transfer performance in an immiscible liquid–liquid system in a cross-junction microchannel was investigated using the CFD simulation with the aid of VOF coupled with the species-transport model. The simulation results show the oil concentration contour plot and the accumulated regions due to vortices and flow dynamics inside the methanol slug. This was subsequently validated by experimental data showing that the region of mostly accumulated oil concentration was attributed to the generation of FAME from the transesterification reaction. During the slug-formation stage, the lowest flow rate shows the highest oil concentration due to the creation of the longest residence time before a slug can be formed. However, during the slug-moving stage, the highest flow rate resulted in the highest mass-transfer rate due to the high velocity vortices that enhanced the mixing inside the slug. Mass transfer at the slug-forming stage contributed to more than half of the total mass transfer, particularly at slow flow rates. Nevertheless, the contribution of the mass transfer during the slug-flowing stage was comparatively higher than that of the mass transfer at the slug-forming stage. In addition, the increased flow rate gives insignificant changes in the S/V ratio but increases the oil conversion, validating the CFD results of mass-transfer enhancement. Therefore, in cases of a high-throughput production such as biodiesel production, a long microchannel with a high flowrate is recommended for an optimum mass-transfer performance, hence the improved reaction rates and production yields. Future studies will focus on using microchannels with several nozzles of varying channel diameters to minimize the creation of dead zones inside vortices and improve the mixing distribution in the slugs.
Author Contributions
Conceptualization, A.M.L. and K.Z.K.S.; Data curation, A.M.L.; Formal analysis, A.M.L.; Investigation, A.M.L. and J.D.; Methodology, J.D.; Project administration, A.M.L. and K.Z.K.S.; Resources, K.Z.K.S.; Software, K.Z.K.S.; Supervision, J.D. and K.Z.K.S.; Visualization, A.M.L.; Writing—original draft, A.M.L. and C.Y.C.; Writing—review & editing, A.M.L., C.Y.C. and M.R.B. All authors have read and agreed to the published version of the manuscript.
Funding
This research was funded by STIRF Grant by Universiti Teknologi PETRONAS, grant number 015LA0-029.
Institutional Review Board Statement
Not applicable.
Informed Consent Statement
Not applicable.
Data Availability Statement
The data are available from the corresponding author.
Acknowledgments
The authors would like to offer their gratitude to Universiti Teknologi PETRONAS for providing the STIRF Grant and state-of-the-art research facilities.
Conflicts of Interest
The authors declare no conflict of interest. The funders had no role in the design of the study; in the collection, analyses, or interpretation of data; in the writing of the manuscript; or in the decision to publish the results.
References
- Yue, J. Multiphase Flow Processing in Microreactors Combined with Heterogeneous Catalysis for Efficient and Sustainable Chemical Synthesis. Catal. Today 2018, 308, 3–19. [Google Scholar] [CrossRef]
- Atobe, M.; Tateno, H.; Matsumura, Y. Applications of Flow Microreactors in Electrosynthetic Processes. Chem. Rev. 2018, 118, 4541–4572. [Google Scholar] [CrossRef] [PubMed]
- Chamkha, A.J.; Molana, M.; Rahnama, A.; Ghadami, F. On the Nanofluids Applications in Microchannels: A Comprehensive Review. Powder Technol. 2018, 332, 287–322. [Google Scholar] [CrossRef]
- Olanrewaju, A.; Beaugrand, M.; Yafia, M.; Juncker, D. Capillary Microfluidics in Microchannels: From Microfluidic Networks to Capillaric Circuits. Lab Chip 2018, 18, 2323–2347. [Google Scholar] [CrossRef] [PubMed]
- Suryawanshi, P.L.; Gumfekar, S.P.; Bhanvase, B.A.; Sonawane, S.H.; Pimplapure, M.S. A Review on Microreactors: Reactor Fabrication, Design, and Cutting-Edge Applications. Chem. Eng. Sci. 2018, 189, 431–448. [Google Scholar] [CrossRef]
- Wei, L.; Yu, C.; Zhang, Q.; Liu, H.; Wang, Y. TiO2-Based Heterojunction Photocatalysts for Photocatalytic Reduction of CO2 into Solar Fuels. J. Mater. Chem. Mater. 2018, 6, 22411–22436. [Google Scholar] [CrossRef]
- Shi, H.; Nie, K.; Dong, B.; Long, M.; Xu, H.; Liu, Z. Recent Progress of Microfluidic Reactors for Biomedical Applications. Chem. Eng. J. 2019, 361, 635–650. [Google Scholar] [CrossRef]
- Mohd Laziz, A.; KuShaari, K.; Azeem, B.; Yusup, S.; Chin, J.; Denecke, J. Rapid Production of Biodiesel in a Microchannel Reactor at Room Temperature by Enhancement of Mixing Behaviour in Methanol Phase Using Volume of Fluid Model. Chem. Eng. Sci. 2020, 219, 115532. [Google Scholar] [CrossRef]
- Miyuranga, K.A.V.; Balasuriya, B.M.C.M.; Arachchige, U.S.P.R.; Jayasinghe, R.A.; Weerasekara, N.A. Comparison of Performance of Various Homogeneous Alkali Catalysts in Transesterification of Waste Cooking Oil. Asian J. Chem. 2022, 34, 3157–3161. [Google Scholar] [CrossRef]
- Pang, L.; Lv, S.; Li, K.; Ding, L.; Hao, Y. Parameter Optimization for the Biodiesel of Xanthoceras Sorbifolium Oil and Determination of Fatty Acid Methyl Ester. Bioresources 2022, 18, 844–854. [Google Scholar] [CrossRef]
- Chimezie, E.C.; Wang, Z.; Yu, Y.; Nonso, U.C.; Duan, P.-G.; Kapusta, K. Yield Optimization and Fuel Properties Evaluation of the Biodiesel Derived from Avocado Pear Waste. Ind. Crops Prod. 2023, 191, 115884. [Google Scholar] [CrossRef]
- Yusuff, A.S.; Tanko, N.L.; Azeez, T.M.; Obende, B.A. Methanolysis of Fresh and Used Soybean Oil to Biodiesel under Mild Conditions: Process Optimization, Fuel Quality Characterization and Thermal Stability Studies. Chem. Eng. Process.-Process Intensif. 2022, 182, 109177. [Google Scholar] [CrossRef]
- Sundaramahalingam, M.A.; Karthikumar, S.; Shyam Kumar, R.; Samuel, K.J.; Shajahan, S.; Sivasubramanian, V.; Sivashanmugam, P.; Varalakshmi, P.; Syed, A.; Marraiki, N.; et al. An Intensified Approach for Transesterification of Biodiesel from Annona Squamosa Seed Oil Using Ultrasound-Assisted Homogeneous Catalysis Reaction and Its Process Optimization. Fuel 2021, 291, 120195. [Google Scholar] [CrossRef]
- Abdulla Yusuf, H.; Hossain, S.M.Z.; Aloraibi, S.; Alzaabi, N.J.; Alfayhani, M.A.; Almedfaie, H.J. Fabrication of Novel Microreactors In-House and Their Performance Analysis via Continuous Production of Biodiesel. Chem. Eng. Process.-Process Intensif. 2022, 172, 108792. [Google Scholar] [CrossRef]
- Veluturla, S.; Rambhia, S.A.; Pranavi, S. Process Intensification Studies in Synthesis of Biodiesel with a Helical Coil Continuous Microreactor. Biofuels 2022, 14, 387–392. [Google Scholar] [CrossRef]
- Aghel, B.; Mohadesi, M.; Razmehgir, M.H.; Gouran, A. Biodiesel Production from Waste Cooking Oil in a Micro-Sized Reactor in the Presence of Cow Bone-Based KOH Catalyst. Biomass Convers. Biorefin. 2022. epub ahead of print. [Google Scholar] [CrossRef]
- Shrimal, P.; Sanklecha, H.; Patil, P.; Mujumdar, A.; Naik, J. Biodiesel Production in Tubular Microreactor: Optimization by Response Surface Methodology. Arab. J. Sci. Eng. 2018, 43, 6133–6141. [Google Scholar] [CrossRef]
- Gopi, R.; Thangarasu, V.; Vinayakaselvi, M.A.; Ramanathan, A. A Critical Review of Recent Advancements in Continuous Flow Reactors and Prominent Integrated Microreactors for Biodiesel Production. Renew. Sustain. Energy Rev. 2022, 154, 111869. [Google Scholar] [CrossRef]
- Csernica, S.N. The Phase Behavior Effect on the Reaction Engineering of Transesterifcation Reactions and Reactor Design for Continuous Biodiesel Production; Lehigh University: Bethlehem, PA, USA, 2013. [Google Scholar]
- Sattari-Najafabadi, M.; Nasr Esfahany, M.; Wu, Z.; Sundén, B. Hydrodynamics and Mass Transfer in Liquid-Liquid Non-Circular Microchannels: Comparison of Two Aspect Ratios and Three Junction Structures. Chem. Eng. J. 2017, 322, 328–338. [Google Scholar] [CrossRef]
- Yang, L.; Nieves-Remacha, M.J.; Jensen, K.F. Simulations and Analysis of Multiphase Transport and Reaction in Segmented Flow Microreactors. Chem. Eng. Sci. 2017, 169, 106–116. [Google Scholar] [CrossRef]
- Bai, L.; Zhao, S.; Fu, Y.; Cheng, Y. Experimental Study of Mass Transfer in Water/Ionic Liquid Microdroplet Systems Using Micro-LIF Technique. Chem. Eng. J. 2016, 298, 281–290. [Google Scholar] [CrossRef]
- Xu, J.H.; Tan, J.; Li, S.W.; Luo, G.S. Enhancement of Mass Transfer Performance of Liquid–Liquid System by Droplet Flow in Microchannels. Chem. Eng. J. 2008, 141, 242–249. [Google Scholar] [CrossRef]
- Kushaari, K.; Laziz, A.M.; Hamid, N.H. Quantitative Analysis of Interfacial Area on Liquid-Liquid Multiphase Flow of Transesterification Process in Cross-Junction Microchannel Reactor. J. Eng. Technol. Sci. 2019, 51, 585–596. [Google Scholar] [CrossRef]
- ANSYS Inc. Ansys Fluent 2022 R2 Theory Guide; ANSYS Inc.: Canonsburg, PA, USA, 2022. [Google Scholar]
- Mac Giolla Eain, M.; Egan, V.; Punch, J. Film Thickness Measurements in Liquid–Liquid Slug Flow Regimes. Int. J. Heat Fluid Flow 2013, 44, 515–523. [Google Scholar] [CrossRef]
- Aussillous, P.; Quéré, D. Quick Deposition of a Fluid on the Wall of a Tube. Phys. Fluids 2000, 12, 2367. [Google Scholar] [CrossRef]
- Fairbrother, F.; Stubbs, A.E. 119. Studies in Electro-Endosmosis. Part VI. The “Bubble-Tube” Method of Measurement. J. Chem. Soc. 1935, 1, 527–529. [Google Scholar] [CrossRef]
- Bretherton, F.P. The Motion of Long Bubbles in Tubes. J. Fluid Mech. 1961, 10, 166–188. [Google Scholar] [CrossRef]
- Han, Y.; Shikazono, N. Measurement of the Liquid Film Thickness in Micro Tube Slug Flow. Int. J. Heat Fluid Flow 2009, 30, 842–853. [Google Scholar] [CrossRef]
- Mohd Laziz, A.; KuShaari, K.; Chin, J.; Denecke, J. Quantitative Analysis of Hydrodynamic Effect on Transesterification Process in T-Junction Microchannel Reactor System. Chem. Eng. Process.-Process Intensif. 2019, 140, 91–99. [Google Scholar] [CrossRef]
- Biswas, K.G.; Das, G.; Ray, S.; Basu, J.K. Mass Transfer Characteristics of Liquid–Liquid Flow in Small Diameter Conduits. Chem. Eng. Sci. 2015, 122, 652–661. [Google Scholar] [CrossRef]
- Ghaini, A.; Kashid, M.N.; Agar, D.W. Effective Interfacial Area for Mass Transfer in the Liquid–Liquid Slug Flow Capillary Microreactors. Chem. Eng. Process. Process Intensif. 2010, 49, 358–366. [Google Scholar] [CrossRef]


Disclaimer/Publisher’s Note: The statements, opinions and data contained in all publications are solely those of the individual author(s) and contributor(s) and not of MDPI and/or the editor(s). MDPI and/or the editor(s) disclaim responsibility for any injury to people or property resulting from any ideas, methods, instructions or products referred to in the content. |
© 2023 by the authors. Licensee MDPI, Basel, Switzerland. This article is an open access article distributed under the terms and conditions of the Creative Commons Attribution (CC BY) license (https://creativecommons.org/licenses/by/4.0/).