Article

Effect of Elevation Gradient on Carbon Pools in a Juniperus przewalskii Kom. Forest in Qinghai, China

1
College of Forestry, Northwest A&F University, Yangling 712100, China
2
Qinling National Forest Ecosystem Research Station, Ningshan 711603, China
*
Author to whom correspondence should be addressed.
Sustainability 2023, 15(7), 6163; https://doi.org/10.3390/su15076163
Submission received: 22 February 2023 / Revised: 30 March 2023 / Accepted: 31 March 2023 / Published: 3 April 2023

Abstract

:
Forest ecosystems are an important component of the global carbon cycle. Carbon density (CD; carbon mass per unit area) elevational changes in the vegetation, litter, and soil of forest ecosystems, are poorly understood. We investigated CD variations in arbor, shrubs, herbs, litter, and soils in a Juniperus przewalskii Kom. (Przewalski’s juniper) forest at 2900–3900 m above sea level (a.s.l.) in Qinghai Province, China. The average CD of vegetation (VCD) and litter (LCD) were 76.53 and 1.21 t hm−2, respectively, and the CD increased with increasing elevation, to maximum values of 114.02 and 1.39 t hm−2, respectively, at 3500–3700 m a.s.l., before decreasing at higher elevations. The soil carbon density (SCD) gradually decreased from 2900 to 3500 m a.s.l., sharply increased from 3500 to 3700 m a.s.l., peaking at 217.84 t hm−2, and then sharply decreased. The maximum ecosystem carbon density (ECD, 333.25 t hm−2) occurred between 3500 and 3700 m a.s.l. The VCD and ECD were significantly and positively correlated with elevation and annual average precipitation (AAP, p < 0.01), and negatively correlated with annual average temperature (AAT, p < 0.05). These may be key factors in determining CD distribution. This study reveals that conserving high-elevation forests is important for enhancing organic carbon accumulation in the ecosystem.

1. Introduction

Forests, being the largest carbon pool in terrestrial ecosystems [1], play a key role in balancing the global atmospheric cycle and slowing the rise of atmospheric CO2 concentrations [2,3]. Small changes in the carbon balance, result in large changes in global CO2 concentrations [1]. At high elevations and latitudes, the amount of organic carbon associated with vegetation is highly sensitive to global warming [4,5]. Soil carbon sequestration and afforestation play a major role in mitigating climate change as primary negative emission technologies [6]. However, the estimates of the carbon sink capacity in mid–high latitude forests remain unclear [7]. Therefore, it is important to clarify the distribution of carbon pools in forest ecosystems and corresponding patterns of the response patterns to climate change, and to investigate the mechanisms affecting the balance of the carbon cycle [8,9]. Quantitative studies of ecosystem carbon pools can provide a theoretical basis for the integrated management of natural ecosystems and sustainable utilisation of natural resources [10].
The organic carbon concentration and composition within ecosystems are influenced by various environmental factors, including ambient temperature, humidity, vegetation type, and biological activity [11,12]. Elevation gradients can be utilised as a natural laboratory in which to study the ecology of a region through a redistribution of temperature, rainfall, and other factors [13], as well as the effects of elevation on the size and composition of the carbon pools in the ecosystem [14,15]. Therefore, clarifying the characteristics of carbon pools dynamics in plants, litter, and soils along the elevation gradient, is important in understanding plant responses to climate change as well as the regional carbon balance. High-elevation ecosystems are typically characterised by a single vegetation type and simple stand structure; thus, these systems can accurately reflect vegetation growth, carbon pool composition, and climate change ecosystem responses to elevation. In the last two decades, most studies of forest carbon dynamics have focused on elevation-dependent variations in the soil organic carbon (SOC) concentration and plant growth in forest ecosystems at high elevations [9,15,16,17,18,19,20]. The focus is on the SOC pool, its composition and distribution patterns, and the factors influencing typical forest vegetation in these areas. However, most of these studies are based on different vegetation types, at different elevations. Thus, the results cannot contribute to a comprehensive analysis of the responses of forest carbon pools to elevation changes owing to differences in the soil type under different forest vegetation communities and other environmental factors. Moreover, these studies focus on the changes in single components, and few studies have focused on the differences in forest ecosystem carbon pools and their distribution in the vertical space.
The Qinghai–Tibetan Plateau (QTP), which covers a considerable part of Qinghai Province, is one of the most climate change-sensitive regions in the world [21]. QTP has recently experienced an incremental rise in temperature, approximately two times greater than the global average temperature [22,23,24]. The unique alpine climate of the QTP appears to amplify the effects of global warming [25,26,27], and the large vertical variation in the elevation gradients of this region makes it an ideal study area for examining vegetation responses to climate change. Juniperus przewalskii Komarov (Przewalski’s juniper), an endemic and dominant species found throughout the QTP [28,29], plays a key role in maintaining soil stability, protecting water resources, sequestering carbon, producing timber, and increasing carbon stocks in the terrestrial ecosystems of Qinghai [30,31]. In addition, Przewalski’s juniper grows rapidly [29], making it an important species when considering climate change. Furthermore, the drought resistant afforestation technology of Przewalski’s juniper is of great significance for alleviating water shortage and aiding in sand fixation in arid areas [6]. In this study, we investigated the carbon density (CD) of the vegetation, litter, and soil layers in the Przewalski’s juniper forest ecosystem along five gradients from 2900 to 3900 m a.s.l. in Qinghai Province, China. For the purposes of this study, CD is defined as the carbon mass per unit area. This expression has been used by Yuan et al. [32]. The objectives of this study were to (i) characterise the changes in CD ratios of the three components in the forest ecosystem (vegetation, litter, and soil) along an elevation gradient, and (ii) explore relationships between CD and environmental factors, plant characteristics, and elevation gradients, and elucidate the main factors affecting carbon sequestration. This study is expected to provide reference data that will be useful in further study of forest ecosystem CD in high-altitude areas, and a basis for the scientific management of Przewalski’s juniper forests.

2. Materials and Methods

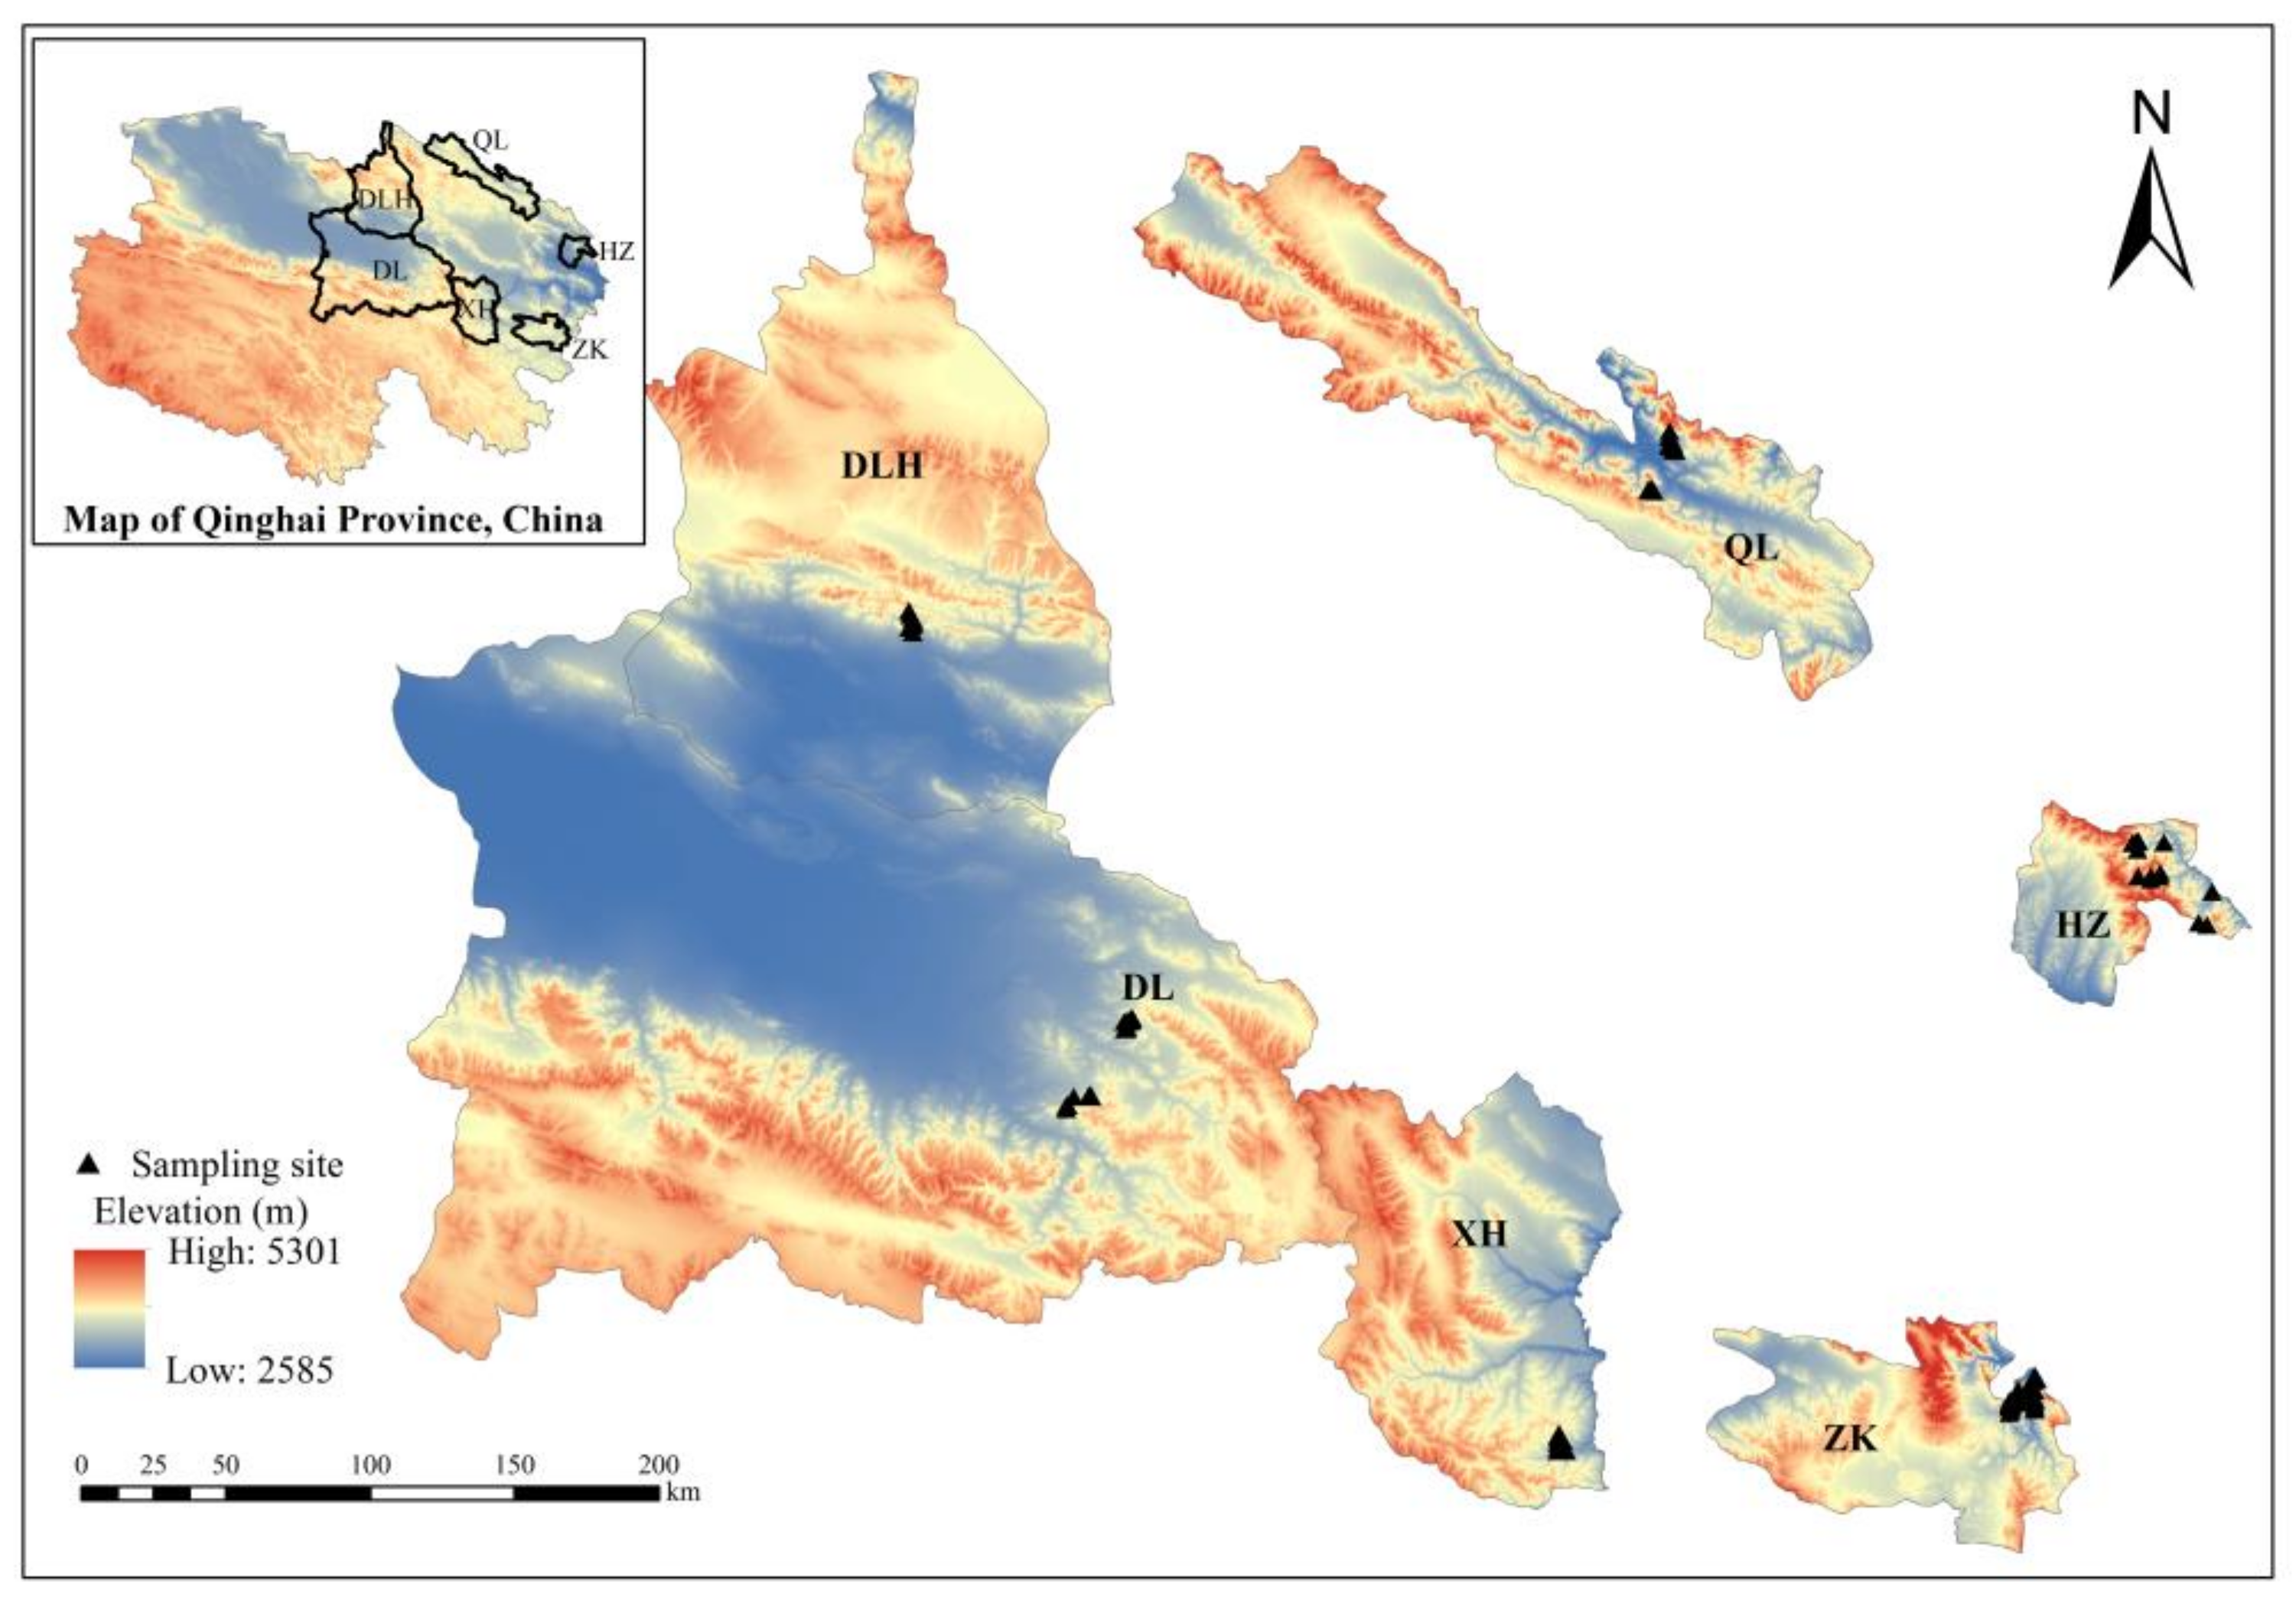
2.1. Description of Study Site

Samples were obtained from 6 naturally regenerating stands of Przewalski’s juniper (Figure 1), within an elevation range of 2900–3900 m a.s.l., in Qinghai Province (31°36′–39°19′ N, 89°35′–103°04′ E), in these counties: Dulan (DL), Huzhu (HZ), Zeku (ZK), Qilian (QL), Delingha (DLH), and Xinghai (XH). The annual average temperature (AAT), precipitation (AAP), and evaporation at this site, range from −1.33 to 5.28 °C, 51.60 to 502.50 mm, and 1200 to 1600 mm, respectively. The soil types are predominantly mountain grey cinnamon forest soil, mountain chestnut soil, and subalpine shrub meadow soil. The most common shrub species in these forests are Potentilla fruticosa, Potentilla glabra, Berberis diaphana, Cotoneaster acutifolius, Sibiraea angustata, and Caragana jubata. The dominant herbaceous species at these sites are Polygonum viviparum, Thalictrum baicalense, Carex lanceolata, Ranunculus tanguticus, Polygonum sibiricum, Aster altaicus, Anaphalis lactea, and Pedicularis kansuensis.

2.2. Sample Plot Setting and Sampling Method

Field surveys and samplings were conducted in July and August 2018. In total, 103 randomly selected plots were sampled from the Przewalski’s juniper forest along the established elevation gradient (Table 1). The survey plots were designed based on the study by Hou et al. [33]. Five subplots with shrubs and herbs were arranged diagonally within each tree plot. Sampling plots for trees, shrubs, and herbs were 20 × 20 m, 2 × 2 m, and 1 × 1 m, respectively. The tree species identity, number, tree height, diameter at breast height (DBH), and canopy density; and shrub- and herb-species identity, height, cover ratio, and numbers, were recorded. The AAT and AAP for the study area were obtained from the China Meteorological Data Service.
While conducting a per-wood survey of the shrub layer within the five subplots, one representative subplot was selected for each of: the harvest of the aboveground biomass; the excavation of the belowground biomass; and the weighing of fresh roots, stems, leaves, and other organs, per species. In total, 100 g of each organ sample was transported to the laboratory and oven-dried to a constant mass at 65 °C in an air blast-drying oven. The moisture contentration was calculated, and the individual and total biomass of each organ from different shrub species, was estimated. The biomass per unit area was calculated based on the area of the subplots. Similarly, each plot was sampled to obtain the estimations of biomass in the herbaceous and litter layers.
A total of 5 subplots (1 m × 1 m) were randomly set-up within each sampling plot, and an auger (internal diameter; 38 mm) was used to collect soil samples at a depth of 0–60 cm, at 10 cm intervals. Five soil samples from the same depth within each subplot, were mixed into one sample. Soil volumetric rings (100 cm3) were also used to collect soil samples, and the cutting-ring method was used to measure the soil bulk density (SBD). All samples were weighed in the field before being transported to the laboratory, where they were air-dried and passed through a 2 mm sieve for analysis. The SOC concentration was measured using a TOC analyser (TOC–V CPH; Shimadzu Corporation, Kyoto, Japan).

2.3. Data Processing

2.3.1. Establishment of Elevation Gradient

According to topographic conditions in the study area, the elevation gradient was divided into 5 floors/levels, at 200 m intervals, from 2900 to 3900 m a.s.l.: (1) 2900–3100 m, (2) 3100–3300 m, (3) 3300–3500 m, (4) 3500–3700 m, and (5) 3700–3900 m.

2.3.2. Biomass of Arboreal Layer of the Przewalski’s Juniper Forest

The biomass of the Przewalski’s juniper trees was calculated according to relative growth equations of biomass, developed by Wang et al. [34], and the specific estimation equation is as follows:
WT = 0.2561(D2H)0.7425
where WT is the living biomass of the trees (t hm−2), D (cm) is the tree diameter at breast height, and H (m) is the tree height.

2.3.3. CD of Vegetation and Litter Layers in the Przewalski’s Juniper Forest

The formula used to calculate the vegetation carbon density (VCD) and litter carbon density (LCD) in the forest is as follows:
ρ c = W i S i × c w i
where ρc is the CD (t hm−2), Wi is the biomass for vegetation/litter (t), Si is the sample plot area (hm2), and cwi is the carbon concentration, which was set to 0.45, although it varies slightly in different vegetation communities [35,36]. Lastly, the VCD is the sum of the arboreal, shrub, and herbaceous layers CD per unit area.

2.3.4. Soil Carbon Density

The soil carbon density (SCD) was calculated as follows:
S C D = i = 1 n ( 1 θ i % ) × p i × C i × T i / 10
where SCD is the organic carbon density in the soil profile (t hm−2), θi is the volume (%) of the gravel content with i > 2 mm, pi is the SBD of layer i (g cm−3), Ci is the SOC concentration in layer i (g kg−1), Ti is the soil thickness of layer i (cm), and n is the total number of soil layers involved in the layer i calculation.

2.3.5. Ecosystem Carbon Density

The ecosystem carbon density (ECD) of the Przewalski’s juniper forest represents the carbon accumulated by the average CD of the arboreal, shrub, herbaceous, litter, and soil layers, per unit area.
ArcMap (version 10.7; Environment System Research Institute, Redlands, CA, USA) was used to map the study area. The software packages SPSS (version 22.0; SPSS Inc., Chicago, IL, USA) and OriginPro (version 2023; Origin Lab Corporation, Northampton, MA, USA) were used in statistical analyses and plotting. Next, 1-way analysis of variance (ANOVA), followed by Fisher’s least significant difference test (p < 0.05), were used to evaluate the statistical significance of all measurements among elevation gradients and soil layers. The strength of the correlations between the CD versus environmental factors, plant characteristics, and soil physico-chemical properties, were reported using Spearman correlation coefficients and corresponding p-values, and visualised using a heatmap.

3. Results

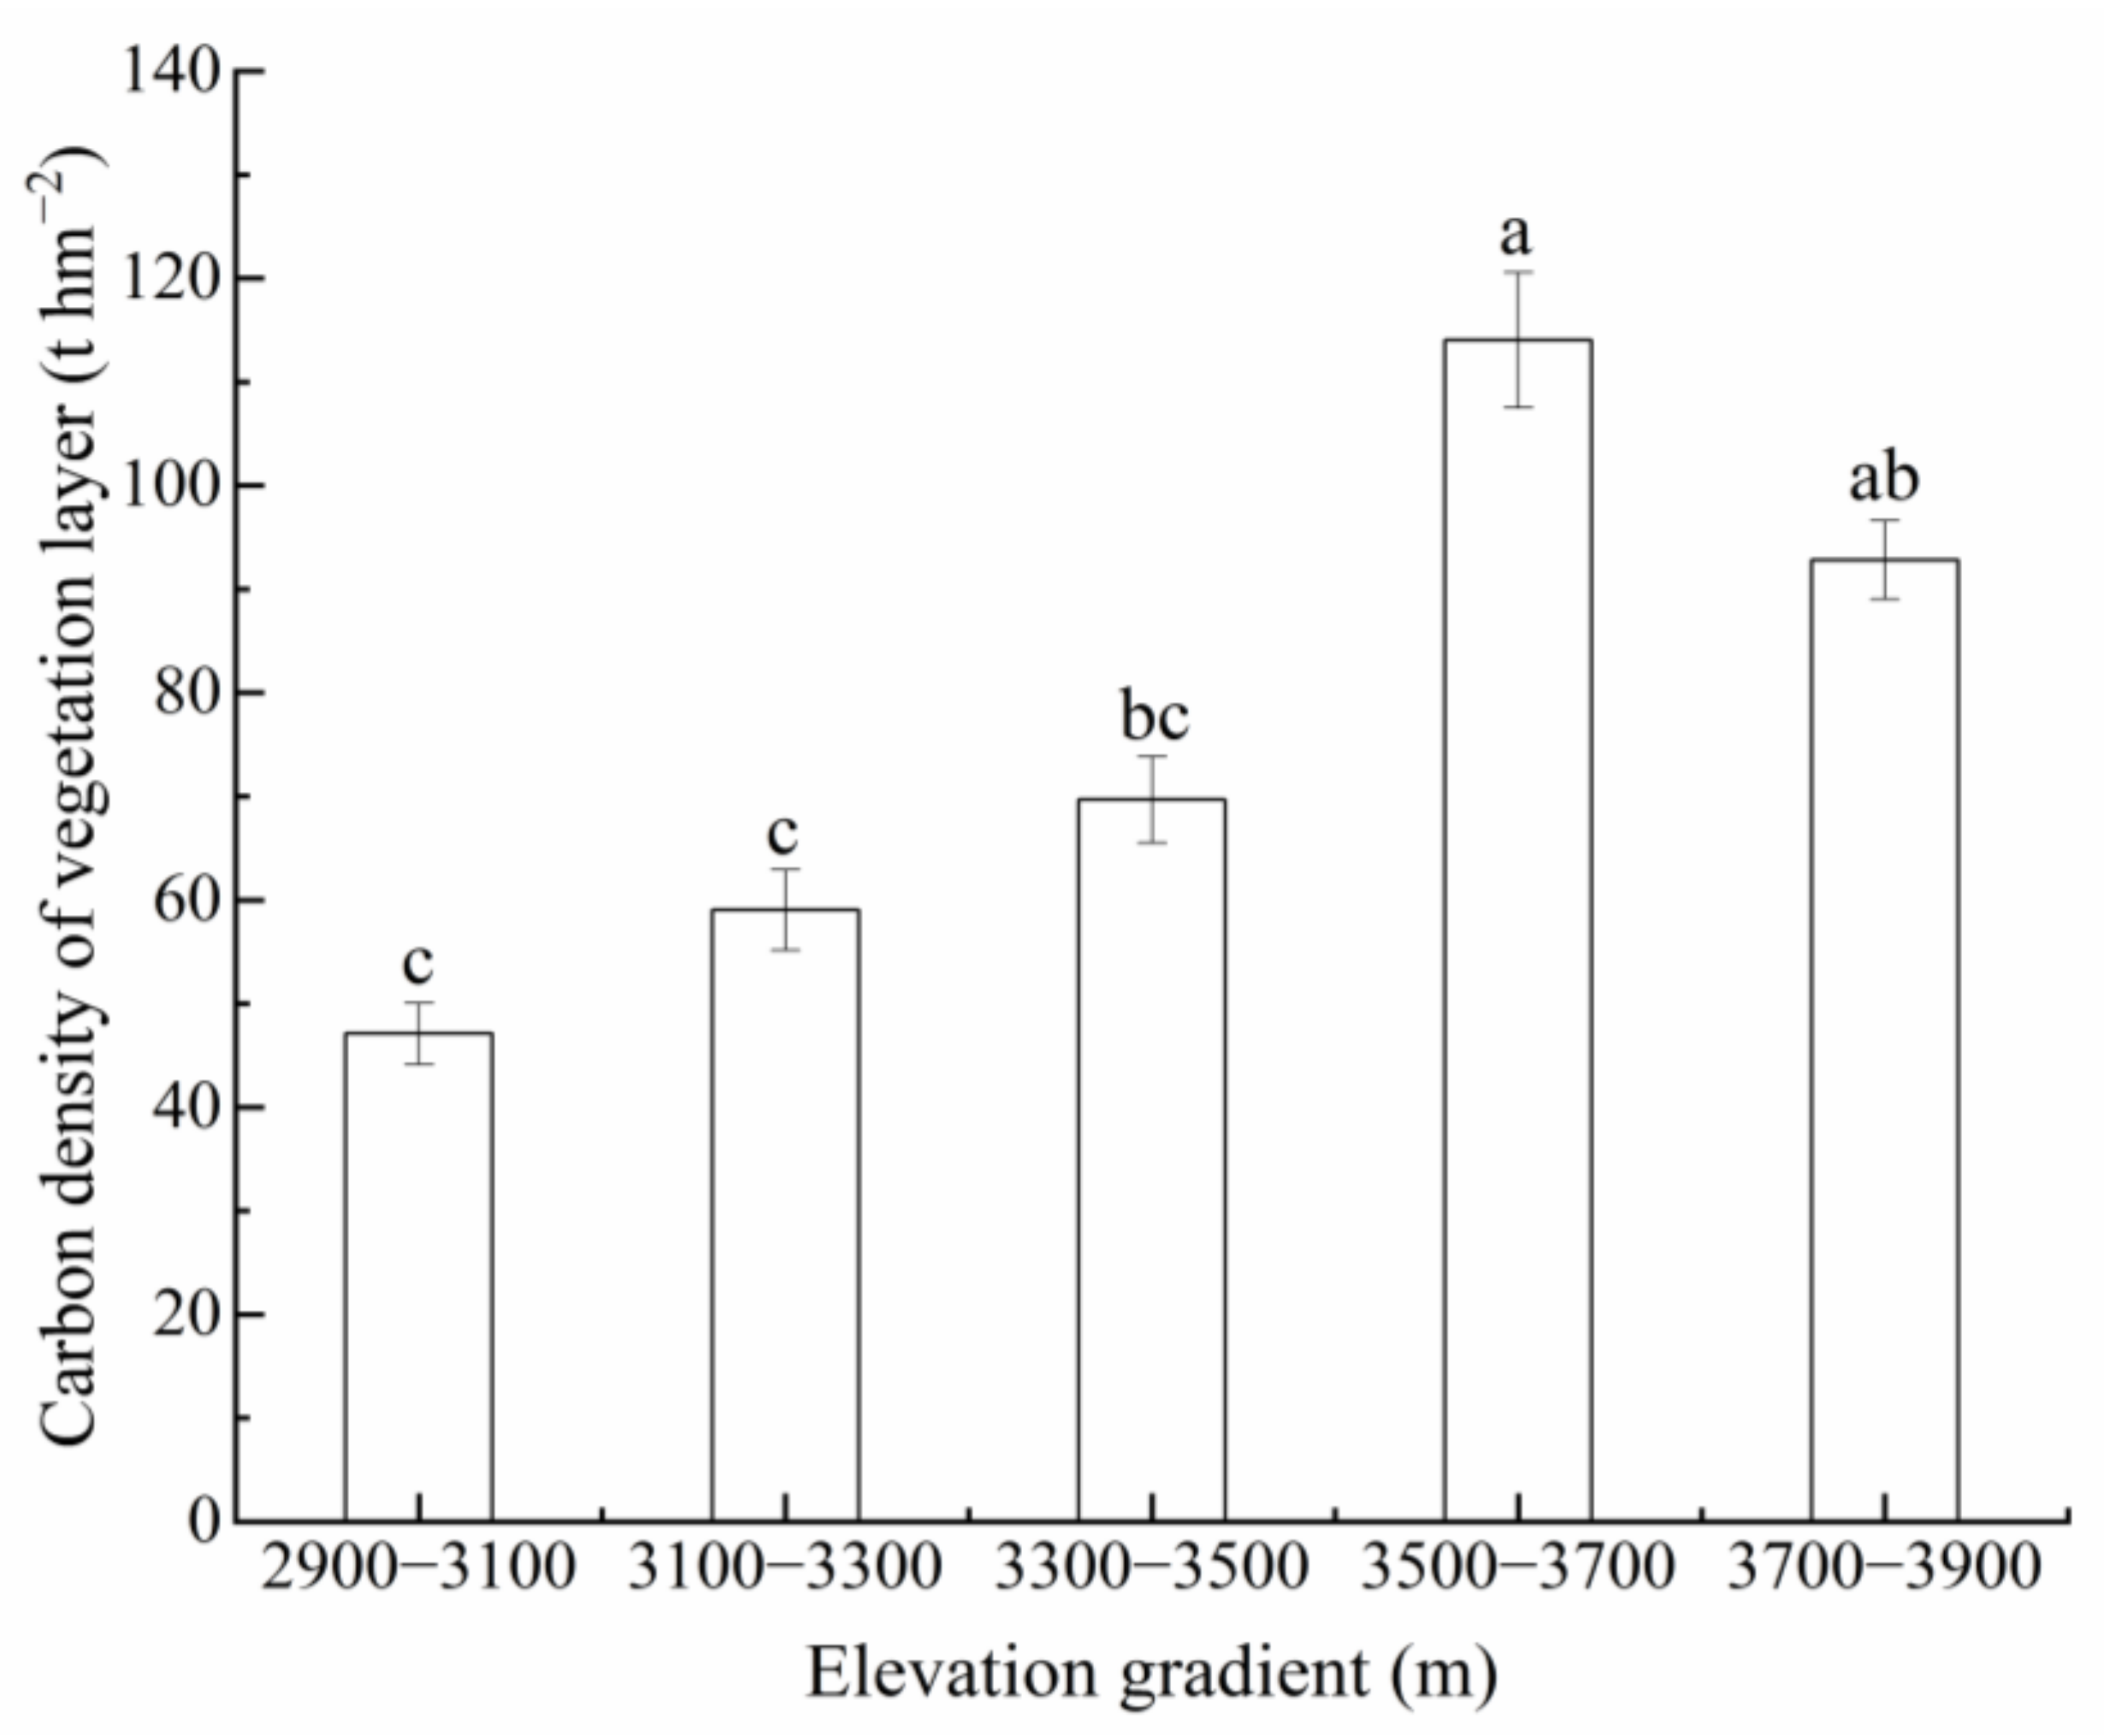
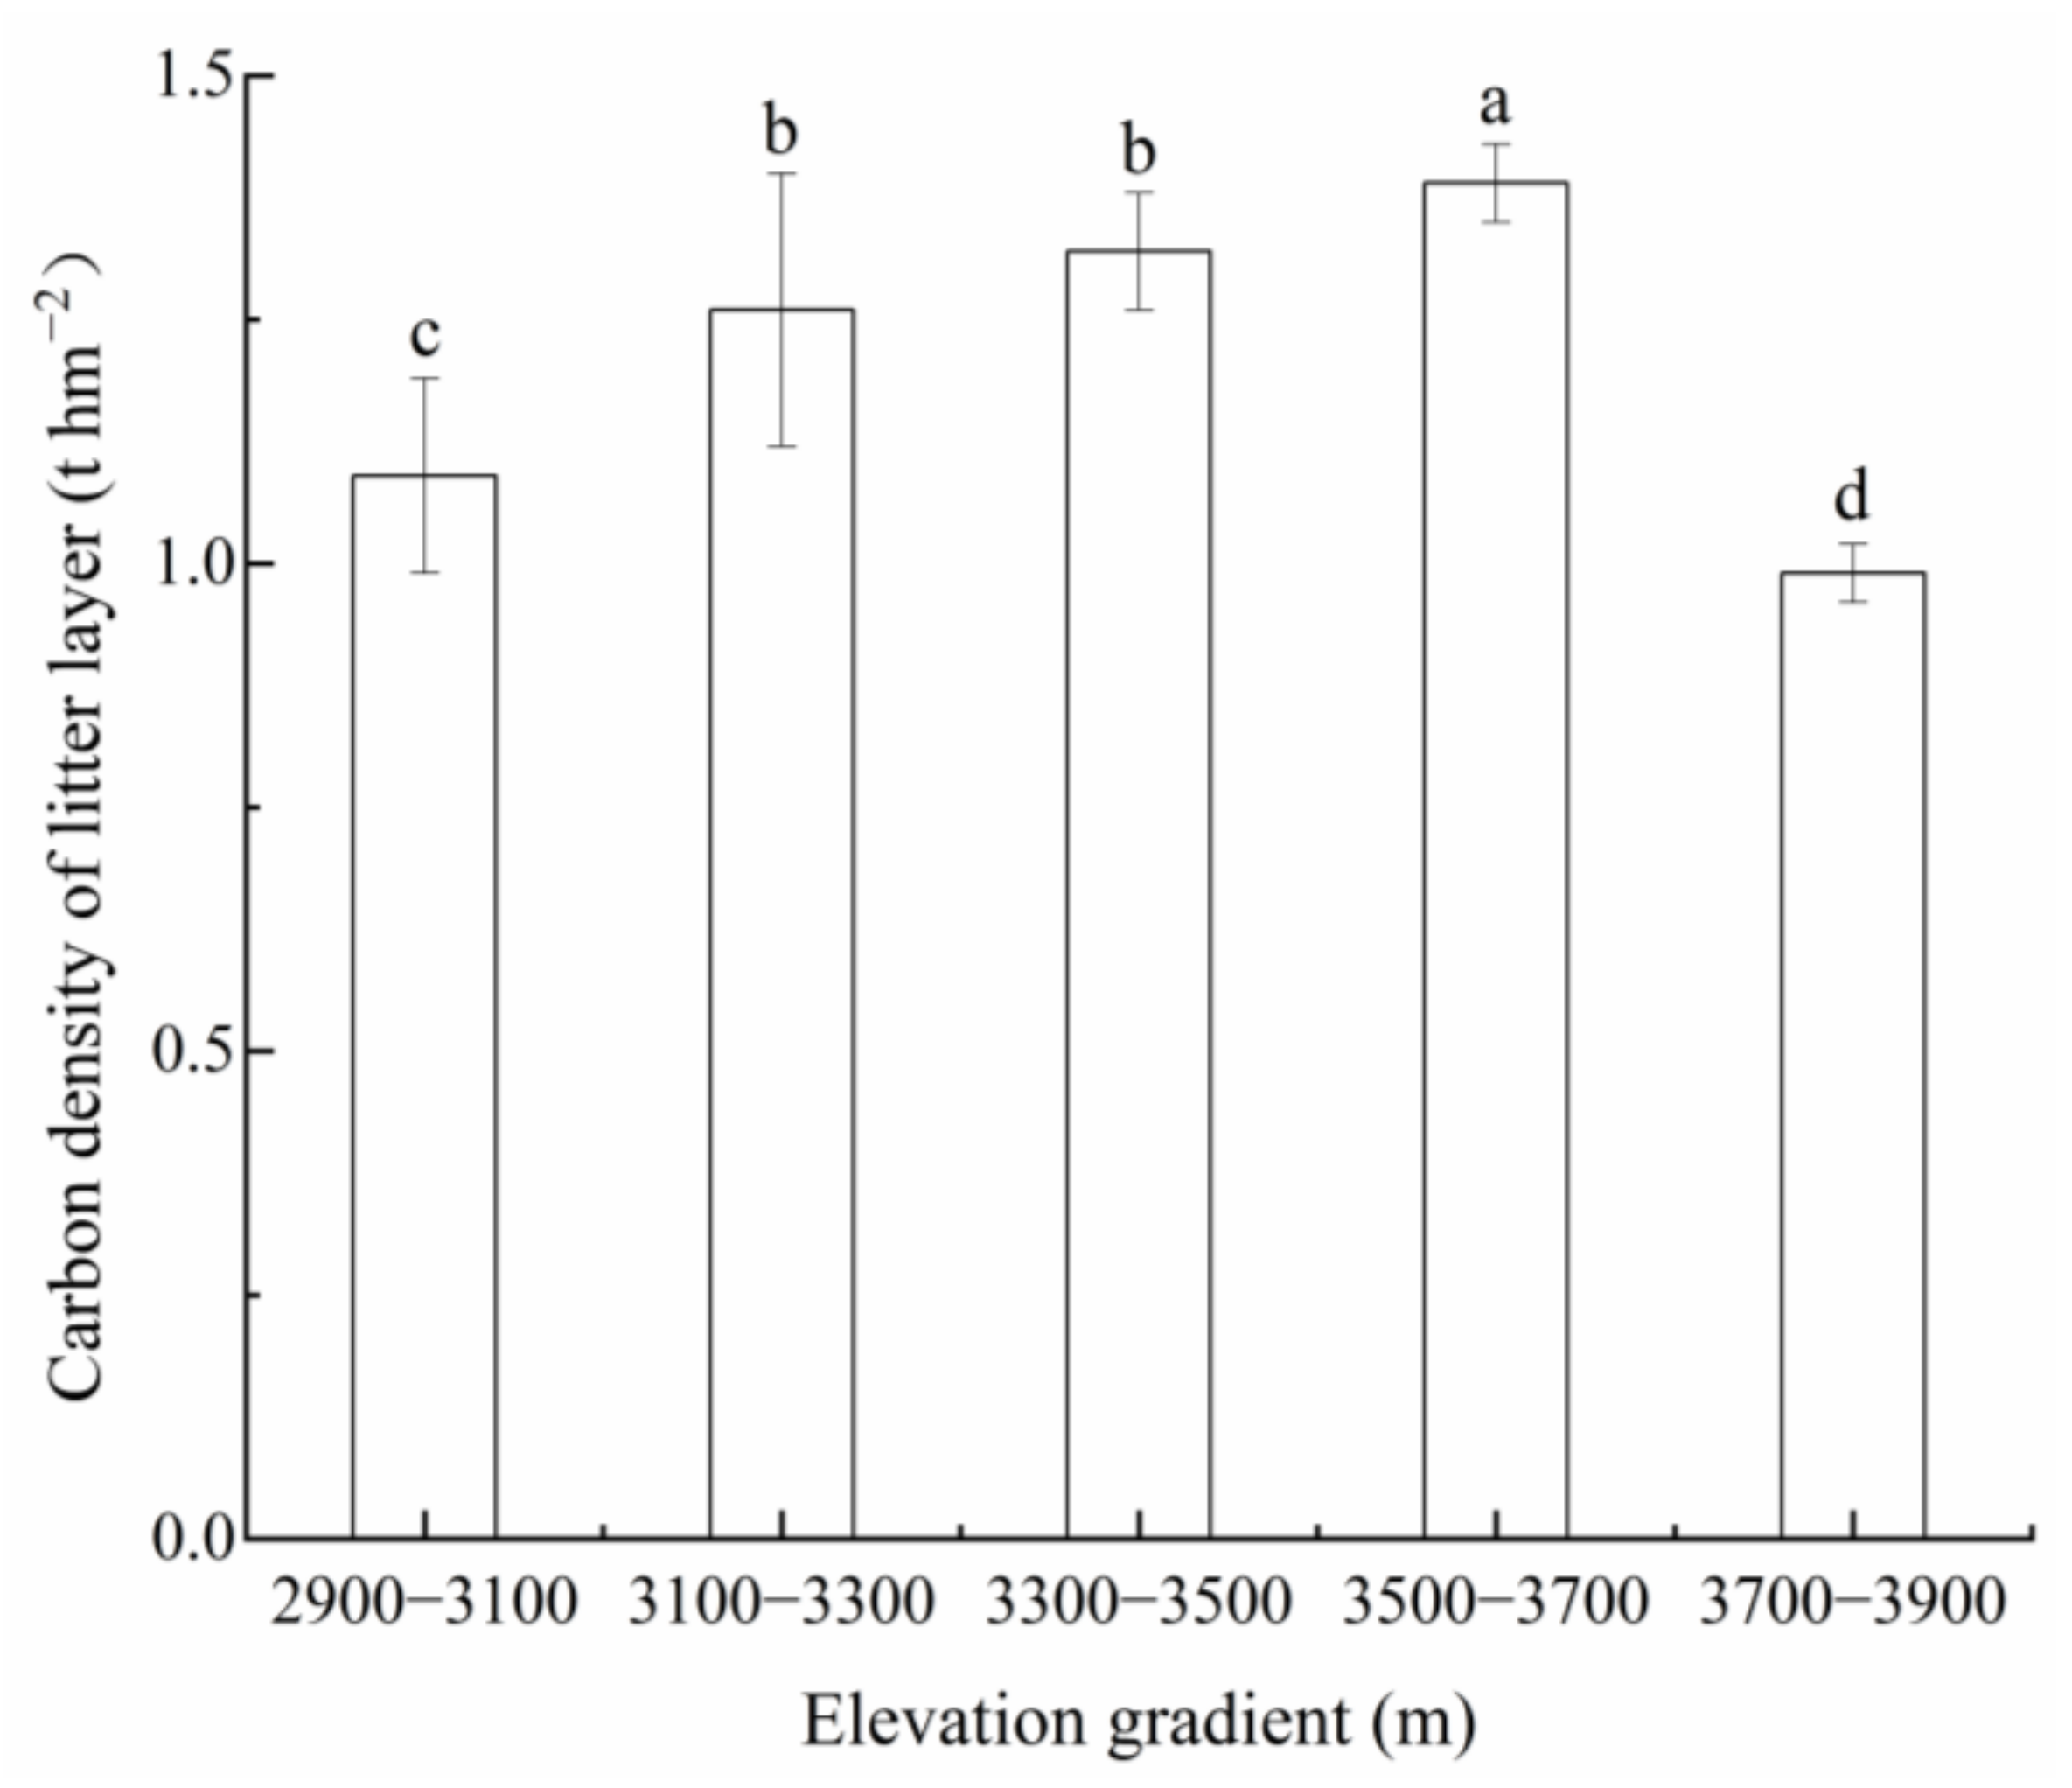
3.1. CD of Vegetation and Litter Layers

The average biomass of the vegetation layer in the Przewalski’s juniper forest study site was 170.07 t hm−2, with arboreal, shrub, and herbaceous layers accounting for 93.77%, 3.83%, and 2.40% of the total biomass, respectively (Table 2). The biomass initially increased with an increasing elevation, and then levelled off at the upper elevations, reaching a maximum at 3500–3700 m a.s.l., which is significantly (p < 0.05) different from that observed at 2900–3500 m a.s.l. (Table 2). With respect to the shrub layer, the biomass values significantly decreased (p < 0.05) with an increasing elevation; however, herbaceous and litter layers showed the same trend as the arboreal layer: the biomass increased to a maximum at 3500–3700 m a.s.l., and then decreased (Table 2).
The VCD is calculated as the product of the biomass and carbon coefficient; therefore, the change in the VCD with the elevation was consistent with the change in the biomass. The average CD of the vegetation and litter layers were 76.53 (maximum 114.02) and 1.21 (maximum 1.39) t hm−2, respectively, at 3500–3700 m a.s.l. (Figure 2 and Figure 3). The CD of the vegetation layer at 3500–3700 m a.s.l. was significantly (p < 0.05) higher than that at 2900–3500 m a.s.l. (Figure 2). Lastly, the CD of the litter layer at 3500–3700 m a.s.l. was significantly (p < 0.05) higher than that at the other elevations along the established gradient (Figure 3).

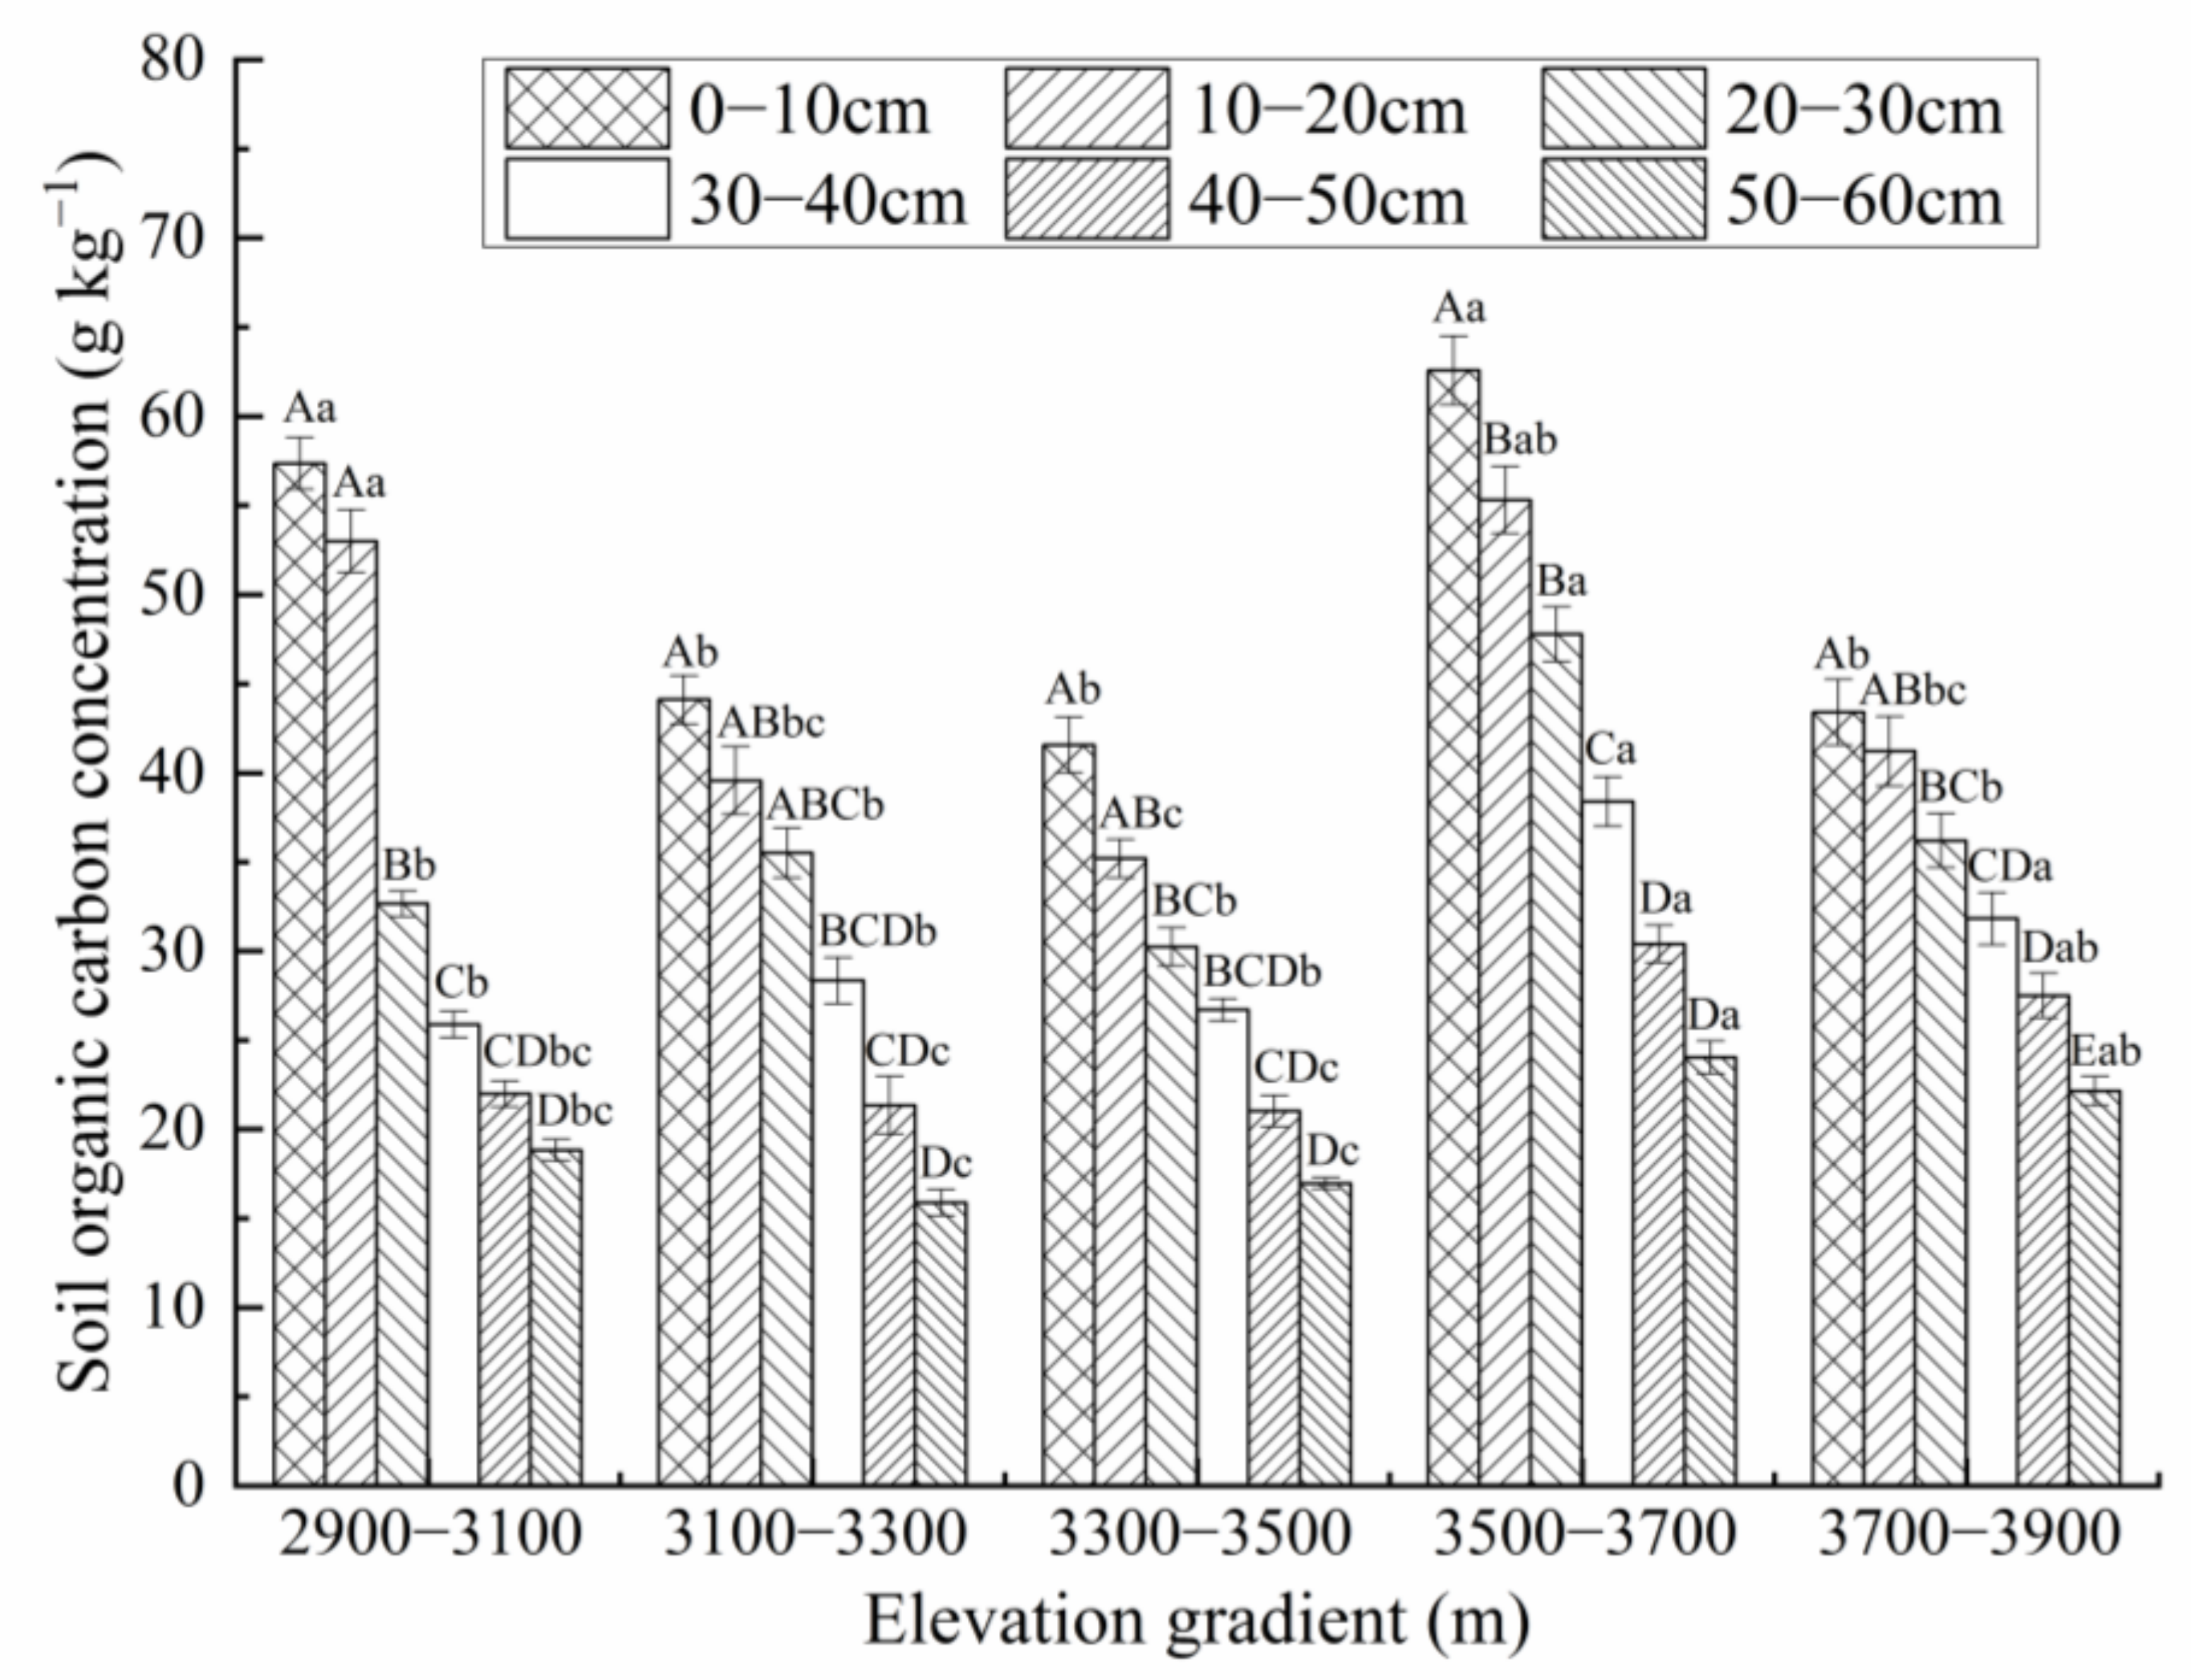
3.2. Distribution Characteristics of SOC Concentration along the Elevation Gradient

The SOC concentration in the Przewalski’s juniper forest ranged from 28.61 to 43.08 g kg−1, with an average of 34.23 g kg−1 (Figure 4). The SOC concentration of the same soil layer exhibited a wave-like trend along the gradient, by initially decreasing with elevation, followed by an increasing phase, peaking in each soil layer at 3500–3700 m a.s.l., and finally decreasing again (Figure 4). The SOC concentrations at 2900–3100 and 3500–3700 m a.s.l. were significantly (p < 0.05) higher than that at other elevations (Figure 4). The SOC concentration at the same elevation was found to gradually decrease with the soil depth, with significant (p < 0.05) differences among the soil layers (Figure 4).

3.3. Distribution Characteristics of SCD along the Elevation Gradient

The total average SCD was 183.81 t hm−2, with significant (p < 0.05) differences along the established elevation gradient (Table 3). The maximum and minimum values were 217.84 and 147.79 t hm−2, at 3500–3700 and 3300–3500 m a.s.l., respectively (Table 3). As the elevation increased, the SCD showed a gradual downward trend at 2900–3500 m a.s.l., followed by a sharp increase (approximately 1.47 times that, at 3300–3500 m a.s.l.) at 3500–3700 m a.s.l., and finally a significant downward trend at 3700–3900 m a.s.l., to 79.08% of the value at 3500–3700 m a.s.l.
The SCD of each soil layer first decreased, then increased, and finally decreased significantly (p < 0.05), as the elevation increased. The maximum SCD in the 0–20 cm topsoil layer was observed at 2900–3100 m a.s.l., whereas the maximum value in the other soil layers was recorded at 3500–3700 m a.s.l.

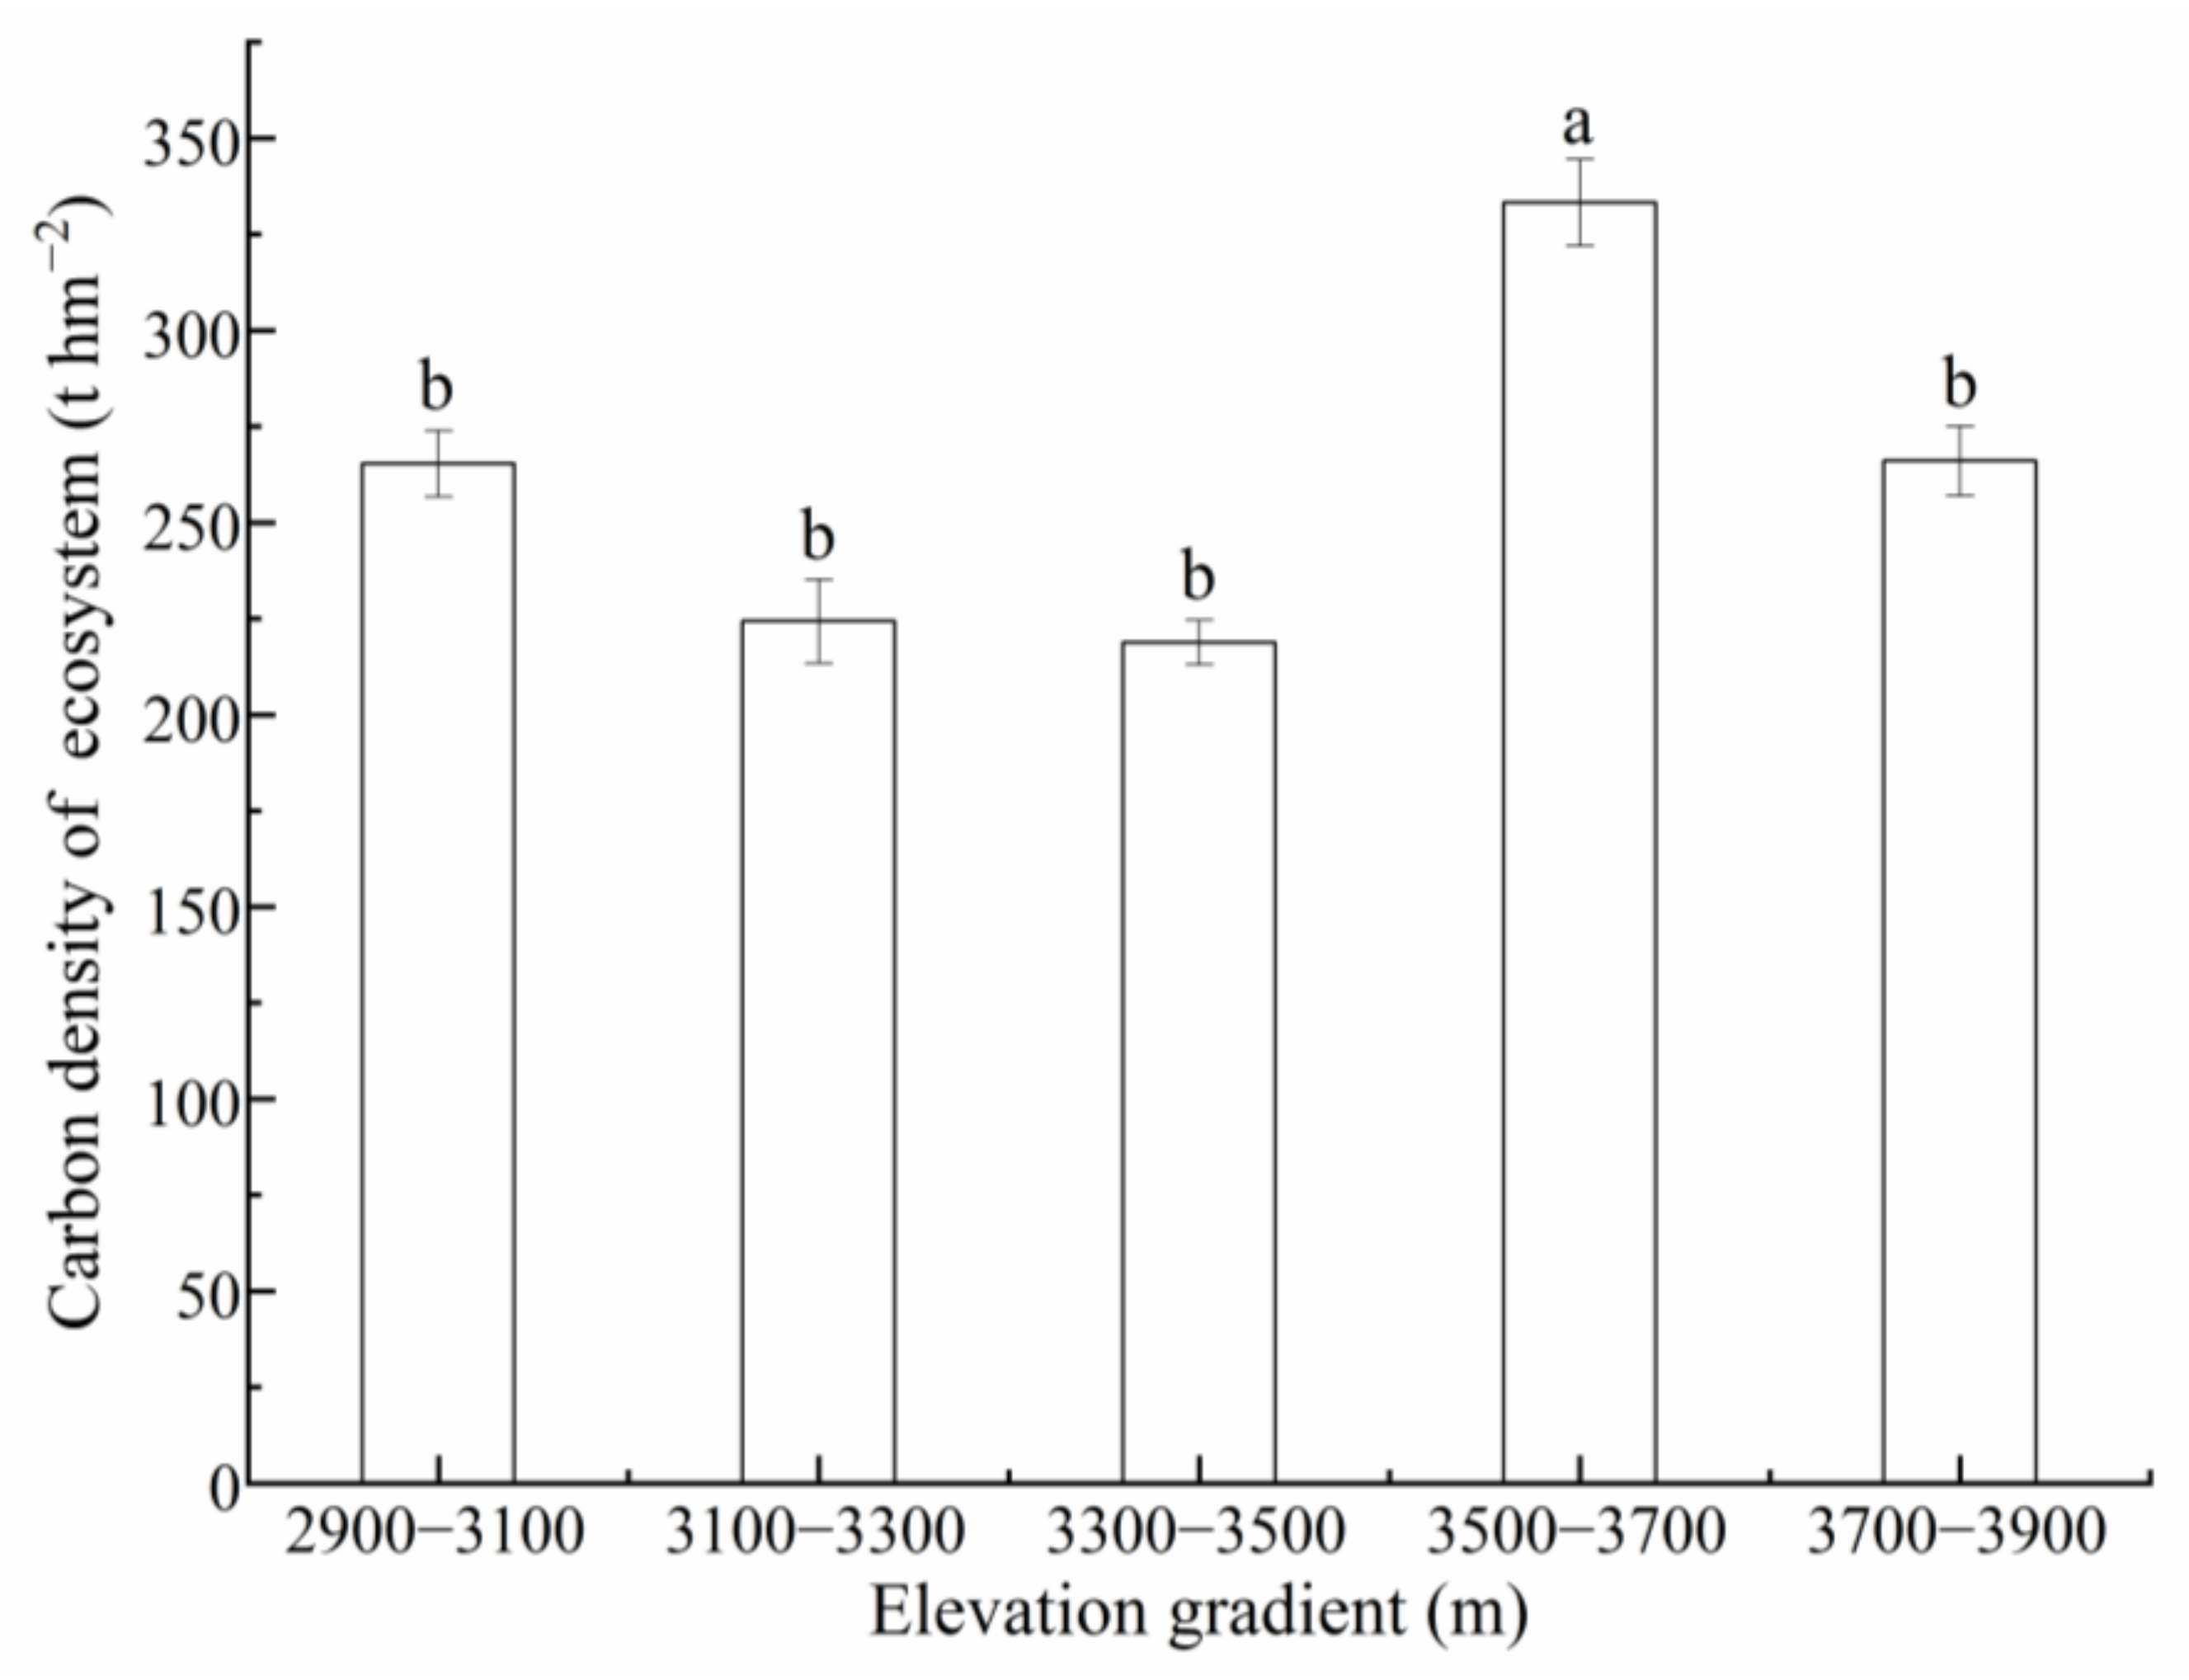
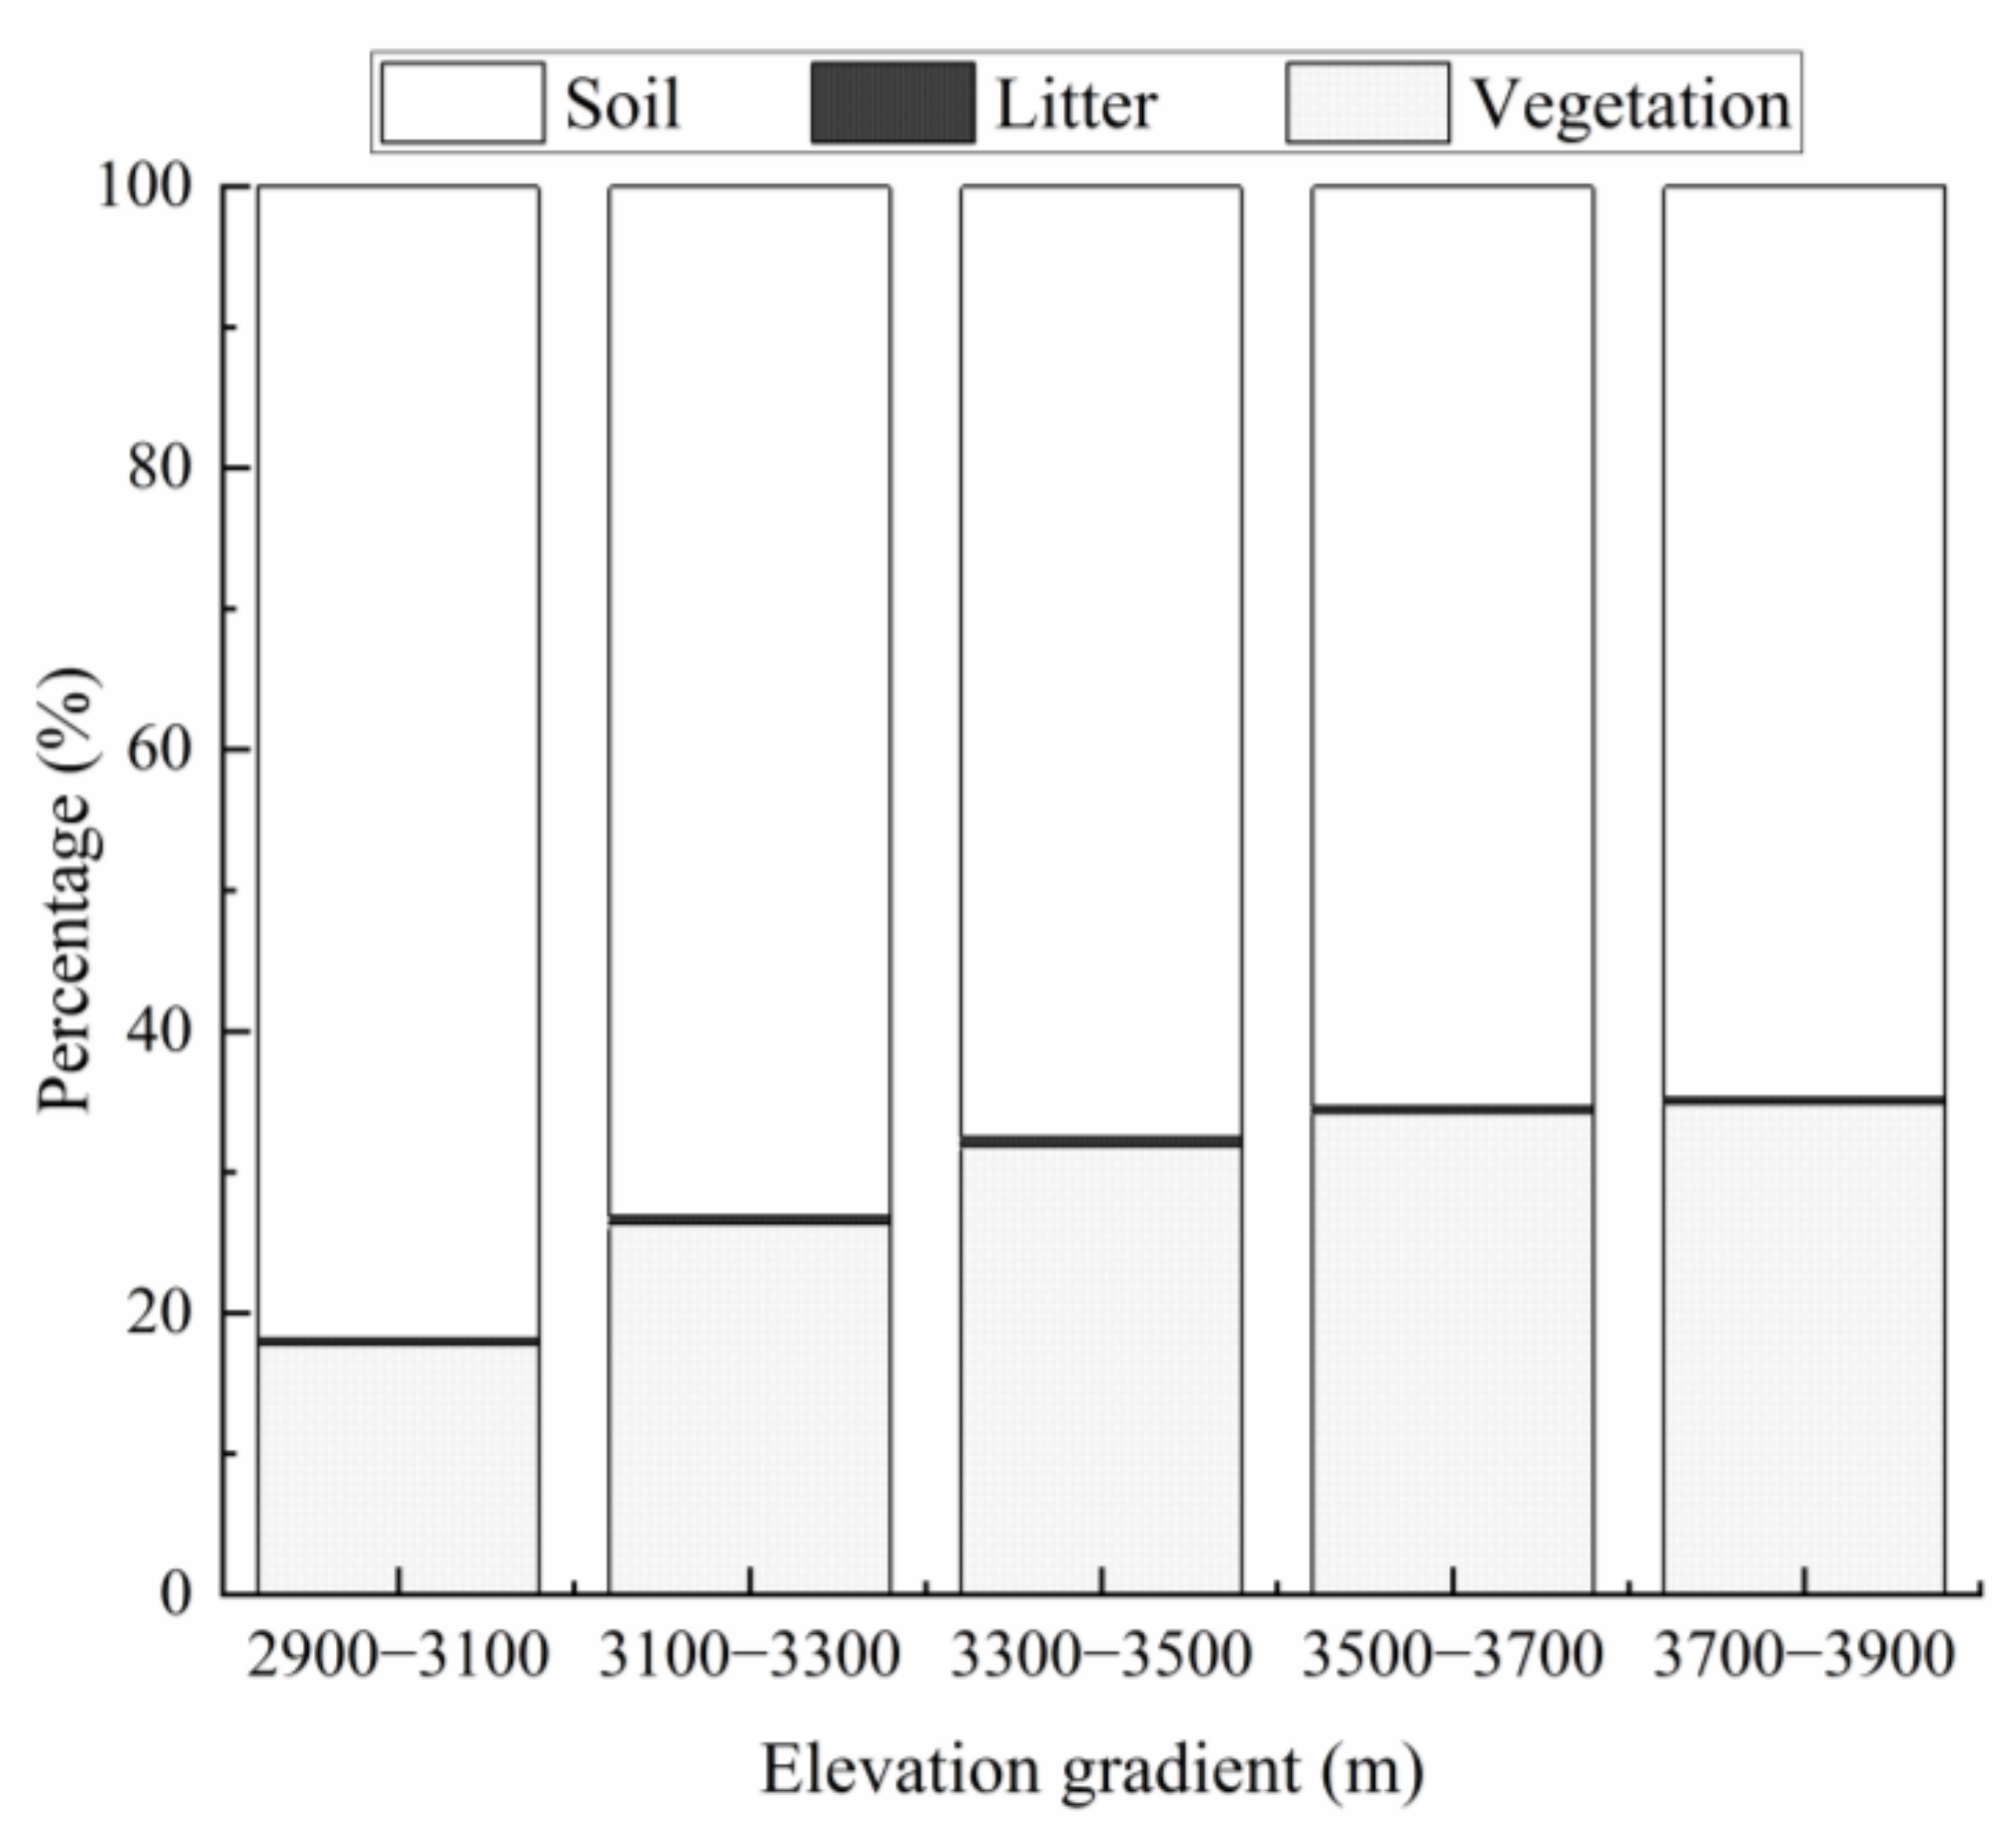
3.4. Distribution Characteristics of ECD along the Elevation Gradient

The average ECD of the Przewalski’s juniper forest was 261.56 t hm−2, of which the vegetation, litter, and soil layers accounted for 29.26%, 0.46%, and 70.28%, respectively (Figure 5 and Figure 6). The ECD initially decreased, then increased, and, it finally decreased again as the elevation increased (Figure 5). The minimum value was reached following a gradual decrease from 2900 to 3500 m a.s.l., followed by a significant (p < 0.05) increase to 333.25 t hm−2 at 3500–3700 m a.s.l., and, finally, a significant (p < 0.05) decrease to 266.06 t hm−2 at 3700–3900 m a.s.l. (Figure 5). The CD proportion in the vegetation and soil layers to the ECD shows that the CD in the vegetation layer gradually increased with the increasing elevation, as opposed to the soil layer (Figure 6). The CD proportion in vegetation, litter, and soil layers, ranged from 17.75 to 34.88%, 0.37 to 0.60%, and 64.74 to 81.84% among different elevation levels, respectively (Figure 6). Concomitantly, the CD proportion in the soil layer was higher than that in the vegetation and litter layers at the same elevation floor (Figure 6).

4. Discussion

4.1. Effect of Elevation on VCD in the Przewalski’s Juniper Forest

The average VCD of the Przewalski’s juniper forest in this study was 76.53 t hm−2, which is higher than the average levels previously estimated for all forests in China: 30.83 t hm−2 [37], 44.91 t hm−2 [38], and 41.32 t hm−2 [36]. This high average VCD can be explained by (1) relatively high AAP in this area (160–590 mm in Qinghai Province from 2010–2018) and (2) a large proportion (62.2%) of middle-aged and mature stands [39]. In the current study, the initial increase in the biomass and CD of the arboreal layer was followed by a decreasing trend with an increasing elevation, reaching the maximum at 3500–3700 m a.s.l. Given that Przewalski’s juniper is a heliophilous species, sufficient water and heat are conducive to its maximum potential growth and development [20]. As expected, the ambient temperature gradually decreased and precipitation increased, with increasing elevation. In this region, the hydrological factors at intermediate elevations are more suitable for the growth of Przewalski’s juniper [40]. In contrast, habitat conditions at the upper and lower limits of the elevation range of Przewalski’s juniper distribution are poor; here, the water and heat conditions are suboptimal, resulting in growth inhibition [40]. We found that the VCD had a significant and positive correlation with the elevation, AAP, basal area at the breast height (BAH), SOC, and the ratio of SOC to TN (C/N) (p < 0.01), and a significant negative correlation with the AAT and SBD (p < 0.05; Figure 7). These findings indicate that, in addition to the indicators related to the growth characteristics of the stand itself, various external conditions, including light, temperature, and soil nutrients, are key factors that affect the CD of the stand [40,41]. Furthermore, the intermediate temperature, moderately high light intensity, and heavy precipitation in intermediate elevation areas, are conducive to the accumulation of CD in the arboreal layer of the Przewalski’s juniper forest, and soil conditions are not restrictive toward the growth of Przewalski’s juniper. In the future, with climate change, the growth limit of Przewalski’s juniper may further increase its range and advantages at high elevations [42], leading to a sustained increase in the biomass of the vegetation layer, and resulting in a potential increase in local carbon sequestration [15,43].

4.2. Effect of Elevation on SCD in the Przewalski’s Juniper Forest

The average SOC concentration of the Przewalski’s juniper forest was 34.23 g kg−1, with a range of 28.61–43.08 g kg−1. According to the literature [44], the SOC concentration primarily depends on the input and decomposition rates of organic matter, with the input related to climatic conditions, soil water and nutrients, return amount of vegetation residues, and anthropogenic disturbance. In this study, the SOC concentration was significantly and positively correlated with the soil total nitrogen, and the organic matter decomposition rate was related to the microbial population, soil temperature, and moisture [33,45]. In addition, the SOC concentration decreased with increasing soil depth, most likely because the SOC originated from the surface litter, and the soil temperature, moisture, and microbial activity, gradually decreased with the soil depth [46].
The average SCD in the Przewalski’s juniper forest was 183.81 t hm−2, which is considerably higher than the average SCD of forests across China, which is 122.72 t hm−2 [32], thereby indicating a great capacity for soil carbon sequestration in this region. Additionally, the SCD in forest ecosystems increases with increasing elevation [47,48]. Notably, the inflection points in the current study occurred in the range of 3500–3700 m a.s.l., indicating that organic carbon in this range highly responded to an elevation increase. This was caused by anthropogenic disturbances, such as logging and grazing in low-elevation areas, while tree felling reduces organic carbon storage in the soil. In contrast, as human activities decrease, humidity increases [15], and the growth of forest trees is promoted at high elevations. Thus, the number of litter reserves increases [49], facilitating the accumulation of soil organic matter. In addition, the high-altitude area is effective at accumulating organic carbon, owing to its low temperatures, increased soil moisture, decreased soil microbial activity [40], and low decomposition rate of soil organic matter [32].

4.3. ECD of the Przewalski’s Juniper Forest along the Elevation Gradient

The average ECD of the Przewalski’s juniper forest in this study was 261.56 t hm−2, which is slightly higher than that of forest ecosystems, generally, in China (258.83 t hm−2) [50]. The CD of the vegetation, litter, and soil layers, accounted for 29.26%, 0.46%, and 70.28% of the average ECD, respectively; these results further confirm that the soil layer is the most important carbon pool in forest ecosystems, as previously reported [51]. The ECD was significantly and positively correlated with the elevation, AAP, BAH, SOC, C/N, VCD, and SCD (p < 0.05). In contrast, it was significantly (p < 0.05) and negatively correlated with the AAT and SBD (Figure 7), thereby indicating that hydrothermal conditions, vegetation growth, and soil properties, were combined to determine the size of the organic carbon pool in the Przewalski’s juniper forest under study. Significant elevation effects on the forest CD may be partly related to anthropogenic disturbances [39]. Notably, human activities decrease with the elevation, while the carbon accumulation in the forest ecosystems, increase. Accordingly, the forest CD in the current study tends to increase at 2900–3700 m a.s.l.

5. Conclusions

The distribution characteristics of the VCD and LCD in the vertical space of the Przewalski’s juniper forest were the same, as both initially increased, and then decreased with increasing elevation. In contrast, the SCD decreased, then increased, and finally decreased at high elevations. The optimal elevational range for the growth of the Przewalski’s juniper forest was 3500–3700 m a.s.l., where vegetation, litter, and soil layers accounted for 29.26%, 0.46%, and 70.28% of the ECD, respectively, indicating that SCD remains the most important carbon pool in forest ecosystem. Furthermore, we found that the VCD and ECD were significantly and positively correlated with elevation and AAP (p < 0.05). A missing fraction of carbon not accounted for in this study was the dead standing and fallen wood; therefore, a more comprehensive and accurate assessment of ECD in the Przewalski’s juniper forest is required in future studies. The upper elevational limit of Przewalski’s juniper is evidence that the ecological dominance of this tree species will likely increase under future global climate change trends, leading to an increasing vegetation biomass that will benefit total ecosystem carbon sequestration. This study provides an enhanced understanding of not only the spatial patterns of carbon pools in the forest ecosystem of the QTP, but also the potential paths of the carbon cycle with climate change in high-elevation and cold regions, which is crucial for the sustainability of regional and even global terrestrial ecosystems.

Author Contributions

Conceptualization, Z.D. and L.H.; investigation, Q.R.; data curation, Z.D.; methodology, Z.D.; software, Q.R.; writing—original draft preparation, Z.D.; writing—review and editing, L.H. All authors have read and agreed to the published version of the manuscript.

Funding

This research was funded by Special Project of Natural Forest Protection Program in Qinghai (K4030218362).

Institutional Review Board Statement

Not applicable.

Informed Consent Statement

Not applicable.

Data Availability Statement

The data presented in this study are available on request from the corresponding author.

Acknowledgments

We would like to thank the staff of the Forestry Bureau of these counties: Dulan (DL), Huzhu (HZ), Zeku (ZK), Qilian (QL), Delingha (DLH), and Xinghai (XH) in Qinghai Province, for their assistance during the sampling process.

Conflicts of Interest

The authors declare no conflict of interest. The funders had no role in the design of the study; in the collection, analyses, or interpretation of data; in the writing of the manuscript; or in the decision to publish the results.

References

  1. Pan, Y.D.; Birdsey, R.A.; Fang, J.Y.; Houghton, R.; Kauppi, P.E.; Kurz, W.A.; Phillips, O.L.; Shvidenko, A.; Lewis, S.L.; Canadell, J.G.; et al. A large and persistent carbon sink in the world’s forests. Science 2011, 333, 988–993. [Google Scholar] [CrossRef] [PubMed] [Green Version]
  2. FAO. Global Forest Resources Assessment 2020, Main Report; FAO: Rome, Italy, 2020. [Google Scholar]
  3. Yin, Y.H.; Ma, D.Y.; Wu, S.H. Climate change risk to forests in China associated with warming. Sci. Rep. 2018, 8, 493. [Google Scholar] [CrossRef] [PubMed] [Green Version]
  4. Chen, H.; Ju, P.J.; Zhu, Q.A.; Xu, X.L.; Wu, N.; Gao, Y.H.; Feng, X.J.; Tian, J.Q.; Niu, S.L.; Zhang, Y.J.; et al. Carbon and nitrogen cycling on the Qinghai-Tibetan Plateau. Nat. Rev. Earth Env. 2022, 3, 701–716. [Google Scholar] [CrossRef]
  5. Zinn, Y.L.; Andrade, A.B.; Araujo, M.A.; Lal, R. Soil organic carbon retention more affected by altitude than texture in a forested mountain range in Brazil. Soil Res. 2018, 56, 284–295. [Google Scholar] [CrossRef]
  6. Fawzy, S.; Osman, A.I.; Doran, J.; Rooney, D.W. Strategies for mitigation of climate change: A review. Environ. Chem. Lett. 2020, 18, 2069–2094. [Google Scholar] [CrossRef]
  7. Ni, X.; Guo, W.; Li, X.; Li, S. Heterogeneity of Increases in Net Primary Production under Intensified Human Activity and Climate Variability on the Loess Plateau of China. Remote Sens. 2022, 14, 4706. [Google Scholar] [CrossRef]
  8. Wu, T.H.; Ma, W.S.; Wu, X.D.; Li, R.; Qiao, Y.P.; Li, X.F.; Yue, G.Y.; Zhu, X.F.; Ni, J. Weakening of carbon sink on the Qinghai-Tibet Plateau. Geoderma 2022, 412, 115707. [Google Scholar] [CrossRef]
  9. Jiang, L.; Chen, H.; Zhu, Q.A.; Yang, Y.Z.; Li, M.X.; Peng, C.H.; Zhu, D.; He, Y.X. Assessment of frozen ground organic carbon pool on the Qinghai-Tibet Plateau. J. Soil. Sediment. 2019, 19, 128–139. [Google Scholar] [CrossRef]
  10. Wei, P.J.; Chen, S.Y.; Wu, M.H.; Jia, Y.L.; Xu, H.J.; Liu, D.M. Increased Ecosystem Carbon Storage between 2001 and 2019 in the Northeastern Margin of the Qinghai-Tibet Plateau. Remote Sens. 2021, 13, 3986. [Google Scholar] [CrossRef]
  11. Kučerík, J.; Tokarski, D.; Demyan, M.S.; Merbach, I.; Siewert, C. Linking soil organic matter thermal stability with contents of clay, bound water, organic carbon and nitrogen. Geoderma 2018, 316, 38–46. [Google Scholar] [CrossRef]
  12. Jia, Y.F.; Kuzyakov, Y.; Wang, G.A.; Tan, W.B.; Zhu, B.; Feng, X.J. Temperature sensitivity of decomposition of soil organic matter fractions increases with their turnover time. Land Degrad. Dev. 2020, 31, 632–645. [Google Scholar] [CrossRef]
  13. Gaston, K.J. Global patterns in biodiversity. Nature 2000, 405, 220–226. [Google Scholar] [CrossRef] [PubMed]
  14. Nie, X.Q.; Yang, L.C.; Xiong, F.; Li, C.B.; Fan, L.; Zhou, G.Y. Aboveground biomass of the alpine shrub ecosystems in Three-River Source Region of the Tibetan Plateau. J. Mt. Sci.-Engl. 2018, 15, 357–363. [Google Scholar] [CrossRef]
  15. Shi, S.L.; Liu, G.H.; Li, Z.S.; Ye, X. Elevation-dependent growth trends of forests as affected by climate warming in the southeastern Tibetan Plateau. Forest Ecol. Manag. 2021, 498, 119551. [Google Scholar] [CrossRef]
  16. Kumar, M.; Kumar, A.; Kumar, R.; Konsam, B.; Pala, N.A.; Bhat, J.A. Carbon stock potential in Pinus roxburghii forests of Indian Himalayan regions. Environ. Dev. Sustain. 2021, 23, 12463–12478. [Google Scholar] [CrossRef]
  17. Sheikh, M.A.; Kumar, M.; Todaria, N.P.; Bhat, J.A.; Kumar, A.; Pandey, R. Contribution of Cedrus deodara forests for climate mitigation along altitudinal gradient in Garhwal Himalaya, India. Mitig. Adapt. Strat. Gl. 2021, 26, 5. [Google Scholar] [CrossRef]
  18. Poudel, A.; Sasaki, N.; Abe, I. Assessment of carbon stocks in oak forests along the altitudinal gradient: A case study in the Panchase Conservation Area in Nepal. Glob. Ecol. Conserv. 2020, 23, e1171. [Google Scholar] [CrossRef]
  19. Lu, S.B.; Xu, Y.; Fu, X.P.; Xiao, H.; Ding, W.; Zhang, Y.J. Patterns and drivers of soil respiration and vegetation at different altitudes in southern China. Appl. Ecol. Env. Res. 2019, 17, 3097–3106. [Google Scholar] [CrossRef]
  20. Zhang, J.Z.; Gou, X.H.; Alexander, M.R.; Xia, J.Q.; Wang, F.; Zhang, F.; Man, Z.H.; Pederson, N. Drought limits wood production of Juniperus przewalskii even as growing seasons lengthens in a cold and arid environment. Catena 2021, 196, 104936. [Google Scholar] [CrossRef]
  21. Sun, J.; Zhan, T.Y.; Liu, M.; Zhang, Z.C.; Wang, Y.; Liu, S.L.; Wu, G.L.; Liu, G.H.; Tsunekawa, A. Verification of the biomass transfer hypothesis under moderate grazing across the Tibetan plateau: A meta-analysis. Plant Soil 2021, 458, 139–150. [Google Scholar] [CrossRef]
  22. Qiu, J. China: The third pole. Nature 2008, 454, 393–396. [Google Scholar] [CrossRef] [Green Version]
  23. Tao, J.; Zhang, Y.J.; Zhu, J.T.; Jiang, Y.B.; Zhang, X.Z.; Zhang, T.; Xi, Y. Elevation-dependent temperature change in the Qinghai–Xizang Plateau grassland during the past decade. Theor. Appl. Climatol. 2013, 117, 61–71. [Google Scholar] [CrossRef]
  24. Kuang, X.; Jiao, J.J. Review on climate change on the Tibetan Plateau during the last half century. J. Geophys. Res-Atmos. 2016, 121, 3979–4007. [Google Scholar] [CrossRef] [Green Version]
  25. Sun, J.; Liu, B.Y.; You, Y.; Li, W.P.; Liu, M.; Shang, H.; He, J.S. Solar radiation regulates the leaf nitrogen and phosphorus stoichiometry across alpine meadows of the Tibetan Plateau. Agr. Forest Meteorol. 2019, 271, 92–101. [Google Scholar] [CrossRef]
  26. Schurman, J.S.; Babst, F.; Bjorklund, J.; Rydval, M.; Bace, R.; Cada, V.; Janda, P.; Mikolas, M.; Saulnier, M.; Trotsiuk, V.; et al. The climatic drivers of primary Picea forest growth along the Carpathian arc are changing under rising temperatures. Glob. Chang. Biol. 2019, 25, 3136–3150. [Google Scholar] [CrossRef]
  27. Zhou, T.C.; Liu, M.; Sun, J.; Li, Y.R.; Shi, P.; Tsunekawa, A.; Zhou, H.K.; Yi, S.H.; Xue, X. The patterns and mechanisms of precipitation use efficiency in alpine grasslands on the Tibetan Plateau. Agric. Ecosyst. Environ. 2020, 292, 106833. [Google Scholar] [CrossRef]
  28. Zhang, F.; Chen, Q.M.; Gou, X.H.; Du, M.M.; Wang, F.; Zhang, J.Z. Climatic control on the growth and regeneration of Juniperus przewalskii at alpine treeline in the eastern Qilian Mountains, northwest China. Trees 2021, 35, 1085–1097. [Google Scholar] [CrossRef]
  29. Yang, B.; Sonechkin, D.M.; Datsenko, N.M.; Liu, J.J.; Qin, C. Establishment of a 4650-year-long eigenvalue chronology based on tree-ring cores from Qilian junipers (Juniperus przewalskii Kom.) in Western China. Dendrochronologia 2017, 46, 56–66. [Google Scholar] [CrossRef]
  30. Gao, L.L.; Gou, X.H.; Deng, Y.; Yang, M.X.; Zhao, Z.Q.; Cao, Z.Y. Dendroclimatic response of Picea crassifolia along an altitudinal gradient in the eastern Qilian mountains, northwest China. Arct. Antarct. Alp. Res. 2013, 45, 491–499. [Google Scholar] [CrossRef]
  31. Zhang, J.Z.; Gou, X.H.; Manzanedo, R.D.; Zhang, F.; Pederson, N. Cambial phenology and xylogenesis of Juniperus przewalskii over a climatic gradient is influenced by both temperature and drought. Agric. For. Meteorol. 2018, 260–261, 165–175. [Google Scholar] [CrossRef]
  32. Yuan, J.; Zhang, Y.; You, C.M.; Cao, R.; Tan, B.; Li, H.; Jiang, Y.R.; Yang, W.Q. The three-dimension zonal pattern of soil organic carbon density in China’s forests. Catena 2021, 196, 104950. [Google Scholar] [CrossRef]
  33. Hou, L.; Hou, S.J. How long should the fully hillside-closed forest protection be implemented on the Loess Plateau, Shaanxi, China? PeerJ 2017, 5, e3764. [Google Scholar] [CrossRef] [PubMed] [Green Version]
  34. Wang, J.Y.; Ju, K.J.; Fu, H.E.; Chang, X.X.; Song, C.F.; He, H.Y. Study on biomass of water conservation forest on north slope of Qilian Mountains. J. Fujian Coll. For. 1997, 18, 319–323. [Google Scholar] [CrossRef]
  35. Johnson, W.C.; Sharpe, D.M. The ratio of total to merchantable forest biomass and its application to the global carbon budget. Can. J. Forest Res. 1983, 13, 372–383. [Google Scholar] [CrossRef]
  36. Zhao, M.; Zhou, G.S. Carbon storage of forest vegetation in China and its relationship with climatic factors. Clim. Change 2006, 74, 175–189. [Google Scholar] [CrossRef]
  37. Tang, X.; Zhao, X.; Bai, Y.F.; Tang, Z.Y.; Wang, W.T.; Zhao, Y.C.; Wan, H.W.; Xie, Z.Q.; Shi, X.Z.; Wu, B.F.; et al. Carbon pools in China’s terrestrial ecosystems: New estimates based on an intensive field survey. Proc. Natl. Acad. Sci. USA 2018, 115, 4021–4026. [Google Scholar] [CrossRef] [Green Version]
  38. Fang, J.Y.; Chen, A.P.; Peng, C.H.; Zhao, S.Q.; Ci, L.J. Changes in forest biomass carbon storage in China between 1949 and 1998. Science 2001, 292, 2320–2322. [Google Scholar] [CrossRef]
  39. Huang, T.; Hao, J.T.; Du, Y.C.; Tian, C.C.; Zhang, J.; Wang, H.; Hou, L. Regeneration characteristics of three natural Juniperus forests in the Three-River Headwater Region of Qinghai Province, China. Chin. J. Appl. Ecol. 2022, 33, 297–303. [Google Scholar] [CrossRef]
  40. Zhang, J.Z.; Gou, X.H.; Pederson, N.; Zhang, F.; Niu, H.G.; Zhao, S.D.; Wang, F. Cambial phenology in Juniperus przewalskii along different altitudinal gradients in a cold and arid region. Tree Physiol. 2018, 38, 840–852. [Google Scholar] [CrossRef] [Green Version]
  41. Ren, P.; Rossi, S.; Gricar, J.; Liang, E.; Cufar, K. Is precipitation a trigger for the onset of xylogenesis in Juniperus przewalskii on the north-eastern Tibetan Plateau? Ann. Bot.-Lond. 2015, 115, 629–639. [Google Scholar] [CrossRef] [Green Version]
  42. Wei, Y.Q.; Lu, H.Y.; Wang, J.N.; Wang, X.F.; Sun, J. Dual influence of climate change and anthropogenic activities on the spatiotemporal vegetation dynamics over the Qinghai-Tibetan Plateau from 1981 to 2015. Earths Future 2022, 10, e2021EF002566. [Google Scholar] [CrossRef]
  43. Zhang, J.Z.; Gou, X.H.; Zhang, Y.X.; Lu, M.; Xu, X.Y.; Zhang, F.; Liu, W.H.; Gao, L.L. Forward modeling analyses of Qilian Juniper (Sabina przewalskii) growth in response to climate factors in different regions of the Qilian Mountains, northwestern China. Trees 2016, 30, 175–188. [Google Scholar] [CrossRef]
  44. Ma, Y.J.; Xie, T.; Li, X.Y. Spatial variation of soil organic carbon in the Qinghai Lake watershed, northeast Qinghai-Tibet Plateau. Catena 2022, 213, 106187. [Google Scholar] [CrossRef]
  45. Liu, X.; Cong, J.; Lu, H.; Xue, Y.D.; Wang, X.L.; Li, D.Q.; Zhang, Y.G. Community structure and elevational distribution pattern of soil Actinobacteria in alpine grasslands. Acta Ecol. Sin. 2017, 37, 213–218. [Google Scholar] [CrossRef]
  46. Davidson, E.A.; Trumbore, S.E.; Amundson, R. Soil warming and organic carbon content. Nature 2000, 408, 789–790. [Google Scholar] [CrossRef] [Green Version]
  47. Zhou, H.; Yan, Y.J.; Dai, Q.H.; He, Z.J.; Yi, X.S. Latitudinal and altitudinal patterns and influencing factors of soil humus carbon in the low-latitude plateau regions. Forests 2023, 14, 344. [Google Scholar] [CrossRef]
  48. Badía-Villas, D.; Girona-García, A. Soil humus changes with elevation in Scots pine stands of the Moncayo Massif (NE Spain). Appl. Soil Ecol. 2018, 123, 617–621. [Google Scholar] [CrossRef]
  49. Hou, L.; Sun, S.; Liang, L.Y.; Liang, G.; Jiang, L.X. Effects of selective thinning and residue removal on ground layer structure and diversity in a mixed pine-oak stand of the Qinling Mountains, China. Aust. J. Bot. 2017, 65, 485. [Google Scholar] [CrossRef]
  50. Zhou, Y.R.; Yu, Z.L.; Zhao, S.D. Carbon storage and budget of major Chinese forest types. Acta Phytoecol. Sin. 2000, 24, 518–522. [Google Scholar]
  51. Guan, J.H.; Deng, L.; Zhang, J.G.; He, Q.Y.; Shi, W.Y.; Li, G.Q.; Du, S. Soil organic carbon density and its driving factors in forest ecosystems across a northwestern province in China. Geoderma 2019, 352, 1–12. [Google Scholar] [CrossRef]
Figure 1. Location of the study sites: ZK, Zeku County (Huangnan Tibetan Autonomous Prefecture); QL, Qilian County (Haibei Tibetan Autonomous Prefecture); XH, Xinghai County (Hainan Tibetan Autonomous Prefecture); DL, Dulan County (Haixi Mongolian and Tibetan Autonomous Prefecture); DLH, Delingha County (Haixi Mongolian and Tibetan Autonomous Prefecture); and HZ, Huzhu Tu Autonomous County (Haidong City).
Sustainability 15 06163 g001
Figure 2. Distribution of vegetation carbon density of Przewalski’s juniper forest along the elevation gradient. Different lowercase letters represent the significant differences (p < 0.05), and vice versa.
Sustainability 15 06163 g002
Figure 3. Distribution of carbon density of litter layer of Przewalski’s juniper forest along the elevation gradient. Different lowercase letters represent the significant differences (p < 0.05), and vice versa.
Sustainability 15 06163 g003
Figure 4. Characteristics of SOC concentration in different soil depths along the elevation gradient. Different capital letters indicate significant differences (p < 0.05) among the different soil layers at the same elevation gradient. Different lowercase letters indicate significant differences (p < 0.05) among the different elevation gradient in the same soil layer, and vice versa.
Sustainability 15 06163 g004
Figure 5. Characteristics of carbon density of Przewalski’s juniper forest ecosystem along an elevation gradient. Different lowercase letters represent significant differences (p < 0.05) between the different elevation gradient, and vice versa.
Sustainability 15 06163 g005
Figure 6. Relative carbon density in the three ecosystem components (vegetation, litter, and soil) for Przewalski’s juniper forest.
Sustainability 15 06163 g006
Figure 7. Spearman correlations of CD versus environmental factors, plant characteristics, and soil physico-chemical properties. AAT, annual average temperature; AAP, annual average precipitation; SBD, soil bulk density; BAH, basal area at breast height; SOC, soil organic carbon concentration; TN, total nitrogen concentration; C/N, the ratio of SOC to TN; VCD, vegetation carbon density; LCD, litter carbon density; SCD, soil carbon density; ECD, ecosystem carbon density; and SCC, Spearman correlation coefficient.
Sustainability 15 06163 g007
Table 1. Basic characteristics of the sample plots in Przewalski’s juniper forest.
Sampling
Sites
Number of PlotsElevation (m)Slope (°)Canopy DensityAverage Tree Height (m)Average DBH (cm)AAT (℃)AAP (mm)
ZK332915–3535320.67.1220.32−1.33483.4
QL103170–3216270.510.5622.731.00420.0
XH223170–3851350.79.7239.251.71377.9
DL183730–3780300.57.4139.203.41179.1
DLH73520–3800360.67.6723.981.00420.0
HZ132940–3060280.67.2319.704.01502.5
Table 2. Distribution of the biomass of Przewalski’s juniper forest along the elevation gradient.
Biomass (t hm−2)Elevation Gradient (m)
2900–31003100–33003300–35003500–37003700–3900
Arboreal90.58 ± 2.65 b118.16 ± 3.58 b143.20 ± 4.90 b243.00 ± 8.32 a202.41 ± 6.78 a
Shrub10.40 ± 0.74 a8.84 ± 0.64 b7.05 ± 0.55 c5.44 ± 1.14 d0.84 ± 0.08 e
Herbaceous3.68 ± 0.20 c4.20 ± 0.29 b4.63 ± 0.14 a4.94 ± 0.15 a2.99 ± 1.06 d
Vegetation104.66 ± 6.25 c131.19 ± 8.16 c154.86 ± 9.71 bc253.38 ± 14.33 a206.24 ± 8.78 ab
Litter2.43 ± 0.10 c2.81 ± 0.14 b2.94 ± 0.06 b3.10 ± 0.04 a2.21 ± 0.03 d
Note: The data in the table are mean ± standard deviation, and different letters in each row indicate significant differences (p < 0.05) among the elevation gradient.
Table 3. Distribution characteristics of SCD (t hm−2) of Przewalski’s juniper forest along the elevation gradient.
Elevation Gradient (m)Soil Layer (cm)Total
0–1010–2020–3030–4040–5050–60
2900–310057.43 ± 1.38 a53.87 ± 1.66 a34.07 ± 0.83 ab27.46 ± 0.62 ab23.81 ± 0.72 ab20.51 ± 0.68 a217.15 ± 8.23 a
3100–330035.20 ± 1.62 c36.50 ± 1.71 bc32.55 ± 1.77 ab25.88 ± 0.70 b19.44 ± 0.94 b14.48 ± 0.48 c164.05 ± 4.67 b
3300–350033.92 ± 1.76 c29.59 ± 1.20 c26.01 ± 0.78 b23.62 ± 0.81 b19.15 ± 0.81 b15.50 ± 0.74 bc147.79 ± 7.18 b
3500–370047.87 ± 1.07 b45.32 ± 1.69 ab40.36 ± 1.56 a34.16 ± 1.24 a27.35 ± 0.96 a22.77 ± 0.91 a217.84 ± 9.76 a
3700–390034.66 ± 1.70 c34.46 ± 1.17 c31.12 ± 1.44 b27.80 ± 1.30 ab24.22 ± 0.72 ab20.00 ± 0.81 ab172.26 ± 11.05 b
Note: Different lowercase letters indicate significant differences (p < 0.05) among the different elevation gradients in the same soil layer, and vice versa.
Disclaimer/Publisher’s Note: The statements, opinions and data contained in all publications are solely those of the individual author(s) and contributor(s) and not of MDPI and/or the editor(s). MDPI and/or the editor(s) disclaim responsibility for any injury to people or property resulting from any ideas, methods, instructions or products referred to in the content.

