Abstract
This research proposes a decision framework that allows for the identification of the most suitable methods to construct stable composite indicators that capture the concept of multidimensional social phenomena. This decision framework is applied to discover which method among six best represents the social exclusion of eight medium-sized Brazilian cities. The results indicate that space is important in the definition and performance of the method, and ease methods to apply present the best performance. However, one of them fails to capture the concept of the multidimensional phenomenon in two cities. The research makes six important contributions to the literature. First, it offers a decision framework for choosing the best-fit method to construct a composite social indicator. Second, it shows to what extent geographic space matters in defining the best-fit method. Third, it identifies the best-fit method regarding stability and linkage with the conceptually most significant indicator of social exclusion. Fourth, it reveals the methods to be avoided, given their poor performance. Fifth, it indicates the mathematical properties that best represent composite social phenomena. Sixth, it illuminates the debate on social exclusion from a geographical and public policy perspective.
1. Introduction
Social exclusion is a dynamic, procedural, multidimensional, and relational social phenomenon, which makes it possible to understand poverty and its consequences on the moral dependence of families without work [1]. Among these characteristics, multidimensionality makes social exclusion a phenomenon compatible with the operational framework of composite indicators. This framework offers a set of methods that make it possible to simplify the representation of complex social phenomena and assist decision makers in the elaboration of public policies [2,3].
However, no method of constructing composite social indicators is exempt from shortcomings. The normalization, weighting, and aggregation of the sub-indicators particular to each method impact the composite indicator scores [4,5,6]. These different scores result in uncertainties in the position of the observations in the ranking and the strength of the link between the composite indicator and the conceptually most significant variables of the multidimensional social phenomenon [2].
Therefore, it is impossible to determine in advance which method to use to construct a stable composite social indicator that captures the concept of the multidimensional phenomenon. Furthermore, a method that offers a satisfactory solution to represent the social exclusion of a city may not present the same performance in another city, as social exclusion is a social phenomenon dependent on space [7].
This research aims to map social exclusion through a decision framework that allows for the identification of the methods that construct a stable composite indicator that captures the concept of the multidimensional phenomenon. For this, the stability and capacity of six methods used to represent the social exclusion of eight cities were analyzed.
The results of this analysis contribute to the literature in six different ways. First, it offers a decision framework for choosing a method to construct a composite social indicator. Second, it shows to what extent geographic space matters in defining the method used to construct a composite social indicator. Third, it identifies the best-performing method regarding stability and linkage with the conceptually most significant variables of the multidimensional phenomenon. Fourth, it reveals which methods perform poorly and should be avoided. Fifth, it indicates which mathematical properties favor the representation of composite social phenomena. Sixth, the research contributes to the debate of social phenomena from a geographical perspective and public policies since the results have great potential for appropriation by public policy managers.
2. Literature Review
2.1. Multidimensional Social Exclusion
Poverty and social exclusion are disadvantages resulting from income inequality, unemployment, material deprivation, and access to social and political activities [8]. Social exclusion, in particular, overlaps with the poverty concept and implies the total or partial removal of individuals from current social systems, compromising social participation [9] and well-being [10].
Social scientists understand social exclusion as a comprehensive concept of a multidimensional nature, including income, housing, transportation, citizenship [11], and other indicators.
On the one hand, the scope and multidimensionality of social exclusion allow for its representation from different perspectives. For example, social exclusion can be represented with an emphasis on the perspectives of health [12], transport [13,14], children [15,16], and later life [17].
On the other hand, the scope and multidimensionality of social exclusion make it challenging to develop a universal theoretical framework that allows for comparisons since the dimensions and indicators used in social exclusion measures are very different, as shown below.
Dimensions: transportation [13]; housing [10]; socio-demographics and transport [18]; economic, social, and political dimensions [11]; economic, social, political, and cultural dimensions [9]; and demographic, socio-economic, and environmental dimensions [12].
Indicators: income distribution, monetary poverty, health, labor, housing conditions, and material deprivation [8]; socio-economics, education, connectedness, housing, and health services [16]; poverty, education, unemployment, social security, and the family situation [12]; and physical conditions, public transport services, education opportunity, employment opportunity, medical care opportunity, food opportunity, and commercial opportunity [13].
In addition to the lack of a universal theoretical framework to represent social exclusion, the operationalization of the social exclusion concept has long been associated with several problems [11]. In particular, these problems reflect the flaws and limitations of the composite indicator construction methods [2].
There are several methods for building composite indicators [19], with the choice of the method being a subjective decision, which is reflected in a variety of methodological approaches. For example, it is possible to cite composite indicators of social exclusion constructed through Simple Additive Weighting methods [15], Principal Component Analyses [12,13,20], Benefit-of-the-Doubt approaches [14], Machine-Learning approaches [17], and multicriteria methods (e.g., the Preference Ranking Organization Method for Enrichment Evaluation [8] and the Technique for Order Preference by Similarity to Ideal Solution [21]).
There is a consensus in the literature about the failures and limitations of the methods of constructing composite indicators. Despite this, the quality of the multidimensional representation of social exclusion has been superficially explored. In particular, works concerned with the quality of composite indicators of social exclusion focus exclusively on the external validity of the construct [17,21]. Therefore, these works ignore or disregard the importance of constructing a stable composite indicator in which variations in the way of normalizing, weighting, and aggregating the sub-indicators do not generate significant fluctuations in the scores [5]. This research explores this gap and seeks to answer the following question: which methods construct a stable composite indicator that captures the concept of multidimensional social exclusion?
2.2. Methods for Constructing Composite Indicators from a Geographic Perspective
Phenomena such as poverty, social exclusion, social vulnerability, well-being, and inequality have two characteristics in common: dependence on geographic space [7,22,23,24,25] and a multidimensional nature [10,26,27,28,29,30]. The search for the literature of interest to this research was based on these two characteristics and was carried out with the following criteria: articles published in the Web of Science, in the Geography category, with the term “composite indicator” in the abstract, and published in the last five years (2018–2022).
Fourteen research papers met these criteria, and the method used to construct the composite indicator was identified in ten. The most frequently used method was the Simple Additive Weighting (SAW) method. SAW has two main advantages: the simplicity of operation and flexibility in choosing the weighting scheme for sub-indicators. For example, it is possible to operationalize SAW with equal weights [31,32,33] or with participatory weights [34,35]. Another widespread method with the advantage of the data-driven weighting of sub-indicators is the Principal Component Analysis [36]. Methods such as the Stochastic Multi-Attribute Acceptability Analysis [37] and the Geographic Weighted Principal Component Analysis [38] are less frequent but, together with the Benefit-of-the-Doubt [39], have the advantage of considering spatial heterogeneity. Finally, Ordered Weighted Averaging is a sophisticated method that allows for the consideration of spatial heterogeneity, the non-compensation between sub-indicators of poor and above-average performance, and the emphasis of the positive or negative aspects of the multidimensional phenomenon [40].
Even though this list of methods is representative, it disregards one of the most popular methods in the composite indicator literature [19]: the Technique for Order Preferences by Similarity to Ideal Solutions (TOPSIS).
Taking these aspects into account, this paper evaluates the performance of six methods: SAW with equal weights (EWs) or SAW-EW, SAW with participatory weights (PWs) or SAW-PW, Principal Component Analysis (PCA), Benefit-of-the-Doubt (BoD), Ordered Weighted Averaging (OWA), and TOPSIS.
SAW-EW consists of aggregating normalized sub-indicators (e.g., by the max–min and z-score functions) with equal weights. Attributing equal weights is especially advantageous when causal relationships are unknown or when experts disagree on the relative importance of sub-indicators in the multidimensional phenomenon concept [2].
SAW-PW considers that the sub-indicators have different levels of relative importance in the concept of the multidimensional phenomenon. This method considers experts’ opinions in the weight definition, which is especially advantageous when the experts know about the phenomenon and the geographic units [41].
OWA also considers decision makers’ participation in constructing the composite indicator. The method aggregates the normalized sub-indicators ordered by performance and weighted with a value of 0 or 1. The OWA corresponds to SAW-EW when all sub-indicators are weighted with a value of 1. In turn, weighting the five highest-performing sub-indicators with a value of zero corresponds to an emphasis on the negative aspects of social exclusion and non-compensation between the sub-indicators of poor and above-average performance [42]. This weighting is also advantageous because it considers spatial heterogeneity. The weighting of sub-indicators with a value of 0 or 1 is performed based on the sub-indicators’ performance, causing the aggregate sub-indicators (those with a weight of 1) to change from one spatial unit to another.
PCA involves the data-driven weighting of sub-indicators, constructing a composite indicator that retains most of the variance of the original data. Additionally, the weights do not vary across geographic units and are free from subjectivities and judgment biases [43]. These characteristics make PCA an advantageous method when comparability is a critical attribute of the analysis and when specialists do not have knowledge about all the spatial units involved.
BoD also involves the data-driven weighting of the sub-indicators. However, the weights are defined based on the performance of the sub-indicator in each spatial unit. Thus, BoD constructs a composite indicator that considers spatial heterogeneity, as the sub-indicators’ weights vary from one spatial unit to another. This weighting scheme highlights each spatial unit’s positive aspects and is considered advantageous for avoiding disputes about the weighting scheme adopted in constructing a composite indicator [44].
TOPSIS consists of implementing a function that normalizes the sub-indicators based on their distance to the best and worst scores, the so-called positive and negative ideal solutions. The method uses the compensatory aggregation approach and offers flexibility in adopting the weighting scheme [21,45]. This flexibility is advantageous because it allows for the weighting of sub-indicators using the equal weights, data-driven, and participatory schemes.
This set of methods covers the most relevant mathematical properties in constructing composite indicators. The SAW-EW and TOPSIS weight sub-indicators with equal weights. The latter uses a normalization function that considers the distance of scores for a positive and negative ideal solution. The SAW-PW and the OWA weight the sub-indicators based on expert opinion, with the second considering spatial heterogeneity and non-compensatory aggregation. The PCA and the BoD weight the sub-indicators statistically. The former retains as much of the original information in the composite indicator. The latter emphasizes the positive aspects of each spatial unit by assigning greater weights to the higher performance indicators. The question is as follows: which of these mathematical properties constructs a more stable composite indicator that captures the concept of social exclusion?
3. Materials and Methods
The development of this research is associated with a project named “Mapping and analyzing territorial inequalities in medium-sized cities in the interior of Paraná, Brazil.” This project aims to understand the processes of social exclusion, poverty, and inequalities in the face of the growing appreciation of the territorial dimension in analyzing public policies, especially social policies [46].
3.1. Study Area: Medium-Sized Cities of the State of Paraná, Brazil
Cities were selected due to their importance in territorial development and because they present very different realities that need to be analyzed from their internal dynamics [46]. Figure 1 shows the location of eight mid-sized cities in the State of Paraná, Brazil, used as a reference in this study.
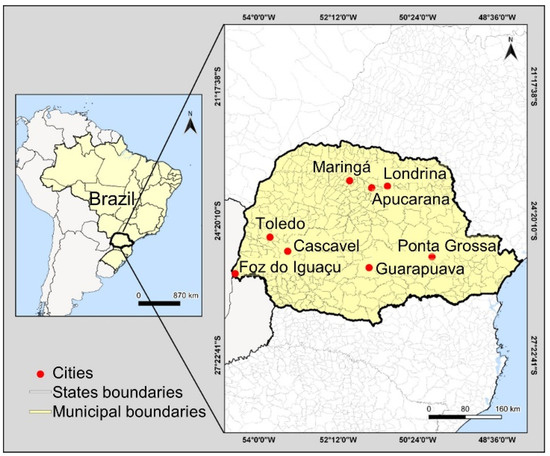
Figure 1.
Location map of cities.
According to the last Brazilian census recorded in 2010, the mid-sized cities analyzed in this research have more than 100 thousand and less than 1 million inhabitants [47]. Census tracts are the geographical reference unit for constructing the composite indicator of social exclusion. Census tracts are the smallest units for aggregating demographic census data and comprise between 200 and 250 households [47]. The number of census tracts varies with population size across the eight mid-sized cities: Apucarana, 113; Rattlesnake, 418; Foz do Iguaçu, 320; Guarapuava, 182; Londrina, 770; Maringá, 483; Ponta Grossa, 398; and Toledo, 109.
3.2. Theoretical Framework: Multidimensional Social Exclusion Sub-Indicators
The theoretical framework used in this research is based on the methodology developed by the Center for Studies and Mapping of Social Exclusion for Public Policies [48]. This framework has the advantages of using a consolidated methodology, the availability of sub-indicator data, and information obtained from specialists on the relative importance of sub-indicators in the social exclusion concept. Five dimensions of social exclusion are addressed in this framework:
Economic dimension: influences the other dimensions, consisting of indicators with a greater availability of data, ease of access, and levels of stratification.
Educational dimension: the main element of mobility in social conditions today, given the relationship between levels of education and income.
Demographic dimension: socially excluded people have a lower life expectancy than average due to higher infant mortality and fertility rates.
Environmental dimension: more privileged populations seek to occupy more wooded areas to avoid the thermal discomfort resulting from the densification of buildings in cities.
Household dimension: connects all previous dimensions to urban space and reflects them in the housing and neighborhood conditions.
Figure 2 presents the five dimensions and the fifteen sub-indicators of the theoretical framework of social exclusion used in constructing the composite indicators, as well as the direction of the relationship of each sub-indicator with social exclusion.
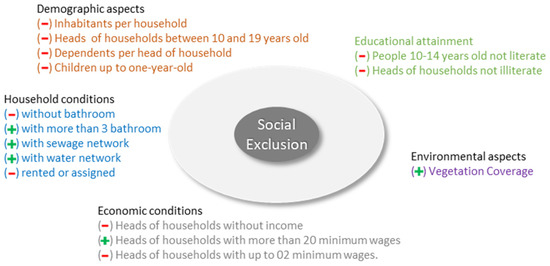
Figure 2.
The theoretical framework of social exclusion: dimensions and sub-indicators.
The sub-indicator data refer to the 2010 Brazilian census. The sub-indicators positively related to social exclusion were normalized using the function [(minimum value)/(maximum minimum)], and the sub-indicators negatively related to social exclusion were normalized using the function [(maximum value)/(maximum minimum)].
3.3. Operational Framework: Construction and Performance Analysis of Composite Indicators
The theoretical framework presented in Section 3.2 was operationalized using the six methods detailed in Section 2: SAW with equal weights (EWs) or SAW-EW, SAW with participatory weights (PWs) or SAW-PW, Principal Component Analysis (PCA), Benefit-of-the-Doubt (BoD), Ordered Weighted Averaging (OWA), and TOPSIS.
Then, two criteria were applied to evaluate the performance of the composite indicators: linkage with external variables and stability.
The link with external variables allows for the verification of the relationship of the composite indicator with conceptually significant variables in the concept of the multidimensional phenomenon [2]. Studies on social phenomena such as social exclusion understand that income is the conceptually most significant variable [1]. Therefore, a social exclusion composite indicator captures the concept of the multidimensional phenomenon when its scores are similar to those of the income variable. This similarity is usually verified by the correlation coefficient between the composite indicator and the external variable [4]. In particular, the Spearman correlation coefficient indicates how much the composite indicator captures the multidimensional phenomenon, even in the presence of outliers or for data without normal distribution [49]. The strength of the link between the composite indicator and the income variable, indicated by the Spearman correlation coefficient, is based on the rule of thumb by [50] as follows: R < 0.3 = insignificant, 0.3 < R < 0.5 = weak, 0.5 < R < 0.7 = moderate, 0.7 < R < 0.9 = strong, and R > 0.9 = very strong.
Another way to verify the similarity between the composite indicator scores and income is by calculating the Mahalanobis distance. The Mahalanobis distance is a bivariate outlier detection approach that allows for identifying the geographic areas with social exclusion scores incompatible with the external variable [35]. This research uses the proportion of bivariate outliers obtained through the Mahalanobis distance as a second measure of the composite indicator’s capacity to capture social exclusion correctly.
The second performance analysis is associated with constructing a composite indicator with a stable structure [2,4]. It requires verifying the levels of uncertainty produced by changes in normalizing, weighting, and aggregating the sub-indicators [5]. In this research, the uncertainty analysis is adapted to verify the stability of the composite indicator construction method. In other words, the research verifies how much the results obtained by one method vary concerning the results obtained by the other methods. In particular, two uncertainty analyses were performed. The first uncertainty analysis shows the proportion of the general variation in the census tracts’ position in the social exclusion ranking. The second uncertainty analysis shows the variation in the social exclusion scores.
A summary of the research’s operational framework is illustrated in Figure 3.
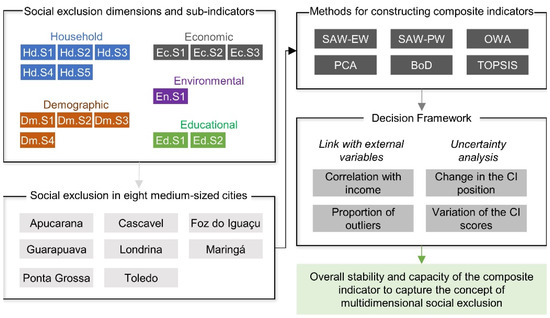
Figure 3.
The operational framework of the research.
In short, the development of the research boils down to five steps. First, data are collected on the fifteen sub-indicators of social exclusion for each of the eight selected cities. Second, six composite indicators of social exclusion are constructed for each city using the selected methods. Third, the correlations between the composite indicator and income and the proportion of outliers are verified as a measure of external validity. Fourth, variations in the scores and ranks are verified as a measure of the stability of the composite indicators. Fifth, the methods that build stable composite indicators and that capture the concept of multidimensional social exclusion are identified.
4. Results and Analysis
Table 1 makes it possible to compare the performances of the composite indicators constructed by the six methods in capturing the conceptually most significant variable of social exclusion: income. In short, seventy-three percent of the composite indicators are moderately or strongly correlated with the income variable.

Table 1.
Correlation of the composite indicator with income (highest—best; maximum = 1).
BoD is the method that presented the largest proportion of weak correlations with the income variable. In four cities, CI-BoD was weakly correlated with the income variable. Moderate, strong, or very strong correlations were observed in all cities for the composite indicators constructed by the SAW-PW and PCA methods. Seven cities showed moderate, strong, or very strong correlations between the composite indicators constructed by TOPSIS and the income variable. Six cities achieved moderate, strong, or very strong correlations between the income variable and the composite indicators constructed by the SAW-EW and SAW-OWA methods.
The results in Table 2 show that none of the methods has more than 10% of social exclusion scores incompatible with income. The difference in the percentage of bivariate outliers among the six analyzed methods is only 1%. This low difference indicates that no method stands out positively or negatively regarding the number of census tracts with income scores incompatible with the composite social exclusion indicator scores.
Table 2.
Outliers of the composite indicator (highest—worst; minimum = 0).
The scores of the composite indicators constructed by the OWA and BoD methods are the most compatible with the census tracts’ income. Both methods present an average of 6.26% of outliers. The PCA composite indicator scores show the highest percentage of outliers with income, an average of 6.79%. The general average of bivariate outliers is 6%, indicating that the percentage of census tracts with social exclusion scores incompatible with income is low. These low percentages of outliers suggest that the social exclusion scores of census tracts are highly compatible with income, regardless of the method used.
The low percentage of census tracts with social exclusion scores incompatible with income does not overlap with the low correlation between the composite indicators constructed by the BoD method with income. Therefore, the link between the income variable exclusion and the composite indicator suggests that only BoD may not be an adequate method to represent the social exclusion concept.
The uncertainty analysis reinforces the suggestion that BoD should be avoided. Table 3 reveals an average change of 24% in the census tracts’ position in the social exclusion ranking when the BoD method is applied to construct the composite indicator. This percentage is, on average, 18% for the composite indicators constructed by PCA and TOPSIS. The composite indicators constructed by SAW-EW, SAW-PW, and OWA are more stable, with less than a 15% change in the position of the census tract in the ranking of social exclusion.
Table 3.
Relative change in the position of the census tracts in the ranking of social exclusion (highest—worst; minimum = 0).
The uncertainty associated with the different ways of normalizing, weighting, and aggregating the sub-indicators of each method is lower in the composite indicators constructed by the SAW-EW method. The composite indicators constructed by the PCA and TOPSIS methods are 1.3 times more unstable than those constructed by SAW-EW, SAW-PW, and SAW-OWA. The BoD method constructs the most unstable composite indicator among the methods studied. The position of the census tracts in the ranking of social exclusion obtained using the BoD method can vary by 24% up or down concerning the average position obtained using the other methods.
The uncertainty analysis associated with the variation in the scores presented in Table 4 reinforces these results. It indicates that the primary sources of uncertainty are associated with data-driven weighting and normalization using the distance function. On average, the social exclusion composite indicator scores change by 0.42 when the BoD method is applied to construct the composite indicator. The PCA and TOSPIS methods also show significant instability. The social exclusion scores change by more than 0.20 on the composite indicators constructed by PCA and TOPSIS.
Table 4.
Average variation of social exclusion scores in census tracts (highest—worst; minimum = 0).
These results indicate that the weights obtained from the data and by distance normalization generate more instability in the composite indicator than the non-compensatory aggregation, the weights obtained from expert opinion, and the equal weights.
An analysis of Table 1, Table 2, Table 3 and Table 4 makes it possible to identify which methods construct the composite indicators with the best performance in terms of stability and connection with the conceptually most significant variable in the concept of social exclusion.
In Guarapuava, the non-compensatory aggregation of the sub-indicators, the emphasis on sub-indicators of poorer performance, and the consideration of spatial heterogeneity contribute to a better representation of social exclusion. The social exclusion composite indicator constructed by OWA strongly correlates with income and presents only 4.4% of outliers. The average change in the position of the census tracts in the social exclusion ranking is 12% up or down, and the average change in the social exclusion scores is, on average, 0.17. A visualization of these results is presented in Figure 4.
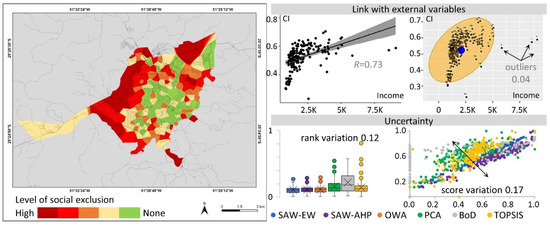
Figure 4.
Social Exclusion in Guarapuava.
Weighting the sub-indicators with equal weights and aggregating them by the average results provide a better representation of social exclusion in Cascavel, Foz do Iguaçu, and Maringá. The SAW-EW method constructs the most stable composite indicators of social exclusion in these cities. The variation in the position of the census tracts in the ranking of social exclusion is 1.32 times lower than the average of the other methods. The scores vary 1.36 times less than the average of the two other methods. The composite indicators of the social exclusion of Cascavel, Foz do Iguaçu, and Maringá present the lowest percentage of bivariate outliers among the methods analyzed. The correlations of the composite indicator with income exceed 0.50 in all cities. A summary of the results is displayed in Figure 5, Figure 6 and Figure 7.
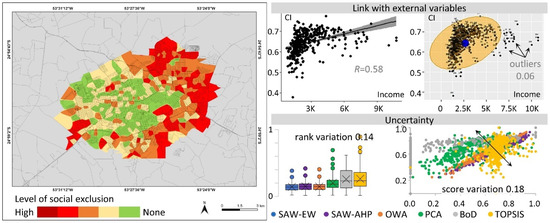
Figure 5.
Social Exclusion in Cascavel.
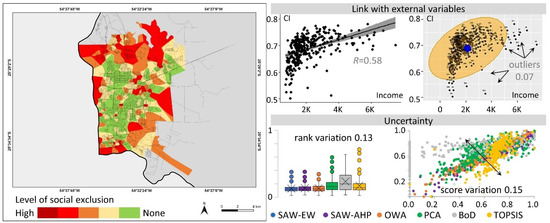
Figure 6.
Social Exclusion in Foz do Iguaçu.
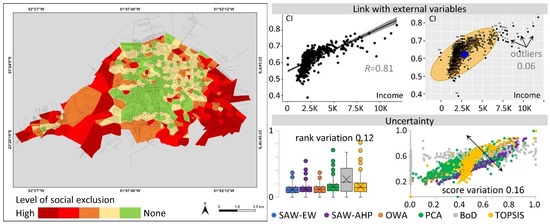
Figure 7.
Social Exclusion in Maringá.
The SAW-EW method allows for the construction of stable composite indicators that capture the concept of social exclusion in six of the eight cities. The method fails to capture the concept of social exclusion in the cities of Londrina and Ponta Grossa. These results suggest that assigning equal weights to sub-indicators does not deteriorate the composite indicator’s capacity to capture the concept of the multidimensional phenomenon. Furthermore, the results indicate that a method of simple execution and understanding by public managers offers a good representation of multidimensional social phenomena.
SAW-PW is the method that constructs the most stable composite indicators that best capture the concept of social exclusion in the cities of Apucarana, Londrina, Ponta Grossa, and Toledo. The weights obtained from expert opinions favor the representation of social exclusion in these four cities. However, the performance of the composite indicator constructed by the SAW-PW method is significantly superior in Apucarana and Toledo when compared to that in Londrina and Ponta Grossa, as shown in Figure 8, Figure 9, Figure 10 and Figure 11.
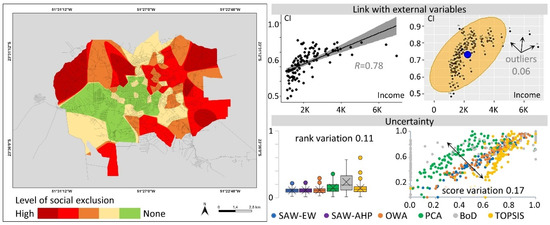
Figure 8.
Social Exclusion in Apucarana.
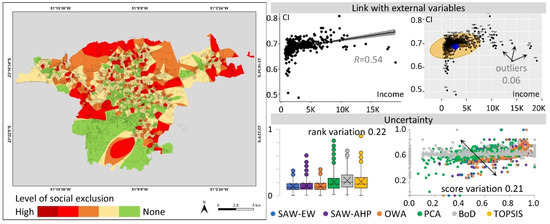
Figure 9.
Social Exclusion in Londrina.
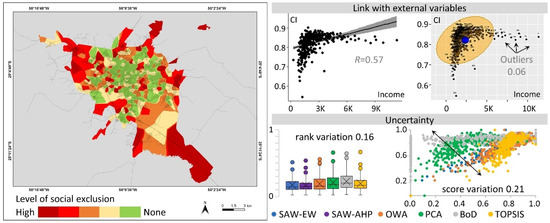
Figure 10.
Social Exclusion in Ponta Grossa.
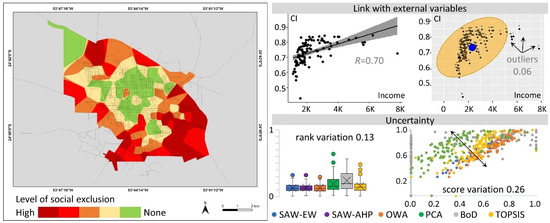
Figure 11.
Social Exclusion in Toledo.
The correlation of the composite indicator with income is 1.32 and 1.30 times lower in Londrina and Ponta Grossa than the average for Apucarana and Toledo. The variation in the position of the census tract in the social exclusion ranking is 2.25 and 1.33 times higher in Londrina and Ponta Grossa than the average for Apucarana and Toledo. Even so, the SAW-PW method better represents social exclusion in Londrina and Ponta Grossa than the other methods.
Ponta Grossa presents the worst performance in the linking of the composite indicator with the conceptually most significant variable of social exclusion. The average correlation between the composite indicators and the income variable is 0.50. The composite indicators constructed by SAW-EW and OWA show an insignificant correlation with the income variable.
The correlation with income and the variation in the scores of the eight composite indicators constructed for Londrina are worse than the results for the other cities. The variation in the position of the census tracts in the ranking of social exclusion is worse in Londrina than the average of the other cities when using five of the six methods.
Only the composite indicators constructed by SAW-PW, PCA, and TOPSIS moderately or strongly capture the concept of social exclusion in Londrina and Ponta Grossa. However, the SAW-PW method is a more stable composite indicator than the PCA and TOPSIS methods in the two cities. In Londrina, the position of the census tracts in the ranking varies 1.50 times less in the composite indicator constructed by the SAW-PW method than in that constructed by the PCA or TOPSIS methods. The social exclusion scores vary 1.68 times less in the composite indicator constructed by the SAW-PW method than in that constructed by the PCA or TOPSIS methods. In Ponta Grossa, the composite indicator constructed by the SAW-PW method is 1.31 and 1.64, more stable than that constructed by PCA and TOPSIS concerning the ranking position and score variations.
These results indicate that space matters in defining the method used to construct the composite indicator. SAW-EW and SAW-PW perform the best in representing social exclusion in 88% of cities. However, the performance of these methods varies between cities, and the SAW-EW method fails to represent the multidimensional phenomenon in two cities.
5. Discussion of the Results
This research addresses a topic of great interest among researchers in the composite indicators field: the influence of geographic space on the measurement of multidimensional social phenomena [7]. The research results reveal that multidimensionality and spatial dependence on social phenomena such as social exclusion prevent the determination of a fully reliable method for their measurement. For example, a method that provides a satisfactory solution for representing social exclusion in one city may not perform as well in another.
These results enrich the current literature on the impact of space and the construction methods of composite indicators on the representation of the multidimensional phenomenon. On the one hand, the research results confirm that space matters in the representation of social exclusion [22,23]. On the other hand, the research results add to the literature that the representation of social exclusion is also directly influenced by the construction method of the composite indicator.
In this respect, the research offers a valuable contribution to identifying which method offers the best representation of the multidimensional phenomenon, as current studies [17,21] focus exclusively on externally validating the composite indicator of social exclusion.
The results also show that the composite indicators’ stability and capacity used to capture the concept of the multidimensional phenomenon vary according to the method and space. At this point, it is possible to connect two understandings sedimented in the literature and to conclude that the flaws and limitations of composite indicator construction methods are space-dependent. This connection reinforces the importance of a decision framework that allows for the identification of the most suitable methods to construct stable composite indicators that capture the concept of multidimensional social phenomena.
The application of the decision framework shows that widely used methods in the construction of composite indicators of social exclusion, such as PCA [12,13,20] and BoD [14,39], perform poorly and should be avoided. Composite indicators constructed using subjective weighting offer better representations of social exclusion than those constructed using data-driven weighting. This result contributes to the discussion about the problem of the incompatibility of weights obtained endogenously with the relative importance of the sub-indicators in the concept of the phenomenon [36,43].
6. Conclusions
Analyzing the composite indicators constructed by the six methods for each of the eight cities provides evidence to reach eight conclusions. First, it confirms the current argument in the literature that there is no perfect method to construct a composite indicator [2,51]. Second, popular methods, such as BoD, that consider spatial heterogeneity through the individualized weighting of the sub-indicators of the best performance of each spatial unit show poor results and should be used with caution. Third, sophisticated methods, such as OWA, that combine non-compensatory aggregation, spatial heterogeneity, and the emphasis of the positive or negative aspects of the phenomenon do not guarantee better results. Fourth, methods that are simple to implement and easy to understand by public managers, such as SAW-EW and SAW-PW, offer satisfactory results in most cases. Fifth, data-driven weighting through the BoD and PCA methods is a critical source of uncertainty for composite indicators, reinforcing the argument that the weights of the sub-indicators obtained through this weighting scheme are not necessarily compatible with the concept of the multidimensional phenomenon [36,43]. Sixth, weighting the sub-indicators based on expert opinion improves the performance of composite indicators, which capture the concept of the multidimensional phenomenon in 100% of cases. Seventh, the weighting of sub-indicators with equal weights using SAW and TOPSIS constructs composite indicators that capture the concept of social exclusion in 81% of cases, indicating that space also matters in considering therelative importance of the sub-indicator in the multidimensional phenomenon. Eighth, normalization by distance improves the capacity of composite indicators of social exclusion to capture income. However, it increases the percentage of bivariate outliers and the instability of composite indicators.
From these conclusions, it is possible to point out the following research contributions: First, researchers can identify methods that build stable and reliable composite indicators, in a context in which space matters, through a four-criteria decision framework. Two, the performance of the composite indicator in terms of stability and ability to capture the concept of social exclusion varies from city to city, supporting the argument that geographic space matters in representing multidimensional social phenomena. Third, considering the opinion of experts on the relative importance of sub-indicators makes it possible to construct more stable composite indicators that always capture the concept of the multidimensional phenomenon. Fourth, composite indicators constructed using data-driven weighting methods show unsatisfactory results. In particular, the PCA method constructs composite indicators that are not very stable, while BoD constructs composite indicators that do not capture the concept of the multidimensional phenomenon in 75% of cities. Fifth, the mathematical properties that most favor the representation of composite social phenomena are participatory and equal weights weighting, non-compensatory aggregation, and normalization using the max–min and distance functions. Sixth, the geographic perspective is a critical property for the debate on social phenomena, so the framework developed in this research has great potential for appropriation by public managers in the planning and development of public policies.
In short, geographic space matters in the method’s definition, making it impossible to indicate a priori which method to use to construct a composite indicator. Some methods generate more consistent results than others, indicating the need to compare the performance of at least two methods with different weighting properties.
Considering that the research results are based on two validations, exploring new ways to validate the composite indicators is desirable. It is suggested to expand the number of validations and consider composite indicators of social exclusion constructed from satellite images and Google Street View images. Another limitation to be considered in future research is comparing scores from different cities. The social exclusion scores obtained in this research are not comparable between cities insofar as the maximum and minimum values used in normalization are specific to each city. Additionally, it may be useful in future work to evaluate the framework’s responsiveness to other theoretical frameworks, for example, constructs that consider threshold levels for the sub-indicators (see [17]).
The results of this research have important policy implications related to the fight against social exclusion and poverty. As space matters and influences the performance of the methods to construct stable composite indicators, urban planners and managers must experiment with these methods to search for the best-fitting alternative. Moreover, it is also advisable to confront statistical outcomes with local urban characteristics, including occupation history, physical conditions, land use patterns, and social and economic structures, to elaborate customized policies grounded in reality.
Author Contributions
Conceptualization, M.P.L.; Validation, A.M.A.D., H.R.-D. and O.d.S.M.; Investigation, O.d.S.M.; Writing—original draft, M.P.L.; Writing—review & editing, A.M.A.D., H.R.-D., C.A.P.d.S.M. and P.I.E.; Supervision, P.I.E.; Funding acquisition, P.I.E. All authors have read and agreed to the published version of the manuscript.
Funding
This research was funded by Vale S.A. (within the Research, Development, and Innovation Partnership Agreement) and National Council for Scientific and Technological Development of Brazil (CNPq)—Productivity grants 311922/2021-0 (Ekel, P.I.), 303733/2019-5 (Diniz, A.M.A.) and Postdoctoral fellowship 151518/2022-0 (Libório, M.P.). The APC was funded by Vale S.A. (within the Research, Development, and Innovation Partnership Agreement).
Institutional Review Board Statement
Not applicable.
Informed Consent Statement
All authors have read and agreed to the published version of the manuscript.
Data Availability Statement
The data used in the analyzes are available at: Martinuci, O.S., Machado, A.M.C., Libório, M.P. (2021). Data for: Time-in-space analysis of multidimensional phenomena, Mendeley Data, V4, doi:10.17632/m3y4jncvch.4.
Conflicts of Interest
The authors declare that they have no known competing financial interests or personal relationships that could have appeared to influence the work reported in this paper.
References
- Levitas, R. What is social exclusion. In Breadline Europe: The Measurement of Poverty; Policy Press: Bristol, UK, 2000; pp. 357–383. [Google Scholar]
- Nardo, M.; Saisana, M.; Saltelli, A.; Tarantola, S. Tools for Composite Indicators Building; European Commission, Institute for the Protection and Security of the Citizen, JRC: Ispra, Italy, 2005; p. 133. [Google Scholar]
- Kuc-Czarnecka, M.; Lo Piano, S.; Saltelli, A. Quantitative storytelling in the making of a composite indicator. Soc. Indic. Res. 2020, 149, 775–802. [Google Scholar] [CrossRef]
- Dialga, I.; Le Giang, T.H. Highlighting methodological limitations in the steps of composite indicators construction. Soc. Indic. Res. 2017, 131, 441–465. [Google Scholar] [CrossRef]
- Greco, S.; Ishizaka, A.; Tasiou, M.; Torrisi, G. On the methodological framework of composite indices: A review of the issues of weighting, aggregation, and robustness. Soc. Indic. Res. 2019, 141, 61–94. [Google Scholar] [CrossRef]
- Cinelli, M.; Spada, M.; Kim, W.; Zhang, Y.; Burgherr, P. MCDA Index Tool: An interactive software to develop indices and rankings. Environ. Syst. Decis. 2021, 41, 82–109. [Google Scholar] [CrossRef] [PubMed]
- Dangschat, J.S. Space matters—Marginalization and its places. Int. J. Urban Reg. Res. 2009, 33, 835–840. [Google Scholar] [CrossRef]
- Stanković, J.J.; Džunić, M.; Marjanović, I. Towards an Inclusive Europe: Ranking European Countries Based on Social Sustainability Indicators. In Decision Support Systems XII: Decision Support Addressing Modern Industry, Business, and Societal Needs, Proceedings of the 8th International Conference on Decision Support System Technology, ICDSST 2022, Thessaloniki, Greece, 23–25 May 2022; Springer International Publishing: Cham, Switzerland, 2022; pp. 84–96. [Google Scholar]
- Malisa, A. Persistence of Social Exclusion in Tanzania. In Efficiency, Equity and Well-Being in Selected African Countries; Springer: Cham, Switzerland, 2019; pp. 97–120. [Google Scholar]
- García-Vélez, D.F.; Contreras-Jaramillo, M.A.; Torres-Gutiérrez, T.P.; Correa-Quezada, R.F. Social exclusion in Ecuador with housing indicators: A regional analysis. In Entrepreneurship and the Community: A Multidisciplinary Perspective on Creativity, Social Challenges, and Business; Springer: Cham, Switzerland, 2020; pp. 159–176. [Google Scholar]
- Bhalla, A.; Lapeyre, F. Social exclusion: Towards an analytical and operational framework. Dev. Change 1997, 28, 413–433. [Google Scholar] [CrossRef]
- Hübelová, D.; Ptáček, P.; Šlechtová, T. Demographic and socio-economic factors influencing health inequalities in the Czech Republic. GeoScape 2021, 15, 53–65. [Google Scholar] [CrossRef]
- Xiao, R.; Wang, G.; Wang, M. Transportation disadvantage and neighborhood sociodemographics: A composite indicator approach to examining social inequalities. Soc. Indic. Res. 2018, 137, 29–43. [Google Scholar] [CrossRef]
- Rogge, N.; Self, R. Measuring regional social inclusion performances in the EU: Looking for unity in diversity. J. Eur. Soc. Policy 2019, 29, 325–344. [Google Scholar] [CrossRef]
- Abello, A.; Gong, C.H.; Daly, A.; McNamara, J. Spatial dimensions of child social exclusion risk in Australia: Widening the scope. Child Indic. Res. 2012, 5, 685–703. [Google Scholar] [CrossRef]
- Mohanty, I.; Edvardsson, M.; Abello, A.; Eldridge, D. Child social exclusion risk and child health outcomes in Australia. PLoS ONE 2016, 11, e0154536. [Google Scholar] [CrossRef]
- Keogh, S.; O’Neill, S.; Walsh, K. Composite measures for assessing multidimensional social exclusion in later life: Conceptual and methodological challenges. Soc. Indic. Res. 2021, 155, 389–410. [Google Scholar] [CrossRef]
- Leung, A.; Burke, M.; Cui, J. The tale of two (very different) cities–Mapping the urban transport oil vulnerability of Brisbane and Hong Kong. Transp. Res. Part D Transp. Environ. 2018, 65, 796–816. [Google Scholar] [CrossRef]
- El Gibari, S.; Gómez, T.; Ruiz, F. Building composite indicators using multicriteria methods: A review. J. Bus. Econ. 2019, 89, 1–24. [Google Scholar] [CrossRef]
- Węziak-Białowolska, D. Poverty in the regions of the European Union–measurement with a composite indicator. Contemp. Econ. 2015, 9, 113–154. [Google Scholar] [CrossRef]
- Correa Machado, A.M.; Ekel, P.I.; Libório, M.P. Goal-based participatory weighting scheme: Balancing objectivity and subjectivity in the construction of composite indicators. Qual. Quant. 2022, 1–21. [Google Scholar] [CrossRef]
- Tickamyer, A.R. Space matters! Spatial inequality in future sociology. Contemp. Sociol. 2000, 29, 805–813. [Google Scholar] [CrossRef]
- Stretesky, P.B.; Schuck, A.M.; Hogan, M.J. Space matters: An analysis of poverty, poverty clustering, and violent crime. Justice Q. 2004, 21, 817–841. [Google Scholar] [CrossRef]
- Emrich, C.T.; Cutter, S.L. Social vulnerability to climate-sensitive hazards in the southern United States. Weather Clim. Soc. 2011, 3, 193–208. [Google Scholar] [CrossRef]
- Schwanen, T.; Wang, D. Well-being, context, and everyday activities in space and time. Ann. Assoc. Am. Geogr. 2014, 104, 833–851. [Google Scholar] [CrossRef]
- Tate, E. Uncertainty analysis for a social vulnerability index. Ann. Assoc. Am. Geogr. 2013, 103, 526–543. [Google Scholar] [CrossRef]
- Peiró-Palomino, J.; Picazo-Tadeo, A.J. OECD: One or many? Ranking countries with a composite well-being indicator. Soc. Indic. Res. 2018, 139, 847–869. [Google Scholar] [CrossRef]
- Rabiei-Dastjerdi, H.; Matthews, S.A. Who gets what, where, and how much? Composite index of spatial inequality for small areas in Tehran. Reg. Sci. Policy Pract. 2021, 13, 191–205. [Google Scholar] [CrossRef]
- Drago, C. The analysis and the measurement of poverty: An interval-based composite indicator approach. Economies 2021, 9, 145. [Google Scholar] [CrossRef]
- Rabiei-Dastjerdi, H.; Matthews, S.A.; Ardalan, A. Measuring spatial accessibility to urban facilities and services in Tehran. Spat. Demogr. 2018, 6, 17–34. [Google Scholar] [CrossRef]
- Müller-Frączek, I. Dynamic measurement of complex phenomena in assessing the Europe 2020 strategy effects. Reg. Stat. 2019, 9, 32–53. [Google Scholar] [CrossRef]
- Hübelová, D.; Kozumplíková, A.; Rousová, G. Relationship of socio-demographic indicators and mortality structure in districts of the south Moravian region (Czech Republic) in 2006 and 2015. Geogr. Inf. 2019, 22, 150–162. [Google Scholar]
- Edina, K.D.; Tamás, M.; Katalin, M.B. The indicator-based measurement of the circular economy in the countries of the European Union. Tér És Társadalom 2022, 36, 49–69. [Google Scholar]
- Bell, D.; Burns, L. Creating a Composite Index to Target Recruitment of UK Students from Areas of Low Participation in Higher Education. Appl. Spat. Anal. Policy 2021, 15, 847–872. [Google Scholar] [CrossRef]
- Libório, M.P.; Ekel, P.Y.; Martinuci, O.D.S.; Figueiredo, L.R.; Hadad, R.M.; Lyrio, R.D.M.; Bernardes, P. Fuzzy set based intra-urban inequality indicator. Qual. Quant. 2022, 56, 667–687. [Google Scholar] [CrossRef]
- Libório, M.P.; Martinuci, O.D.S.; Machado, A.M.C.; Hadad, R.M.; Bernardes, P.; Camacho, V.A.L. Adequacy and consistency of an intraurban inequality indicator constructed through principal component analysis. Prof. Geogr. 2021, 73, 282–296. [Google Scholar] [CrossRef]
- Greco, S.; Ishizaka, A.; Matarazzo, B.; Torrisi, G. Stochastic multi-attribute acceptability analysis (SMAA): An application to the ranking of Italian regions. Reg. Stud. 2018, 52, 585–600. [Google Scholar] [CrossRef]
- Cartone, A.; Panzera, D. Deprivation at local level: Practical problems and policy implications for the province of Milan. Reg. Sci. Policy Pract. 2021, 13, 43–61. [Google Scholar] [CrossRef]
- Libório, M.P.; Martinuci, O.D.S.; Machado, A.M.C.; Ekel, P.I.; Abreu, J.F.D.; Laudares, S. Representing Multidimensional Phenomena of Geographic Interest: Benefit of the Doubt or Principal Component Analysis? Prof. Geogr. 2022, 74, 758–771. [Google Scholar] [CrossRef]
- Libório, M.P.; Martinuci, O.D.S.; Ekel, P.I.; Hadad, R.M.; Lyrio, R.D.M.; Bernardes, P. Measuring inequality through a non-compensatory approach. GeoJournal 2021, 87, 4689–4706. [Google Scholar] [CrossRef]
- Libório, M.P.; Silva, L.M.L.; Ekel, P.I.; Figueiredo, L.R.; Bernardes, P. Consensus-Based Sub-Indicator Weighting Approach: Constructing Composite Indicators Compatible with Expert Opinion. Soc. Indic. Res. 2022, 164, 1073–1099. [Google Scholar] [CrossRef]
- Bernardes, P.; Ekel, P.I.; Rezende, S.F.L.; Pereira Júnior, J.G.; dos Santos, A.C.G.; da Costa, M.A.R.; Carvalhais, R.L.; Libório, M.P. Cost of doing business index in Latin America. Qual. Quant. 2022, 56, 2233–2252. [Google Scholar] [CrossRef]
- Mazziotta, M.; Pareto, A. Use and misuse of PCA for measuring well-being. Soc. Indic. Res. 2019, 142, 451–476. [Google Scholar] [CrossRef]
- Fusco, E.; Vidoli, F.; Sahoo, B.K. Spatial heterogeneity in composite indicator: A methodological proposal. Omega 2018, 77, 1–14. [Google Scholar] [CrossRef]
- Liern, V.; Pérez-Gladish, B. Building composite indicators with unweighted-TOPSIS. IEEE Trans. Eng. Manag. 2021, 70, 1871–1880. [Google Scholar] [CrossRef]
- Silva, O. Mapeamento e Análise das Desigualdades Territoriais em Cidades de Porte Médio do Interior do Paraná; Project Report: CNPq: Edital Universal 01/2016; Processo 423443/2016-0; Universisdade Estadual de Maringá: Maringá, Brazil, 2021; Available online: https://drive.google.com/drive/folders/1VDuedzuoTBkOfkyXnegUkHv90yLz7Mrf?usp=sharing (accessed on 27 March 2022).
- IBGE. Censo Demográfico; Insituto Brasileiro de Geografia e Estatística: Rio de Janeiro, Brazil, 2010. [Google Scholar]
- Melazzo, E.S. Notas sobre um Grupo de Pesquisas—O Centro de Estudos e Mapeamento da Exclusão Social para Políticas Públicas–CEMESPP. Cad. Prudentino Geogr. 2019, 2, 133–140. [Google Scholar]
- Kowalski, C.J. On the effects of non-normality on the distribution of the sample product-moment correlation coefficient. J. R. Stat. Soc. Ser. C (Appl. Stat.) 1972, 21, 1–12. [Google Scholar] [CrossRef]
- Hinkle, D.E.; Wiersma, W.; Jurs, S.G. Applied Statistics for the Behavioral Sciences; Houghton Mifflin College Division: Boston, MA, USA, 2003; Volume 663. [Google Scholar]
- Mazziotta, M.; Pareto, A. Synthesis of indicators: The composite indicators approach. In Complexity in Society: From Indicators Construction to Their Synthesis; Springer: Cham, Switzerland, 2017; pp. 159–191. [Google Scholar]


Disclaimer/Publisher’s Note: The statements, opinions and data contained in all publications are solely those of the individual author(s) and contributor(s) and not of MDPI and/or the editor(s). MDPI and/or the editor(s) disclaim responsibility for any injury to people or property resulting from any ideas, methods, instructions or products referred to in the content. |
© 2023 by the authors. Licensee MDPI, Basel, Switzerland. This article is an open access article distributed under the terms and conditions of the Creative Commons Attribution (CC BY) license (https://creativecommons.org/licenses/by/4.0/).