

Analyzing Diets’ Contribution to Greenhouse Gas Emissions in Brasilia, Brazil


Abstract
:1. Introduction
2. Study Area
3. Methods
3.1. Data Collection
- Omnivorous: individuals who did not indicate restrictions on food consumption.
- No beef: individuals whose only restriction is “I do not eat cattle meat.” Those individuals indicated consuming all other food items except bovine meat.
- No pork: individuals whose only restriction is “I do not eat swine meat.” Those individuals indicated consuming all other food items except swine meat.
- No red meat: individuals whose restriction is “I do not eat red meat.” Those individuals indicated the consumption of all other food items except red meat (e.g., cattle meat, swine meat, lamb meat, amongst others).
- Pescatarian: individuals whose animal protein consumption comes only from fish.
- Vegetarian: people whose dietary pattern includes all plant-based food, eggs, and dairy products.
- Vegan: people whose eating pattern is composed only of plant-based items.
3.2. Estimation of GHG Intensity
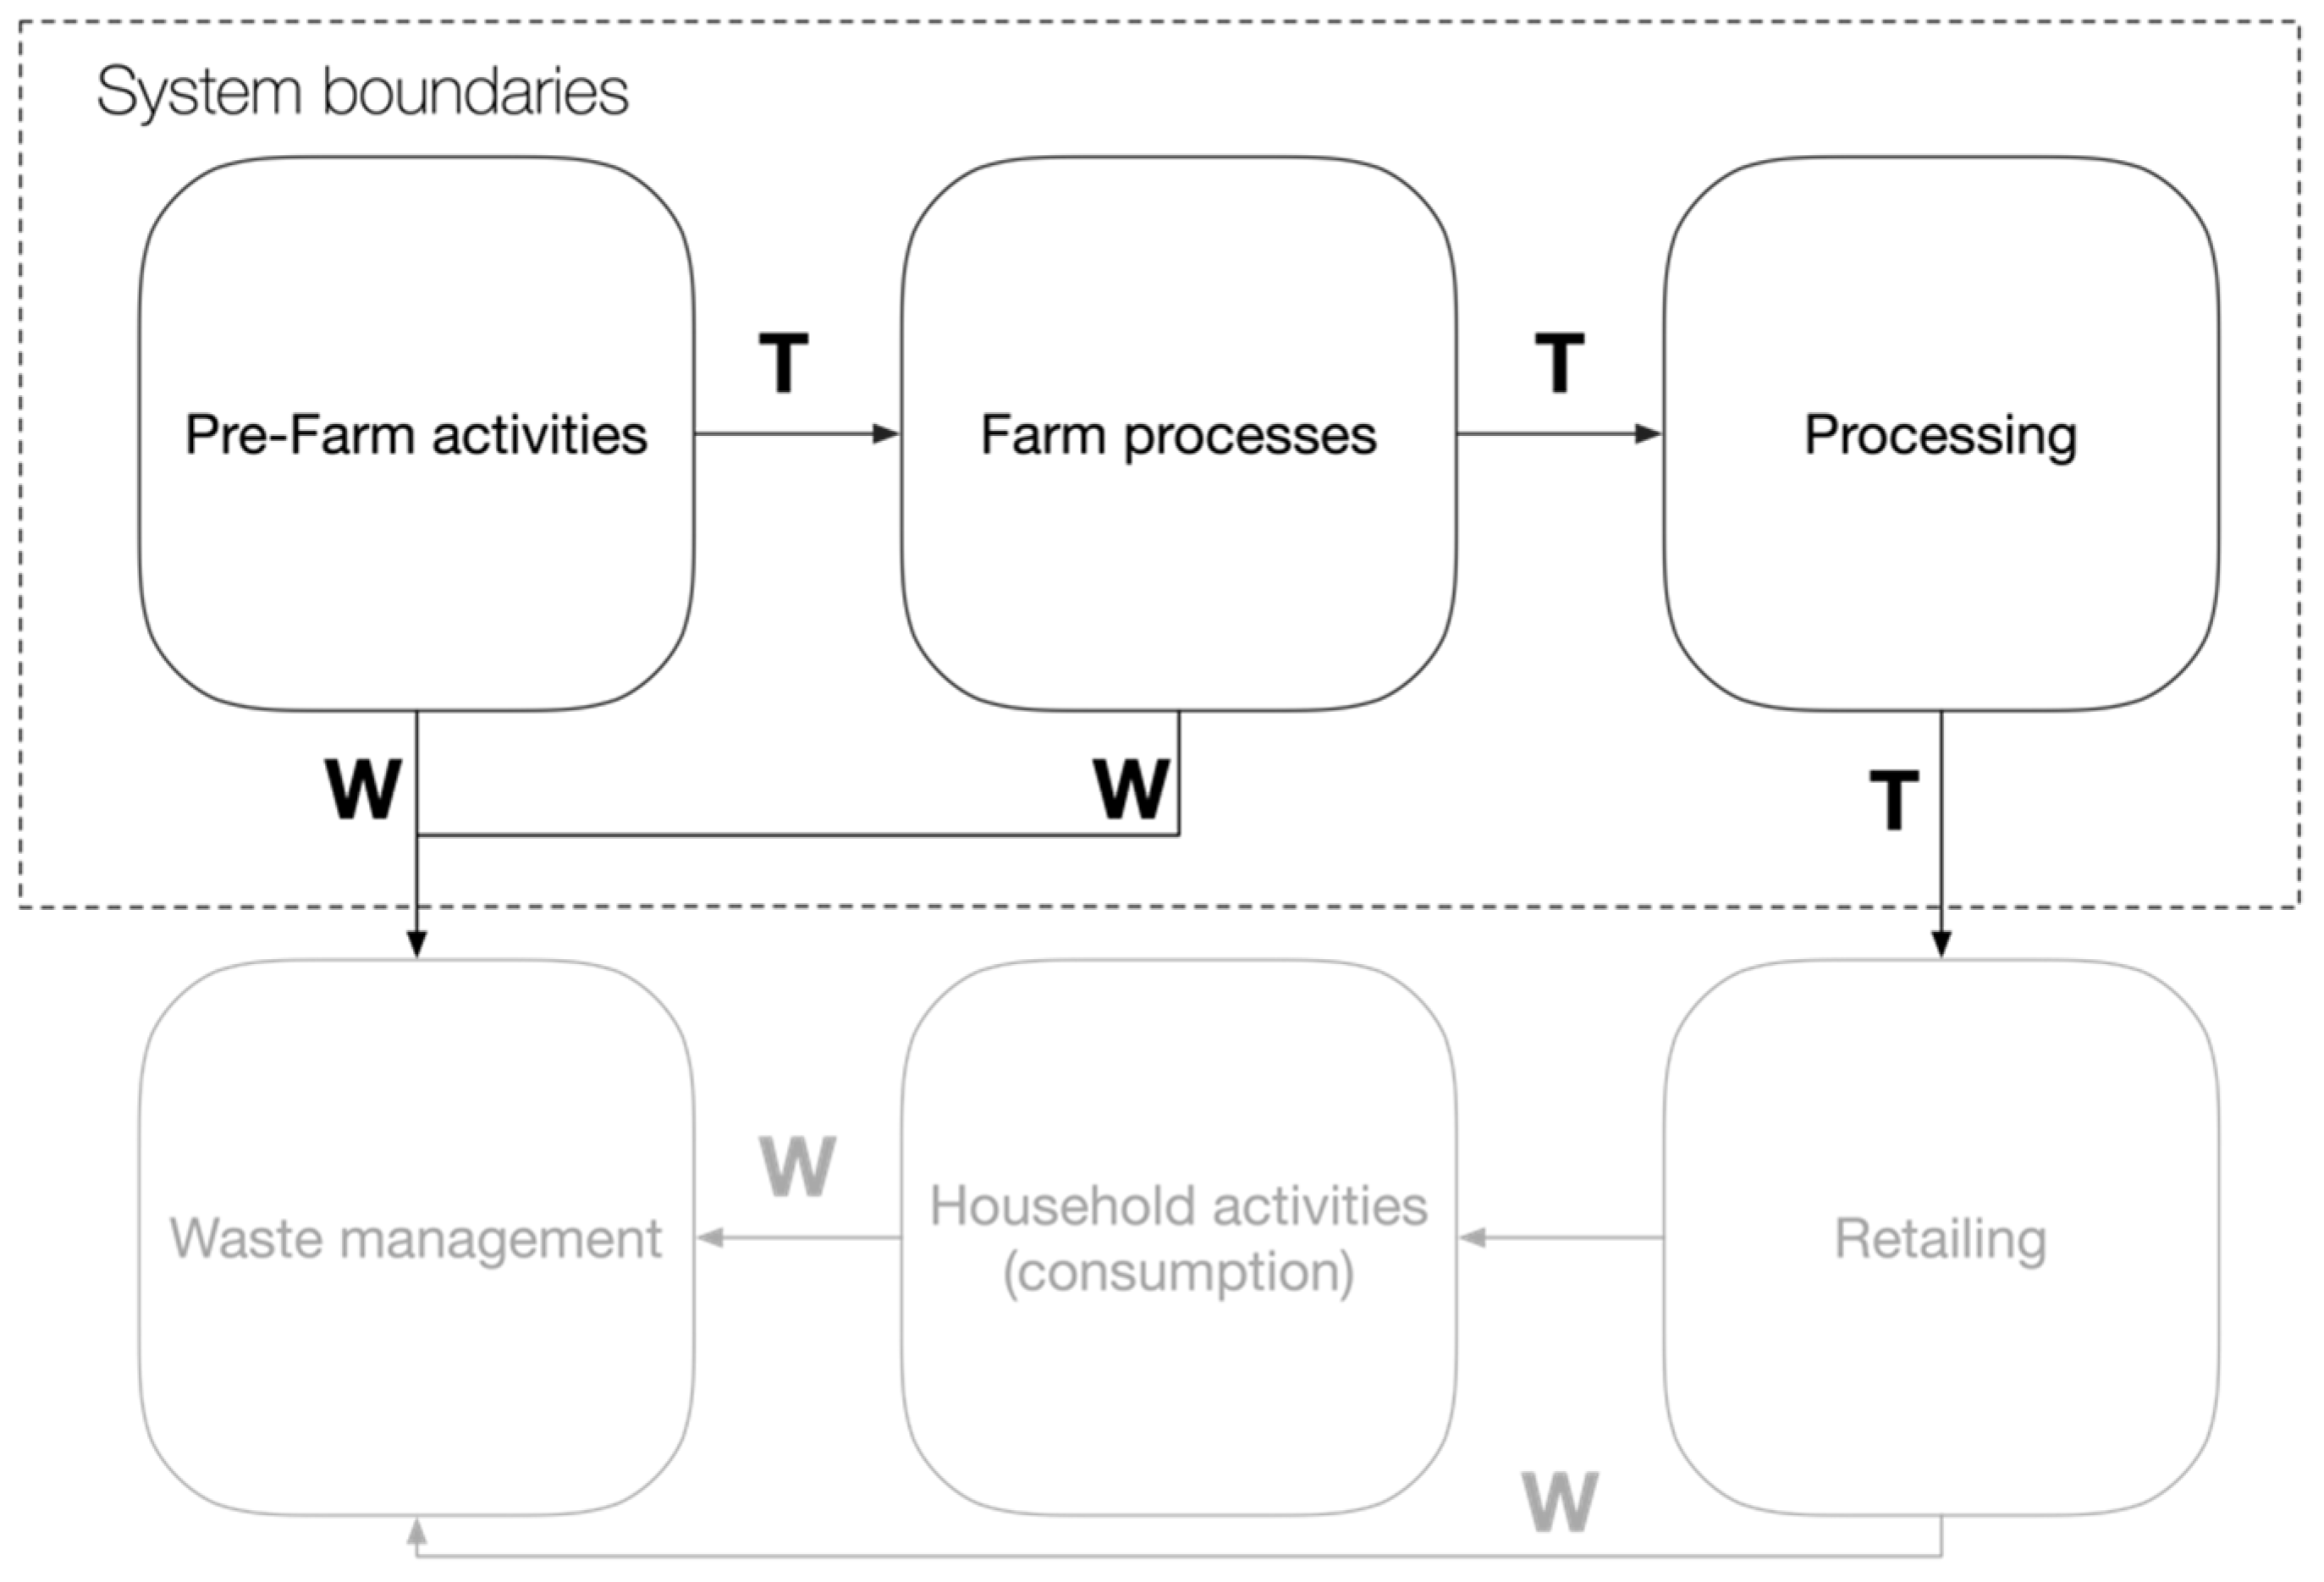
3.2.1. Scope Definition
3.2.2. Life-Cycle Inventory
3.2.3. Life-Cycle Impact Assessment
3.2.4. Statistical Analysis
4. Results and Discussion
4.1. Sample Characteristics
4.2. Food Consumption
4.3. GHG Emissions
4.3.1. GHG Emissions by Sociodemographic Groups
4.3.2. The Effect of Dietary Patterns on GHG Emissions
4.4. Limitations
5. Conclusions
Supplementary Materials
Author Contributions
Funding
Institutional Review Board Statement
Informed Consent Statement
Data Availability Statement
Conflicts of Interest
References
- Akenji, L.; Chen, H. A Framework for Shaping Sustainable Lifestyles; United Nations Environment Programme: Nairobi, Kenya, 2016. [Google Scholar]
- Brundtland, G.H. Our Common Future. Oxford Pap. Geogr. J. 1988, 154, 116. [Google Scholar] [CrossRef]
- Allen, M.R.; Dube, O.P.; Solecki, W.; Aragón-Durand, F.; Cramer, W.; Humphreys, S.; Kainuma, M.; Kala, J.; Mahowald, N.; Mulugetta, Y.; et al. Global Warming of 1.5 °C an IPCC Special Report on the Impacts of Global Warming of 1.5 °C above Pre-Industrial Levels and Related Global Greenhouse Gas Emission Pathways, in the Context of Strengthening the Global Response to the Threat of Climate Change, Sustainable Development, and Efforts to Eradicate Poverty; IPCC: Geneva, Switzerland, 2018. [Google Scholar]
- IPCC. Working Group III Contribution to the Fifth Assessment Report of the Intergovernmental Panel on Climate Change, Climate Change 2014 Mitigation of Climate Change; IPCC: Geneva, Switzerland, 2014. [Google Scholar]
- United Nations. Paris Agreement. In Proceedings of the 21st Conference of Parties, Paris, France, 30 November–11 December 2015; Available online: https://digitallibrary.un.org/record/831039 (accessed on 19 January 2023).
- Lei n. 12.187, de 29 de Dezembro de 2009. In Institui a Política Nacional sobre Mudança do Clima—PNMC e dá Outras Providências; Diário Oficial da União: Brasília, Brasil, 2009. Available online: https://www.planalto.gov.br/ccivil_03/_ato2007-2010/2009/lei/l12187.htm (accessed on 2 January 2023).
- Wilson, J.; Tyedmers, P.; Spinney, J.E.L. An exploration of the relationship between socioeconomic and well-being variables and household greenhouse gas emissions. J. Ind. Ecol. 2013, 17, 880–891. [Google Scholar] [CrossRef]
- IGES; Aalto University; D-mat Ltd. 1.5-Degree Lifestyles: Targets and Options for Reducing Lifestyle Carbon Footprints; Technical Report; Hayama: Osaka, Japan, 2019. [Google Scholar]
- De Boer, I.J.M.; Cederberg, C.; Eady, S.; Gollnow, S.; Kristensen, T.; Macleod, M.; Meul, M.; Nemecek, T.; Phong, L.T.; Thoma, G.; et al. Greenhouse gas mitigation in animal production: Towards an integrated life cycle sustainability assessment. Curr. Opin. Environ. Sustain. 2011, 3, 423–431. [Google Scholar] [CrossRef]
- FAO. FAO Statistical Yearbook 2020—World Food and Agriculture, Food and Agriculture Organization of the United Nations, World Food and Agriculture—Statistical Yearbook 2020; FAO: Rome, Italy, 2020. [Google Scholar]
- Skunca, D.; Tomasevic, I.; Nastasijevic, I.; Tomovic, V.; Djekic, I. Life Cycle Assessment of the Chicken Meat Chain. J. Clean. Prod. 2018, 184, 440–450. [Google Scholar] [CrossRef]
- Feng, W.; Cai, B.; Zhang, B. A Bite of China: Food Consumption and Carbon Emission from 1992 to 2007. China Econ. Rev. 2020, 59, 100949. [Google Scholar] [CrossRef]
- Kanemoto, K.; Moran, D.; Shigetomi, Y.; Reynolds, C.; Kondo, Y. Meat Consumption Does Not Explain Differences in Household Food Carbon Footprints in Japan. One Earth 2019, 1, 464–471. [Google Scholar] [CrossRef]
- Vita, G.; Lundström, J.R.; Hertwich, E.G.; Quist, J.; Ivanova, D.; Stadler, K.; Wood, R. The Environmental Impact of Green Consumption and Sufficiency Lifestyles Scenarios in Europe: Connecting Local Sustainability Visions to Global Consequences. Ecol. Econ. 2019, 164, 106322. [Google Scholar] [CrossRef]
- Thomas, C.; Maître, I.; Symoneaux, R. Consumer-Led Eco-Development of Food Products: A Case Study to Propose a Framework. Br. Food J. 2021, 123, 2430–2448. [Google Scholar] [CrossRef]
- MacDiarmid, J.I. Is a healthy diet an environmentally sustainable diet? Proc. Nutr. Soc. 2013, 72, 13–20. [Google Scholar] [CrossRef] [Green Version]
- Saxe, H.; Larsen, T.M.; Mogensen, L. The global warming potential of two healthy Nordic diets compared with the average Danish diet. Clim. Chang. 2013, 116, 249–262. [Google Scholar] [CrossRef]
- Sonesson, U.; Mattsson, B.; Nybrant, T.; Ohlsson, T. Industrial processing versus home cooking: An environmental comparison between three ways to prepare a meal. Ambio 2005, 34, 414–421. [Google Scholar] [CrossRef]
- Tukker, A.; Goldbohm, R.A.; De Koning, A.; Verheijden, M.; Kleijn, R.; Wolf, O.; Pérez-Domínguez, I.; Rueda-Cantuche, J.M. Environmental impacts of changes to healthier diets in Europe. Ecol. Econ. 2011, 70, 1776–1788. [Google Scholar] [CrossRef]
- Vieux, F.; Darmon, N.; Touazi, D.; Soler, L.G. Greenhouse gas emissions of self-selected individual diets in France: Changing the diet structure or consuming less? Ecol. Econ. 2012, 75, 91–101. [Google Scholar] [CrossRef]
- Weber, C.L.; Matthews, H.S. Food-miles and the relative climate impacts of food choices in the United States. Environ. Sci. Technol. 2008, 42, 10. [Google Scholar] [CrossRef] [Green Version]
- Pathak, H.; Jain, N.; Bhatia, A.; Patel, J.; Aggarwal, P.K. Carbon footprints of Indian food items. Agric. Ecosyst. Environ. 2010, 139, 66–73. [Google Scholar] [CrossRef]
- Chen, D.D.; Gao, W.S.; Chen, Y.Q.; Zhang, Q. Ecological footprint analysis of food consumption of rural residents in China in the latest 30 years. Agric. Agric. Sci. Procedia 2010, 1, 106–115. [Google Scholar] [CrossRef] [Green Version]
- Veeramani, A.; Dias, G.M.; Kirkpatrick, S.I. Carbon footprint of dietary patterns in Ontario, Canada: A case study based on actual food consumption. J. Clean. Prod. 2017, 162, 1398–1406. [Google Scholar] [CrossRef]
- Franco, C.C.; Rebolledo-Leiva, R.; González-García, S.; Feijoo, G.; Moreira, M.T. Addressing the food, nutrition and environmental nexus: The role of socioeconomic status in the nutritional and environmental sustainability dimensions of dietary patterns in Chile. J. Clean. Prod. 2022, 379, 134723. [Google Scholar] [CrossRef]
- López-Olmedo, N.; Stern, D.; Bakhtsiyarava, M.; Pérez-Ferrer, C.; Langellier, B. Greenhouse Gas Emissions Associated with the Mexican Diet: Identifying Social Groups With the Largest Carbon Footprint. Front. Nutr. 2022, 9, 791767. [Google Scholar] [CrossRef]
- Aguiar, R.D.; Costa, G.N.; Simões, G.T.C.; Figueiredo, A.M. Diet-Related Greenhouse Gas Emissions in Brazilian State Capital Cities. Environ. Sci. Policy 2021, 124, 542–552. [Google Scholar] [CrossRef]
- Travassos, G.F.; Cunha, D.A.; Coelho, A.B. The environmental impact of Brazilian adults’ diet. J. Clean. Prod. 2020, 272, 1226222. [Google Scholar] [CrossRef]
- Garzillo, J.M.F.; Poli, V.F.S.; Leite, F.H.M.; Steele, E.M.; Machado, P.P.; Louzada, M.L.d.C.; Levy, R.B.; Monteiro, C.A. Ultra-processed food intake and diet carbon and water footprints: A national study in Brazil. Rev. De Saúde Pública 2022, 56, 6. [Google Scholar] [CrossRef] [PubMed]
- Garzillo, J.M.F.; Machado, P.P.; Leite, F.H.M.; Steele, E.M.; Poli, V.F.S.; Louzada, M.L.d.C.; Levy, R.B.; Monteiro, C.A. Carbon Footprint of the Brazilian Diet. Rev. De Saúde Pública 2021, 55, 90. [Google Scholar]
- GDF. 2021; About Brasilia [WWW Document]. Available online: http://www.df.gov.br/333/ (accessed on 16 March 2021).
- IBGE. 2021; IBGE|Projeção da População. Instituto Brasileiro de Geografia e Estatística. Available online: https://www.ibge.gov.br/apps/populacao/projecao/index.html?utm_source=portal&utm_medium=popclock&utm_campaign=novo_popclock (accessed on 16 March 2021).
- CODEPLAN. PDAD—Pesquisa Distrital por Amostra de Domicílios 2018, in: Relatório Codeplan. Secretaria de Fazenda, Planejamento, Orçamento e Gestão; Governo Do Distrito Federal: Brasília, Brazil, 2019.
- IBGE. IBGE Censo 2010; IBGE: Rio de Janeiro, Brazil, 2010. [Google Scholar]
- IBGE. POF: 2017–2018: Análise do Consumo Alimentar Pessoal No Brasil; Instituto Brasileiro de Geografia e Estatística: Rio de Janeiro, Brazil, 2020.
- ISO 14040:2006; Environmental Management. Life Cycle Assessment. Principles and Framework. International Organization for Standardization: London, UK, 2006.
- ISO 14044:2006; Environmental Management—Life Cycle Assessment—Requirements and Guidelines—Amendment 1. International Organization for Standardization: London, UK, 2006.
- Wernet, G.; Bauer, C.; Steubing, B.; Reinhard, J.; Moreno-Ruiz, E.; Weidema, B. The ecoinvent database version 3 (part I): Overview and methodology. Int. J. Life Cycle Assess. 2016, 21, 1218–1230. [Google Scholar] [CrossRef]
- Asselin-Balençon, A.; Broekema, R.; Teulon, H.; Gastaldi, G.; Houssier, J.; Moutia, A.; Rousseau, V.; Wermeille, A.; Colomb, V. AGRIBALYSE v3.0: La base de données française d’ICV sur l’Agriculture et l’Alimentation. In Methodology for the Food Products; ADEME: Angers, France, 2020. [Google Scholar]
- CONAB. 2019; Portal de Informações Agropecuárias [WWW Document]. Companhia Nacional de Abastecimento. Available online: https://portaldeinformacoes.conab.gov.br/produtos-360.html (accessed on 7 January 2021).
- Guinée, J.B. Handbook on Life Cycle Assessment: Operational Guide to the ISO Standards; Eco-Efficiency in Industry and Science; Springer: Berlin/Heidelberg, Germany, 2002. [Google Scholar]
- Arrais, C.D.S.M.; Contreras, F. Estimativa da contribuição da mobilidade urbana no Distrito Federal para o aquecimento global em 2016. In Proceedings of the 26° Congresso de Iniciação Científica da UnB e 17° do DF, Brasília, Brazil, 7 January 2020. [Google Scholar]
- Koide, R.; Lettenmeier, M.; Akenji, L.; Toivio, V.; Amellina, A.; Khodke, A.; Watabe, A.; Kojima, S. Lifestyle carbon footprints and changes in lifestyles to limit global warming to 1.5 °C, and ways forward for related research. Sus. Sci. 2021, 16, 2087–2099. [Google Scholar] [CrossRef]
- Notarnicola, B.; Tassielli, G.; Renzulli, P.A.; Castellani, V.; Sala, S. Environmental impacts of food consumption in Europe. J. Clean. Prod. 2017, 140, 753–765. [Google Scholar] [CrossRef]
- Arrieta, E.M.; González, A.D. Impact of current, National Dietary Guidelines and alternative diets on greenhouse gas emissions in Argentina. Food Policy 2018, 79, 58–66. [Google Scholar] [CrossRef] [Green Version]
- Dixon, K.A.; Michelsen, M.K.; Carpenter, C.L. Modern diets and the health of our planet: An investigation into the environmental impacts of food choices. Nutrients 2023, 15, 692. [Google Scholar] [CrossRef]
- Silva, V.; Contreras, F.; Bortoleto, A.P. Life-cycle assessment of municipal solid waste management options: A case study of refuse-derived fuel production in the city of Brasilia, Brazil. J. Clean. Prod. 2021, 279, 123696. [Google Scholar] [CrossRef]
- Scarborough, P.; Appleby, P.N.; Mizdrak, A.; Briggs, A.D.; Travis, R.C.; Bradbury, K.E.; Key, T.J. Dietary greenhouse gas emissions of meat-eaters, fish-eaters, vegetarians and vegans in the UK. Clim. Chang. 2014, 125, 179–192. [Google Scholar] [CrossRef] [Green Version]
- Hertwich, E.G. Consumption and the Rebound Effect: An Industrial Ecology Perspective. J. Ind. Ecol. 2005, 9, 85–98. [Google Scholar] [CrossRef] [Green Version]
- EPE—Empresa de Pesquisa Energética. Brazilian Energy Balance 2021 Year 2020; EPE—Empresa de Pesquisa Energética: Rio de Janeiro, Brazil, 2021. [Google Scholar]


| Food Group * | Food Items Restricted for Each Diet | ||||||
|---|---|---|---|---|---|---|---|
| Vegan | Vegetarian | Pescatarian | No Red Meat | No Pork | No Beef | Omnivorous | |
| Beverages | Dairy-based beverages. | - | - | - | - | - | - |
| Dairy products | Milk; Skimmed milk; Milk-based preparations; Smoothie; Cheese; Yogurts; other dairy; diet/light dairy. | - | - | - | - | - | - |
| Meat | Beef; Beef-based preparations; Pork meat; Poultry; Poultry-based preparations; fresh fish; canned fish; sea fish; Fish-based preparations; salted meats; Sausage; Ham; Offals | Beef; Beef-based preparations; Pork meat; Poultry; Poultry-based preparations; fresh fish; canned fish; sea fish; Fish-based preparations; salted meats **; Sausage; Ham; Offals. | Beef; Beef- based preparations; Pork meat; Poultry; Poultry-based preparations; salted meats **; Sausage; Ham; Offals. | Beef; Beef- based preparations; Sausage; Ham; Offals. | Pork meat; Sausage; Ham; Offals. | Beef; Beef- based preparations; Sausage; Offals. | - |
| Snack foods | Fried and baked snacks **. | - | - | - | - | - | - |
| Sweets | chocolates; chocolate powder; milk-based sweets; Ice cream; Honey. | - | - | - | - | - | - |
| Variables | Distribution |
|---|---|
| Age | ≤24: 26.10%, 25–34: 16.37%, 35–44: 17.56%, 45–54: 16.61%. 55–64: 12.46%, ≥65: 10.91% |
| Gender | M: 47.33%, F: 52.57% |
| Household status | Urban: 86.24%, Rural: 13.76% |
| Household type | House: 85.05%, Apartment: 13.64%, Others: 1.30% |
| Household income | ≤1 MW 1: 2.02%, 1–2 MW: 8.90%, 3–5 MW: 25.74%, 6–10 MW: 28.47%, ≥10 MW: 34.88% |
| Per capita disposable income | ≤1 MW: 18.86%, 1–2 MW: 31.91%, 3–5 MW: 29.89%, 6–10 MW: 12.93%, ≥10 MW: 6.41% |
| Food Group | Consumption | ||
|---|---|---|---|
| Total | Mean | ||
| t Day−1 | % | kg Hab−1 Day−1 | |
| Beverages | 1318.167 | 30.355 | 1.907 |
| Cereals | 496.971 | 11.444 | 0.253 |
| Meat | 491.748 | 11.324 | 0.259 |
| Legumes | 451.146 | 10.389 | 0.239 |
| Fruits | 289.080 | 6.657 | 0.145 |
| Dairy products | 219.803 | 5.062 | 0.092 |
| Bread and bakery products | 207.241 | 4.772 | 0.107 |
| Flour and pasta | 160.400 | 3.694 | 0.085 |
| Snack foods | 141.999 | 3.270 | 0.076 |
| Sweets | 116.989 | 2.694 | 0.064 |
| Green vegetables | 103.006 | 2.372 | 0.058 |
| Roots and tubers | 101.429 | 2.336 | 0.050 |
| Soups | 84.984 | 1.957 | 0.045 |
| Vegetables | 56.050 | 1.291 | 0.034 |
| Eggs | 53.860 | 1.240 | 0.025 |
| Fats and oils | 32.958 | 0.759 | 0.017 |
| Mixed preparations | 5.790 | 0.133 | 0.004 |
| Oilseeds | 4.741 | 0.109 | 0.001 |
| Sauces and spices | 3.089 | 0.071 | 0.002 |
| Supplements | 3.030 | 0.070 | 0.002 |
| Food Group | GHG Emissions | |||
|---|---|---|---|---|
| Total | Mean | |||
| t CO2e Day−1 * | % | kgCO2e kg Food−1 ** | kg CO2e Person−1 Day−1 | |
| Beverages | 2077.79 | 18.78 | 1.58 | 0.97 |
| Meat | 6114.61 | 55.27 | 12.43 | 2.85 |
| Cereals | 806.17 | 7.29 | 1.62 | 0.36 |
| Sweets | 9.12 | 0.08 | 0.08 | 0.00 |
| Flour and pasta | 547.88 | 4.95 | 3.42 | 0.25 |
| Fruits | 97.16 | 0.88 | 0.34 | 0.04 |
| Dairy products | 484.97 | 4.38 | 2.21 | 0.19 |
| Vegetables | 17.4 | 0.16 | 0.31 | 0.01 |
| Legumes | 269.63 | 2.44 | 0.6 | 0.13 |
| Sauces and spices | - | - | - | 0.00 |
| Oilseeds | 11.98 | 0.11 | 2.53 | 0.00 |
| Fats and oils | 18.13 | 0.16 | 0.55 | 0.01 |
| Eggs | 26.67 | 0.24 | 0.5 | 0.01 |
| Bread and bakery products | 98.03 | 0.89 | 0.47 | 0.05 |
| Snack foods | 182.41 | 1.65 | 1.28 | 0.07 |
| Mixed preparations | 41.68 | 0.38 | 7.2 | 0.02 |
| Roots and tubers | 18.49 | 0.17 | 0.18 | 0.01 |
| Soups | 222.43 | 2.01 | 2.62 | 0.08 |
| Supplements | - | - | - | 0.06 |
| Green vegetables | 17.84 | 0.16 | 0.17 | 0.06 |
| Variables | Average GHG Emissions (kg CO2e) | p-Value |
|---|---|---|
| Household income | <1 MW: 5.76; 1–2 MW: 5.44; 3–5 MW: 6.24; 6–10 MW: 5.71; >10 MW: 6.37 | 0.4258 |
| Per capita income | <1 MW: 5.93 1–2 MW: 6.40; 3–5 MW: 5.99; 6–10 MW: 5.45; >10 MW: 6.23 | 0.5289 |
| Household status | Rural: 6.42; Urban: 6.00 | 0.3935 |
| Household type | Apartment: 5.29; Home: 6.18; Others: 5.77 | 0.0720 |
| Age | <24: 5.83; 25-34: 6.00; 35–44: 6.42; 45–54: 7.06; 55–64: 6.24; >65: 4.33 | 0.0023 * |
| Gender | F: 5.15; M: 7.06 | 0.0000 * |
| Food Group | p-Value | |||||
|---|---|---|---|---|---|---|
| Household Income | Per Capita Income | Household Status | Household Type | Age | Gender | |
| Beverages | 0.1719 | 0.7928 | 0.0180 * | 0.4970 | 0.0000 * | 0.0343 * |
| Meat | 0.2547 | 0.1117 | 0.7119 | 0.0140 * | 0.0228 * | 0.0000 * |
| Cereals | 0.0001 * | 0.0005 * | 0.0740 | 0.0004 * | 0.3084 | 0.0000 * |
| Sweets | 0.7649 | 0.6021 | 0.7540 | 0.8286 | 0.3769 | 0.0004 * |
| Flour and pasta | 0.4379 | 0.4846 | 0.5198 | 0.1368 | 0.2877 | 0.2395 |
| Fruits | 0.4784 | 0.4091 | 0.1894 | 0.8026 | 0.4150 | 0.0108 * |
| Dairy products | 0.0446 * | 0.0052 * | 0.0049 * | 0.0152 * | 0.3885 | 0.4288 |
| Vegetables | 0.9580 | 0.8389 | 0.0000 * | 0.1291 | 0.2159 | 0.4530 |
| Legumes | 0.0000 * | 0.0001 * | 0.0116 * | 0.1776 | 0.2262 | 0.0000 * |
| Oilseeds | 0.7100 | 0.5514 | 0.2250 | 0.8174 | 0.0166 * | 0.5823 |
| Fats and oils | 0.1551 | 0.5351 | 0.0643 | 0.1962 | 0.2230 | 0.4079 |
| Eggs | 0.6493 | 0.4010 | 0.0060 * | 0.4102 | 0.2986 | 0.0182 * |
| Bread and bakery products | 0.0896 | 0.3196 | 0.9758 | 0.2495 | 0.5378 | 0.2373 |
| Snack foods | 0.0000 * | 0.0232 * | 0.7872 | 0.0025 * | 0.1894 | 0.7493 |
| Mixed preparations | 0.7847 | 0.5843 | 0.4997 | 0.5203 | 0.7047 | 0.1184 |
| Roots and tubers | 0.3094 | 0.5454 | 0.6200 | 0.7558 | 0.1244 | 0.9459 |
| Soups | 0.4551 | 0.4784 | 0.8561 | 0.2652 | 0.6682 | 0.3244 |
| Green vegetables | 0.6154 | 0.5365 | 0.7123 | 0.9449 | 0.4317 | 0.8137 |
Disclaimer/Publisher’s Note: The statements, opinions and data contained in all publications are solely those of the individual author(s) and contributor(s) and not of MDPI and/or the editor(s). MDPI and/or the editor(s) disclaim responsibility for any injury to people or property resulting from any ideas, methods, instructions or products referred to in the content. |
© 2023 by the authors. Licensee MDPI, Basel, Switzerland. This article is an open access article distributed under the terms and conditions of the Creative Commons Attribution (CC BY) license (https://creativecommons.org/licenses/by/4.0/).
Share and Cite
Silva, V.; Contreras, F.; Koide, R.; Liu, C. Analyzing Diets’ Contribution to Greenhouse Gas Emissions in Brasilia, Brazil. Sustainability 2023, 15, 6174. https://doi.org/10.3390/su15076174
Silva V, Contreras F, Koide R, Liu C. Analyzing Diets’ Contribution to Greenhouse Gas Emissions in Brasilia, Brazil. Sustainability. 2023; 15(7):6174. https://doi.org/10.3390/su15076174
Chicago/Turabian StyleSilva, Victor, Francisco Contreras, Ryu Koide, and Chen Liu. 2023. "Analyzing Diets’ Contribution to Greenhouse Gas Emissions in Brasilia, Brazil" Sustainability 15, no. 7: 6174. https://doi.org/10.3390/su15076174
APA StyleSilva, V., Contreras, F., Koide, R., & Liu, C. (2023). Analyzing Diets’ Contribution to Greenhouse Gas Emissions in Brasilia, Brazil. Sustainability, 15(7), 6174. https://doi.org/10.3390/su15076174