Article

How Digital Transformation Affects Urban Resilience: Empirical Evidence from the Yangtze River Delta Region

School of Economics and Management, Zhejiang Normal University, Jinhua 321017, China
*
Author to whom correspondence should be addressed.
Sustainability 2023, 15(7), 6221; https://doi.org/10.3390/su15076221
Submission received: 9 March 2023 / Revised: 29 March 2023 / Accepted: 31 March 2023 / Published: 4 April 2023

Abstract

:
The current regional development crisis and opportunities coexist. On the one hand, the economic environment is complex and volatile, with more and more crisis shocks testing the resilience of urban development, while on the other hand, the rapid development of science and technology such as the digital economy has affected all areas of the economy, life, and governance of cities, bringing opportunities for urban development. The use of digital transformation to enhance urban resilience is therefore an obvious and important topic. Based on panel data of 27 cities in the Yangtze River Delta from 2011 to 2020, this study empirically analyses the impact of digital transformation on urban resilience by constructing a fixed effects model, a mediated effects model and a spatial Du bin model. The study finds that: (1) In terms of time, the urban resilience and digital transformation capacity of the Yangtze River Delta region are both on the rise; From a spatial point of view, the urban resilience of the Yangtze River Delta region basically shows a spatial distribution pattern of “high in the central cities, and low in the peripheral cities”, while the digital transformation capacity basically shows a pattern of “high in the east-central region, and low in the west”. (2) Digital transformation has a significant positive impact on improving urban resilience; (3) Digital transformation enhances urban resilience through three main paths: technological innovation capacity, new economic sector development momentum, and innovation and entrepreneurship development vitality; (4) Digital transformation has a spatial spillover effect on the urban resilience of neighboring regions.

1. Introduction

The current complex and volatile international situation has affected the economic and social development of regions and cities. On the one hand, the development of many cities has been significantly affected by various uncertainties such as the financial crisis, the New Crown epidemic, and international conflicts, such as the sub-prime mortgage crisis that broke out in the United States in 2008, which led to rising unemployment, a credit crunch and the proliferation of slums in metropolitan areas such as New York and Los Angeles (Refer to Sohu related reports: https://business.sohu.com/20071129/n253693909.shtml (1 October 2020)); the trade friction between China and the United States in 2018 has had a major impact on the development of high-end manufacturing in some regions and cities in China [1,2]; COVID-19 spread around the world in 2020, and the economic development of many cities slowed down or even spiraled [3]. To cope with the impact of various uncertainties, many cities have carried out resilient city construction work, such as New York’s “Stronger and More Resilient Plan” in 2013 [4], Shanghai’s “More Sustainable Resilient Eco-City” in 2018 [5], and Guangzhou’s “Safe and Resilient City Plan” in 2019 (https://bbs.zhulong.com/101010_group_678/detail41869906/ (1 October 2020)), and so on. Resilience is a necessary condition for the healthy development of cities, and a key to resisting external risks and maintaining a good state of operation.
On the other hand, science and technology have brought new opportunities for urban development. For example, the wave of digitalization, mainly represented by artificial intelligence and blockchain, has given rise to many new industries, new business models, and new modes in cities, bringing new opportunities for the construction of many cities. For example, the city of Tianjin is using digital technology to promote digital development in the economic, social, and government sectors (https://www.tj.gov.cn/zwgk/szfwj/tjsrmzf/202108/t20210823_5543708.html (1 October 2020)); Shanghai is vigorously promoting digital transformation in the three major areas of economy, life, and governance (https://www.shanghai.gov.cn/nw4411/20210105/3ef138423278450383cbf577945fd131.html (1 October 2020)); Shenzhen is focusing on “government, economy and citizens” and has formulated several opinions on accelerating the construction of smart cities, with a view to building a digital Shenzhen (http://www.sz.gov.cn/gkmlpt/content/8/8394/post_8394420.html#20044 (1 October 2020)). In this environment of both crisis and opportunity, some cities have started to use digital transformation to enhance the resilience of their cities. For example, London, UK, put forward the idea of digital transformation to enhance the resilience of its cities as early as 2009 [6]; the city of Darmstadt, Germany, is actively planning a “digital city development strategy” to promote the digital transformation of its cities [7]. However, due to differences in the use of digital technology, there is a “digital divide” and “data dependency” between different cities, which hinders the construction of resilient cities. In the process of digital transformation, cities may face new risks, such as physical security, functional security, and information security risks, which may lead to vulnerability and reduce the resilience of cities [8]. Therefore, how understanding the impact of digital transformation on urban resilience and how to use digital transformation to enhance urban resilience is a theoretical and practical issue that needs to be explored in depth.
In recent years, the Yangtze River Delta region has been strengthening the foundation of regional integration, and cities are also vigorously promoting digital transformation. For example, Hangzhou has taken the construction of the city brain as the core engine of digital reform, penetrating digital technology into five major areas of policy, society, economy, culture, and ecology to help the digital governance of the city, according to a report, Hangzhou’s digital governance index currently ranks first in China [9]; Wuxi is vigorously promoting the development of a new generation of According to the report, Hangzhou’s Digital Governance Index now ranks first in China [10]; Wuxi is vigorously promoting the development of a new generation of information technology industries and is gradually becoming a leading city in the country in terms of industrial digitalization. In addition, the Yangtze River Delta region is an economically developed urban area in China, and its resilience and development play an important role in China’s regional development. The question to ponder is, how resilient are the cities in the face of various uncertainties at home and abroad? What about the digital transformation of cities? How does the digital transformation of cities affect the resilience of cities? Based on the above considerations, we analyze the direct and indirect impacts of digital transformation on urban resilience and the spatial spillover effects between digital transformation and urban resilience based on measuring the level of digital transformation and urban resilience index of 27 cities in the Yangtze River Delta region respectively, to provide valuable references for the healthy and sustainable development of cities.
The innovations of this paper are: First, the innovation of the research scale. Taking the Yangtze River Delta region as the research object, the impact of digital transformation on urban resilience is investigated from the micro-city level. Second, the innovation of the research content. Through the combination of theoretical analysis and empirical analysis, the direct and indirect effects of digital transformation on urban resilience and the spatial spillover effect of digital transformation on the urban resilience of surrounding areas are analyzed.

2. Literature Review and Theoretical Construction

2.1. Literature Review

TAPSCOT D, the father of the digital economy, sees digital economic transformation as a new driving force for future economic development [11]. Throughout the domestic and international literature, there is an increasing wealth of research literature related to the definition of the connotation, research scale, and measurement methods of digital transformation in academia. Firstly, most scholars define digital transformation around two aspects: digital technology and the significant changes brought about by the practical application of technology. For example, Liang Li, Guo Ai fang and Hess consider digital transformation as the change of business model, business process, and value creation based on digital technology [12,13,14]. Secondly, the research scale of digital transformation has been gradually refined from the provincial to the municipal level, and most of the existing literature has studied digital transformation from the provincial level, e.g., Yang Wen Bo and Li Bai Zhou have studied digital transformation from the provincial level [15,16]. Again, research on digital transformation measurement methods is still in its initial stage, mainly including using dummy variables to classify digital transformation as “yes” or “no” [17,18]; developing their own scales to measure digital transformation based on different dimensions of enterprises [19,20]. The construction of digital maturity models with different dimensions to describe the degree of completion of enterprises in the process of digital transformation [21]; the use of entropy value method to measure the weight of comprehensive evaluation indicators of digital transformation [15,22]; in addition, some scholars use text analysis method to measure the frequency of corresponding keywords in government reports of listed enterprises to measure the level of digital transformation of enterprises [23,24,25]. Further, the rapid development of the digital economy continues to change people’s lives and bring new challenges and opportunities for urban construction. A few scholars have studied the impact of digital transformation on urban resilience from a theoretical perspective, for example, Zhang Chun min believes that the digitization of urban systems promotes engineering and ecological resilience while generating new shocks [8]; Jing Lin Bo believes that the digital economy continues to improve the various subsystems of resilient cities and plays an important role in the construction of resilient cities [26].
Resilience in urban resilience is originally derived from the Latin word “resilio”, which translates as the ability of a system to absorb shocks [27], Holling first introduced resilience into ecology, arguing that resilience determines the durability of relationships within an ecosystem [28]. As scholars at home and abroad continue to study resilience, the concept of resilience has expanded to different disciplines such as ecology, sociology, and economics, and currently, there are three main cognitive views of resilience in academia, namely engineering resilience [29], ecological resilience and evolutionary resilience [30]. After the International Council for Sustainable Development first proposed the term “resilient cities” in 2002, urban resilience has gradually attracted attention. Since 2002, when the International Council for Sustainable Development first proposed the term “resilient cities”, urban resilience has gradually attracted widespread attention in academic circles, and research on it has mainly focused on three aspects, including the concept of urban resilience, theoretical frameworks, and comprehensive evaluation systems. Scholars at home and abroad have not yet formed a consistent concept of urban resilience, such as Alberti’s early view that it is the ability of the urban system to maintain its original state after changes in internal and external development factors of the city [31]; the Resilience Alliance believes that it is the ability of the city to absorb external disturbances and maintain its original function [32]; Zhao Rui dong and Shao Yi wen define it as the city’s ability to adapt, recover and learn in response to external and self-interference factors [33,34]. Scholars’ different perceptions of resilience have led to a wide range of theoretical frameworks for urban resilience, with three main categories of in-depth investigation: disaster risk, urban governance, and complex adaptive systems [35,36,37]. To study the impact mechanisms of urban resilience, urban resilience evaluation has also become one of the hot issues that scholars have focused on. Zhu Jin he and Chen Xiao Hong designed a comprehensive evaluation index system for urban resilience based on the basic components of social, economic, ecological, and engineering factors [38,39]; most scholars designed the index system based on the stage process of urban resilience, such as Sun Hong Xue et al. combined the three stages of resilience, from three dimensions of resistance and recovery, adaptation and innovation and transformation. For example, Sun Hong Xue et al. combined the three stages of resilience and measured the economic resilience of cities from three dimensions: resistance and recovery, adaptation and adjustment, and innovation and transformation [40]; some scholars took the characteristics of cities such as solidity, redundancy and rapidity as the core to construct comprehensive evaluation indicators.
In summary, scholars have begun to focus on the role of the digital economy in promoting urban economic resilience, and some literature has theoretically constructed the evolutionary mechanism of the digital transformation perspective acting on urban resilience [8], but the literature lacks an empirical analysis of the impact of digital transformation on urban resilience and fails to analyze the impact of digital transformation on the urban resilience of surrounding areas. Based on the existing literature, the main contributions of this paper are as follows: first, construct the influence mechanism of digital transformation on urban resilience; second, explore the influence of the indirect impact of digital transformation on urban resilience from the perspectives of technological innovation ability, the development force of new economic sector, and analyze the spatial spillover effect of digital transformation on urban resilience in surrounding areas, enriching the existing research and providing the reference path for resilient city construction.

2.2. Theoretical Construction

Urban resilience is a highly complex coupled system consisting of social, economic, and ecological subsystems that can function normally and have the ability to return to their original state in response to external or its own uncertainties. Analyzed from the perspective of basic city attributes, urban resilience includes four dimensions: social resilience, economic resilience, ecological resilience, and engineering resilience. As a new opportunity for the construction of resilient cities, digital transformation constantly reshapes and integrates the physical and social systems of cities, which directly affects urban resilience; indirectly, it affects urban resilience through technological innovation capacity, the development momentum of new economic sectors, and the vitality of innovation and entrepreneurship development; in addition, the spatial spillover effect of digital transformation on urban resilience is due to the inter-temporal nature of digital economic development. This paper puts forward the theoretical hypothesis that digital transformation affects urban resilience and maps out the theoretical mechanism framework, as shown in Figure 1.

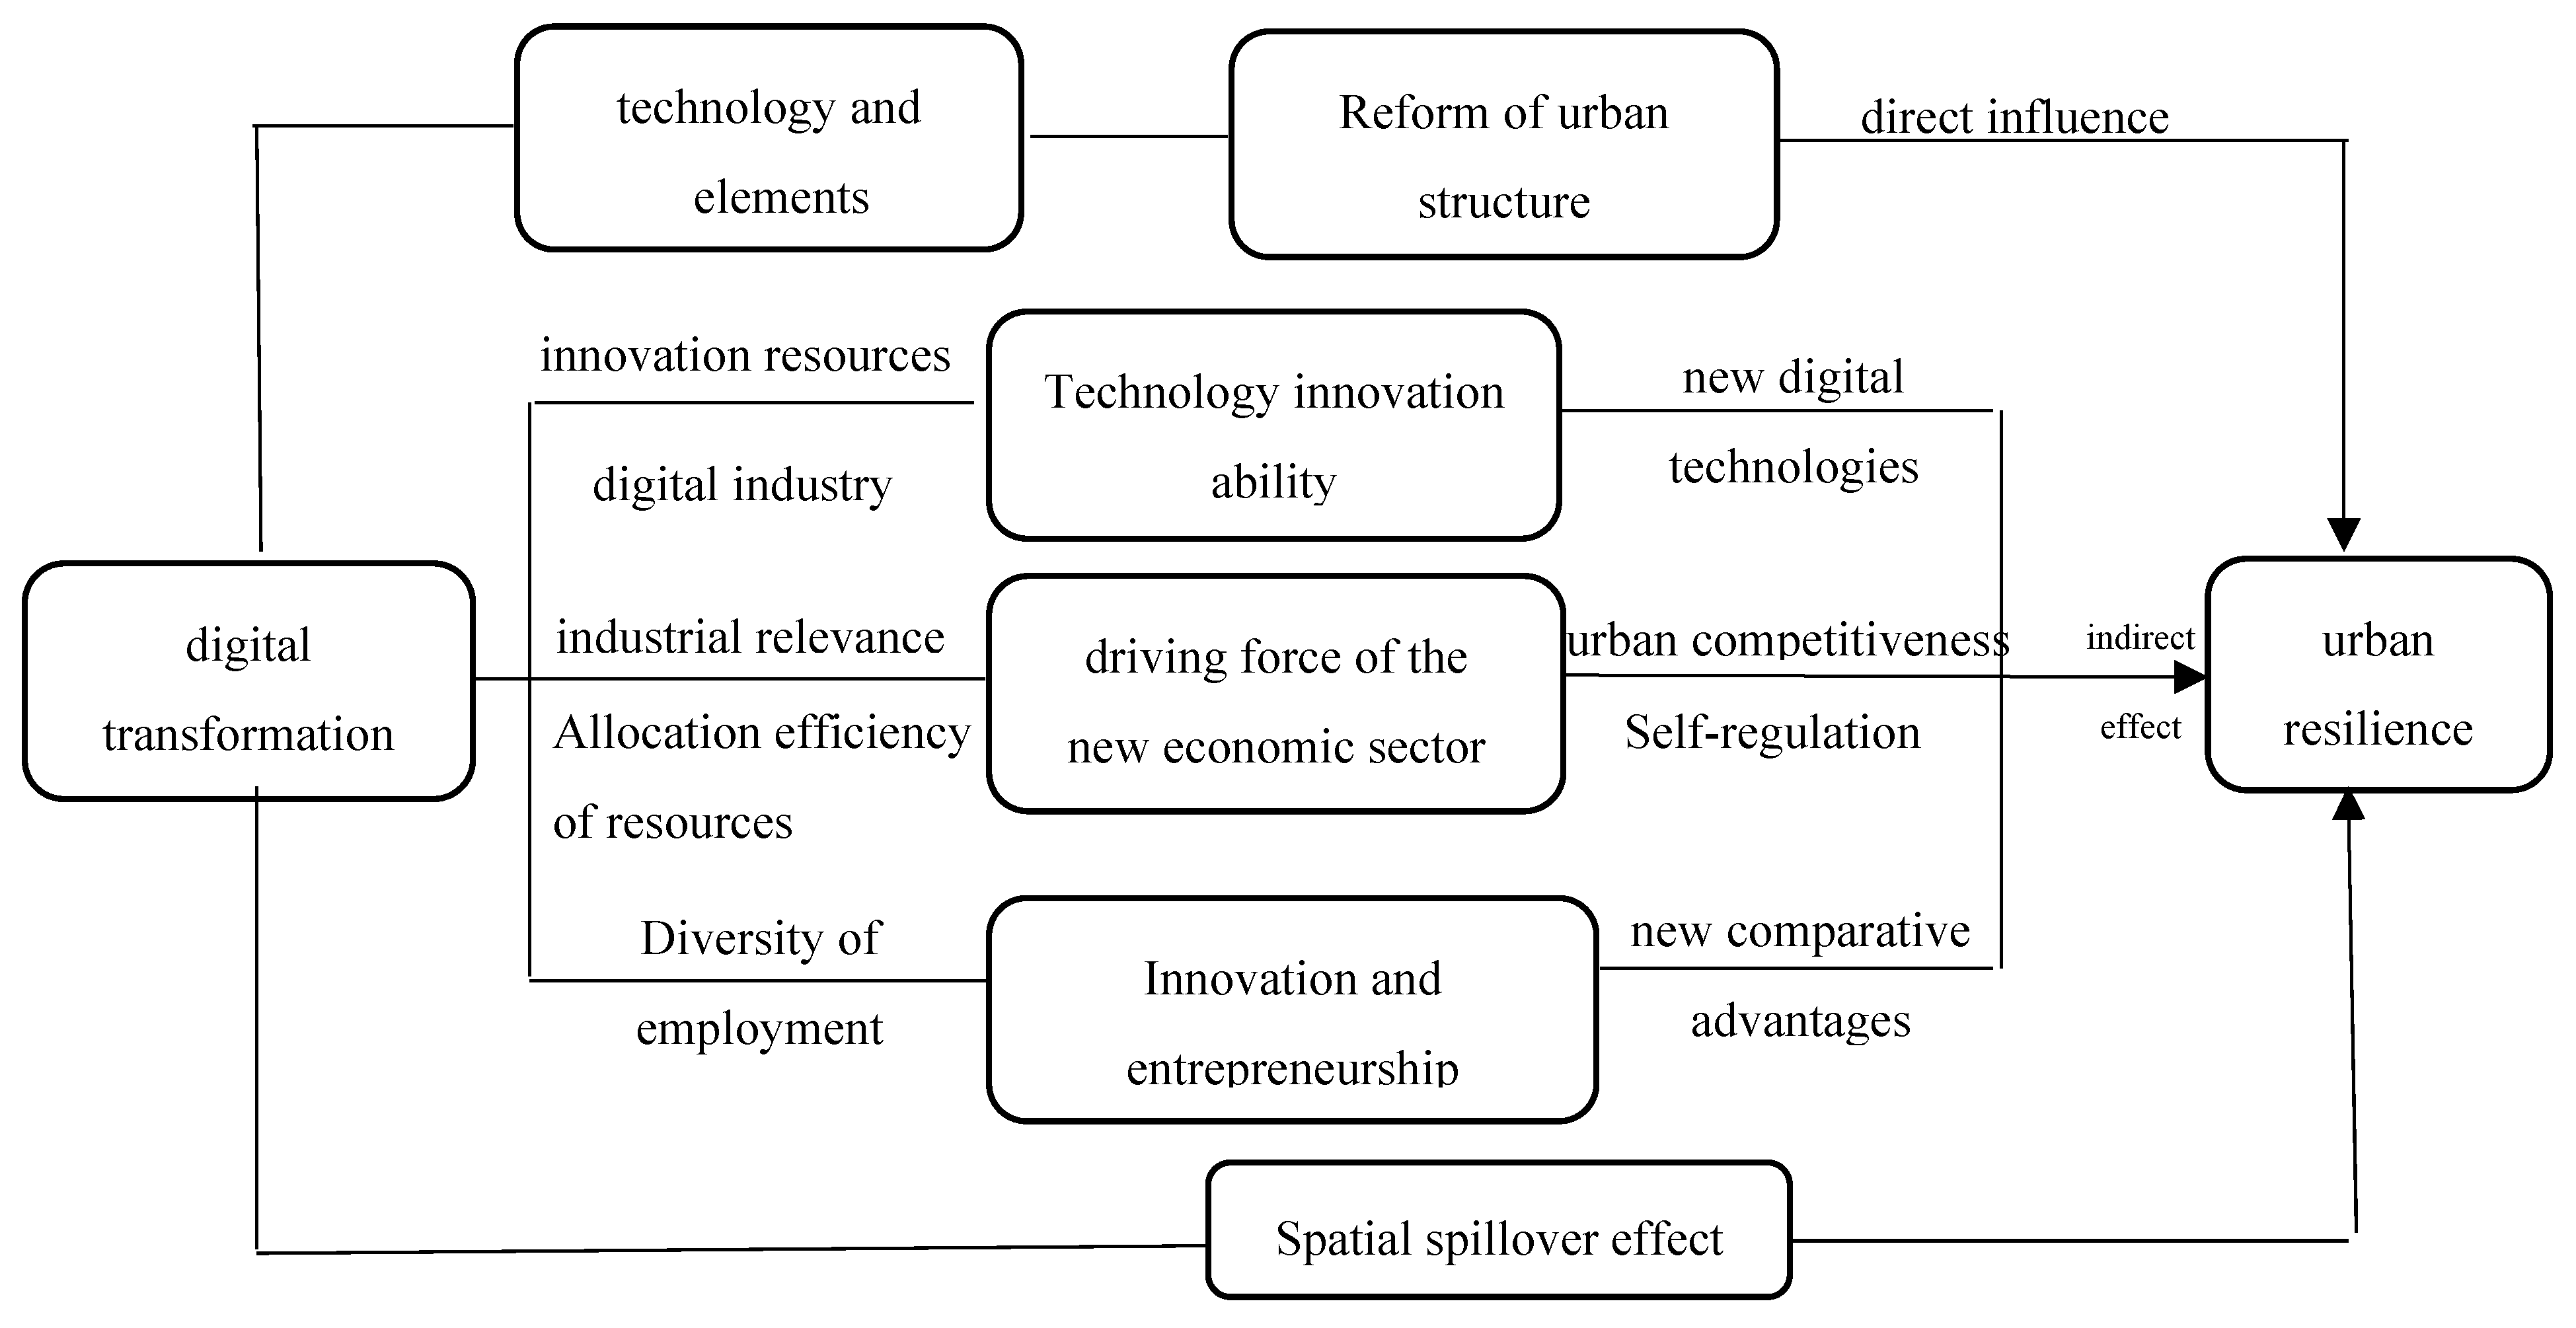
2.2.1. Direct Impact of Digital Transformation on Urban Resilience

Digital technology and data elements are the keys to digital transformation. Digital technology creates new industries, new business models, and new services in cities, reshaping the material system of cities, and the penetration of digital elements promotes changes in the overall structure of urban systems, thus affecting the construction of resilient cities [8]. Firstly, the digital transformation will force the government to change its governance, using digital technology to extend beneficial policies to every household, improve the quality and efficiency of urban residents’ life services, and strengthen the social resilience of the city; secondly, the digital transformation will accelerate the infiltration of data elements into the original economic structure, promote the mutual integration and development of data elements and original production elements, and improve the operational efficiency of factor resources, thereby enhancing the economic resilience of the city; finally Finally, digital transformation will enable digital technology development to be applied to the clothing, food, housing and transportation of urban residents, such as smart healthcare, smart transportation and digital payment, promoting the unimpeded flow of people, resources and logistics in the urban system, improving the allocation of urban infrastructure and environmental resources, and thus enhancing the ecological and engineering resilience of the city. Based on this, this paper proposes theoretical Hypothesis 1.
Hypothesis 1.
There is a significant direct positive impact of digital transformation on improving urban resilience.

2.2.2. Indirect Impact of Digital Transformation on Urban Resilience

The digital transformation not only accelerates the dissemination and circulation of information technology, providing a guarantee to enhance the value of various innovation resources in the city, but also generates an influx of digital industries into the city, stimulating the city’s technological innovation capacity. On the one hand, the value of innovation resources is the key to technological innovation, and digital development promotes the rapid dissemination and circulation of information technology, reducing the cost of matching and searching for various resources, which in turn promotes the technological innovation capacity of cities. On the other hand, digital transformation promotes the integration and development of traditional and information technology industries, and the proportion of ICT industries with concentrated knowledge density and rich innovation resources increases accordingly, further promoting the innovation capacity of the city. Technological innovation capacity enhances the resilience of cities through the extensive research and development and application of digital technologies to create new technologies. Digital transformation will be accompanied by the emergence of new technologies such as emergency and disaster prevention technologies, environmental protection technologies, and intelligent algorithms, which will be applied to urban life and ecosystems to enhance the city’s ability to predict, resist and withstand risks, and urban resilience will be enhanced. Based on this, this paper proposes theoretical Hypothesis 2.
Hypothesis 2.
There is an indirect positive impact of digital transformation on improving urban resilience through technological innovation capabilities.
Digital transformation mobilizes new economic sector dynamics by strengthening industrial linkages and improving resource allocation efficiency. At the same time, the spillover effect of digital technology strengthens the backward and forward relationship between productive service industries and other industries in the industrial chain, strengthens the inter-industry linkage, optimizes the industrial structure of the new economic sector, and mobilizes new economic sector dynamics. Secondly, the development of digital technology in the new economic sector enhances the symmetry of information among market players and improves the efficiency of resource allocation by the market mechanism, thus mobilizing the development momentum of the new economic sector. The development of new economic sectors not only generates new economic growth poles and provides the economic basis for enhancing urban competitiveness, but also can adjust itself flexibly, enhancing the stability of the urban system in response to the occasional shocks of external uncertainties [40]. Based on this, this paper proposes theoretical Hypothesis 3.
Hypothesis 3.
There is an indirect positive impact of digital transformation on enhancing urban resilience through the development of new economic sector dynamics.
Digital transformation activates innovation and entrepreneurship development by increasing the diversity of employment. The development of the digital economy refines the division of labor, creating new jobs and providing more employment opportunities for workers; at the same time, the emergence of digital technologies such as big data and the industrial internet, the digitization and intelligence of the labor force production process, the increased demand for jobs for newly skilled and knowledge-based labor, and the change in the employment structure further activate the dynamism of innovation and entrepreneurship development [41]. The dynamism of innovation and entrepreneurship opens new development paths and creates new comparative advantages for cities, which in turn enhances their ability to adapt to external shocks. Based on this, this paper proposes theoretical Hypothesis 4.
Hypothesis 4.
There is an indirect positive impact of digital transformation on enhancing urban resilience through innovation and entrepreneurship development dynamics.

2.2.3. Spatial Spillover Effects of Digital Transformation on Urban Resilience

Digital transformation is inter-temporal and highly permeable, breaking through the barriers of geographical distance between cities and making the operation of urban systems no longer confined to the inner city; it broadens the depth and breadth of economic operation between cities, thus changing the spatial distribution between cities. Referring to related studies, Zhu Jin he and Sun Hong Xue [37] argue that there is a spatial interaction between the digital economy and urban economic resilience, and therefore the digital transformation’s enhancement of urban resilience should not be limited to a certain region. Based on this, this paper puts forward theoretical Hypothesis 5.
Hypothesis 5.
There is a spatial spillover effect of digital transformation that affects the urban resilience of surrounding areas.

3. Study Design

3.1. Data Sources

This paper takes 27 prefecture-level cities in the Yangtze River Delta region as the research sample and selects the period 2011–2020 as the research period. The data are obtained from the National Statistical Yearbook, China City Statistical Yearbook, and EPS database from 2011 to 2020. The data relating to digital inclusive finance are obtained from the Peking University Digital Inclusive Finance Index (2011–2020) compiled by the Digital Finance Research Centre of Peking University, and the Chinese Government Website Index is obtained from the Research Report on the Development of Chinese Government Websites compiled by the Network Government Research Centre of the State Information Centre.

3.2. Description of Variables

1. Explanatory variable: urban resilience (RES). This paper draws on the research findings of Marta [42], Li Yan Jun and other [43] scholars to measure urban resilience by selecting 25 indicators from four dimensions: social, economic, ecological, and engineering, as shown in Table 1.
To eliminate the influence of the subjective level, this paper refers to the measurement method of the relevant literature and carries out the weight measurement by adding the entropy method of the time variable Specific calculation steps.
The data is first standardized to eliminate the problems arising from differences in the units of measurement of the indicators, and the conversion formula for positive indicators is y a i j = ( x ɑ i j m i n x ɑ i j ) / ( m a x x ɑ i j m i n x ɑ i j ) ; the conversion formula for negative indicators is y a i j = ( m a x x ɑ i j x ɑ i j ) / ( m a x x ɑ i j m i n x ɑ i j ) where m a x x ɑ i j and m i n x ɑ i j represent the maximum and minimum values of the jth indicator e j = k ɑ = 1 m i = 1 n y ɑ i j l n ( y ɑ i j ) , respectively; secondly, the entropy value of the th indicator is calculated e j = k ɑ = 1 m i = 1 n y ɑ i j l n ( y ɑ i j ) , where k = 1 / l n ( m n ) , m is the year and n is the number of cities; again, calculate the weight of each indicator Finally, the urban resilience index of the prefecture-level cities in the Yangtze River Delta region is calculated for the mth year S = w j y ɑ i j .
This paper measures the urban resilience index of 27 cities in the Yangtze River Delta region from 2011 to 2020, the results of which are shown in Table 2, demonstrating the urban resilience index of the Yangtze River Delta region in 2011 and 2020. Overall, the resilience index of all cities in the Yangtze River Delta region shows an increase, with its average value rising from 0.2599 in 2011 to 0.3816 in 2020, an increase of 31.88%. The increase in the resilience index of cities in the Yangtze River Delta region is significant, and the gap between different cities is gradually becoming smaller. Specifically, in 2011 Shanghai, Nanjing, Suzhou, and Hangzhou were in the lead, while Chu Zhou, Chihuahua, and An Qing were lagging behind. 2020 saw a significant increase in the urban resilience index in the Yangtze River Delta region, but there are still significant differences between cities.
In order to study the spatial differentiation characteristics of urban resilience in the Yangtze River Delta, this paper uses ArcGIS 10.8 software to classify the urban resilience indices of 27 cities in the Yangtze River Delta into four grades of low resilience, medium-low resilience, medium-high resilience, and high resilience using the natural discontinuity grading method, corresponding to the following ranges: (0.133800–0.264300), (0.264301–0.338700), (0.338701–0.440000), (0.440001–0.589800). To analyze the evolution pattern of the spatial distribution of urban resilience, this paper takes three years as the interruption point and selects four-time sections in 2011, 2014, 2017, and 2020 to present the spatial distribution pattern of urban resilience of 27 cities in the Yangtze River Delta with a visual map, as shown in Figure 2.
As can be seen from the figure, overall, the number of highly resilient cities in the Yangtze River Delta region has gradually increased, and there are significant differences in the spatial distribution of the resilience levels of the cities in the Yangtze River Delta at different time points, basically showing a spatial distribution pattern of high in the central cities and low in the peripheral cities. Specifically, in 2011, most cities’ resilience was at a low value level, Nanjing and Hangzhou were among the medium-high resilience levels, and only Shanghai was included in the high resilience level, which had not yet formed a significant spatial distribution pattern. 2014 and 2017, Hangzhou stepped into the ranks of high resilience levels, Hefei and Nanjing were in the medium-high resilience level, and the remaining peripheral cities such as An Qing, Yancheng, and Taizhou were in the low resilience level. In 2020, Nanjing and Hefei also entered the ranks of high resilience, while the resilience indices of peripheral cities such as Chi Zhou, Yancheng and Huzhou were at medium to low resilience levels. There are large differences in the spatial distribution of urban resilience in the Yangtze River Delta region.
2. Explanatory variable: digital transformation capability (DT). While most scholars study digital transformation at the provincial and industrial scales, this paper studies digital transformation at the city level, defining it as a dynamic evolutionary process in which digital technologies and digital elements such as blockchain, artificial intelligence, and the Internet drive structural changes in urban systems such as economic industries, social life, and social governance, improving the economic efficiency of urban operations, people’s happiness and the digitization of governance. Based on the above connotation logic, this paper refers to the white paper “Digital Capital Shanghai 2035” published by the Shanghai Municipal Commission of Economy and Informatization [44] and the study by Zhai Yun et al [45]. to construct a comprehensive indicator system for digital transformation from three dimensions: digital life, digital economy, and digital governance, and use the entropy value method to measure the digital transformation capability. The specific indicators are shown in Table 3.
Digital life is the use of digital technology to enhance citizens’ sense of life and happiness, reflecting the digital capability of people’s lives in the city. In this paper, in view of the availability of data and with reference to the research results of Zhao Tao et al. [46], two indicators are selected to measure the development effectiveness of digital life, namely the number of mobile phone users per 100 people and the number of Internet users per 100 people [15,47,48,49]. The digital economy is a series of economic activities with data resources as the key element and digital technology as an important driver for efficiency improvement and optimization of economic structure, and is a mapping of digital transformation in economic activities, i.e., the higher the level of development of digital economy, the stronger the digital transformation capability of the city. In this paper, we choose 10 secondary indicators to measure the digital economy, including telecommunication business income, postal business income, number of people in the information transmission, computer services, and software industry, investment in the information transmission, computer services and software industry, R&D expenditure of industrial enterprises above the scale, number of R&D projects of industrial enterprises above the scale, full-time equivalent of R&D personnel of industrial enterprises above the scale, breadth of digital financial inclusion coverage, depth of digital financial inclusion use, and degree of digitalization of financial inclusion. The 10 secondary indicators measure the development effectiveness of the digital economy, while converting the indicators into relative numbers. Digital governance reflects the digital governance capability of the government. In view of the availability of data, this paper draws on the literature of Wei Lili et al. [50] and selects two indicators to measure digital governance, namely the information disclosure index of government websites and the online service index of government websites.
To observe the time evolution of the degree of digital transformation in the Yangtze River Delta region, this paper shows the results of the digital transformation capability of the Yangtze River Delta region in 2011, 2015, and 2020, as shown in Table 4 below. The mean value rose from 0.15 in 2011 to 0.36 in 2020, an increase of up to 58%. The digital transformation capability index for the Yangtze River Delta region shows that the digital transformation capability index for all 27 cities has increased significantly, with eastern and central regions such as Shanghai, Ningbo, Nanjing, and Hangzhou having a much higher digital transformation capability than the average for the Yangtze River Delta region, while western regions such as Chu Zhou and Chi Zhou have a lower digital transformation capability than the average for the Yangtze River Delta region. Although the digital transformation capability of cities in the Yangtze River Delta has increased significantly over time, the digital transformation capability of cities in the eastern and central regions is relatively stronger, while the digital transformation capability of cities in the western region is the weakest, and there is still a large gap in digital transformation capability between cities.
In order to clearly observe the spatial evolution pattern of digital transformation capability in the Yangtze River Delta region, this paper takes three years as the interruption point and selects four-time sections in 2011, 2014, 2017, and 2020 as the entry point, and adopts the natural interruption point grading method to classify the digital transformation capability of 27 cities in the Yangtze River Delta into four levels: low value level, medium-low value level, medium-high value level and high value level, corresponding to The ranges are: (0.060000–0.180000), (0.180001–0.300000), ([0.300001–0.500000) and (0.500001–0.700000). The visual map is used to present the spatial distribution characteristics of digital transformation in the Yangtze River Delta. See Figure 3 for details.
As can be seen from the figure, the number of cities with increased digital transformation capabilities within the Yangtze River Delta region has gradually increased, and there are significant differences in the spatial distribution of digital transformation capabilities in different time cross-sections, basically showing a spatial distribution pattern of high in the east-central region and low in the west. Cities with high value levels are mainly concentrated in the east-central region, such as Nanjing and Hangzhou, while cities with low value levels are in the western region, such as Chi Zhou, Chu Zhou and Xuan Cheng, and there are significant differences in digital transformation capabilities between different cities. In 2011, four cities in the Yangtze River Delta region, Nanjing, Wuxi, Hangzhou and Jinhua, were at low and medium values, while the rest of the cities were at low values, with no clear spatial distribution differences yet. 2014 saw an increase in digital transformation capabilities, but most cities were still at low and medium values. 2017 saw Hangzhou move to high values, while Hefei, Shanghai and Suzhou were among the cities at medium and high values. The spatial distribution pattern of high in the east-central region and low in the west gradually emerged. 2020 also saw Nanjing and Hefei enter the ranks of the high value level, while Ningbo, Huzhou and Changzhou were included in the medium-high level of digital transformation capability, but the digital transformation capability of cities such as Chi Zhou and Chu Zhou was at the medium-low level. The spatial distribution pattern of cities in the Yangtze River Delta with high digital transformation capability in the east-central region and low capability in the west has become more obvious.
3. Mediating variables: Technological innovation capacity (TIN), in this paper, referring to the literature by Zhu Jinhe and Sun Hong Xue [38] and Xiong Li and Cai Xue Lian [51], the number of patents granted is used to represent technological innovation capacity [52]. In this paper, we refer to the literature of Zhu Jinhe and Sun Hong Xue [40], and use the share of employment in productive services in the total service sector to express the dynamics of new economic sector development. The higher the value, the greater the dynamics of new economic sector development, which increases industrial diversification and enhances the resilience of the urban system to withstand shocks. The higher the value, the stronger the innovation and entrepreneurship development vitality.
4. Control variables: In order to more comprehensively study the impact mechanism of digital transformation on urban resilience, three control variables were selected for this paper. Urban economic density (ECOD), drawing on the study by Yan Hu, Yu Qi Chen and Yan Li [52], is expressed as the ratio of gross regional product to urban land area. Urban economic openness (OPEN), drawing on the literature by Gao Zhi gang and Ding Yu Ying [53], is measured as the ratio of total imports and exports to regional GDP. The strength of urban policy tilt (GOV), drawing on the research of Shi Tao [54], is expressed as the ratio of fiscal expenditure to fiscal revenue.
The results of the descriptive statistics for the main variables in this paper are shown in Table 5.

3.3. Empirical Model

3.3.1. Baseline Regression Model

To investigate the direct impact of digital transformation on urban resilience and to test theoretical Hypothesis 1, a panel fixed effects model was constructed as follows.
R E S i t = α 0 + α 1 D T i t + α 2 Z i t + u i + v i + ε  
where R E S i t   is the explanatory variable, i.e., the urban resilience index. D T i t is the digital transformation capability, while this paper uses the digital transformation X measured by the improved entropy method as a proxy independent variable for robustness testing. Z i t is a set of control variables, mainly including city economic density, city openness to the outside world and city policy tilt. u i denotes individual city fixed effects, v i denotes time fixed effects; and ε denotes the error correction term. If the regression coefficient   α 1 is significantly positive, it proves that digital transformation can improve urban resilience.

3.3.2. Mediating Effect Model

To study the indirect impact of digital transformation on urban resilience and to test theoretical Hypothesis 2, this paper selects technological innovation capacity, new economic sector development dynamics and innovation and entrepreneurship development vitality as mediating variables and constructs a mediating effect model as follows.
M i t = β 0 + β 1 D T i t + β 2 Z i t + u i + v i + ε  
R E S i t = γ 0 + γ 1 D T i t + γ 2 M i t + γ 3 Z i t + u i + v i + ε  
where M i t is the mediating variable; the other variables have the same meaning as in model (1). If the regression coefficients β 1 ,   γ 1 and γ 2 are significantly positive, it indicates that there is an indirect effect of digital transformation to enhance urban resilience, i.e., the mediating variables take up part of the mediating role.

3.3.3. Spatial Econometric Model

To study the spatial spillover effect of digital transformation on urban resilience in the surrounding areas and to test theoretical Hypothesis 3, a spatial Durbin model (SDM) was constructed based on model (1) by adding the explanatory variables, the explanatory variables and the spatial interaction terms of the control variables as follows.
R E S i t = α 0 + ρ W × R E S i t + 1 W × D T i t + α 1 X i t + 2 W × Z i t + α 2 Z i t + u i + v i + ε
where ρ are the spatial auto regressive coefficients, the W is the spatial weight matrix, and the meanings of other variables are consistent with model (1). To ensure the robustness of the empirical results, this paper uses three spatial weight matrices of neighborhood distance, geographical distance, and economic geographical distance for regression.

4. Analysis of Results

4.1. Baseline Regression Analysis

To explore the direct impact of digital transformation on urban resilience, Table 6 presents the results of the benchmark regression. Through the Hausman test, a random effects model is chosen for the baseline regression analysis in this paper. Column (1) shows the regression results of digital transformation on urban resilience, and columns (1)–(5) show the regression results of digital transformation on the secondary indicators of the urban resilience index: social resilience, economic resilience, ecological resilience, and engineering resilience. From the results, we can see that the regression coefficients of digital transformation on urban resilience and the secondary indicators are significantly positive, i.e., digital transformation will enhance urban resilience, which verifies the previous theoretical Hypothesis 1. The regression coefficients of digital transformation on the secondary indicators are 0.2605, 0.0986, 0.0500 and 0.0813 respectively. it can be seen that digital transformation contributes the most to social resilience, followed by economic resilience and engineering resilience, while contributing the least to ecological resilience. This may be because the digital transformation of cities is citizen-centered, with digital technologies and elements constantly penetrating all aspects of social life, such as digital healthcare, digital payments, and digital services, stimulating new demand and improving the quality of life of city residents, thereby enhancing the resilience of urban systems in the event of short-term social stress or cumulative shocks.
The regression coefficients of the control variables show that urban economic density has a facilitating effect on urban resilience, i.e., urban economic density reflects the economic operation rate of cities, provides economic security for urban resilience and enhances the adaptive capacity of cities to resist uncertain shocks; urban openness is an important influencing factor of urban resilience, and has a large and significantly positive coefficient on urban resilience; urban policy tilt has a significantly negative effect on urban The coefficient of urban policy tilt on urban resilience is significantly negative, indicating that excessive government intervention will affect the efficiency of market resource allocation, which in turn disrupts the order of the urban system and reduces the ability of cities to withstand external risks.

4.2. Robustness Tests

To ensure the reliability of the baseline regression results, this paper performs robustness tests through the replacement variable method, the reduced tail treatment method and the adjusted sample method, as shown in Table 7.

4.2.1. Substitution Variable Method

In this paper, a comparative test is conducted by replacing the variable measure, and the study by Chen Tang and Chen Guang [55] is used to replace the entropy value method with the principal component analysis method to measure the comprehensive indicator weights of digital transformation. The effect of digital transformation on urban resilience remains significantly positive after replacing the explanatory variables, and the baseline regression results are robust.

4.2.2. Adjusting the Sample Period

In this paper, the sample time interval was adjusted from 2011–2020 to 2011–2017 for testing. As can be seen from the table, the magnitude of change in the regression coefficients of the variables changed slightly, but the positive and negative signs and significance did not change significantly, indicating that the impact of digital transformation on urban resilience remained significantly positive and the baseline regression results were robust.

4.2.3. Tailoring

Referring to the study by Li Bo Zhou and Zhang Mei [16], the explanatory variables were tail-shrunk to avoid the effect of extreme values by replacing samples with 99th percentile values that were larger than the 99th percentile and replacing samples with 1st percentile values that were smaller than the 1st percentile, and the results were consistent with the baseline regression results.

4.2.4. Tool Variable Method

The study has an endogeneity problem. On the one hand, there are missing variables in the process of the impact of digital transformation on urban resilience, which leads to the endogenous problems of the model; on the other hand, digital transformation and urban resilience are mutually reverse causal. The improvement of urban resilience further promotes regional digital transformation, which makes the empirical results error. Therefore, this paper draws on the research of Pan Ai Min [56] et al., selects the post and telecommunications data from 1984 from cities in the Yangtze River Delta region as the tool variable, and uses the tool variable method to solve the endogenous problem. To facilitate the study of panel data, the number of Internet users in the previous year was multiplied by the number of posts and telecommunications per 10,000 people in each city in 1984 to form the final tool variable and replace the digital transformation capability (DT). As can be seen from the results of (5) in Table 7, digital transformation still has a positive impact on urban resilience at the 1% significance level. The results of observing the LM and Wald F statistics proved to be no problem with weak instrumental variables. Comparing columns (4) and (5), regardless of whether the control variables are added or not, the tool variables have a positive effect on urban resilience, which further shows that the empirical results are still reliable after full consideration of endogeneity.

4.3. Analysis of Mediating Effects

To verify the indirect effect of digital transformation on urban resilience, this paper uses stepwise regression to test the mediating effect mechanism, the results of which are shown in Table 8.

4.4. Analysis of Spatial Spillover Effects

Before conducting the spatial regression analysis, we need to examine the spatial autocorrelation of digital transformation and urban resilience of each city, and this paper uses the Moran index method to test and calculate the global Moran index of digital transformation and urban resilience under the spatial matrix of geographical distance and economic distance respectively, as shown in Table 9. The results show that the global Moran indices of both digital transformation and urban resilience under both spatial matrices are greater than zero and both reach the 10% significance level, i.e., there is a positive spatial correlation between digital transformation and urban resilience, indicating that both variables have spatial clustering characteristics. In addition, the LM test, Hausman test, LR test, and finally the individual fixed spatial Durbin model were selected to test the spatial spillover effect in this paper in turn.
To accurately assess the spatial spillover effect of digital transformation on urban resilience, the total effect is decomposed in this paper, and the results of the direct, indirect, and total effects are reported in Table 10. Both the direct and total spatial spillover effects of digital transformation on urban resilience in the Yangtze River Delta region are significantly positive at the 5% level, while the regression coefficient of the indirect effect is negative and insignificant, indicating that the positive direct effect of digital transformation This indicates that the positive direct effect of digital transformation and the negative indirect effect neutralize each other and take the lead in the urban resilience of the surrounding area through the total spatial spillover effect, which verifies theoretical Hypothesis 5.
In summary, the results of the baseline regression analysis show that the regression coefficients of digital transformation on urban resilience and the secondary indicators are all significantly positive, i.e., digital transformation will enhance urban resilience, verifying theoretical Hypothesis 1; the results of the intermediary effect analysis show that three intermediary effects play an indirect positive role in digital transformation affecting urban resilience, i.e., digital transformation does have an indirect positive effect on urban resilience through technological innovation capacity, new economic sector development dynamics and innovation The results of the analysis of the spatial spillover effect indicate that digital transformation has a positive contribution to the urban resilience of the region and a positive spatial spillover effect on the urban resilience of the surrounding areas, further proving that digital transformation acts on the urban resilience of the surrounding areas through the spatial spillover effect, verifying theoretical Hypotheses 2–5.

5. Conclusions and Recommendations

5.1. Key Findings

The main findings of the study are as follows.
(1)
The urban resilience index of the Yangtze River Delta region shows an increasing trend in time; there are obvious regional differences in space, basically showing a spatial distribution pattern of “high in the central cities and low in the peripheral cities”. The digital transformation capability shows an upward trend over time, but the cities in the east-central region a have stronger digital transformation capability, while the cities in the west have the weakest digital transformation capability; the spatial distribution is uneven, showing a spatial distribution pattern of “high in the east-central region and low in the west”.
(2)
Digital transformation has a positive contribution to improving urban resilience and secondary indicators in the Yangtze River Delta region, with digital transformation contributing the most to social resilience, followed by economic resilience and engineering resilience, and the least to ecological resilience; this conclusion still holds after three robustness tests using the substitution variable method, the reduced tail treatment method, and the adjusted sample method.
(3)
Digital transformation indirectly contributes to urban resilience through the positive mediating effect of enhancing technological innovation capacity, new economic sector development dynamics and innovation and entrepreneurship development vitality, and the mediating effect of technological innovation level and innovation and entrepreneurship vitality is more obvious, i.e., technological innovation capacity, new economic sector development dynamics and innovation and entrepreneurship development vitality in the process of digital transformation are important paths to enhance urban resilience.
(4)
Using the global Moran index method, it is found that both digital transformation and urban resilience have positive spatial correlation, i.e., both variables have spatial clustering characteristics; and the positive direct effect of digital transformation and the negative indirect effect neutralize each other and take the lead in acting on the resilience of neighboring cities through the positive spatial spillover total effect, further proving that digital transformation can act on the urban resilience of neighboring areas through the spatial spillover effect.

5.2. Policy Recommendations

Digital transformation accelerates the development of individual cities, improves their ability to resist shocks and the level of resilient city construction, and promotes the stable and healthy development of cities. As an early demonstration area for high-quality economic development, the Yangtze River Delta has a good social foundation for digital transformation. It is important to take digital transformation as an opportunity to create new advantages for development and promote the coordinated development of the overall region while properly coping with the impact of external environmental changes and maintaining healthy and stable city operations.
First, develop digital industries and enhance technological innovation capabilities. On the one hand, promote the digital industrialization of enterprises and the digitization of industries in the city, grasp the advantages of the dividends generated by the development of digital industries, and reshape the resilience of the city. On the other hand, we will vigorously develop a new generation of digital technology, combine digital technology and city construction, breakthrough core technology bottlenecks, and enhance the city’s ability to cope with external risks.
Second, strengthen industrial linkages and enhance the added value of products. One, encourage leading enterprises in various fields in cities to strive to seize new heights in the development of the digital economy, take advantage of the inter-temporal and spillover nature of digital technology, strengthen the backward and forward linkages of industrial chains, strengthen industrial linkages between cities in the region, and enhance the resilience of cities in coping with external risks. Second, develop productive service industries with high-end and specialization as the core, encourage cities to prioritize the development of new economic sectors with high added value, enhance urban competitiveness and strengthen the stability of urban systems to cope with occasional shocks from external uncertainties.
Thirdly, we should strengthen the sharing of resources to achieve synergistic development. On the one hand, the sharing of digital resources should be strengthened to facilitate coordination and mutual learning among cities, thereby enhancing their resilience in coping with external risk shocks. On the other hand, the government must implement differentiated policies according to local conditions, encourage the development of special digital industries, narrow the differences in digital transformation among cities, achieve synergistic development, and enhance the resilience of cities.

Author Contributions

The research topic, writing, review, supervision, and funding were all handled by H.Z. and M.Q. was in charge of the analysis and investigation, data collection, and the writing of the first draft. All authors have read and agreed to the published version of the manuscript.

Funding

This research was funded by the Zhejiang Provincial Social Science Planning Project “The Mechanism and Realization Path of Digital Enabling Industrial Cluster Resilience” (23NDJC109YB).

Institutional Review Board Statement

Not applicable.

Informed Consent Statement

Informed consent was obtained from all subjects involved in the study.

Data Availability Statement

The dataset is available upon reasonable request.

Conflicts of Interest

The authors declare no conflict of interest.

References

  1. Zhao, X. The impact and countermeasures of Sino-US trade friction on China’s manufacturing in 2025—Based on the survey and analysis of manufacturing enterprises in Foshan. North. Econ. 2018, 11, 25–28. [Google Scholar]
  2. Li, D.; Xi, F.; Cen, X. Research on the impact of Sino-US trade friction on Tianjin’s manufacturing industry. Mod. Ind. Econ. Informatiz. 2021, 11, 13–16. [Google Scholar]
  3. Xiao, X.Y.; Mei, S.Y.; Liu, R.; Wang k Deng, Q.; Huang, L.; Yu, F. The impact of the new crown epidemic on the urban development of the Beijing-Tianjin-Hebei urban agglomeration: A case study of Beijing, Tianjin, and Shijiazhuang. J. Tsinghua Univ. (Nat. Sci. Ed.) 2023, 3, 1–9. [Google Scholar]
  4. Tao, X.D. The resilience construction of megacities: The Experience and Enlightenment of New York. Urban Plan. 2023, 20, 1–8. [Google Scholar]
  5. Qian, S.H.; Xu, G.; Shen, Y.; Guo, C.; Wang, W.; Zhang, M.Q.; Zhou, L.; Du, F.; Liu, L.; Zhang, J. Exploring the path of Shanghai to build a resilient city. J. Urban Plan. 2017, 3, 9–118. [Google Scholar]
  6. Chu, T.J.; Chen, H.H.; Ding, J.F.; Yu, L.; Xu, X.L. A study of resilience in the digital transformation of London. Glob. Urban Stud. (Engl. Chin.) 2022, 3, 140–155+193. [Google Scholar]
  7. Li, Y.; Lin, W. Darmstadt’s “Digital City Development Strategy”—Insights from the Digital Transformation of German Cities. Glob. Urban Stud. 2022, 3, 52–67+190–191. [Google Scholar]
  8. Zhang, C. The institutional basis, evolutionary mechanism, and realistic path of resilient city construction in digital transformation. Guizhou Soc. Sci. 2021, 7, 123–130. [Google Scholar]
  9. Jiang, Z.; Duan, W.; Zhang, J.Z. Digital transformation in Hangzhou: History, experience, and insights. Glob. Urban Stud. (Engl. Chin.) 2022, 3, 128–139+192–193. [Google Scholar]
  10. Ma, W. Wuxi explores a “new course” for digital transformation. Xinhua Dly. 2021, 9, 1. [Google Scholar]
  11. Tapscot, D. The Digital Economy: Promise and Peril in the Age of Networked Intelligence; McGraw-Hill: New York, NY, USA, 1996. [Google Scholar]
  12. Li, L.; Su, F.; Zhang, W.; Mao, J.Y. Digital transformation by SME entrepreneurs: A capability perspective. Inf. Syst. J. 2018, 28, 1129–1157. [Google Scholar] [CrossRef]
  13. Guo, A.; Zhou, M.; Wang, S.; Sun, Y.; Yang, Y.X. Research on the concept, dimensions, and measurement of digital transformation of corporate innovation ecosystem. Sci. Manag. 2022, 42, 1–9. [Google Scholar]
  14. Hess, T.; Matt, C.; Benlian, A.; Wiesböck, F. Options for Formulating a Digital Transformation Strategy. MIS Q. Exec. 2016, 15, 1–2. [Google Scholar]
  15. Yang, W.B. Digital transformation measurement and regional convergence of Chinese industries. Econ. Syst. Reform 2022, 1, 111–118. [Google Scholar]
  16. Li, B.Z.; Zhang, M. The mechanism of digital transformation on regional economic quality development—The moderating role of regional innovation capacity. Syst. Eng. 2022, 40, 57–68. [Google Scholar]
  17. Ferreira, J.J.; Fernandes, C.I.; Ferreira, F.A. To be or not to be digital, that is the question: Firm innovation and performance. J. Bus. Res. 2019, 101, 583–590. [Google Scholar] [CrossRef]
  18. Shi, Y.P.; Wang, Y. Business environment and digital transformation of enterprises: Impact performance and mechanism of action. J. Beijing Jiao Tong Univ. (Soc. Sci. Ed.) 2022, 21, 14–28. [Google Scholar]
  19. Meng, T.; Zhao, F.; Zhang, B.C. Digital transformation, dynamic capabilities, and business model adaptation in enterprises. Econ. Manag. 2021, 35, 24–31. [Google Scholar]
  20. Chi, M.-M.; Ye, D.-L.; Wang, J.-J.; Zhai, S.-S. How small and medium-sized manufacturing enterprises in China can improve their new product development performance—Based on the perspective of digital empowerment. Nankai Manag. Rev. 2020, 23, 63–75. [Google Scholar]
  21. Zhang, L.-G.; Dai, G.-Q.; Xiong, Y.; Geng, W.-Y. Evaluation of digital transformation in China’s manufacturing industry and influencing factors—A qualitative comparative analysis based on fuzzy sets. Sci. Technol. Manag. Res. 2022, 42, 68–78. [Google Scholar]
  22. Duan, X.; Xu, C. Research on the coupling and coordination of digital transformation and high-quality development in China’s manufacturing industry. Xinjiang Financ. Econ. 2022, 42, 5–17. [Google Scholar]
  23. Wu, F.; Hu, H.; Lin, H.; Ren, X. Corporate digital transformation and capital market performance—Empirical evidence from stock liquidity. Manag. World 2021, 37, 130–144+10. [Google Scholar]
  24. Zhao, C.-Y.; Wang, W.-C.; Li, X.-S. How digital transformation affects total factor productivity of enterprises. Financ. Trade Econ. 2021, 42, 114–129. [Google Scholar]
  25. Yuan, C.; Xiao, T.; Geng, C.; Sheng, Y. Digital transformation and corporate division of labor: Specialization or vertical integration. China Ind. Econ. 2021, 9, 137–155. [Google Scholar]
  26. Jing, L.B. The theoretical connotation and operational logic of resilient cities and their new opportunities in the context of digital economy. Guizhou Soc. Sci. 2021, 1, 108–115. [Google Scholar]
  27. Aura, R. Network resilience for transport security: Some methodological considerations. Transp. Policy 2013, 28, 63–68. [Google Scholar]
  28. Holling, C.S. Resilience and Stability of Ecological Systems. Annu. Rev. Ecol. Syst. 1973, 8, 1–23. [Google Scholar] [CrossRef] [Green Version]
  29. Rose, A. Economic resilience to natural and man-made disasters: Multidisciplinary origins and contextual dimensions. Environ. Hazards 2007, 7, 383–398. [Google Scholar] [CrossRef]
  30. Simmie, J.; Martin, R. The economic resilience of regions: Towards an evolutionary approach. Camb. J. Reg. Econ. Soc. 2010, 3, 27–43. [Google Scholar] [CrossRef] [Green Version]
  31. Alberti, M. The Effects of Urban Patterns on Ecosystem Function. Int. Reg. Sci. Rev. 2005, 28, 168–192. [Google Scholar] [CrossRef]
  32. Resilience Alliance. Urban Resilience Research Prospectus; Australia CSIRO: Canberra, Australia, 2007; Volume 7, p. 2. [Google Scholar]
  33. Zhao, R.-D.; Fang, C.-L.; Liu, H.-M. Progress and prospects of urban resilience research. Adv. Geo-Graph. Sci. 2020, 39, 1717–1731. [Google Scholar] [CrossRef]
  34. Shao, Y.; Xu, J. Urban resilience: A conceptual analysis based on an international literature review. Int. Urban Plan. 2015, 30, 48–54. [Google Scholar]
  35. Cutter, S.L.; Barnes, L.; Berry, M.; Burton, C.; Evans, E.; Tate, E.; Webb, J. A place-based model for understanding community resilience to natural disasters. Glob. Environ. Change 2008, 18, 598–606. [Google Scholar] [CrossRef]
  36. Jabareen, Y. Planning the resilient city: Concepts and strategies for coping with climate change and environmental risk. Cities 2013, 31, 220–229. [Google Scholar] [CrossRef]
  37. Qiu, B.X. Methods and principles of resilient city design based on complex adaptive systems theory. Urban Dev. Res. 2018, 25, 1–3. [Google Scholar]
  38. Zhu, J.H.; Sun, H.X. Study on the spatial and temporal evolution of urban resilience and influencing factors in three major urban agglomerations in China. Soft Sci. 2020, 34, 72–79. [Google Scholar]
  39. Chen, X.H.; Lou, J.N.; Wang, Y. Spatio-temporal pattern evolution and dynamic simulation of urban resilience in Ha-Chang urban agglomeration. Geoscience 2020, 40, 2000–2009. [Google Scholar]
  40. Zhu, J.H.; Sun, H.X. Does the digital economy enhance the economic resilience of cities? Mod. Econ. Inq. 2021, 10, 1–13. [Google Scholar]
  41. Zhao, T.; Zhang, Z.; Liang, S. Digital economy, entrepreneurial activity, and high-quality development—Empirical evidence from Chinese cities. Manag. World 2020, 36, 65–76. [Google Scholar]
  42. Suárez, M.; Gómez-Baggethun, E.; Baniyas, J.; Tilbury, D. Towards an Urban Resilience Index: A Case Study in 50 Spanish Cities. Sustainability 2016, 8, 774. [Google Scholar] [CrossRef] [Green Version]
  43. Li, Y.; Ma, G.; Song, S. Spatial divergence and evolution of urban resilience in the middle reaches of Yangtze River urban agglomeration. Reg. Econ. Rev. 2022, 2, 88–96. [Google Scholar]
  44. Lu, F.; Yin, W.; Liu, N. Study on the spatial and temporal evolution of industrial resilience in the Yangtze River Delta urban agglomeration and the influencing factors. World Geogr. Res. 2021, 30, 589–600. [Google Scholar]
  45. Opinions on the Comprehensive Promotion of Shanghai’s Digital Transformation of the City Announced. 2022. Available online: https://www.shanghai.gov.cn/nw4411/20210105/3ef138423278450383cbf577945fd131.html (accessed on 8 March 2023).
  46. Zhai, Y.; Jiang, M.; Wang, W. Theoretical interpretation and operational mechanism of digital transformation in China. E-Government 2021, 6, 67–84. [Google Scholar]
  47. Zhou, X.; Liu, Y.; Peng, L.Y. Digital economy development and green total factor productivity improvement. Shanghai Econ. Res. 2021, 12, 51–63. [Google Scholar]
  48. Xu, W.; Zhou, J.; Liu, C. Spatial effects of digital economy development on urban carbon emissions. Geogr. Stud. 2022, 41, 111–129. [Google Scholar]
  49. Liu, V.; Yu, M.Y. Coupling and coordination analysis of digital industrialization and industrial digitization in the Yangtze River Economic Belt. Yangtze River Basin Resour. Environ. 2021, 30, 1527–1537. [Google Scholar]
  50. Wei, L.; Hou, Y. Research on the impact of digital economy on green development of Chinese cities. Res. Quant. Econ. Technol. Econ. 2022, 39, 60–79. [Google Scholar]
  51. Xiong, L.; Cai, X. The impact effect of digital economy on the improvement of regional innovation capacity--an empirical study based on the Yangtze River Delta city cluster. East China Econ. Manag. 2020, 34, 1–8. [Google Scholar]
  52. Hu, Y.; Chen, Y.; Li, Y. Research on the impact of digital economy on the economic resilience of cities in the Yangtze River Delta region. J. East China Norm. Univ. (Philos. Soc. Sci. Ed.) 2022, 54, 143–154+175–176. [Google Scholar]
  53. Gao, Z.G.; Ding, Y.Y. Resilience measurement and influencing factors of cities in Northwest China. Sci. Technol. Her. 2021, 39, 118–129. [Google Scholar]
  54. Shi, T. Spatial and temporal evolution of the level of urban resilience development in the Yellow River Basin and analysis of the driving factors. Reg. Econ. Rev. 2022, 1, 139–149. [Google Scholar]
  55. Chen, T.; Chen, G. Study on the spatial effect of digital transformation on industrial structure upgrading—An empirical analysis based on static and dynamic spatial panel models. Econ. Manag. Res. 2021, 42, 30–51. [Google Scholar]
  56. Pan, A.M.; Wu, Y. Digital economy, spatial effect, and urban economic resilience—Based on empirical evidence in East China. J. Jilin Ind. Bus. Coll. 2022, 38, 5–13. [Google Scholar]
Figure 1. Theoretical mechanisms.
Sustainability 15 06221 g001
Figure 2. (a) Spatial distribution of the RES in 2011; (b) Spatial distribution of the RES in 2014; (c) Spatial distribution of the RES in 2017; (d) Spatial distribution of the RES in 2020.
Sustainability 15 06221 g002
Figure 3. (a) Spatial distribution of the DT in 2011; (b) Spatial distribution of the DT in 2014. (c) Spatial distribution of the DT in 2017; (d) Spatial distribution of the DT in 2020.
Sustainability 15 06221 g003
Table 1. Comprehensive urban resilience evaluation system.
Tier 1
Indicators
Secondary IndicatorsTertiary IndicatorsIndicator Attributes
Urban
resilience
Social
resilience
Disposable income per inhabitant+
Average wage of employees in employment+
Urban Engel Coefficient+
Population growth rate+
Total retail sales of consumer goods as a proportion of GDP+
Registered urban unemployment rate
Number of urban basic medical insurance participants per 10,000 population+
Public administration and social organization personnel as a proportion of total population+
Social security expenditure as a proportion of fiscal expenditure+
Economic resilienceGDP per capita+
Public revenue as a percentage of GDP+
Total social fixed asset investment per capita+
Share of actual foreign capital utilized in GDP+
Tertiary sector as a share of GDP+
Ecological resilienceGreenery coverage in built-up areas+
Green space per capita+
Industrial SO per unit of GDP2 Emissions
Industrial smoke (dust) emissions per unit of GDP
Harmless disposal rate of domestic waste+
Integrated utilization rate of industrial solid waste+
Centralized treatment rate of urban domestic sewage+
Engineering toughnessDensity of drainage pipes in built-up areas+
Water consumption per capita+
Urban road area per capita+
Number of buses per 10,000 people+
Note: “+” Represents a positive effect; “−” Represents a negative effect.
Table 2. Urban resilience levels in the Yangtze River Delta region.
CityCity Resilience IndexCityCity Resilience Index
20112020Increase (%)20112020Increase (%)
Average value0.25990.381631.88Jiaxing0.26730.411435.03
Shanghai0.46340.48243.94Huzhou0.27190.416934.78
Nanjing0.36880.528930.27Shaoxing0.22870.369338.07
Wuxi0.25630.378232.23Jinhua0.23010.370637.91
Changzhou0.34680.451723.22Zhoushan0.26080.434439.96
Suzhou0.38340.506624.32Taizhou0.19940.325138.67
Nantong0.24730.346128.55Hefei0.2790.466940.24
Yancheng0.22140.28422.04Wuhu0.2170.327833.80
Yangzhou0.27020.351323.09Ma’anshan0.22550.373539.63
Zhenjiang0.26420.373729.30Tong Ling0.2230.291123.39
Taizhou0.20840.331937.21An Qing0.13380.247645.96
Hangzhou0.36260.505728.30Chu Zhou0.18720.315240.61
Ningbo0.32170.440026.89Chi Zhou0.18090.318343.17
Wenzhou0.21130.329335.83Xuan Cheng0.18730.324542.28
Table 3. A comprehensive evaluation system for digital transformation and urban resilience.
Tier 1 IndicatorsSecondary IndicatorsTertiary IndicatorsIndicator Attributes
Digital transformation capabilitiesDigital LifeMobile phone subscribers per 100 population+
Internet users per 100 population+
Digital
Economy
Revenue from telecom services/GDP of the region+
Postal revenue/GDP of the region+
Number of persons in the information transmission, computer services, and software industry as a percentage+
Percentage of completed investment in the information transmission, computer services, and software industry+
Number of R&D projects in industrial enterprises above the scale/Total number of people in the region+
Full-time equivalents of R&D personnel in industrial enterprises above the size/total number of persons in the region+
R&D expenditure of industrial enterprises above the scale/GDP of the region+
Breadth of digital financial inclusion coverage+
Depth of use of digital inclusive finance+
Digitization of financial inclusion+
Digital
governance
Government Website Information Disclosure Index+
Government website online service index+
Table 4. Levels of digital transformation in the Yangtze River Delta.
CityDigital Transformation
Capabilities
CityDigital Transformation
Capabilities
201120152020201120152020
Average value0.150.250.36Jiaxing0.130.200.30
Shanghai0.180.300.50Huzhou0.130.240.38
Nanjing0.240.440.57Shaoxing0.140.230.30
Wuxi0.200.320.36Jinhua0.220.240.33
Changzhou0.180.270.40Zhoushan0.160.290.30
Suzhou0.180.290.41Taizhou0.120.210.28
Nantong0.140.210.30Hefei0.170.300.57
Yancheng0.100.180.28Wuhu0.110.230.42
Yangzhou0.130.220.33Ma’anshan0.100.200.29
Zhenjiang0.170.250.39Tong Ling0.140.210.29
Taizhou0.130.200.29Anqing0.060.180.34
Hangzhou0.220.400.68Chu Zhou0.110.180.23
Ningbo0.170.290.42Chi Zhou0.090.160.23
Wenzhou0.150.250.35Xuan Cheng0.090.190.25
Table 5. Descriptive statistics of the variables.
CategoryVariable NameSymbolsObservationsMean ValueStandard DeviationMinimum ValueMaximum Value
Explained variablesCity Resilience IndexRES2700.32680.08430.13380.5911
Explanatory variablesDigital transformation capabilitiesDT2700.25840.09780.06150.6844
Intermediate variablesTechnological innovation capabilitiesTIN2704.79991.21171.65057.2426
New economic sector development driversNES2700.20360.09520.05940.9908
Innovation and entrepreneurship development dynamicsENTR2700.24030.12250.00630.5665
Control variablesUrban economic densityECOD2700.81460.90070.0456.1037
Openness of the city to the outside worldOPEN2700.06310.05310.00690.282
City policy tiltGOV2701.41640.53380.5133.4108
Table 6. Baseline regression results.
Variables(1)(2)(3)(4)(5)
DT0.4672 ***0.2605 ***0.0986 ***0.0500 ***0.0813 ***
(15.55)(14.25)(8.88)(9.06)(7.41)
ECOD0.0152 ***0.0065 *−0.0008−0.00110.0032
(2.57)(1.91)0.36−1.16(1.36)
OPEN0.5389 ***0.2830 ***0.0908 **0.0194 *0.1931 ***
(6.61)(5.62)(2.43)(1.34)(5.34)
GOV−0.0101 *0.0104 **−0.0219 ***0.0034 **−0.0041
(1.15)(2.06)(6.00)(2.43)(1.17)
Constant term0.1741 ***0.0283 ***0.0720 ***0.0460 ***0.0276 ***
(10.29)(2.89)(9.89)(16.28)(3.94)
R20.780.680.320.130.51
Note: *, **, *** represent significant at 10%, 5%, 1% levels respectively, z-values in brackets.
Table 7. Robustness tests.
Variables12345
DT0.0354 **0.4041 ***0.2815 ***0.3198 ***0.4413 ***
(2.28)(10.73)(18.05)(2.3)(10.12)
ECOD0.0656 ***0.0414 ***0.0102 ** 0.0232 ***
(10.48)(5.23)(1.83) (3.24)
OPEN0.1746 *0.2719 ***0.4792 *** 0.4623 ***
(6.35)(2.93)(5.8) (8.46)
GOV0.0137−0.0283 ***−0.0102 ** −0.0192 ***
(1.23)(−2.64)(−1.99) (−3.73)
KP rk LM statistic 18.413036.0960
[0.0000][0.0000]
KP rk Wald Fstatistics 68.65168.6510
【16.3800】【16.3800】
constant term0.2016 ***0.2089 ***0.1967 ***0.2441 ***0.1919 ***
(7.54)(9.88)(12.32)(6.55)(13.41)
R20.530.770.770.410.78
Note: *, **, *** represent significance at 10%, 5%, 1%, levels respectively, z-values in brackets;【】represents the critical cut-off at the 10% level of Stock Yogo weak identification test, [] represents the p-values of the LM statistic.
Table 8. Intermediary mechanism test.
Variables(1) ResTechnological
Innovation
Capabilities
New Economic
Sector Development Drivers
Innovation and
Entrepreneurship Development
Dynamics
(8) Triple Mediated
Effects
Regression
(2)
TIN
(3)
RES
(4)
NES
(5)
RES
(6)
ENTR
(7)
RES
DT0.47 ***3.92 ***0.38 ***0.22 ***0.46 ***0.61 ***0.39 ***0.30 ***
(15.55)(11.23)(10.45)(3.29)(15.08)(8.73)(11.98)(8.06)
TIN 0.02 *** 0.02 ***
(4.40) (4.02)
NES 0.05 * 0.06 **
(1.77) (2.35)
ENTR 0.14 ***0.13 ***
(5.62)(5.57)
Control variablesYESYESYESYESYESYESYESYES
Constant term0.17 ***3.08 ***0.10 ***0.12 ***0.17 ***0.01 *0.17 ***0.10 ***
(10.25)(12.89)(4.17)(3.35)(10.17)(0.29)(10.59)(4.50)
R20.780.450.750.300.790.440.770.76
Note: *, **, *** represent significance at 10%, 5%, 1% levels, respectively, z-values in brackets.
Table 9. Global Moran Index of digital transformation and urban resilience.
YearDigital TransformationUrban Resilience
Geographical
Distance Matrix
Economic Geography MatrixGeographical
Distance Matrix
Economic
Geography Matrix
20110.23 ***0.41 ***0.43 ***0.42 ***
(1.60)(3.49)(4.78)(3.66)
20120.19 *0.392 ***0.37 ***0.412 ***
(1.34)(3.36)(4.03)(3.60)
20130.24 *0.449 ***0.24 ***0.33 ***
(1.57)(3.86)(2.87)(3.01)
20140.3 *0.423 ***0.24 **0.334 ***
(1.49)(3.73)(2.86)(2.99)
20150.41 *0.419 ***0.26 ***0.354 ***
(2.26)(3.71)(3.02)(3.18)
20160.42 ***0.522 ***0.28 ***0.292 ***
(4.57)(4.51)(3.27)(2.72)
20170.29 ***0.384 ***0.22 ***0.239 **
(3.49)(3.74)−2.66(2.26)
20180.26 ***0.336 ***0.26 ***0.277 ***
(3.12)(3.30)(3.03)(2.52)
20190.34 ***0.322 **0.33 ***0.323 ***
(3.88)(2.98)(3.52)(2.79)
20200.26 ***0.237 **0.3 ***0.366 ***
(3.07)(2.23)(3.36)(3.13)
Note: *, **, *** represent significance at 10%, 5%, 1% levels, respectively, z-values in brackets.
Table 10. Spatial model regression results.
Matrix TypeSARSDM
Geographical Distance MatrixEconomic
Geography Matrix
Geographical Distance MatrixEconomic
Geography Matrix
DT0.3322 ***0.3255 ***0.2848 ***0.3427 ***
(8.50)(7.98)(6.07)(8.11)
W*DT −2.3677 **0.2215 **
(−2.03)(2.03)
Direct effects0.3350 ***0.3274 ***0.3172 ***0.3515 ***
(8.27)(7.81)(6.19)(7.87)
Indirect effects−0.0675−0.0022−1.91790.2847
(−1.3)(−0.10)(−1.76)(−2.37)
Total effect0.2675 ***0.3296 *0.0101 **0.6362 ***
(4.78)(7.76)(7.11)(4.62)
Control variablesYESYESYESYES
R20.750.760.720.81
Log-likelihood504.48503.69509.10514.57
Note: *, **, *** represent significance at 10%, 5%, 1% levels, respectively, z-values in brackets.
Disclaimer/Publisher’s Note: The statements, opinions and data contained in all publications are solely those of the individual author(s) and contributor(s) and not of MDPI and/or the editor(s). MDPI and/or the editor(s) disclaim responsibility for any injury to people or property resulting from any ideas, methods, instructions or products referred to in the content.

