Article

Assessment of Sustainability and Efficiency Metrics in Modern Methods of Construction: A Case Study Using a Life Cycle Assessment Approach

1
Escuela de Construcción Civil, Facultad de Ingeniería, Pontificia Universidad Católica de Chile, Casilla 306, Correo 22, Santiago 8331150, Chile
2
Escuela de Ingeniería, Facultad de Ingeniería y Arquitectura, Universidad Central de Chile, Av. Santa Isabel 1186, Santiago 8370178, Chile
*
Author to whom correspondence should be addressed.
Sustainability 2023, 15(7), 6267; https://doi.org/10.3390/su15076267
Submission received: 3 February 2023 / Revised: 16 March 2023 / Accepted: 3 April 2023 / Published: 6 April 2023

Abstract

:
The construction industry faces various sustainability challenges, and modern methods of construction (MMC) have been promoted as an effective alternative to mitigate environmental impact and improve productivity. However, to gain a thorough understanding of the benefits, there is a need for more objective data. To address this, the present study employs a simplified life-cycle assessment (LCA) methodology to evaluate a set of environmental and efficiency metrics in a case study. The study aims to demonstrate the benefits of using an MMC known as the “VAP system” by comparing it with its conventional counterpart built with reinforced masonry. Adopting the MMC resulted in significant reductions in embodied carbon (EC) and embodied energy (EE) related to materials, as well as a reduction in global warming potential (GWP), cumulative energy demand (CED), and construction waste. Additionally, it shortened delivery times and increased labor productivity. Furthermore, when both local and European parameters were considered in the evaluation, the percentage of materials circularity (PMC) was higher. The study concludes that the adoption of the MMC leads to higher sustainability by reducing carbon emissions, minimizing construction waste, and conserving resources. This research has significant implications for promoting the adoption of MMC globally, leading to more sustainable and efficient construction practices.

1. Introduction

The building industry is facing major challenges such as high carbon emissions, lack of productivity, labor scarcity, and construction and demolition waste (CDW) [1,2,3]. The construction sector is responsible for approximately 40% of natural resource depletion and 25% of global waste [4]. Buildings are one of the largest CDW contributors, and it is estimated that approximately 35% of all CDW generated worldwide goes to landfills without any further treatment [5]. This occurs in a context where circularity is only 8.6% worldwide [6], and it is estimated that 57% of the materials’ total value is lost, even though these materials can be valued [7]. In addition, buildings account for significant proportions of energy consumption and energy-related greenhouse gases (GHG), which in 2020 accounted for 36% and 37%, respectively, of the worldwide total [8]. The construction sector also has exhibited lower productivity compared to the manufacturing sector for decades [1], which is concerning given that it is one of the largest sectors in the world economy, accounting for between 5 and 7% of the total gross domestic product in most countries [9]. Thus, the building sector is a major player in terms of improving efficiency and reducing environmental impacts globally.
Therefore, it is imperative that dwellings be built using low environmental impact and high-efficiency construction methods. This is especially important given the current housing shortage, escalating material prices, and scarcity of construction labor [10]. To overcome these challenges, integrating innovation and technology into the design and construction processes can be a viable solution [1,2,3]. Adopting a more industrialized approach to construction that incorporates off-site construction (OSC) techniques can pave the way to achieving greater productivity and sustainability in buildings [11,12].
The implementation of a more industrialized approach to construction can yield multiple benefits, such as improved construction timings, cost reduction, high-quality projects, improved productivity, construction waste reduction, reduced uncertainties, GHG emission reduction, improved project integration and client satisfaction, and addressing labor shortages [11,12]. Despite these benefits, there are still hindrances that need to be addressed, such as a lack of a comprehensive understanding of these benefits and the negative perception of the stakeholders involved in the projects [11,13,14].
The majority of the literature pertaining to industrialized construction techniques, such as OSC, tends to focus on the advantages and disadvantages of this methodology rather than presenting a comprehensive quantitative analysis [15]. Furthermore, it is noteworthy that systematic analyses, such as life cycle assessment (LCA), which can evaluate the potential impacts of industrialized buildings, often concentrate on particular aspects of a building instead of offering comparable variables between conventional and non-traditional buildings throughout their life cycle [11].
The future of industrialized building construction will rely on adopting an integrated and holistic architectural view toward durability, compatibility, adaptability, and reversibility attributes, following circular principles in building design [16,17]. Despite the lack of quantitative methods to measure these attributes in buildings [17,18,19], there are currently some metrics related to material circularity that can apply to any industry that intends to analyze the circularity of its processes [20,21].
In accordance with previous precedents and in recognition of the growing importance of industrialized construction techniques in enhancing efficiency and sustainability throughout a building’s life cycle [22], the primary objective of this study is to analyze environmental and efficiency metrics to quantitatively demonstrate the benefits of using such techniques through a simplified LCA approach. Specifically, a case study will be conducted to compare a house that employs an MMC known as the “VAP system” with its conventional building counterpart that uses a traditional material such as bricks [23]. The significance and contributions of this study are outlined below:
  • The article presents a quantitative analysis based on the contrast of an MMC with its traditional counterpart built in reinforced masonry, utilizing an LCA approach, which is scarce. The results of this analysis offer valuable new insights, which can help to instill confidence in stakeholders involved in building projects that incorporate innovations. Moreover, this research presents a compelling case for the construction industry to adopt new construction methods that have been proven to be more efficient and sustainable, supported by rigorous facts rather than subjective evidence [11,16].
  • The study aims to address the lack of focused measurements of materials circularity in buildings [24,25] by including the percentage of material circularity (PMC) metric in the comparative analysis. This is an innovative contribution to the building field that promotes the development of sustainable and circular construction practices.
By presenting the study findings, this research will make a valuable contribution to the ongoing conversation surrounding sustainable construction techniques.
This document is structured into six sections. Section 2 provides a review of the literature on industrialized building terms, environmental building assessment, and building circularity. Section 3 discusses the VAP system and the respective case study, followed by the methodology adopted for the study in Section 4. Section 5 presents and discusses the results, and Section 6 concludes the study, highlighting the contributions and findings.

2. Background

2.1. Industrialized Building and Related Terms

Researchers have discussed the concept of OSC and its related terms such as MMC or industrialized building (IB), among others, finding that these are used interchangeably and that diversification of the concept exists according to several contexts and background knowledge [11,26,27]. OSC relates to the manufacturing and pre-assembly processes of building elements, components, or modules before their final installation on site [11]. IB and MMC are broader terms than OSC. MMC embraces a range of techniques that provide innovative alternatives to conventional housing construction, most of which are off-site technologies but could also incorporate some on-site techniques [28,29]. IB is related to “industrialized construction”, which relates mechanization, standardization, and prefabrication in an industrial process that integrates a design for manufacturing and assembly (DfMA) as well as digital and optimization tools (BIM, lean construction tools, etc.) to resolve the challenges within construction projects, where components manufactured in a controlled environment are transported, positioned and assembled into a structure with a minimized use of resources and work on-site [22,26,30]. As a counterpart, conventional construction refers to approaches where components, systems, and assemblies are built at the final installed location of the construction [31]. The main difference between conventional and non-conventional buildings is how the housing is designed and built [32].
Investigators have categorized and defined off-site techniques based on the type of product being manufactured. These techniques include: (a) component manufacture and sub-assembly (building components frequently made in a factory such as doors or windows), (b) non-volumetric pre-assembly (two-dimensional elements which do not create usable space, e.g., roof trusses or panelized systems, and require additional assembly to form a three-dimensional space), (c) volumetric pre-assembly (tridimensional elements that create usable space such as toilet pods), (d) hybrid systems (blending of any two or more volumetric or non-volumetric systems), and (e) modular systems (modular building in which pre-assembled volumetric parts form the structure and configure the building) [33]. Figure 1 shows the OSC categories for a building according to the increasing scale of prefabrication, each of which could be subcategorized according to the level of complexity of prefabrication (from rough and simple elements to more functional elements with more complex accessories) [34]. Timber, steel (light steel frame, containers, others) and concrete are the main materials adopted in prefabricated buildings, in which a component, a panel, a volume, a hybrid system, or a complete house can be prefabricated with them, within a plant, to be dispatched to the construction site [15]. The reversible connections for the assembly, e.g., between the panel system and the house’s subsystems such as roofs and foundations, are critical for the housing performance [35] and define disassembling capacity that promotes building circularity [17].

2.2. Environmental Assessment in Buildings

Several environmental assessment methods based on multi-criteria rating systems have emerged in several countries since the 1990s [36]. Leadership in energy and environmental design (LEED) and the building research establishment environmental assessment method (BREEAM) are among the most frequent, and their use has spread throughout the globe [36,37]. However, these assess building sustainable dimensions differently, and their respective scopes recognize local contexts, which can lead to confusion among stakeholders due to the lack of standardization and the fact that they are not comparable [38,39,40]. In these methods, the environmental dimension (one of the triple bottom line elements) is the most frequent [41], in which the energy category has the most significant weight of all the requirements assessed, ranging from 22.1% to 30% [37]. This reflects the fact that the energy used is key and the use of methods based on weights could lead to different results, which could be shaped by the different perspectives or interests pursued by decision makers [39]. Consequently, it is preferable to perform an LCA based on the ISO 14040 series of standards, which allows for assessing the environmental impacts of a product or service during interdependent life cycle stages; this has been applied to evaluate the environmental performance of buildings since it presents a standardized and internationally accepted methodology [40,42,43].
A building LCA consists of four main stages, usually with a cradle-to-grave system boundary [42]. These stages are colored in grey in the flow presented in Figure 2 [44]. Building LCAs frequently adopt a midpoint approach, in which cumulative energy demand (CED) and global warming potential (GWP) are usually analyzed [44,45,46] and can be considered the most relevant [47].
Since the MMC method shows less interdependency between product and construction stages due to more integration between design and construction, some researchers have performed LCA in building considering the two first phases as one [43]. This looks convenient when the building is modular or completely prefabricated because activities on site are minimized. However, for lower OSC scales and with the need to compare results between LCA stages, it is proposed to examine the results with attention to the four stages. Congruently, as is presented in Figure 2, a prefabricated component will be considered an “OSC product”, as if it had its environmental product declaration (EPD).
Performing a building’s LCA is not an easy task as each building is unique in terms of attributes, climate, users, and so forth, which, added to the lack of an environmental inventory, could make the assessment a complex process [42]. This leads to the need for simplification to facilitate the application of LCA in buildings and the evaluation of those impact categories that are considered most relevant for the study [48]. Some authors have established simplified structures by omitting those stages that have less effect on the analysis of GWP and CED categories in the LCAs, as are the construction and the end-of-life stages [44,46,49]. According to Figure 2, Oif a prefabricated component is considered a construction “product”, the construction stage (A4–5) will be even less significant, and the product stage (A1–3) will assume more relevance in the LCA. Furthermore, the materials required must be transported to the manufacturing plant first, to be part of the prefabrication process, and then dispatched to the construction site to be assembled, which adds environmental impacts due to additional transport that can be significant. These can be up to 20% of total environmental impacts [50] due to the extra volume being transported (e.g., modules or complete houses), extra distances, additional loading and unloading tasks, extra requirements for transporting and handling the prefabricated components to avoid damages, and the fact that in general, trucks leave the site empty [50,51]. Thus, the locations of the prefabrication plant, materials suppliers, and the construction site are key in determining the environmental impacts of OSC [52].
Performing a comprehensive LCA study in a developing country is complex, mainly due to the lack of environmental inventory data [53]. Therefore, it is useful to perform simplified LCAs, which are defined by the fact that some of the components that must be addressed in the LCA are not considered. These components are either not significant within the environmental categories being studied, or they are irrelevant to the objectives pursued [44,49]. The trend in simplified LCAs for single-family homes shows that the focus on simplification is on defining system boundaries, including defining the model and life cycle stages [48]. The simplified LCAs are precise enough to assess environmental impacts and make decisions about changes in buildings [54] or to contrast the environmental performance of housing, for which it is important to establish and visualize the level of simplification [48,55]. A simplified LCA does not allow generalizable results given the uncertainty inherent in the simplified process and the variable nature of building projects, and as in any model, the results are a useful estimation to compare relative performance among alternatives to help decision making [11,53]. Several LCAs have been carried out on buildings, but few allow contrasting environmental impacts between traditional construction methods with methods adopting off-site construction techniques [43].

2.3. Circularity in Buildings

A circular building (CB) must follow the circular economic (CE) principles, that is, to be designed to avoid waste and pollution and to keep products and material construction in use to retain their maximum value and allow natural systems to regenerate [56]. CB is related to the LCA’s cradle-to-cradle approach, which includes the reuse, recovery, and/or recycling (3R) potential beyond the traditional system boundary (From A to C in Figure 2) [57]. Mechanisms for reuse, materials for recycling, and energy recovery are aspects considered in the “D” module in Figure 2, which quantifies the net environmental benefits or loads resulting from the 3R exported out of traditional system boundaries [44]. Nonetheless, LCA methods focus mainly on a building and its single life cycle [58], and the CB assessment requires a systematic perspective at different scales [17], where buildings, components, and materials have potentially multiple uses and many life cycles [58]. There is a need to develop indicators to measure circularity in buildings based on circular principles [17] to assess the environmental benefits of circularity from a multi-cycling perspective, operationalized through processes of value retention [58], ideally by including them within methods currently in use, for example, as LCA or those based on a multi-criterion assessment such as LEED or BREEAM, to avoid the spread of additional procedures, obtain integration with the already existing sustainable assessment systems [17], and give support to the transition of the construction sector toward the CE [58].
Buildings represent a “reserve” of construction materials to be exploited by reusing and/or recycling them in the future [59]. The Buildings As Material Banks (BAMB) Project promotes CB by creating circular solutions where valuable materials are recycled and buildings are reversible, that is, can be easily deconstructed, or where their components can be easily removed and added without damaging the building by following product or material loop strategies, providing flexibility and adaptability [60]. This is expected to reduce CDW, deliver new material inputs, and promote keeping building resources in use to retain their maximum value [61].
There are some hindrances to material recyclability, as it has been found that quality downgrading by recycling often precludes recycling simply because the downgraded material is not worth much [7]. Additionally, CE activities can increase overall production and provide a lower per-unit-production benefit impact, which is called the “circular economy rebound” effect [62]. Thus, it may happen that the permanence of a construction material asset in a CE implies a greater consumption of resources than manufacturing a new one.
Achieving CB is complex, as construction processes remain traditionally linear, and most existing buildings have not adopted CE principles [63]. In addition, the current main emphasis is still on the use of recycled products and the recyclability of construction materials and components at the building’s end-of-life [64,65]. This reveals that little has been achieved in terms of a paradigm shift to CB, and the strategies remain downstream. Although there are some circularity guidelines, such as the ReSOLVE framework proposed by the Ellen MacArthur Foundation [66] or the 16 Design Qualities developed by Vrije Universiteit Brussel (VUB) Architectural Engineering [17,67], they do not offer evidence on what circularity measures are most suitable to a given case and should be considered as inspiring guides rather than design guidelines [18].
Despite the scarcity of CE indicators [19], two recognizable ones currently coexist, the material circularity indicator (MCI) [20] and the circular transition indicator (CTI) [21]. Most are dimensionless measures and apply to any company that requires analysis of the circularity of its processes. However, the construction industry presents particularities that differ from the manufacturing or services sectors, starting with the longevity and volume of its products, which can be evidenced by contrasting a building with a bottle, for example. This leads to the need to propose standardized circular indicators for the building industry based on functional units as they are presented in the LCAs. There is a consensus on the lack of tools and indicators to assess the benefits of circularity in buildings [18,68], but there is some clarity about what needs to be measured in circular buildings [17,18,67]. Indicators could be provided considering at least the three interrelated dimensions which are shown in Figure 3. First, “circular building attributes or requirements”, which means to measure considering how the building is adopting CE principles (cutting waste, sharing, optimizing, adaptability, etc.) [69] or how the building is meeting design requirements for circularity [18,67]. The more CE principles are applied, the more circular the building will be. Second, “life cycle or service life” means to measure considering the lifetime in which resources remain in use; the more longevity and uses in loops involved there are, the more circular the building will be (refit, refurbish, reclaim/reuse, remanufacture, recycle/compost) [70]. Third, “building layers, scales or levels”, refers to measures considering the building’s physical layers (7s) [69], levels (micro, meso, or macro), or scales (element, building, or neighborhood) in which circularity can be observed [17]. Then, the more layers, levels, or scales consider the CE principles, the more circular the building will be [69]. Thus, these interrelated dimensions will provide aspects that could be measured, such as buildability and constructability [71,72], adaptability [18,69], deconstructability and disassemblability [70,73,74], durability, compatibility, reversibility [17], reusability, and recyclability [58]. Therefore, there is a need in creating key circular indicators from this, which goes further than quantifying the number of resources that remain in use for the building industry [68].

3. VAP System, the Case Study

VAP is a new method to build houses in Chile, and it was devised by the Chilean architect Alberto Mozó. This method incorporates OSC and embraces some on-site techniques that provide an innovative alternative to traditional housing construction.
VAP is a Spanish acronym for “viga” (beam), “aislación” (insulation), and “pilar” (column). This is linked to its intrinsic features of triple functionality, in which components (non-volumetric pre-assembly) can be a beam or column with high insulation. These consist of an expanded polystyrene (EPS) core sandwiched between two structural plywood plates 30 mm thick, which provide 200 mm or 240 mm of insulation. These prefabricated components are light and rigid, and their union provides a volumetric pre-assembly (see Figure 4), which meets (or is divisible by) standard dimensions for sheathing materials such as gypsum board or oriented strand board (OSB). On-site, the pre-assembled volumetric parts are built by organizing their non-volumetric preassembly components (such as beams or columns) based on pre-defined identification numbers. The VAP components and all connecting elements (special screws and other joint parts) are incorporated into a dwelling kit, specifying where the unions need to be made.
The building delivery process considers five main project phases: definition, design, manufacturing, delivery, and support. In the project definition, the land, the client’s requirements, and financial restrictions are identified. Then, the house is designed and manufactured considering modular dimensions that provide waste reduction and material use optimization. Once components are prefabricated, they are dispatched to the construction site by flatbed truck to be assembled with techniques that do not require heavy machinery or higher-skilled labor (see Figure 4 and Figure 5b).
The design follows a DfMA approach, where houses are modeled with BIM technology, which provides project integration. In the manufacturing process, a computer numerical control (CNC) system is used for automating machinery cuts, perforations, and extrusions on plywood plates, with the precision that is required according to a CAD model (see Figure 5a). Given this context, the VAP system corresponds to an MMC since it is more than prefabrication and it incorporates off-site and on-site industrialized techniques.
As is common in off-site constructions, a foundation built on-site is necessary at the construction site [11]. Once the kit is assembled, which provides resistance and thermal insulation, doors, windows, and other enveloped elements are placed. Finally, the structure is coated with elements that provide sealing and finishing. Figure 6 contrasts a VAP house before and after its building sheathing and finishes.
The VAP case study housing, hereinafter VAP house (VH), is a single-story isolated house. VH is 67.7 m2 in plan and has an interior height of 2.4 m. Figure 7 shows the elevation and floor plan of the house being analyzed. The VH model contemplates a removable and reusable gable roof in case of a possible extension to a 2nd floor by taking advantage of the flat roof structure provided by the VAP system. For this project, the foundation system used for VH consists of a strap beam footing attached to a concrete slab floor, which provides monolithic conditions and supports the VAP system.

4. Methodology

4.1. Goal and Scope

The goal is to analyze efficiency and environmental benefits by contrasting selected indicators in two modeled houses: the VH and its analogous counterpart built in reinforced masonry, hereinafter the conventional house (CH). The CH comprises the same VH architectural design but adopts a conventional construction technique for masonry according to the Chilean context [75,76]. This is because the use of bricks is the most frequent construction solution for walls in Chilean housing, followed by wall framing (generally timber frame) and then reinforced concrete [77]. Additionally, masonry is considered the main construction typology adopted for affordable houses in the Chilean climate zone where VH and CH were modeled [53,78].
The main variables analyzed in this study are energy demand, construction waste, GHG emissions, and material circularity. Additionally, project delivery time and person-hours (PH) used are variables considered in the comparative analysis between VH and CH. This is in terms of reflecting some of the main productivity-related CSO benefits [11].
Energy and carbon emissions were analyzed by a simplified LCA considering CED and GPW categories. The VH analysis was carried out with attention to the following stages: (i) materials for prefabrication and construction required, (ii) transport of materials to prefabrication plant, (iii) VAP system production on the plant, (iv) transport of VAP elements and other materials required to site of construction, (v) on-site construction, assembly, and finishing and, (vi) operational energy use for thermal comfort. The stages for CH were the same with the exception that the stage of transport of materials to the plant was avoided. Thus, modules A1 to A5 and B6 have been considered, which are usually more frequent [42]. The considered lifespan was 50 years, which corresponds to the usual horizon used to perform LCAs [79]. The measure of construction waste is related to module A5, and the measure of circularity of the material, which goes beyond the LCA of the building, is related to module D according to Figure 2.

4.2. Framework for Data Analysis

Data for VH were collected from the technical specifications of the case study and for CH those defined by [53] in an LCA study for a masonry house in Chile. The most important characteristics to estimate demanded resources, both for the VH and CH models, are shown in Table 1.

4.2.1. Materials and Fuel Considerations

Since environmental data on buildings in Chile are scarce [53,80], impact factors for determining EE and EC were extracted from the Inventory of Carbon and Energy (ICE) version 2.0 [81]. ICE is an easily accessible cradle-to-gate environmental database, where most traditional building materials can be found [15]. Table 2 shows material data for both VH and CH. Carbon sequestration and fuel substitution effects are not considered for wood-related materials, and the re-carbonization of cement-related products is excluded.
The impact outcome (IO) related to each i resource consumed (materials, fuels, or energy) was determined as follows:
I O = f i q i
where fi is the environmental impact factor associated with resource i (MJ/kg, kgCO2eq/kg, kgCO2e/kWh, etc.) and qi is the quantity of resource i demanded in the stages analyzed in the simplified LCA (kg, liters, energy, etc.). The emission factors for diesel, liquefied petroleum gas (LPG), and electricity were considered to be 0.2272 kgCO2eq/kWh, 0.2667 kgCO2eq/kWh, and 0.4187 kgCO2eq/kWh, respectively [53]. The environmental impact factors considered for construction materials are shown in Table 2.

4.2.2. Transport Assumptions

Transport distances vary for each study depending on the methodologies, and results also vary depending on the assumptions for transport types, which is why those are difficult to generalize [82]. Most studies adopt distances from 50 to 100 km [15,45,46], while other studies consider up to 900 km [15]. Regarding the type of transport, a truck is generally assumed, which varies in ton capacity depending on the type of material transported, from 3.5 up to 32 tons, and the technology adopted (e.g., a concrete-mixer truck) [45,46,53,83,84]. For this study, distances from the plant to the site and from the suppliers to the plant or site were assumed as 150 km and 50 km, respectively. A 20 t flatbed truck to transport prefabricated elements and 7.5 t for construction materials were assumed. Trucks arrive loaded at the construction site and return empty; the loaded and the empty truck distances are considered equal. and the fuel considered was diesel. The fuel demand (FD) related to transport was estimated according to Equation (2).
F D = i n M i ( C i f i ) d ( E l i + E e i ) ( E l i E e i )
where Mi represents the total mass in kg that needs to be transported by truck i; Ci is the transport capacity of truck i measured in kg; fi is the utilization factor of the truck i in % according to volume and operation restrictions; and d is the distance in km traveled by truck i loaded or empty (they are considered equal). In addition, E l i is the loaded performance in km/L of truck i, and E e i is the empty performance in km/L of truck i. After obtaining the FD in liters, Equation (1) is applied to obtain the impact outcomes for energy in MJ and carbon emissions in kgCO2eq.

4.2.3. Construction and Prefabrication

The activities necessary to deliver VH and CH were defined and scheduled on a Gantt chart. The energy and resources related to those construction-related activities were then estimated as well as the time and labor hours required to deliver VH and CH. Acknowledging these resources as inputs, the output impacts were estimated according to Equation (1). VAP data were collected through interviews at the prefabrication plant and from previous project experiences. Due to VAP features, no crane is needed at the plant, the pressing machine does not use fuel when joining parts by gluing, and the rest of the equipment required for the manufacturing process uses mainly electricity. The use of electricity was estimated based on the plant electricity bill to prefabricate 1 m2 of VH. Neither crane nor special tools, beyond those usually required for timber or LSF built, are needed for VAP on-site assembly. CH data were obtained from the Manual of Costs, Materials, and Activities for Chilean Construction (ONDAC) and the masonry construction manual provided by the Institute of Cement and Concrete of Chile (ICH).

4.2.4. Operational Energy Use

Energy requirements for DHW, cooking, lighting, and appliances are considered the same in VH and CH. Therefore, only thermal comfort energy was considered because it will reflect changes in energy demand since the other types remain constant, and it also corresponds to the energy consumption with the highest incidence in residential buildings [85]. The demanded energy was obtained by using an energy software simulation that uses the EnergyPlus calculation engine, which is one of the most complete energy simulation tools [86] and has been used in several building energy simulations [87,88]. EnergyPlus delivers the energy demanded based on the following inputs: building design, operational considerations, and related weather [86]. Some assumptions for the simulation are shown in Table 3.
To estimate carbon emissions for cooling, electricity was considered. The emission factor for heating was considered to be 0.2730 kgCO2eq/kWh, which corresponds to a weighted average according to energy distribution types usually consumed at the climatic zone where VH and CH are modeled [53].

4.2.5. Waste and Material Circularity

Each necessary activity to deliver both VH and CH was related to its respective waste, and it obtained a percentage of construction waste (PCW) according to Equation (3).
P C W = i n f w i m i + m c i n m i
where f w i is the % of material waste estimated for each material i according to the construction methods adopted, mi is the mass of house material i measured in kg, and mc is additional material loss non-related to house material i measured in kg (e.g., formwork waste).
From the CTI framework, the percentage of material circularity (PMC) index was considered to assess the circularity of the models. The PMC is determined by Equation (4). The mass material inputs required are obtained from Table 2 for VH and CH.
P M C = 1 2 i = 1 n P C I i + P C O i m i i n m i
where P C I i is the % of circular inflow of material i, P C O i is the % of circular outflow of material i, and mi is the mass of material i measured in kg.
PCI relates to the percentage of non-virgin or renewable material content, according to the material mass inflows of the modeled houses. PCO is obtained by multiplying the percentage of material recovery potential (PRP), which focuses on the companies’ potential capacities to incorporate materials into new production cycles or biodegradability, by the percentage of actual recovery material (PAR), which is determined by the actual ecosystem capacities to revalue materials.
Three scenarios were defined. The first, PMC-MIN, with minimum PCI and PCO, and the second, PMC-MAX, with maximum PCI and PCO. This took into consideration the revaluation of non-virgin material within an established Chilean ecosystem applicable to the manufacture of construction materials, which defines the minimum and maximum scenarios for recycling and reuse of waste materials. The third scenario, PMC-MAXP, considers a maximum potential according to European parameters, in which values at least equal to Chilean maximum values were considered. To estimate PCI and PCO, the document “Economic evaluation of circular housing construction in Chile”, was consulted [89], in which wood elements were considered to make a 100% contribution to circular inflow, due to their biodegradability, and were not revalued at the circular outflow as a biofuel, because the principle of circularity is that the materials remain in use [17].

5. Results and Discussion

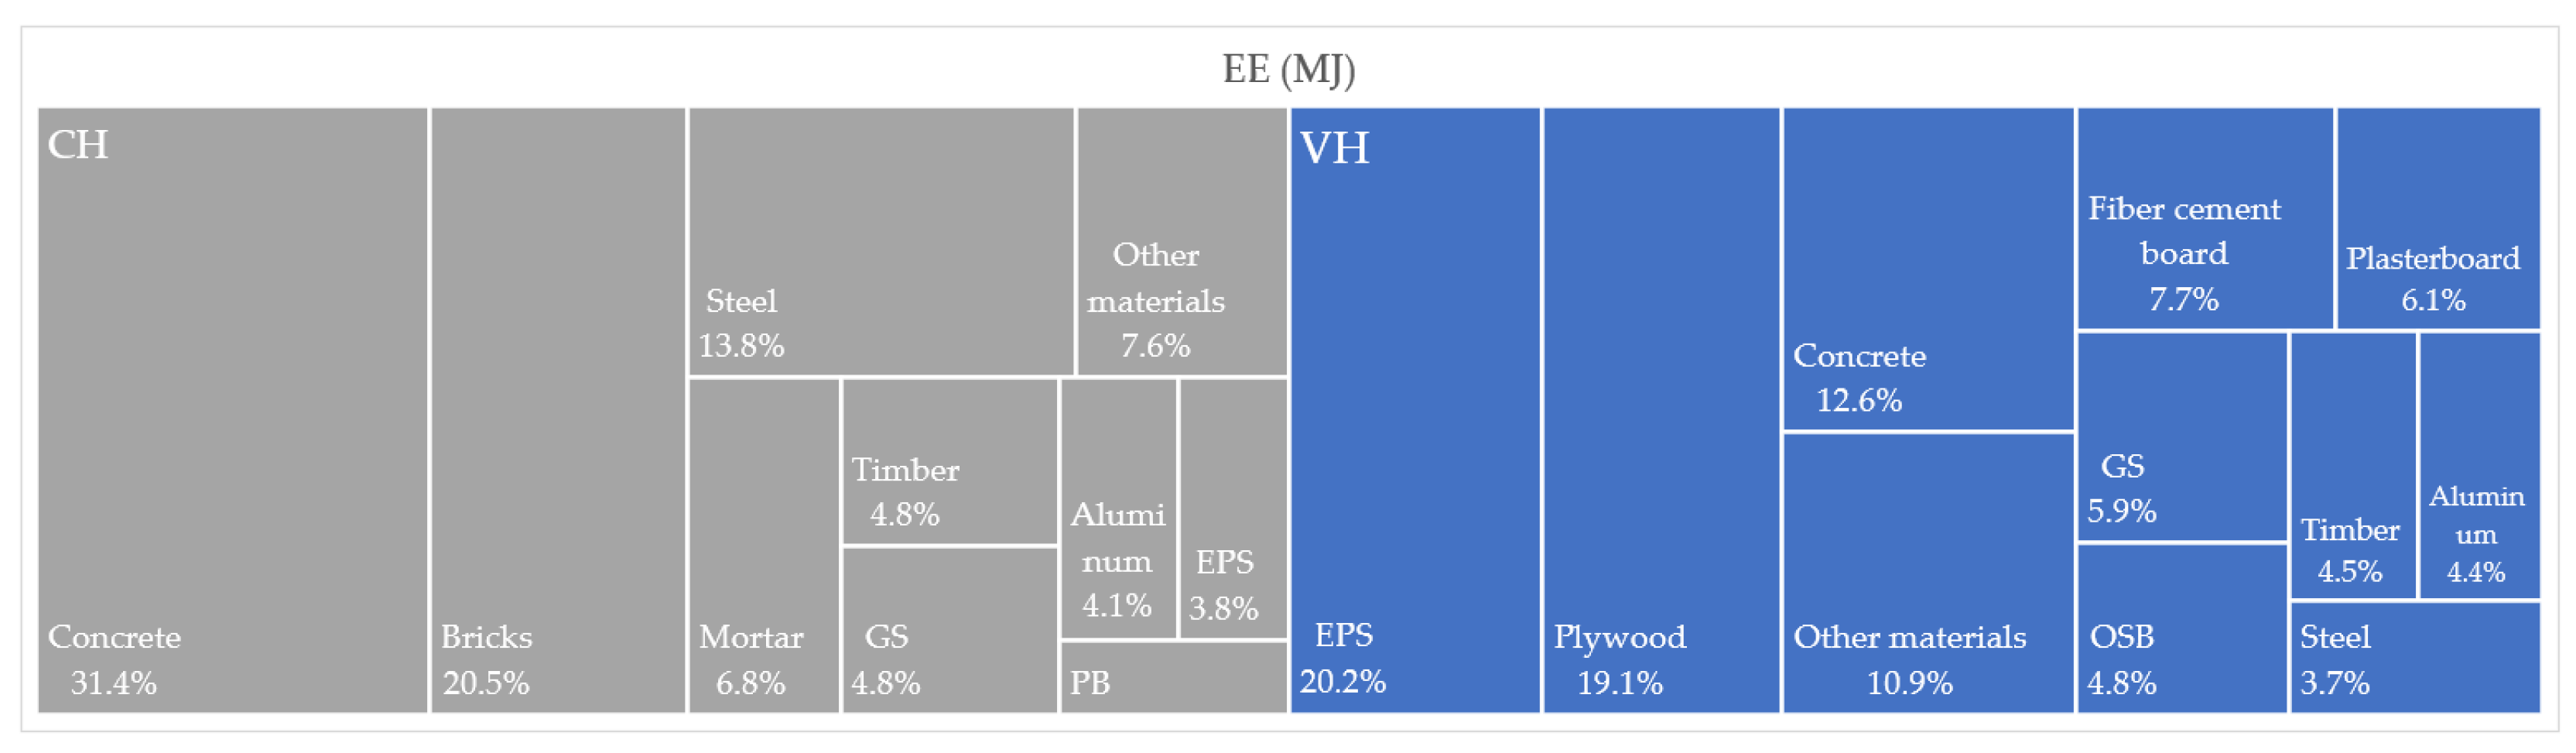
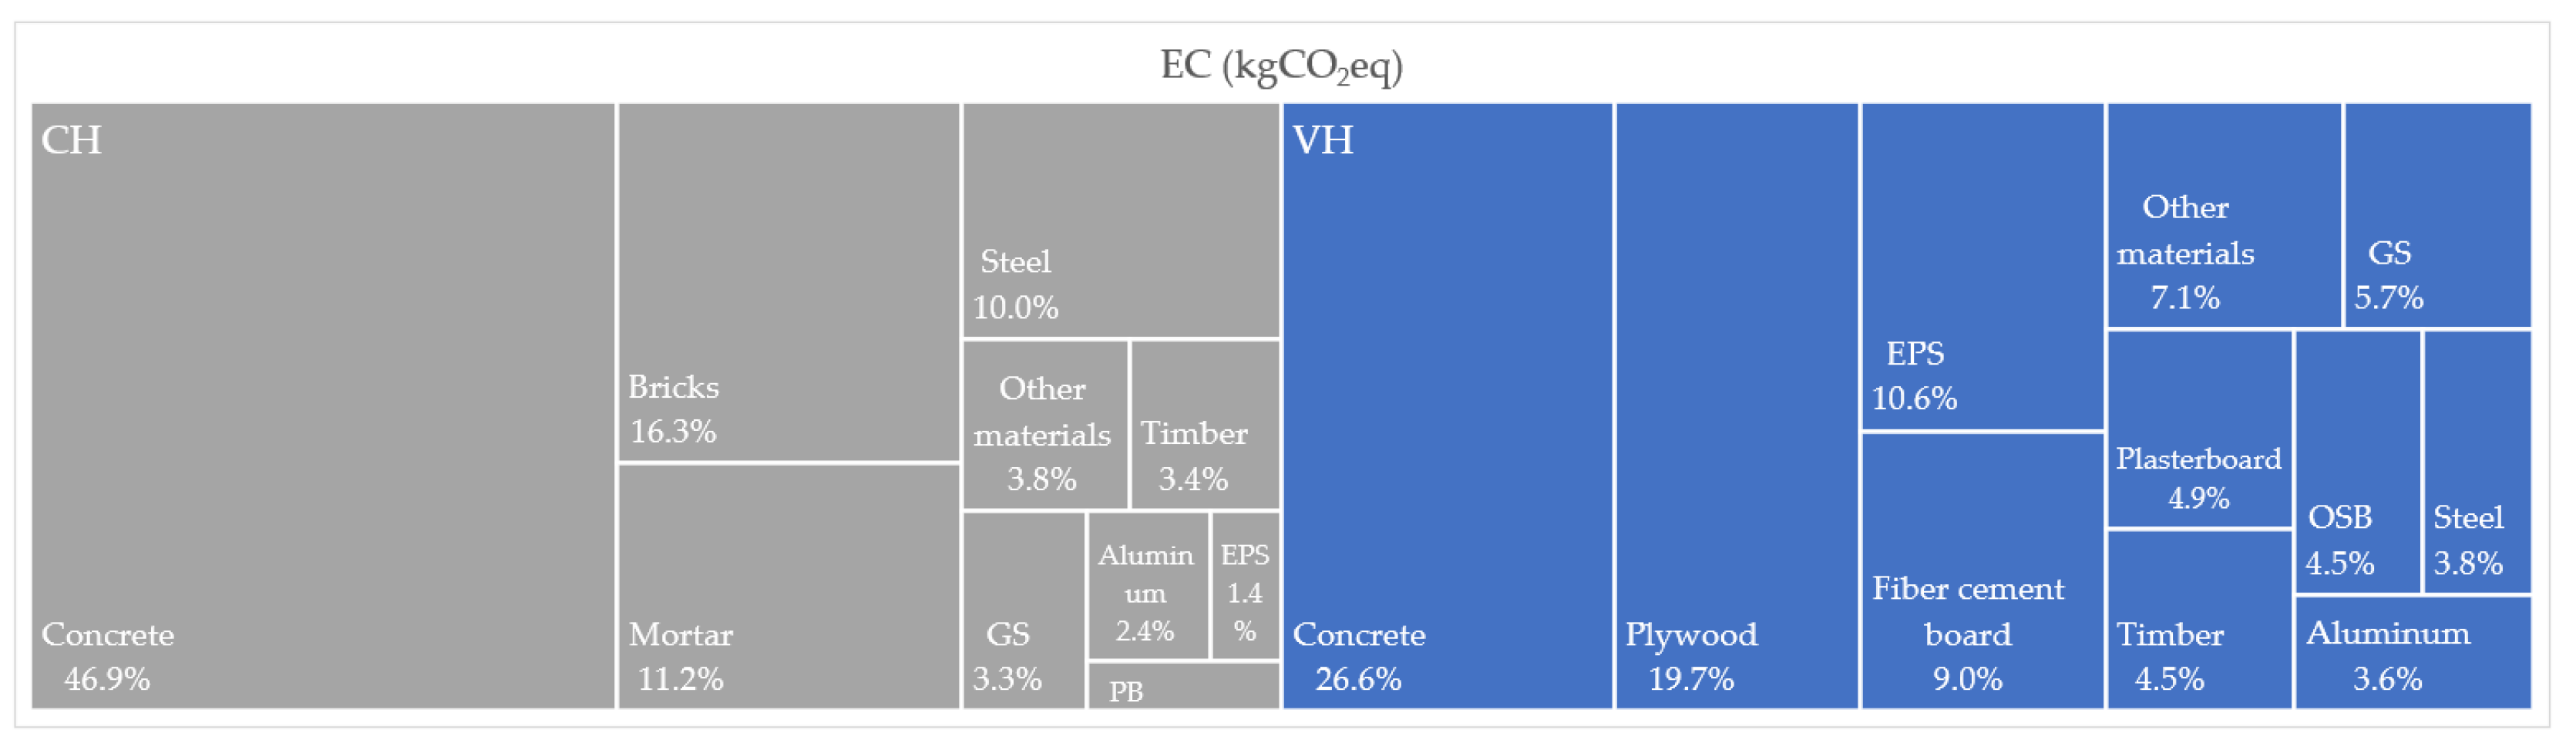
5.1. Materials-Related EE and EC

According to Figure 8, the EE in CH is 170,654 MJ and is 159,297 MJ in VH. Thus, by using the MMC, the EE drops by 6.7%. Likewise, EC results were lower in VH than in CH, dropping from 17,149 kgCO2eq to 11,338 kgCO2eq. Consequently, by using the MMC, the EC drops by 33.9%. These results agree with energy and carbon emissions estimated for the initial stages of LCA in buildings [90,91].
The lesser drop in EE compared to the higher drop in EC occurs due to the high EE associated with EPS, which can be corroborated by contrasting the materials EE in Figure 9. The higher drop in EC is associated with loads of cement-related materials (concrete and mortar), bricks, and steel in CH, which account for 84.4% of its total EC being materials related to walls and foundations (see Figure 10). It was expected that the masonry would have a higher EC as opposed to timber residential constructions that present a lower EC [91].
Figure 8 shows how EE and EC are distributed by building elements according to Table 1. It can be observed that structural elements account for the highest loads in both houses. EE in structural walls represents 39.0% and 39.3% of total EE in VH and CH, respectively. The main differences in EE appear in “floor and foundations” and “roof and ceiling” and not in “structural walls”. This is explained by the high loads of EE associated with the EPS and plywood materials in VH (see Figure 11). The main differences in EC correspond to “structural walls” and “floor and foundations”. This is explained by the high loads associated with masonry materials and concrete in CH (see Figure 12).
According to Figure 9 and Figure 10, concrete, bricks, and steel are the three most common materials in the CH and account for 65.7% and 73.2% of total EE and EC, respectively. For the VH, EPS, plywood, and concrete are the three most common materials and account for 51.9% and 56.9% of total EE and EC, respectively. In both houses, these materials are related to foundations and walls.
The CH weight is 2.81 times the VH weight (see Table 2), which represents an advantage in the structural design of foundations, which is usually not considered a prefabricated component [11,35] and represents an important contribution to environmental impact due to the high energy demand, carbon emissions, and CDW related to it, especially when using concrete [11,92]. Congruently, Figure 12 shows that concrete contributes the highest proportion of EC for both CH and VH, at 46.9% and 26.6%, respectively, and Table 4 shows that building elements including concrete represent a higher contribution to construction waste.

5.2. Construction-Related Indicators

Project schedules for VH and CH are shown in Figure 11 and Figure 12, which were scheduled based on average rates. According to this, it takes 7 weeks less to deliver VH than CH, i.e., the delivery time is reduced by 41.2%. This is due to a better pace for the precast and assembly of the VH structure in contrast to the pace to build the structural elements in CH. In addition, there is a time saving, because while the VAP components are precast, the foundations are built in parallel on-site. This leads to the total consumption of person-hours (PH) delivered by CH being much higher than VH, in this case, 60.2% higher. In other words, considering that VH and CH have equal plants, labor productivity—measured as m2 built divided by PH—is higher in VH by 46.6%, which is quite relevant considering the lack of productivity of the construction industry [1], construction labor shortage [10], and the need for more affordable housing globally [93].
Figure 11. Main activities scheduled for VH delivery.
Sustainability 15 06267 g011
Figure 12. Main activities scheduled for CH delivery.
Sustainability 15 06267 g012
According to Figure 11 and considering housing scarcity, if the VH project was replicated, with finishes incorporated into the prefabrication, i.e., dispensing with the traditional coating and finishing activities that take 55.6% of the timeline, a VH could be delivered in approximately 3 weeks. Afterward, foundation building, traditionally effected on-site, as well as transportation activities become relevant when seeking higher productivity for the VH, which is congruent with the OSC literature [25]. It can also be observed that a significant portion of the time is associated with integrated planning and design, which corresponds to 30% of the timeline in this case, something which defines industrialized construction [22]. The assembly of VAP components is congruent with circular construction, which favors integrated designs by using screws or nuts to favor disassembly methods that avoid damaging the construction elements [17] and losing material value, allowing them to be reused or recycled as many times as possible [25,58].
Waste indicators related to the construction stage are shown in Table 4. If each total waste in kg is divided by the house plant, wastes are 34.1 kg/m2 and 107.6 kg/m2 for VH and CH, respectively. Therefore, by adopting OSC techniques, construction waste drops by 68.4%, which is congruent with a range of 65% to 80% of the total CDW that can be reduced by adopting prefabricated solutions [25]. However, when total waste is related to the mass of houses, the PCW of VH is only 11.6% lower than CH, which is influenced by the greatest mass related to structural elements, especially foundations.
Table 4 also shows that energy and carbon emissions related to wastes are lower in VH than CH, i.e., at 48.6% and 54.3%, respectively, while loads related to the structural elements have bigger impacts, especially on those building elements which involve the use of concrete and bricks. In addition, VH waste at the plant accounts for 8.0%, 23.2%, and 21.4% of total mass, energy, and carbon emissions, respectively. However, these wastes (mainly plywood scraps) are managed at the plant for reuse or recycling, responding to a controlled production process with the possibility of continuous improvement [11].
Table 4. PCW, waste mass, and waste-related carbon and energy emissions.
Building ElementVH WasteCH Waste
kgMJkgCO2eqkgMJkgCO2eq
Roof and ceiling1001281871121688105
Structural walls637696026368359771
Floor and foundation1719344634840576388718
Non-structural walls29261166684
Doors and windows3310936733109367
Other elements2100521005
Subtotal19466948584684717,6961670
Other on-site waste17521851584375464396
Waste on-plant1842760202---
Total230511,893944728423,1602066
PCW7.6% 8.6%
Table 5 shows the energy and GHGs related to the FD for transportation, which is crucial to sustainability analysis in precast homes [22,50]. It is noted that the FD and its related energy and carbon emissions are higher in CH. This is despite the additional transportation of materials from suppliers to the relevant plant. It is because the assumed distances are relatively short, the pre-assembly elements are designed to be stacked to optimize the truck’s volumetric capacity (and Figure 5b), and weight is not a constraint. This differs for longer distances, or when the housing is modular and requires additional transportation for a crane needed for on-site assembly [15,43]. If assumed distances exceed 300 km between the plant and the construction site, the environmental impacts of transportation would be greater in the VH. Moreover, the diversity of materials and suppliers related to CH entails a greater number of trips. These facts confirm how important transportation is in terms of OSC environmental impact.
Table 6 shows the energy and carbon emissions related to the building process, either on-site or off-site. Accordingly, these are higher by 33.5% and 31.6% in CH than in VH, respectively.

5.3. Operational Energy and Emissions

Figure 13 shows the results of performing the energy simulation in VH and CH. Accordingly, the energy demand in VH is 226 MJ/m2/year, and in CH it is 502 MJ/m2/year. Therefore, by using the VAP system, the energy demand in the house drops by 55.0%. Despite this significant energy reduction, both VH and CH are classified as conventional energy buildings (CEB) since the thermal energy demand is greater than 162 MJ/m2/year [79]. Similarly, GHG is higher in CH than in VH, at 51 kgCO2eq/m2/year against 25 kgCO2eq/m2/year, respectively, i.e., the use of the MMC reduced GHGs by 51.0%.
If windows with lower U-Value and ventilation control as well as energy recovery systems could be incorporated into the VH they would meet the low energy building standards [79,94]. These improvements could make housing more expensive and unaffordable, but the incremental cost can be assumed by grants related to energy savings, and cost reduction could be achieved through the application of OSC techniques [11,95], as well as obtaining economic benefits through building circularity [96].

5.4. CED and GWP Impacts Categories

Table 7 and Table 8 show the results for CED and GWP impact categories. It is revealed that environmental loads are significantly lower in VH. The CED is 14,005 MJ/m2 and 28,200 MJ/m2 for VH and CH, respectively. Therefore, CED was reduced by 50.3% by adopting MMC. GWP is 1446 kgCO2eq/m2 and 2854 kgCO2eq/m2 in VH and CH, respectively. This means that by adopting MMC, a reduction in carbon emissions of 49.3% was achieved.
According to Table 7 and Table 8, the operation stage (B6) results are the most significant, representing 80.7% and 89.0% of the CED and 86.4% and 89.4% of the GWP for VH and CH, respectively. The value of the operation stage is lower in VH than in CH, which was to be expected as VH is more efficient than CH and given the high relevance of this stage for CED as well as for GWP [90,91].
The operation stage for both CED and GWP categories in VH and CH is followed in importance by the product stage (A1–3) and then by the construction stage, with the lowest value, which is expected in building LCAs [54]. These results agree with the literature, as this stage can represent 43% up to 98% of the CED and even down to 0% in net-zero energy dwellings [82]. Therefore, the more efficient the building, the less significant the operation stage in CED and GWP [90,91].
From Table 7, the initial embodied energy (IEE, from A1–5) and CED for VH can be expressed as 2.7 GJ/m2 and 280.1 MJ/m2/year (50 years lifespan), respectively. These results agree with previous studies that range IEE from 0.9 to 6.6 GJ/m2 and CED from 24.0 to 362.4 MJ/m2/year for wooden buildings [90]. Similarly, for CH and according to Table 8, IEE and CED are 3.1 GJ/m2 and 564 MJ/m2/year (50 years lifespan), respectively. These results agree with ranges from 0.9 to 16.3 GJ/m2 for IEE in masonry but are close to the upper limit for masonry that in CED goes from 24.2 to 515.7 MJ/m2/year [90]. This reflects how energy inefficient a typical Chilean reinforced masonry house can be since the more significant stage in CED is the use phase.
According to Table 7 and Table 8, the initial embodied carbon (IEC, from A1–5) for VH and CH is 175.8 kgCO2eq/m2 and 303.5 kgCO2eq/m2, respectively. These results agree with previous studies that range emissions between 128 kgCO2eq/m2 to 830 kgCO2eq/m2 for timber buildings, and masonry between 161 kgCO2eq/m2 to 393.1 kgCO2eq/m2 [91]. It is noticed that IEC for VH is near the low end whilst that of CH is near the high end in the respective ranges, reflecting the competitiveness of VH within building methods using wood.
According to Table 7 and Table 8, the GWP for VH and CH can be expressed as 28.9 kgCO2eq/m2/year and 57.1 kgCO2eq/m2/year considering 50 years lifespan, respectively. These results agree with previous studies in single-family houses with simplified LCA approaches, which showed a range between 23 and 105 kgCO2eq/m2/year with an average for a typical scenario of 57 kgCO2eq/m2/year in the GWP category [48].

5.5. Percentage of Material Circularity

The results for PMC-MIN and PMC-MAX in Table 9 show that the circularity of materials, both for VH and CH, are low within the Chilean context considering the potential defined by the European context (PMC-MAXP), which were 6.48% and 9.18% for VH, and 0.96% and 2.75% for CH, respectively. These results are mainly explained by the circularity of the structural walls and foundations, which represent 88.3% and 97.5% of the total mass of the VH and CH houses, respectively. This reflects one disadvantage of the PMC indicator: its value depends on the total mass of the house. Therefore, if a material’s weight is relatively small concerning the total weight of the house, its PMC value will be insignificant, which could discourage the use of lightweight materials that pose high circularity. It is not the case when determining the EE and EC in the dwelling, whose values depends on the mass of each material and not on the total mass of the dwelling. A clear example is EPS, whose influence on PCM is small since it represents only 1.2% of the total mass of the dwelling (see Table 2), although EPS is important in the circularity of VH, both for waste management and recyclability. Instead, EPS has the highest value in EE and ranks third in EC for VH (See Figure 9 and Figure 10). Consequently, heavier materials, such as concrete in foundations, present in both VH and CH, or steel, concrete, and bricks present in the reinforced masonry walls, have defined the material circularity in the dwellings. Actually, according to Table 9 and considering European parameters (PMC-MAXP) as maximum potential, which reach a circularity of 44.52% and 41.31% for VH and CV, respectively, better circularity is achieved mainly by the incidence of structural walls, and floor and foundation elements which are the heaviest building elements.
Table 9 shows that the results for VH present a higher material circularity than CH in any of the scenarios assessed. In addition, it is noticed that the PMC-MAXP is 4.85 and 15.02 times the PMC-MAX in VH and CH, respectively, reflecting an important gap between the Chilean and European contexts. Although there is little evidence of measurement of material circularity in buildings, results presented for PMC-MAXP are close to the average waste recovery rate of the European Union, which is close to 46% [25]. Nonetheless, these values could be higher since it is estimated that if all wasted materials were recycled in the EU, they could supply up to 64% of the current production of the same materials and grow to 80% by 2050 [7].
Considering an average between PMC-MIN and PMC-MAX, these values are 7.83% and 1.86% for VH and CH, respectively. Based on these averages, it can be said that using the MMC material circularity increases by 320%. When PMC-MAXP values for VH and CH are contrasted, material circularity using the MMC also increases, in this case, by 7.8%.
It is important to consider the multiple life cycles that materials could have [58], something that the PMC indicator does not reflect. Nonetheless, materials can be incorporated into building elements by using different construction methods (screws or adhesives, composite or simple solutions, etc.), which affects the potential capacities of the companies to incorporate these materials into new production cycles or the possibility of returning them to nature (biodegradability %), something that the PMC does consider. Table 10 shows the PMC averages obtained from the main materials in this research, and it can serve as a reference to compare these materials. Wood-derived materials present better PMCs followed by metallic materials. This shows that materials such as timber or steel are candidates for the design and manufacture of houses seeking the reversibility proposed by BAMB [60].
According to Figure 11 and Figure 12, materials with higher environmental loads (concrete, brick, steel, expanded polystyrene, and plywood), for both VH and CH, grant the possibility to be partially or totally recycled [97]. Therefore, in addition to being recyclable, materials must be low in EC and EE [8]; for example, EPS has higher EE than other insulating materials [82] that can also be recycled. Furthermore, the selected materials should preferably be durable, renewable, compostable, and pure (single instead of blended) [17]. In this respect, wood takes the lead; however, wood with further processing, such as plywood present in VH, has higher EE and EC than pure wood [98], and preservative treatments on them could limit their reuse and recycling, as well as being potentially hazardous [99]. As for concrete, both for VH and CH, it is linked to building components that are difficult to reuse if they are not prefabricated and designed for that purpose [65], and their recycling is limited as they are blended materials [25]. Even though they do account for large proportions of end-of-life waste, they are often not recovered and end up in public landfills [100].

6. Conclusions

This study analyzes environmental and efficiency indicators by contrasting a house that incorporates an MMC (VAP System) versus a similar one using traditional reinforced masonry, thus contributing to the few existing contrast analyses between non-traditional and traditional buildings based on an LCA approach [43]. Additionally, it provides quantitative data that demonstrate the benefits of house prefabrication, thereby improving comprehension and boosting stakeholders’ confidence in projects that incorporate OSC techniques, the absence of which represents one of the main barriers to the adoption of innovations in construction [11,101]. These findings hold particular significance for developing countries where the implementation of OSC has not kept pace with that of more developed nations [11]. In such settings, decision makers within the construction industry may be deterred from embracing novel techniques due to inadequate information [101]. The main conclusions of this case study are the following:
  • Lighter structures are shown to be advantageous for the structural requirements of foundations, which are usually not considered precast and are still made of concrete [11,35]. Additionally, concrete shows high environmental impacts, both for EE and EC. This establishes a challenge to incorporate innovative techniques and the use of more sustainable materials in housing foundations.
  • Whether prefabricated or in conventional housing, it is shown that EE and EC are concentrated in foundations and walls, thereby reflecting that a DfMA approach must draw attention to these building elements to achieve greater sustainability.
  • It is challenging to incorporate insulating materials with low EE in prefabricated buildings using EPS, prioritizing the use of reusable or biodegradable materials over energy-consuming recycling. In this particular case, the total EE load was just 6.7% lower in VH than in CH, mainly because EPS accounted for 20.2% of EE in VH.
  • The MMC delivers the project in a shorter time. The VH was able to be delivered 7 weeks earlier than using the traditional construction method, with 46.6% higher labor productivity. Therefore, being more industrialized provides greater efficiency in the construction phase, thereby responding to labor shortages and low productivity affecting the construction industry [1].
  • The MMC shows a reduction in construction-related waste, as well as energy and carbon emissions. By adopting OSC techniques, construction waste is reduced by 68.4% (107.6 kg/m2 versus 34.0 kg/m2), and energy and carbon emissions related to this waste are reduced by 48.6% and 54.3%, respectively.
  • If distances from the plant to the site are greater than 300 km, both energy and carbon emissions related to transport may be higher for MMC, and even at a distance shorter than 300 km if the VAP components are not lightweight and sized to make efficient use of the truck. This reflects the convenience of designing lightweight and medium-sized components that are easy to transport and assemble and where the volume is generated on-site rather than at the plant, dispensing with the use of cranes and using screws, bolts, or other devices that allow future deconstruction.
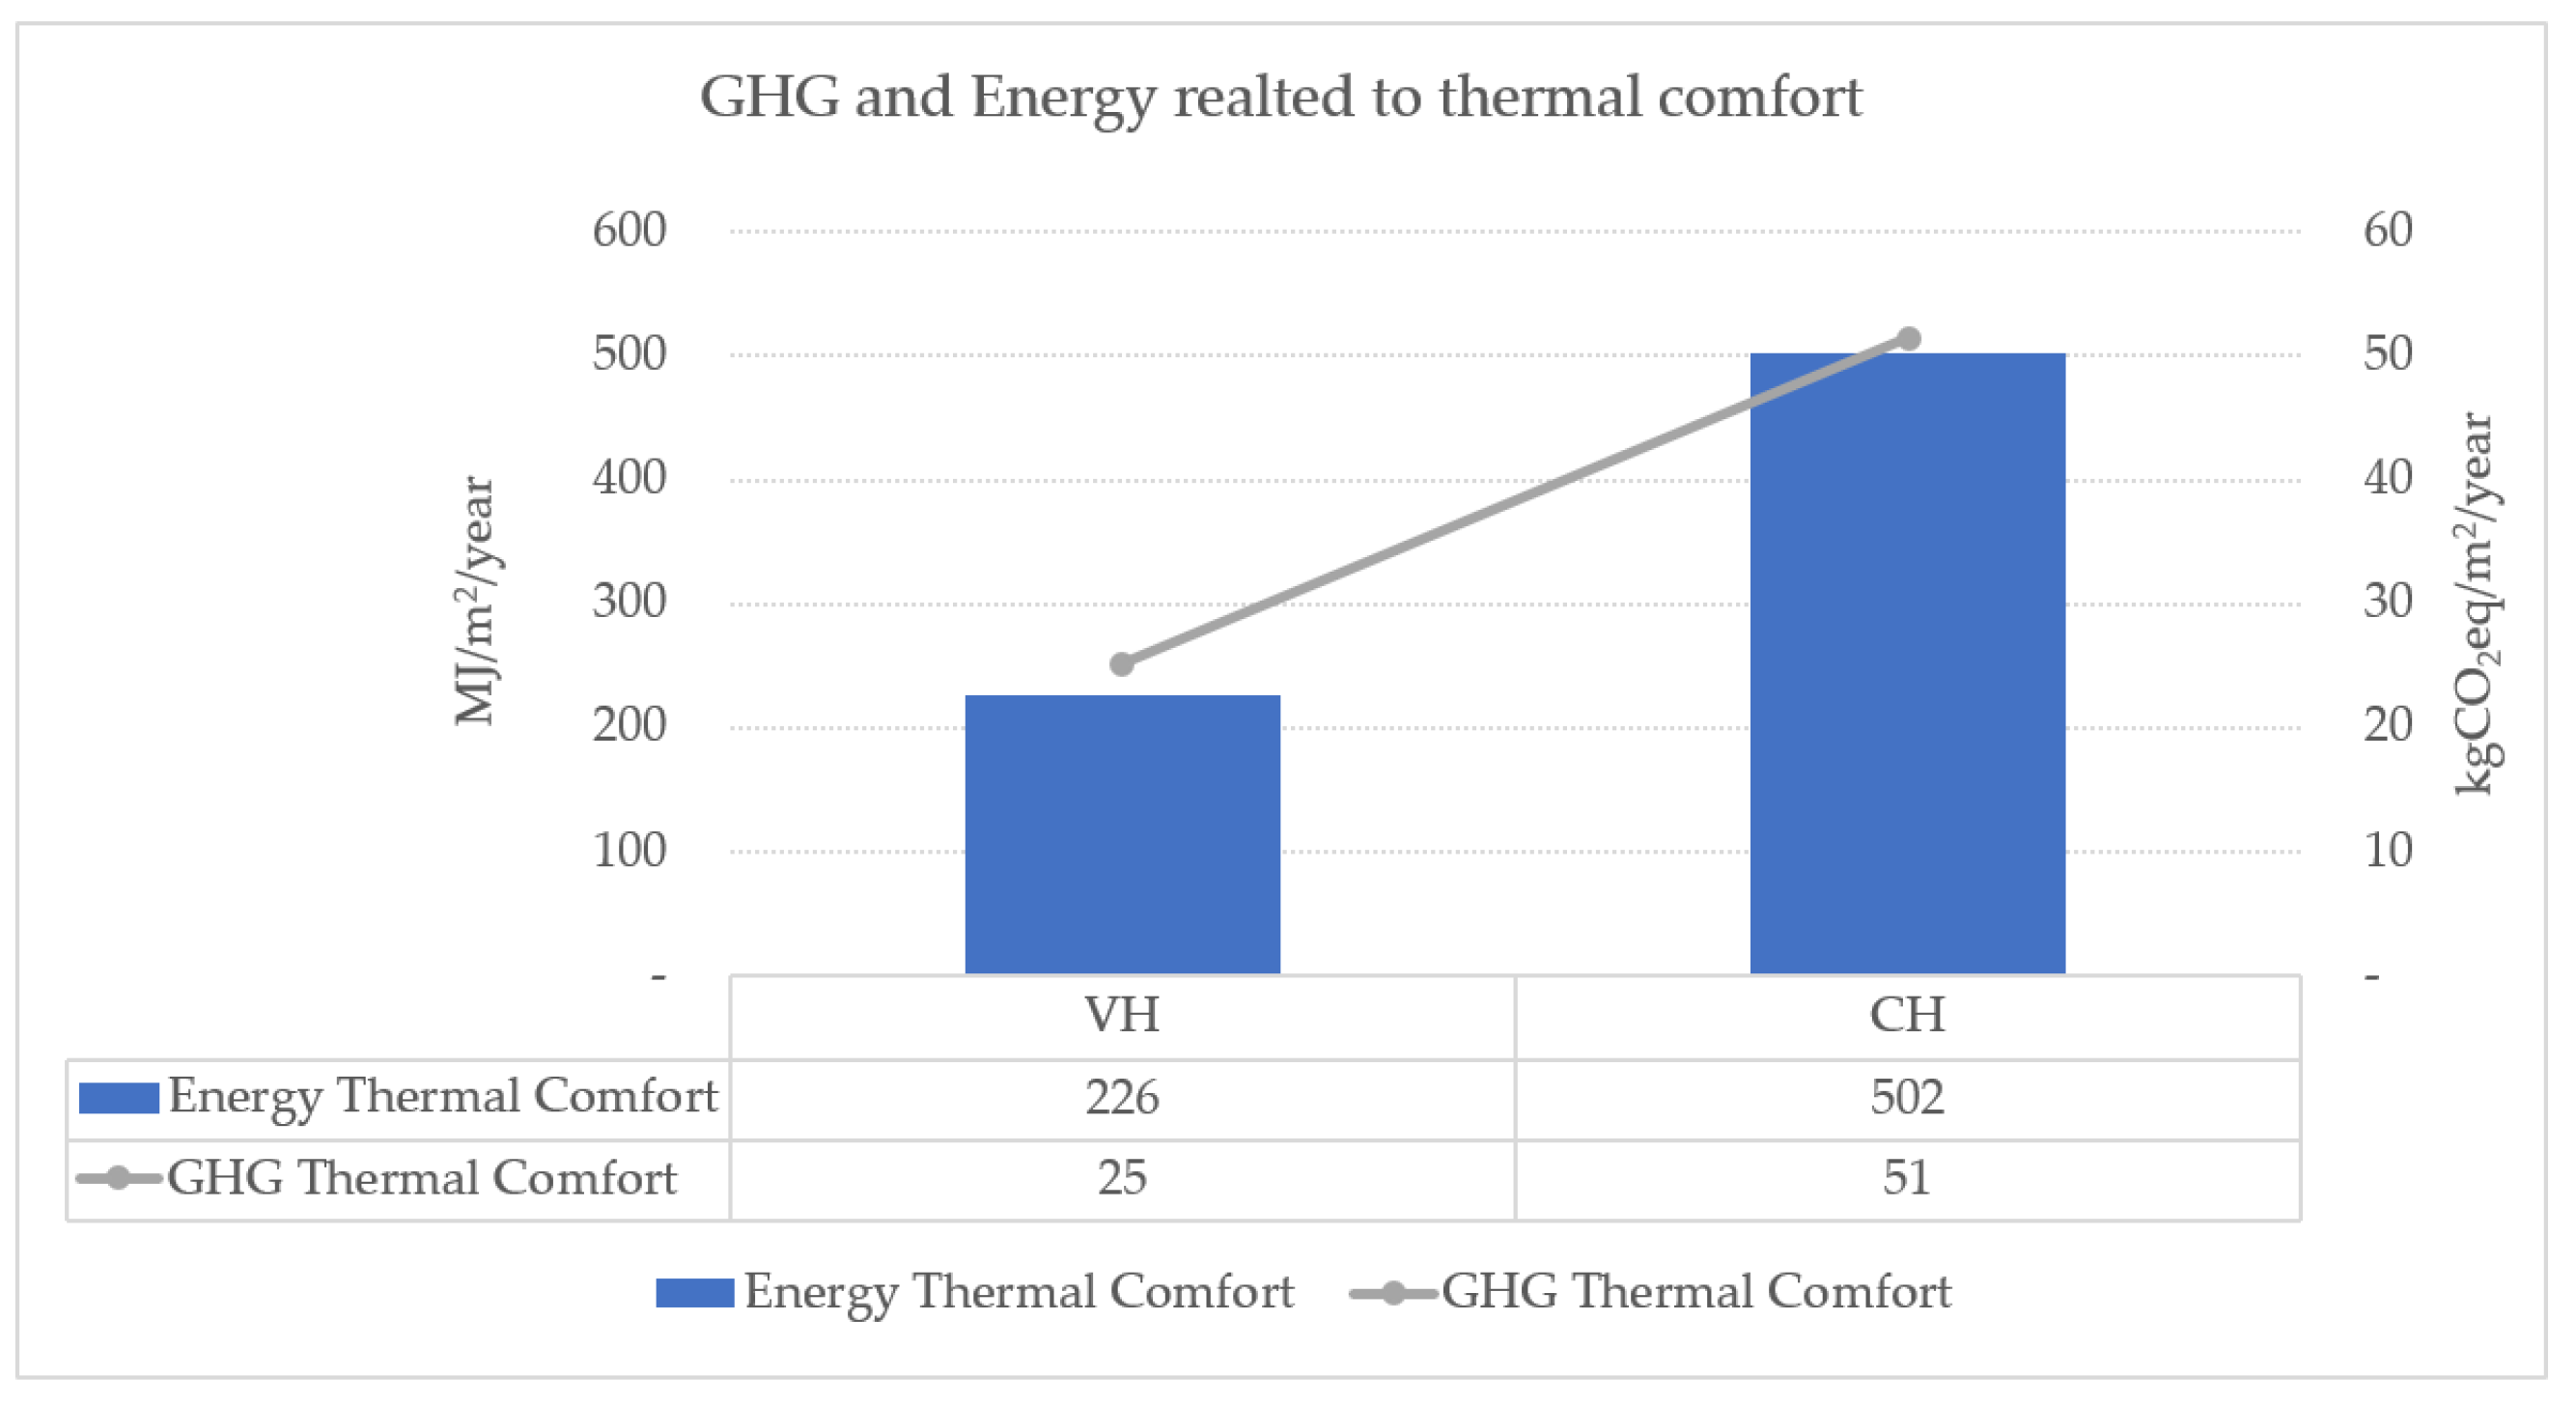
  • The house that adopts the MMC turns out to be more energy efficient. By employing MMC, a 55% reduction in annual cooling and heating energy is achieved. This also leads to a 51% drop in carbon emissions. Given the incidence of this energy and its related carbon emissions in the LCA, which accounts for 80.6% and 89.0% of the CED, and 86.4% and 89.4% of the GWP for VH and CH, respectively, the CED and GWP are reduced by 50.3 % and 49.3%, respectively.
  • Construction materials in Chile have low PMC. By using the MMC, the PMC grows 320% considering the Chilean context and grows only 7.8% considering the European context. Since the PMC indicator strongly depends on the circularity of heavier materials, this could discourage the use of lightweight materials with high circularity potential. This reflects that elements with higher mass, such as foundations or structural walls, define the housing circularity, thus indicators based on functional units become more relevant than dimensionless indicators.
  • Metal and wood-derived materials have the highest material circularity. These materials can be easily joined through the use of bolts and configured into the building structure as pure, clean, and easy-to-recover materials. As a result, they are preferred for the prefabrication of reversible housing with high reusable potential. In contrast, blended solutions such as masonry or reinforced concrete are less desirable for this purpose, unless they can be incorporated into the building with connections that allow their deconstruction and reuse [25].
Finally, by opting for MMC, both environmental benefits and efficiency can be achieved. Therefore, the VAP system is preferable to the traditional construction method of reinforced masonry, even though it could present greater impacts in the construction stage when considering a larger distance from the plant to the site. However, it should be noted that the construction stage is not significant in the LCA. Thus, in agreement with the relevant literature, the adoption of the MMC addresses the sustainability and productivity challenges that the construction industry is facing.

Future Research, Recommendations, and Limitations

Two main areas of study are proposed for future research. The first area is to expand the study of the circularity of materials to include the reversibility, adaptability, durability, compatibility, deconstructability, and reusability of building elements to evaluate how the building’s elements can remain in use, dispensing energy for its transformation, and managing building information to avoid losing material resources. The second area of study is to consider the effect of a fire on the building and analyze how fire action affects the results using the Fire-LCA methodology [102].
The primary recommendations are to promote the adoption of the DfMA approach, as used by the MMC, to enhance sustainability and efficiency. Additionally, it is essential to consider the reversibility and disassembly of the building during its design phase to provide circular materials and components that can generate economic value beyond the lifespan of a single building. By implementing these recommendations, sustainability, efficiency, collaborative work environments, integration of the value chain segments, technology utilization, and construction process automation can be promoted [103].
To ensure accurate interpretation, limitations must be considered. Firstly, the assessment could include other environmental impact categories that may favor the use of traditional construction methods. As buildings become more energy efficient and circular, more attention will be needed at the end-of-life stage. Changes required in housing due to new functional needs or unexpected events such as fires or earthquakes are not factored in, potentially affecting comparison results. Additionally, environmental material loads are determined by manufacturing processes, which vary based on the adoption of greener processes. For example, concrete’s environmental impact can be improved by incorporating substances that reduce its EC and EE [104]. Furthermore, concrete and steel employed in reinforced masonry conform to local seismic design standards, although the utilization of these materials can be optimized and reduced when considering varying regional contexts [23].

Author Contributions

Conceptualization, H.H. and F.O.; methodology, H.H. and F.O.; validation, H.H. and F.O.; formal analysis, H.H., F.O. and M.S.; investigation, H.H., F.O. and M.S.; writing—original draft preparation, H.H. and F.O.; writing—review and editing, H.H.; visualization, H.H. and M.S.; supervision, H.H. All authors have read and agreed to the published version of the manuscript.

Funding

This research was funded by Agencia Nacional de Investigación y Desarrollo (ANID) of Chile, through the project ANID FONDECYT 11200688.

Institutional Review Board Statement

Not applicable.

Informed Consent Statement

Not applicable.

Data Availability Statement

All or part of the data supporting the results of this study can be obtained from the corresponding author upon reasonable request.

Acknowledgments

The authors wish to express their sincere gratitude to the Chilean architect Alberto Mozó, designer of the VAP system, for providing the design of the case study and all necessary information to perform the comparative analysis.

Conflicts of Interest

The authors declare no conflict of interest.

References

  1. Barbosa, F.; Woetzel, J.; Mischke, J. Reinventing Construction: A Route to Higher Productivity. 2017. Available online: http://www.mckinsey.com/industries/capital-projects-and-infrastructure/our-insights/reinventing-construction-through-a-productivity-revolution (accessed on 11 October 2022).
  2. Pérez-Andreu, V.; Aparicio-Fernández, C.; Martínez-Ibernón, A.; Vivancos, J.L. Impact of climate change on heating and cooling energy demand in a residential building in a Mediterranean climate. Energy 2018, 165, 63–74. [Google Scholar] [CrossRef]
  3. Turner, C.J.; Oyekan, J.; Stergioulas, L.; Griffin, D. Utilizing Industry 4.0 on the Construction Site: Challenges and Opportunities. IEEE Trans. Ind. Inform. 2021, 17, 746–756. [Google Scholar] [CrossRef]
  4. Teh, S.H.; Wiedmann, T.; Moore, S. Mixed-unit hybrid life cycle assessment applied to the recycling of construction materials. J. Econ. Struct. 2018, 7, 13. [Google Scholar] [CrossRef] [Green Version]
  5. Menegaki, M.; Damigos, D. A review on current situation and challenges of construction and demolition waste management. Curr. Opin. Green Sustain. Chem. 2018, 13, 8–15. [Google Scholar] [CrossRef]
  6. Circle Economy. Report: CGR Global 2022. 2022, Volume 5, pp. 1–26. Available online: https://www.circularity-gap.world/global (accessed on 15 December 2022).
  7. Enkvist, P.-A.; Klevnäs, P.; Westerdahl, R.; Ahlén, A. How a ‘Materials Transition’ Can Support the Net-Zero Agenda. 2022. Available online: https://www.mckinsey.com/capabilities/sustainability/our-insights/how-a-materials-transition-can-support-the-net-zero-agenda (accessed on 15 December 2022).
  8. Global Status Report for Buildings and Construction 2021; UNEP: Nairob, Kenya, 2021. Available online: https://globalabc.org/resources/publications/2021-global-status-report-buildings-and-construction (accessed on 10 December 2022).
  9. Alaloul, W.S.; Musarat, M.A.; Rabbani, M.B.A.; Iqbal, Q.; Maqsoom, A.; Farooq, W. Construction Sector Contribution to Economic Stability: Malaysian GDP Distribution. Sustainability 2021, 13, 5012. [Google Scholar] [CrossRef]
  10. Albattah, M.A.; Goodrum, P.M.; Taylor, T.R.B. New Metric of Workforce Availability among Construction Occupations and Regions. Pract. Period. Struct. Des. Constr. 2019, 24, 04019003. [Google Scholar] [CrossRef]
  11. Kamali, M.; Hewage, K. Life cycle performance of modular buildings: A critical review. Renew. Sustain. Energy Rev. 2016, 62, 1171–1183. [Google Scholar] [CrossRef]
  12. Wuni, I.Y.; Shen, G.Q.P. Holistic Review and Conceptual Framework for the Drivers of Offsite Construction: A Total Interpretive Structural Modelling Approach. Buildings 2019, 9, 117. [Google Scholar] [CrossRef] [Green Version]
  13. OSCC. Report of the Results of the 2018 Off-Site Construction Industry Survey. 2018. Available online: https://cdn.ymaws.com/www.nibs.org/resource/resmgr/oscc/oscc-2018surveyreport.pdf (accessed on 6 October 2022).
  14. Razkenari, M.; Fenner, A.; Shojaei, A.; Hakim, H.; Kibert, C. Perceptions of offsite construction in the United States: An investigation of current practices. J. Build. Eng. 2020, 29, 101138. [Google Scholar] [CrossRef]
  15. Tavares, V.; Lacerda, N.; Freire, F. Embodied energy and greenhouse gas emissions analysis of a prefabricated modular house: The ‘Moby’ case study. J. Clean. Prod. 2019, 212, 1044–1053. [Google Scholar] [CrossRef]
  16. Boafo, F.; Kim, J.-H.; Kim, J.-T. Performance of Modular Prefabricated Architecture: Case Study-Based Review and Future Pathways. Sustainability 2016, 8, 558. [Google Scholar] [CrossRef] [Green Version]
  17. Antonini, E.; Boeri, A.; Lauria, M.; Giglio, F. Reversibility and durability as Potential Indicators for Circular Building Technologies. Sustainability 2020, 12, 7659. [Google Scholar] [CrossRef]
  18. Askar, R.; Bragança, L.; Gervásio, H. Design for Adaptability (DfA)—Frameworks and Assessment Models for Enhanced Circularity in Buildings. Appl. Syst. Innov. 2022, 5, 24. [Google Scholar] [CrossRef]
  19. Rincón-Moreno, J.; Ormazábal, M.; Álvarez, M.J.; Jaca, C. Advancing circular economy performance indicators and their application in Spanish companies. J. Clean. Prod. 2021, 279, 123605. [Google Scholar] [CrossRef]
  20. Ellen MacArthur Foundation. Circularity Indicators, an Approach to Measuring Circularity. 2019. Available online: http://www.ellenmacarthurfoundation.org/circularity-indicators/ (accessed on 18 September 2022).
  21. World Business Council for Sustainable Development. Circular Transition Indicators V3.0. 2022, pp. 1–90. Available online: https://www.wbcsd.org/contentwbc/download/14172/204337/1 (accessed on 15 December 2022).
  22. Qi, B.; Razkenari, M.; Costin, A.; Kibert, C.; Fu, M. A systematic review of emerging technologies in industrialized construction. J. Build. Eng. 2021, 39, 102265. [Google Scholar] [CrossRef]
  23. Khan, M.; Ali, M. Optimization of concrete stiffeners for confined brick masonry structures. J. Build. Eng. 2020, 32, 101689. [Google Scholar] [CrossRef]
  24. Sameer, H.; Bringezu, S. Life cycle input indicators of material resource use for enhancing sustainability assessment schemes of buildings. J. Build. Eng. 2019, 21, 230–242. [Google Scholar] [CrossRef]
  25. López Ruiz, L.A.; Roca Ramón, X.; Gassó Domingo, S. The circular economy in the construction and demolition waste sector—A review and an integrative model approach. J. Clean. Prod. 2020, 248, 119238. [Google Scholar] [CrossRef]
  26. Kamar, K.; Hamid, Z. Industrialized Building System (IBS): Revisiting Issues of Definition and Classification. Int. J. Emerg. Sci. 2011, 1, 120–132. Available online: http://ijes.info/1/2/7.html (accessed on 10 September 2022).
  27. Zairul, M. A thematic Review on Industrialised Building System (IBS) Publications from 2015-2019: Analysis of Patterns and Trends for Future Studies of IBS in Malaysia. Pertanika J. Soc. Sci. Humanit. 2021, 29, 635–652. [Google Scholar] [CrossRef]
  28. Rahman, M.M. Barriers of Implementing Modern Methods of Construction. J. Manag. Eng. 2014, 30, 69–77. [Google Scholar] [CrossRef] [Green Version]
  29. NHBC. Modern Methods of Construction. 2018. Available online: www.nhbcfoundation.org (accessed on 10 September 2022).
  30. Wang, M.; Wang, C.C.; Sepasgozar, S.; Zlatanova, S. A Systematic Review of Digital Technology Adoption in Off-Site Construction: Current Status and Future Direction towards Industry 4.0. Buildings 2020, 10, 204. [Google Scholar] [CrossRef]
  31. Doermann, J.; Finzel, K.; Barrot, J. High-Rise Modular Construction—A Review of the Regulatory Landscape and Considerations for Growth. 2020. Available online: https://www.csagroup.org/wp-content/uploads/CSA-Group-Research-High-Rise-Modular-Construction.pdf (accessed on 10 December 2022).
  32. Jiang, Y.; Zhao, D.; Wang, D.; Xing, Y. Sustainable Performance of Buildings through Modular Prefabrication in the Construction Phase: A Comparative Study. Sustainability 2019, 11, 5658. [Google Scholar] [CrossRef] [Green Version]
  33. Arif, M.; Bendi, D.; Sawhney, A.; Iyer, K.C. State of offsite construction in India-Drivers and barriers. J. Phys. Conf. Ser. 2012, 364. [Google Scholar] [CrossRef]
  34. Bertram, N.; Fuchs, S.; Mischke, J.; Palter, R.; Strube, G.; Woetzel, J. Modular Construction: From Projects to Products. 2019. Available online: https://www.mckinsey.com/industries/capital-projects-and-infrastructure/our-insights/modular-construction-from-projects-to-products (accessed on 15 October 2022).
  35. Gunawardena, T.; Mendis, P. Prefabricated Building Systems—Design and Construction. Encyclopedia 2022, 2, 70–95. [Google Scholar] [CrossRef]
  36. Li, Y.; Chen, X.; Wang, X.; Xu, Y.; Chen, P.-H. A review of studies on green building assessment methods by comparative analysis. Energy Build. 2017, 146, 152–159. [Google Scholar] [CrossRef]
  37. Romano, S.; Riediger, N. BIM as a tool for Green Building Certifications: An evaluation of the energy category of LEED, BREEAM and DGNB. J. Phys. Conf. Ser. 2019, 1425, 012162. [Google Scholar] [CrossRef] [Green Version]
  38. Lee, W.L. A comprehensive review of metrics of building environmental assessment schemes. Energy Build. 2013, 62, 403–413. [Google Scholar] [CrossRef]
  39. Sánchez Cordero, A.; Gómez Melgar, S.; AndújarMárquez, J.M. Green Building Rating Systems and the New Framework Level(s): A Critical Review of Sustainability Certification within Europe. Energies 2019, 13, 66. [Google Scholar] [CrossRef] [Green Version]
  40. Dossche, C.; Boel, V.; De Corte, W. Use of Life Cycle Assessments in the Construction Sector: Critical Review. Procedia Eng. 2017, 171, 302–311. [Google Scholar] [CrossRef]
  41. Marjaba, G.E.; Chidiac, S.E. Sustainability and resiliency metrics for buildings—Critical review. Build. Environ. 2016, 101, 116–125. [Google Scholar] [CrossRef]
  42. AbdRashid, A.F.; Yusoff, S. A review of life cycle assessment method for building industry. Renew. Sustain. Energy Rev. 2015, 45, 244–248. [Google Scholar] [CrossRef] [Green Version]
  43. Kamali, M.; Hewage, K.; Sadiq, R. Conventional versus modular construction methods: A comparative cradle-to-gate LCA for residential buildings. Energy Build. 2019, 204, 109479. [Google Scholar] [CrossRef]
  44. Hernandez, P.; Oregi, X.; Longo, S.; Cellura, M. Life-Cycle Assessment of Buildings. In Handbook of Energy Efficiency in Buildings; Elsevier: Amsterdam, The Netherlands, 2019; pp. 207–261. [Google Scholar] [CrossRef]
  45. Evangelista, P.P.A.; Kiperstok, A.; Torres, E.A.; Gonçalves, J.P. Environmental performance analysis of residential buildings in Brazil using life cycle assessment (LCA). Constr. Build. Mater. 2018, 169, 748–761. [Google Scholar] [CrossRef]
  46. Islam, H.; Jollands, M.; Setunge, S. Life cycle assessment and life cycle cost implication of residential buildings—A review. Renew. Sustain. Energy Rev. 2015, 42, 129–140. [Google Scholar] [CrossRef]
  47. Ryklová, P.; Mančík, Š.; Lupíšek, A. Environmental Benefits of Timber-Concrete Prefabricated Construction System for Apartment Buildings—A Simplified Comparative LCA Study. IOP Conf. Ser. Earth Environ. Sci. 2019, 290, 012083. [Google Scholar] [CrossRef]
  48. Soust-Verdaguer, B.; Llatas, C.; García-Martínez, A. Simplification in life cycle assessment of single-family houses: A review of recent developments. Build. Environ. 2016, 103, 215–227. [Google Scholar] [CrossRef] [Green Version]
  49. Zabalza Bribián, I.; Aranda Usón, A.; Scarpellini, S. Life cycle assessment in buildings: State-of-the-art and simplified LCA methodology as a complement for building certification. Build. Environ. 2009, 44, 2510–2520. [Google Scholar] [CrossRef]
  50. Achenbach, H.; Wenker, J.L.; Rüter, S. Life cycle assessment of product- and construction stage of prefabricated timber houses: A sector representative approach for Germany according to EN 15804, EN 15978 and EN 16485. Eur. J. Wood Wood Prod. 2018, 76, 711–729. [Google Scholar] [CrossRef]
  51. Zhu, H.; Hong, J.; Shen, G.Q.; Mao, C.; Zhang, H.; Li, Z. The exploration of the life-cycle energy saving potential for using prefabrication in residential buildings in China. Energy Build. 2018, 166, 561–570. [Google Scholar] [CrossRef]
  52. Hong, J.; Shen, G.Q.; Mao, C.; Li, Z.; Li, K. Life-cycle energy analysis of prefabricated building components: An input-output-based hybrid model. J. Clean. Prod. 2016, 112, 2198–2207. [Google Scholar] [CrossRef] [Green Version]
  53. Hernández López, H.; Cobo Escamilla, A.; Mártinez Pérez, I. Análisis de ciclo de vida en viviendas: Un caso que contrasta muro de albañilería con muro de madera en una vivienda social = Life Cycle Assessment of dwellings: A case of study that contrasts masonry wall with wood-frame wall in a social housing. An. Edif. 2019, 5, 76. [Google Scholar] [CrossRef]
  54. Vilches, A.; Garcia-Martinez, A.; Sanchez-Montañes, B. Life cycle assessment (LCA) of building refurbishment: A literature review. Energy Build. 2017, 135, 286–301. [Google Scholar] [CrossRef]
  55. Lewandowska, A.; Noskowiak, A.; Pajchrowski, G.; Zarebska, J. Between full LCA and energy certification methodology—A comparison of six methodological variants of buildings environmental assessment. Int. J. Life Cycle Assess. 2015, 20, 9–22. [Google Scholar] [CrossRef] [Green Version]
  56. Ellen MacArthur Foundation. How the Circular Economy Tackles Climate Change. 2019. Available online: https://ellenmacarthurfoundation.org/completing-the-picture (accessed on 15 December 2022).
  57. Silvestre, J.D.; de Brito, J.; Pinheiro, M.D. Environmental impacts and benefits of the end-of-life of building materials—Calculation rules, results and contribution to a ‘cradle to cradle’ life cycle. J. Clean. Prod. 2014, 66, 37–45. [Google Scholar] [CrossRef]
  58. MalabiEberhardt, L.C.; van Stijn, A.; Nygaard Rasmussen, F.; Birkved, M.; Birgisdottir, H. Development of a Life Cycle Assessment Allocation Approach for Circular Economy in the Built Environment. Sustainability 2020, 12, 9579. [Google Scholar] [CrossRef]
  59. Romero Perez de Tudela, A.; Rose, C.M.; Stegemann, J.A. Quantification of material stocks in existing buildings using secondary data—A case study for timber in a London Borough. Resour. Conserv. Recycl. X 2020, 5, 100027. [Google Scholar] [CrossRef]
  60. Durmisevic, E. Reversible Building Design Guidelines and Protocols. 2018. Available online: https://www.bamb2020.eu/wp-content/uploads/2018/12/Reversible-Building-Design-guidelines-and-protocol.pdf (accessed on 18 September 2022).
  61. Wang, K.; de Regel, S.; Debacker, W.; Michiels, J.; Vanderheyden, J. Why invest in a reversible building design? IOP Conf. Ser. Earth Environ. Sci. 2019, 225, 012005. [Google Scholar] [CrossRef]
  62. Zink, T.; Geyer, R. Circular Economy Rebound. J. Ind. Ecol. 2017, 21, 593–602. [Google Scholar] [CrossRef]
  63. Adams, K.T.; Osmani, M.; Thorpe, T.; Thornback, J. Circular economy in construction: Current awareness, challenges and enablers. Proc. Inst. Civ. Eng. Waste Resour. Manag. 2017, 170, 15–24. [Google Scholar] [CrossRef] [Green Version]
  64. Akhimien, N.G.; Latif, E.; Hou, S.S. Application of circular economy principles in buildings: A systematic review. J. Build. Eng. 2021, 38, 102041. [Google Scholar] [CrossRef]
  65. Rahla, K.M.; Mateus, R.; Bragança, L. Selection Criteria for Building Materials and Components in Line with the Circular Economy Principles in the Built Environment—A Review of Current Trends. Infrastructures 2021, 6, 49. [Google Scholar] [CrossRef]
  66. Manninen, K.; Koskela, S.; Antikainen, R.; Bocken, N.; Dahlbo, H.; Aminoff, A. Do circular economy business models capture intended environmental value propositions? J. Clean. Prod. 2018, 171, 413–422. [Google Scholar] [CrossRef] [Green Version]
  67. Cambier, C.; Galle, W.; De Temmerman, N. Research and development Directions for Design Support Tools for Circular Building. Buildings 2020, 10, 142. [Google Scholar] [CrossRef]
  68. Munaro, M.R.; Tavares, S.F.; Bragança, L. Towards circular and more sustainable buildings: A systematic literature review on the circular economy in the built environment. J. Clean. Prod. 2020, 260, 121134. [Google Scholar] [CrossRef]
  69. ARUP. The Circular Economy in the Built Environment. 2016. Available online: https://www.arup.com/-/media/arup/files/publications/c/arup_circulareconomy_builtenvironment.pdf (accessed on 10 September 2022).
  70. Cheshire, D. Building Revolutions—Applying the Circular Economy to the Built Environment, 1st ed.; RIBA Publishing: London, UK, 2019. [Google Scholar]
  71. Zhang, C.; Zayed, T.; Hijazi, W.; Alkass, S. Quantitative Assessment of Building Constructability Using BIM and 4D Simulation. Open J. Civ. Eng. 2016, 6, 442–461. [Google Scholar] [CrossRef] [Green Version]
  72. Wimalaratne, P.L.I.; Kulathunga, U.; Gajendran, T. Comparison between the terms constructability and buildability: A systematic literature review. In Proceedings of the 9th World Construction Symposium 2021 on Reshaping Construction: Strategic, Structural and Cultural Transformations towards the “Next Normal”, Virtual, 8–10 July 2021; pp. 196–207. [Google Scholar] [CrossRef]
  73. Akinade, O.O.; Oyedele, L.O.; Bilal, M.; Ajayi, S.O.; Owolabi, H.A.; Alaka, H.A.; Bello, S.A. Waste minimisation through deconstruction: A BIM based Deconstructability Assessment Score (BIM-DAS). Resour. Conserv. Recycl. 2015, 105, 167–176. [Google Scholar] [CrossRef]
  74. O’Grady, T.; Minunno, R.; Chong, H.-Y.; Morrison, G.M. Design for disassembly, deconstruction and resilience: A circular economy index for the built environment. Resour. Conserv. Recycl. 2021, 175, 105847. [Google Scholar] [CrossRef]
  75. ICH. Manual del Albañil de Ladrillos Cerámicos; PrimeraInstituto del Cemento y el Hormigón de Chile: Santiago, Chile, 2010; Volume 1, Available online: https://ich.cl/documentos-edificacion/manual-de-albanileria-de-ladrillos-ceramicos/ (accessed on 10 August 2022).
  76. Astroza, M.; Andrade, F.; Moroni, M.O. Confined Masonry Buildings: The Chilean Experience. 2017, pp. 1–12. Available online: https://www.confinedmasonry.org/wp-content/uploads/2009/09/Eurocode-8-1-Earthquakes-general.pdf (accessed on 10 August 2022).
  77. INE. Resultados CENSO 2017. 2017. Available online: http://resultados.censo2017.cl/ (accessed on 20 April 2019).
  78. Bunster, V.; Noguchi, M. Profiling Space Heating Behavior in Chilean Social Housing: Towards Personalization of Energy Efficiency Measures. Sustainability 2015, 7, 7973–7996. [Google Scholar] [CrossRef] [Green Version]
  79. Chastas, P.; Theodosiou, T.; Bikas, D.; Kontoleon, K. Embodied Energy and Nearly Zero Energy Buildings: A Review in Residential Buildings. Procedia Environ. Sci. 2017, 38, 554–561. [Google Scholar] [CrossRef]
  80. Oyarzo, J.; Peuportier, B. Life cycle assessment model applied to housing in Chile. J. Clean. Prod. 2014, 69, 109–116. [Google Scholar] [CrossRef]
  81. Hammond, G.; Jones, C. Embodied Carbon: The Inventory of Carbon and Energy (ICE). A BSRIA Guide. 2011, p. 136. Available online: http://www.emccement.com/pdf/Full-BSRIA-ICE-guide.pdf (accessed on 10 July 2022).
  82. Azari, R.; Abbasabadi, N. Embodied energy of buildings: A review of data, methods, challenges, and research trends. Energy Build. 2018, 168, 225–235. [Google Scholar] [CrossRef]
  83. Oregi, X.; Hernandez, P.; Hernandez, R. Analysis of life-cycle boundaries for environmental and economic assessment of building energy refurbishment projects. Energy Build. 2017, 136, 12–25. [Google Scholar] [CrossRef]
  84. Kumanayake, R.; Luo, H. A tool for assessing life cycle CO2 emissions of buildings in Sri Lanka. Build. Environ. 2018, 128, 272–286. [Google Scholar] [CrossRef]
  85. Data SpA and CDT. Informe Final Uso de la Energía Hogares Chile 2018. 2019. Available online: https://www.energia.gob.cl/sites/default/files/documentos/informe_final_caracterizacion_residencial_2018.pdf (accessed on 10 August 2022).
  86. Sousa, J. Energy simulation software for buildings: Review and comparison. CEUR Workshop Proc. 2012, 923, 57–68. [Google Scholar]
  87. Avendaño-Vera, C.; Martinez-Soto, A.; Marincioni, V. Determination of optimal thermal inertia of building materials for housing in different Chilean climate zones. Renew. Sustain. Energy Rev. 2020, 131, 110031. [Google Scholar] [CrossRef]
  88. Harish, V.S.K.V.; Kumar, A. A review on modeling and simulation of building energy systems. Renew. Sustain. Energy Rev. 2016, 56, 1272–1292. [Google Scholar] [CrossRef]
  89. Ahumada, M.; Ossio, F. Evaluación Económica de la Construcción de Viviendas Circulares en Chile; Escuela de Construcción Civil de la Pontificia Universidad Católica de Chile: Santiago, Chile, 2021. [Google Scholar]
  90. Dixit, M.K. Life cycle embodied energy analysis of residential buildings: A review of literature to investigate embodied energy parameters. Renew. Sustain. Energy Rev. 2017, 79, 390–413. [Google Scholar] [CrossRef]
  91. Chastas, P.; Theodosiou, T.; Kontoleon, K.J.; Bikas, D. Normalising and assessing carbon emissions in the building sector: A review on the embodied CO2 emissions of residential buildings. Build. Environ. 2018, 130, 212–226. [Google Scholar] [CrossRef]
  92. Mercado Burciaga, U.; Sáez, P.V.; Ayón, F.J.H. Strategies to Reduce CO2 Emissions in Housing Building by Means of CDW. Emerg. Sci. J. 2019, 3, 274–284. [Google Scholar] [CrossRef] [Green Version]
  93. Adabre, M.A.; Chan, A.P.C. The ends required to justify the means for sustainable affordable housing: A review on critical success criteria. Sustain. Dev. 2019, 27, 781–794. [Google Scholar] [CrossRef]
  94. Shu, H.; Bie, X.; Zhang, H.; Xu, X.; Du, Y.; Ma, Y.; Duanmu, L.; Cao, G. Natural heat transfer air-conditioning terminal device and its system configuration for ultra-low energy buildings. Renew. Energy 2020, 154, 1113–1121. [Google Scholar] [CrossRef]
  95. Dodge Data & Analytics. Prefabrication and Modular Construction 2020. 2020. Available online: https://proddrupalcontent.construction.com/s3fs-public/SMR1219_Prefab_2020_small-compressed.pdf (accessed on 10 September 2022).
  96. Ghisellini, P.; Ripa, M.; Ulgiati, S. Exploring environmental and economic costs and benefits of a circular economy approach to the construction and demolition sector. A literature review. J. Clean. Prod. 2018, 178, 618–643. [Google Scholar] [CrossRef]
  97. Tam, V.W.Y.; Tam, C.M. A review on the viable technology for construction waste recycling. Resour. Conserv. Recycl. 2006, 47, 209–221. [Google Scholar] [CrossRef] [Green Version]
  98. Hill, C.A.S.; Dibdiakova, J. The environmental impact of wood compared to other building materials. Int. Wood Prod. J. 2016, 7, 215–219. [Google Scholar] [CrossRef]
  99. Ramage, M.H.; Burridge, H.; Busse-Wicher, M.; Fereday, G.; Reynolds, T.; Shah, D.U.; Wu, G.; Yu, L.; Fleming, P.; Densley-Tingley, D.; et al. The wood from the trees: The use of timber in construction. Renew. Sustain. Energy Rev. 2017, 68, 333–359. [Google Scholar] [CrossRef]
  100. Hossain, M.U.; Thomas Ng, S. Influence of waste materials on buildings’ life cycle environmental impacts: Adopting resource recovery principle. Resour. Conserv. Recycl. 2019, 142, 10–23. [Google Scholar] [CrossRef]
  101. Owolabi, J.D.; Faleye, D.; Eshofonie, E.E.; Tunji-Olayeni, P.F.; Afolabi, A.O. Barriers and drivers of innovation in the nigerian construction industry. Int. J. Mech. Eng. Technol. 2019, 10, 334–339. [Google Scholar] [CrossRef]
  102. Thorp, T.N.; Fischer, E.C.; Sinha, A. Another proposal for future research is to analyze how fire action affects the results. This is based on the Fire-LCA methodology, which adds modules to the traditional LCA to consider the effect of a fire during the lifetime of the structure. Fire Saf. J. 2022, 129, 103571. [Google Scholar] [CrossRef]
  103. Ribeirinho, M.J.; Mischke, J.; Strube, G.; Sjödin, E.; Blanco, J.L.; Palter, R.; Biörck, J.; Rockhill, D.; Andersson, T. The Next Normal in Construction: How Disruption Is Reshaping the World’s Largest Ecosystem; McKinsey & Company, 2020. Available online: https://www.mckinsey.com/capabilities/operations/our-insights/the-next-normal-in-construction-how-disruption-is-reshaping-the-worlds-largest-ecosystem (accessed on 10 December 2022).
  104. Lao, J.-C.; Xu, L.-Y.; Huang, B.-T.; Zhu, J.-X.; Khan, M.; Dai, J.-G. Utilization of sodium carbonate activator in strain-hardening ultra-high-performance geopolymer concrete (SH-UHPGC). Front. Mater. 2023, 10, 1142237. [Google Scholar] [CrossRef]
Figure 1. Off-site construction categories.
Sustainability 15 06267 g001
Figure 2. Cradle-to-grave systems boundary used in a conventional building’s LCA adapted to identify OSC boundaries.
Sustainability 15 06267 g002
Figure 3. Interrelated dimensions to be considered in circular building assessments.
Sustainability 15 06267 g003
Figure 4. Assembly of VAP frames for a building project.
Sustainability 15 06267 g004
Figure 5. Displayed from left to right are the following: (a) The manufacture of plywood joint parts with circles indicating screw placement and the word VAP denoting the orientation of the connection; and (b) VAP system modules to be transported by flatbed truck to the construction site.
Sustainability 15 06267 g005
Figure 6. From left to right, assembled VAP modules and finished housing are shown.
Sustainability 15 06267 g006
Figure 7. Displayed from left to right are two plans related to the VAP house case study: (a) A floor plan that includes approximate dimensions of the house, and (b) A section plan that provides a detailed view of the house’s structure.
Sustainability 15 06267 g007
Figure 8. EE and CE distributed by building elements for both VH and CH.
Sustainability 15 06267 g008
Figure 9. EE in construction materials for both CH and VH.
Sustainability 15 06267 g009
Figure 10. EC in construction materials for both CH and VH.
Sustainability 15 06267 g010
Figure 13. Thermal comfort energy demand for both VH and CH.
Sustainability 15 06267 g013
Table 1. Main characteristics of VH and CH model.
Building ElementsVHCH
Roof and ceilingConfigured by VAP components, plasterboard of 1 cm, galvanized sheets. U = 0.17 W/m2KRoof trusses and ceiling frame structured in timber, galvanized sheets (w = 0.35 mm), 10 cm of EPS, and plasterboard of 1 cm. U = 0.40 W/m2K
Structural wallsConfigured by VAP components, OSB and fiber cement externally, and 1 cm plasterboard internally. U = 0.20 W/m2K.Reinforced masonry, confined by reinforced concrete beams (4ϕ12 s = ϕ8@15 cm). U = 1.9 W/m2K.
Floor and FoundationCeramic tiles, concrete floor, and strap footing foundation. Ceramic tiles, concrete floor, strip footing, and tie-beam.
Non-structural wallsLight steel framing (LSF) and painted 10 mm plasterboard. LSF and painted 10 mm plasterboard.
Doors and windowsWooden doors with U = 2.5 W/m2K. Single glazing with U = 5.7 W/m2K. Wooden doors with U = 2.5 W/m2K. Single glazing with U = 5.7 W/m2K.
Table 2. Main materials and impact environmental factors considered in both VH and CH.
MaterialVH Weights% of TotalCH Weights% of TotalEEEC
(kg)(kg)MJ/kgkgCO2eq/kg
Concrete22,82075.5%60,92971.6%0.880.132
Bricks--11,67713.7%3.000.240
Mortar--868810.2%1.330.221
Plywood20296.7%350.0%15.001.100
Plasterboard (PB)14344.7%5710.7%6.750.390
OBS5101.7%--15.000.990
Fiber cement 7972.6%--15.301.280
Timber7232.4%8251.0%10.000.710
Galvanized steel (GS)4181.4%3650.4%22.601.540
EPS3641.2%730.1%88.603.290
Steel2971.0%11751.4%20.101.460
Glass1350.4%1350.2%15.000.910
Other materials6962.3%6260.7%--
Total30,223100%85,100100%
Table 3. Main considerations for the Energy Simulation.
ItemConsiderations
Building-related The specified in Table 1.
Operational-related Main air change rate 0.74 vol/h.
0.06 occupants per square meter.
Thermal comfort according to static graphical method of ASHRAE 55 Standard.
Weather-related Chilean Climate Zone Z3 (Santiago), Weather file relate: CHL IWEC Data WMO# = 855,740.
Table 5. FD and transport-related carbon and energy emissions.
TransportVHCH
FD (l)Energy (MJ)Emissions (kgCO2eq)FD (l)Energy (MJ)Emissions (kgCO2eq)
Supplier to plant33120476---
Plant to site682451155---
Supplier to site8430101902509031570
Total18566654212509031570
Table 6. Energy and carbon emissions related to the building process.
ItemVH CH Energy
Energy (MJ) Emissions (kgCO2eq)Energy (MJ) Emissions (kgCO2eq)
On-site28333007038767
On-plant243728300
Total52705837038767
Table 7. CED and GWP for VH.
VH—Analyzed StagesCEDGWP
MJ/m2% of TotalkgCO2eq/m2% of Total
A1–3(i) Materials for prefabrication and construction required2353.016.8%167.511.6%
(ii) Transport of materials to prefabrication plant17.80.1%1.10.1%
(iii) VAP system production on the plant76.80.5%7.20.5%
A4–5(iv) Transport of VAP elements and other materials required to the construction site80.70.6%5.10.4%
(v) On-site construction, assemblage, and finishing 176.81.3%15.41.1%
B6(vi) Operational energy use for thermal comfort (50 years)11,300.080.7%1250.086.4%
Total14,005100%1446100%
Table 8. CED and GWP for CH.
CH–Analyzed Stages CEDGWP
MJ/m2% of TotalkgCO2eq/m2% of Total
A1–3(i) Construction materials required2520.78.9%253.38.9%
A4–5(iv) Transport of construction materials required to the construction site133.40.5%8.40.3%
(v) On-site construction and finishing 446.11.6%41.81.5%
B6(vi) Operational energy use for thermal comfort (50 years)25,100.089.0%2550.089.4%
Total28,200100%2854100%
Table 9. PMC—MIN, PMC-Max, and PMC-PMAX for VH and CH.
Building ElementVHCH
% MassPMC—MINPMC—MAXPMC—MAXP% MassPMC—MINPMC—MAXPMC—MAXP
Roof and ceiling8.35%2.82%3.12%4.72%1.87%0.47%0.57%0.73%
Structural walls10.20%2.66%3.27%4.80%32.10%0.12%0.61%11.30%
Floor and foundation78.06%0.14%1.86%33.93%65.36%0.07%1.26%28.96%
Non-structural walls1.95%0.04%0.11%0.23%0.15%0.01%0.02%0.02%
Doors and windows1.13%0.72%0.72%0.72%0.40%0.25%0.25%0.25%
Other elements0.30%0.11%0.11%0.12%0.11%0.04%0.04%0.04%
Total100%6.48%9.18%44.52%100%0.96%2.75%41.31%
Table 10. PMC averages considered for frequent materials.
MaterialsPMC-MINPMC-MAXPMC-MAXP
Concrete0.0%1.6%43.8%
Bricks0.0%0.0%50.0%
Mortar0.0%0.0%12.5%
Plywood42.8%57.8%69.8%
Plasterboard2.8%6.2%10.9%
OBS25.0%37.5%45.0%
Timber75.0%80.8%85.4%
Expanded polystyrene7.5%16.3%30.0%
Steel12.0%42.2%48.1%
Glass37.5%37.5%37.5%
PVC0.0%0.0%9.0%
Ceramic0.0%7.5%39.3%
Aluminum50.0%62.5%62.5%
Disclaimer/Publisher’s Note: The statements, opinions and data contained in all publications are solely those of the individual author(s) and contributor(s) and not of MDPI and/or the editor(s). MDPI and/or the editor(s) disclaim responsibility for any injury to people or property resulting from any ideas, methods, instructions or products referred to in the content.

