Article

Carbon Emission Efficiency, Technological Progress, and Fishery Scale Expansion: Evidence from Marine Fishery in China

1
Western Guangdong Grassroots Governance Innovation Research Center, Lingnan Normal University, Zhanjiang 524088, China
2
School of Economics and Management, Shanghai Ocean University, Shanghai 201306, China
3
School of Social and Public Administration, Lingnan Normal University, Zhanjiang 524088, China
4
School of Credit Management, Guangdong University of Finance, Guangzhou 524094, China
5
School of Economics, Liaoning University, Shenyang 110036, China
*
Authors to whom correspondence should be addressed.
The first affiliation and the second one contribute equally.
Sustainability 2023, 15(8), 6331; https://doi.org/10.3390/su15086331
Submission received: 6 February 2023 / Revised: 30 March 2023 / Accepted: 31 March 2023 / Published: 7 April 2023

Abstract

:
China’s technical progress on emissions and vast ocean area make the study for CO2 emission reduction suitable in a marine fishery. This study uses the slack variables of SBM and the Malmquist index to analyze the CO2 emission efficiency of Trawler, Seine net, Drift net, Fixed net, and Angling, along with their efficiency values, distinguishing the impact of technological progress, scale expansion, and technological efficiency. Results show that the CO2 emission efficiency of the Angling and Seine industry is high with the development potential of the low-carbon fishery. Moreover, China’s technological progress is increasing, but the technical efficiency of CO2 emission reduction is declining. Lack of pure technical efficiency is the primary constraint of low-carbon capture fishery, making changes in efficiency show a downward trend. These results expand the research depth of the efficiency impact of technological progress and reveal that technological progress keeps increasing, but the CO2 emission reduction efficiency is decreasing. This indicates that emission reduction requires both technological growth and the technology’s capacity to reduce CO2 emissions efficiently.

1. Introduction

Since 2009, China has surpassed the United States as the world’s largest carbon emitter, eventually leading to China’s CO2 emissions governance becoming an important topic [1]. The Chinese government has also pledged to peak its CO2 emissions around 2030 and will exert its “best efforts” to peak early [2]. CO2 reduction initiatives have been gradually implemented in various industries. Simultaneously, however, the country also has many large fishing fleets offshore, and its coastal fleet is dominated by vessels less than 24 m in length (comprising 88% of its total number), of which small fishing vessels less than 12 m in length account for more than 68% [3]. In 2016, the country’s production of edible fish products reached 49.244 million tons, accounting for 61.5% of the global output [4]. Its marine fisheries also account for nearly 60% to 70% of total fisheries emissions [5,6], making emission reduction from these fishery industries more critical.
The International Maritime Organization’s Marine Environment Protection Committee adopted amendments to the International Convention for the Prevention of Pollution from Ships Annex VI at an online meeting held on 10–17 June 2021, requiring ships to reduce greenhouse gas emissions, meaning that ship emission reductions are becoming an emissions reduction target. Capture fisheries are a critical aspect of CO2 emissions among marine fisheries and significantly contribute to the industry’s total CO2 emissions. Thus, achieving CO2 emission reduction in marine capture fisheries is an important environmental issue.
During the period of national economic recovery in the early 1950s, most fishing boats of fishing companies were wooden ones between 60 and 160 horsepower, and only the Shanghai Fishing Company had a group of 160 horsepower steel-hulled fishing boats. In 1979, the country began to reform and open up, characterized by its liberalization of the production and sale of aquatic products, thus inducing the emergence of a boom in the construction of fishing boats. With this increase in coastal township enterprises, individual households began to build 120–250 horsepower steel fishing boats. From 2010 to 2019, China’s steel marine fishing vessels had grown to nearly 100,000, and the total marine fishing output reached 10 million tons, resulting in excessive fishing and causing a severe decline and damage to China’s marine resources, especially in blue water maritime regions. China has more than 2500 ocean-going fishing vessels, and the annual output of ocean-going fisheries has reached 1.8 million tons.
At the beginning of the country’s reform and opening up in 1978, China’s capture fisheries were mainly concentrated in small-scale offshore operations, and the environmental problems caused by its CO2 emissions did not attract public attention. With the investment in capture fisheries, the power and number of fishing vessels have recently grown substantially. As this scale increases, the efficiency of CO2 emissions from fisheries also faces many uncertainties. The CO2 emissions from fishing per unit output value are 0.35 tons of standard coal per CNY (Chinese Yuan) 10,000, 1.84 times the average CO2 emissions from agriculture [7,8]. Hence, there is much potential to reduce CO2 emissions in China’s capture fisheries.
The same problem plagues the development of global fisheries—numerous studies and instances show that CO2 emissions from global fishing are increasing. The international Food and Agriculture Organization (FAO) estimates that the average ratio of fuel to carbon dioxide emissions is about 3 billion kilograms for every 1 million tons of energy from global fisheries [9]. Meanwhile, fishery CO2 emissions account for a significant portion of the ocean’s total CO2 emissions [10,11,12]. Increases in fuel costs have also resulted in the current fishing price being about $40 billion higher than its earlier values at the beginning of the century, stemming from rising oil prices and the rising power and decreasing efficiency of fishing vessels. When competition increases, fishermen are willing to increase their efforts (more fuel and more energy) to obtain fish, which triggers more CO2 emissions [13]. Thus, the mechanism of technological progress affecting CO2 efficiency remains the development gap. This ultimately warrants further discussions on the scale expansion of the fishing industry, primarily since the rapid growth of China’s capture fishery has led to technical progress and scale expansion. Therefore, this paper uses China’s fishery industry to analyze CO2 emission efficiency, technological advancement, and scale expansion.
To date, even fewer studies have explored the effect of technological progress on considering the rate change in CO2 emission from marine fishing. This study aims to determine the evolutionary trend of the CO2 emission efficiency of the marine fishery and uses the Malmquist index to analyze the role of scale expansion and technological progress in influencing marine CO2 emissions. Eleven administrative regions (nine provinces and two municipalities) along the coast of China were assessed, including Liaoning, Hebei, Tianjin, Shandong, Jiangsu, Zhejiang, Shanghai, Fujian, Guangdong, Guangxi, and Hainan.
Statistical fishing methods include Trawling, Seine net, Drift net, Fixed net, and Angling, which provide suitable conditions for the subsequent DEA calculation. Among these, DEA is the most widely used method in efficiency analysis. Scholars thus use the SBM model and Malmquist index of DEA to study CO2 emission efficiency [14], energy efficiency [15], environmental efficiency [16,17,18,19], etc. The SBM model is also built herein, which includes undesired output and calculates the efficiency value using CO2 emissions as undesired output. Afterward, the current study makes a comparative analysis of the CO2 emission efficiency of different fishing methods. Finally, the Malmquist index is used to study technological innovation and scale change in CO2 emission efficiency to explain fishery CO2 emissions.
A comprehensive analysis of the linkage between the allocation efficiency or capacity of technological elements and the carbon emissions from the marine fishery is lacking so far. This study attempts to close this research gap by assessing the issue of CO2 emission from marine fishery through the calculation Malmquist index of deviation correction with three contributions as follows. First, the technological progress is differentiated into pure technical efficiency, scale efficiency, and expansion, rather than only technical index to observe the trend of carbon emissions from marine fishery driven by different efficiencies. Second, most papers measure the efficiency with the classical DEA Model but fail to account for the number of input units, which is likely the more relevant attribute for the integration deviation out of the leakage of input fragmentation. Given that the productive frontier of the missing data unit is repaired by a technical element, a calculation Malmquist index of deviation correction is built to address this estimation issue. Third, our research advances a more comprehensive understanding of the profile of how to reduce the CO2 emission of marine fishing in different technical factors as a critical yet poorly identified path, in which pure technical efficiency is used to inspect the fisherman’s allocation ability and the scale efficiency is used to observe the distance between the actual operation and optimal allocation in marine fishing.
This study is divided into the following sections. Section 1 introduces the background of the CO2 emission status from marine fishing, technological progress, and the scale effect on marine CO2 emissions. Section 2 presents the marine CO2 emission reduction and related literature review. Section 3 offers methods and data, research in scale efficiency, application conditions of SBM and TFP, etc. Section 4 describes the efficiency results and the corresponding analysis. A further discussion on the effects of technological changes then follows. Section 5 finally outlines this study’s main conclusions and its policy implications.

2. Literature Review

Scholars posit that technological progress has an enormous impact on CO2 emissions [20,21,22], although there are differing views on the emission reduction effect of technological advancement. Existing studies have incorporated technological progress into theoretical and mathematical models and concluded that technological progress impacts CO2 emission reduction. However, scholars have been increasingly arguing that technological progress has a catalytic effect on CO2 emissions. The social effects of technological progress over more extended periods also were researched, asserting that technological progress increases human demand for social resources and lower behavioral costs, thus exacerbating CO2 emissions behavior. Therefore, studying the impact of technological advancement and scale expansion on CO2 emission reduction is essential.
Studies conducted on CO2 emissions and technological progress can be divided into three main categories. In the first category, technological progress reduces CO2 emissions and improves user efficiency. Marine capture fisheries are fuel-dependent industries. Thus, advancements in fuel efficiency also affect the industry, such as increasing catch rates and avoiding unnecessary maneuvers. Zhang et al. (2012) analyzed China’s economic growth, energy consumption, and CO2 emissions from 1997 to 2007 and found that technological progress increased the efficiency of fossil fuel consumption and reduced CO2 emissions [23]. Gerlagh and Van (2004) argued that technological progress lowers CO2 emissions by transforming energy consumption and reducing fossil fuel use [24]. Dong et al. (2022) used a study sample of 32 developed countries with carbon neutrality targets and used a spatial econometric model to explore the impact of green technology innovation on carbon efficiency [25]. They found that environmentally relevant green technology innovation significantly improves carbon efficiency.
In the second group, technological progress contributes to CO2 emissions. Some scholars argue that technological progress accelerates the promotion of product iterations, and iterative product updates expand new demand and reduce the cost of moving needs. Similarly, technological progress increases the degree of competition, thus resulting in a more significant source of CO2 emissions. Munir and Ameer (2022) posited that technology enhanced environmental degradation (e.g., SO2 emissions) in emerging Asian economies [26]. Chen et al. (2020) and Yang et al. (2021) both concluded that technological progress increased energy consumption and CO2 emissions due to increased output [27,28].
In the third group, the ultimate impact of technological progress on CO2 emissions is unclear due to complex social mechanisms, with some scholars arguing the existence of an inverted U-shaped relationship between technological progress and emission reduction. In the former development state, technological progress is more concerned with economic profit to complete the initial accumulation of industrial structure. With the improvement in the industrial system and profit growth, managers are forced to focus more on energy saving and emission reduction due to the pressure from social opinion or environmental costs. Using the Environment Kuznets Curve (EKC), this study demonstrates that energy regulation measures help reduce greenhouse gas emissions (GHG) [29].
EKC theory makes it clear that scale-up and technological progress has two sides. On the one hand, scale expansion and technological progress can lead to CO2 emission reductions and reduce fishing costs. On the other hand, in behavioral economics, when the cost of behavior is reduced, actors are more willing to take on such actions. Therefore, under the influence of complex social relationships, the impact of scale expansion and technological progress of capture fisheries on the CO2 emission efficiency of fisheries is worth exploring, which therefore calls into doubt whether the growth of the fishery scale can increase emission reduction capacity.
The low-carbon development of marine fisheries is necessary for a high-quality fishing product, and efforts must be made to improve the CO2 emission efficiency of marine fishing. Carbon efficiency is defined as earning more economic profit while paying for the same amount of CO2 emissions. Additionally, economic efficiency is a relative number with no absolute standard. Using the Malmquist index completes the decomposition of production inputs and outputs into scale effect and technological progress, allowing for the proper analysis of the development state of the marine fishing industry in recent years. Zhang (2018) exemplified the decomposition of production inputs and outputs into scale effect by using total factor energy efficiency and carbon efficiency to compare the impact of joining Clean Development Mechanism projects on carbon efficiency in several countries [30].
There exists a rich scholarly discussion on the idea of ocean carbon efficiency [31,32,33], with most studies focused on the relationship between energy, carbon emissions, the environment, and the economy. Some scholars intensely focus on energy consumption or energy efficiency. Cheilari et al. (2013) explored fuel price’s influence on energy and fishing fleets’ economic performance from the fuel crisis perspective [34]. Tao et al. (2020) calculated the effect of energy consumption on the economic development of China’s marine zone using a semi-parametric partial linear model [35]. Santosa and Pranatal (2021) found a proper catamaran hull free of fossil fuel [36]. Prussi et al. (2021) even discussed the possible contribution of alternative fuels to the maritime sector [37].
Several studies have also focused on different types of Trawling and concluded that different fishing patterns have various efficiency differences in energy and carbon use. However, CO2 emission efficiency is generally poorly developed overall, despite the availability of policy suggestions [38,39]. For example, properly developing the diversity of Trawling can contribute to resource sustainability and energy conservation. Some scholars also use life cycle and carbon footprint methods to compare the impacts of different fishing methods on carbon and the environment [31,32,33], revealing the difference in CO2 emissions caused by other factors.
By addressing the abovementioned issues, this study makes several contributions. First, it uses Malmquist’s theories to distinguish between the assistance of technology scale and technology efficiency in CO2 emissions from capture fisheries in a pioneering way. Previous studies have not determined whether the growth of carbon efficiency originates from either scale growth or technological progress effects, despite said distinction having significant implications for ocean CO2 emission efficiency governance. Second, although much evidence suggests that technological progress can reduce emissions, earlier scholars did not examine the impact on growth and efficiency. Lastly, this study expands the application of the Malmquist theories by distinguishing between the carbon reduction effect of technical progress and technical efficiency in the context of a developing country such as China.

3. Methods and Data

The environmental problem of greenhouse gas emissions has attracted global attention, with national emission reduction and developing a low-carbon economy becoming mainstream topics worldwide. Capture fisheries are a production method highly dependent on fuel consumption and are characterized by high CO2 emissions and intensity in agricultural production. Moreover, the scale of China’s marine fishing operations is the largest in the world. Thus, a study of China’s fishing emission reduction is of great representative significance in the field of agricultural emission reduction and marine emission reduction. The data used in this paper are from China Fishery Statistical Yearbook from 2009 to 2019.
Meanwhile, China Fisheries Statistical Yearbook distinguishes statistics according to fishing methods. The capture fisheries sector is divided into either Trawler, Seine net, Fixed net, Drift net, Angling, and others, with the first five operating methods selected as the object of the current study. The data herein were obtained from China Fishery Statistical Yearbook, and the CO2 emission data are measured by the IPCC CO2 emission assessment method.

3.1. Data Collection

Studies on fishing efficiency summed up the factors affecting its efficiency, which include power, size, labor force, technical input, and other aspects of fishing boats [40,41]. Devi (2021) analyzed Trawlers’ fuel consumption, energy utilization, and CO2 emission rates and compared the operating efficiency of various Trawlers on the northwest coast of India [42]. Energy efficiency and CO2 emission efficiency are closely related to fishery resources. For example, overcapacity leads to the over-exploitation of marine resources. The subsequent marine resources shortage will then lead to more investment, resulting in the problem presented by the infamous Tragedy of the Commons [43,44].
The number of fishing boats of the five fishing methods was selected as the capital variable, thus revealing the capital input. The fishing industry employees measured the labor variable, which can directly describe the labor input of the fishing industry. Because technical variables cannot be directly measured, the current study used the number of fishery technology promotion agencies and the amount of fishery technology promotion funds to measure technology applications. The more funds there are for technology promotion agencies and technology promotion, the faster the technology promotion scope and upgrade become. Technology promotion funds and institutions are a public good and service that benefit all modes of fishing in the region. Hence, data for one area represents the input of all fishing methods. Output variables take the output value of capture fisheries (excluding pelagic fishing) as economic output data and carbon dioxide emissions as undesired output. Data were collected from the China Fisheries Statistical Yearbook. Therefore, the descriptions of collected data can be shown in Table 1.
This paper uses the usual IPCC emission assessment method to calculate carbon emission data. Carbon emissions from fishing boats were measured as follows [45].
T = P × ρ × τ
where T represents carbon emissions from fishing (ton), P represents power (kW), ρ is the conversion coefficient of fishing vessel fuel consumption (ton/kW), and τ is the carbon emission coefficient of diesel, with τ = 0.5921. Following the data, the calculation method of the conversion coefficient of fishing vessel fuel consumption is as follows:
ρ = T D a y s × H D a y × 0.000205 ( ton / kw / h )
where T D a y s are the total fishing days per year and H D a y denotes the hours per day. According to official data from the Ministry of Agriculture of China, ρ is apparently as follows: Trawler (0.4800 ton/kw); Seine net (0.4920 ton/kw); Drift net (0.4510 ton/kw); Fixed net (0.3280 ton/kw); Angling (0.3280 ton/kw); and others (0.3120 ton/kw). These above measurement coefficients are from the Ministry of Agriculture and Rural Affairs in China. The final numerical results were determined by counting the average operating hours of each type of fishing vessel.

3.2. Undesired Output SBM Model

3.2.1. SBM Model

Data Envelopment Analysis (DEA) is an efficiency analysis method that uses multidimensional input and output data to evaluate organizational productivity. It can determine the most efficient organizations by comparing the input and output situations of different organizations, thus assisting businesses in adjusting their workflow and improving efficiency. DEA has many advantages, as follows. First, DEA can be used to identify the most efficient DMUs, helping them better understand their leading competitors and take corresponding actions. Second, DEA can assist DMUs in improving efficiency by helping them compare themselves with other DMUs, clarify their goals and performance, and thus improve their efficiency. Third, DEA can identify the most efficient DMUs, helping to improve the overall efficiency of DMUs. This can assist businesses in allocating resources effectively to the most efficient organizations.
Tone (2001) proposed an efficiency measure, SBM, based on slack variables and directly added the slack variables into the model [46]. Later, Tone and Sahoo (2003) proposed a new measurement efficiency scheme with undesired outputs based on the SBM model [47]. The SBM model of undesired outcomes incorporates undesired results, thus correcting the efficiency bias caused by ignoring destructive behaviors and providing a new method for measuring the efficiency of undesired outputs. The SBM, therefore, calculates efficiency and reasonably estimates the redundancy of a particular resource, which is measured by the slack variables in the model. The slack variables can then be used to analyze the efficient utilization of a specific resource, such as CO2 emission and energy utilization efficiency [16].
Assuming the research object has K decision units, each decision unit has M input variables: X = ( x 1 , x 2 , , x M ) , Q expected output variables: Y = ( y 1 , y 2 , , y Q ) , and P undesired output variables: B = ( b 1 , b 2 , , b P ) . In each period t = 1 , 2 , , T , the production possibility set comprises the input–output combination of K decision-making units [47]. Thus, the undesired output SBM model is as follows:
min ρ = t 1 M m = 1 M t s m / x m k
s . t . X t λ + t s t x k = 0
Y t λ t s + t y k = 0
B t λ + t s b t b k = 0
t = 1 1 + 1 Q q = 1 Q s q + / y q k + 1 P p = 1 P s p b / b p k
λ , s + , s , s b 0
where s , s + , s b represent the excessive input, the insufficient desirable output, and the excessive undesirable output, respectively, which are called the slack variable. λ is the intensity vector. The efficiency score ρ is between 0 and 1. A higher score means more efficiency. If ρ = 1, the DMU is practical and on the production front. Because this model is not a linear function, we transformed model (2) with equivalent linear programming for S , S + , S b , and Λ , as follows:
min ρ = t 1 M m = 1 M S m / x m k
s . t . X Λ + S t x k = 0
Y Λ S + t y k = 0
B Λ + S b t b k = 0
t + 1 Q q = 1 Q S q + / y q k + 1 P p = 1 P S p b / b p k = 1
Λ , S + , S , S b 0
where S = t s , S + = t s + , S b = t s b , Λ = t λ . The SBM Model calculates the efficiency of CO2 emissions (Figure 1). The calculation principle is as follows:
Given the target carbon emissions, OC represents the actual carbon emissions and OC OC represents the negligent amount of carbon emissions S E . The carbon emission efficiency can be expressed as follows:
E = OC OC = OC ( OC OC ) OC = 1 S E OC
If P is on the production front, there is no redundancy of carbon resources, i.e., S E = 0 and E = 1 .
The classification criteria for Data Envelopment Analysis (DEA) efficiency analysis results are usually based on efficiency scores. A standard classification method divides the sample into several equally spaced intervals according to the efficiency score, aiming to classify the model into different groups of efficiency levels to compare and analyze differences in efficiency levels. For example, a similar approach has been used in applying DEA in the financial sector to assess banks’ efficiency and classify them into different efficiency groups to compare and analyze their differences. The efficiency values are organized in Table 2.

3.2.2. Malmquist Index

DEA is a method of measuring efficiency using the production frontier surface (envelope). However, it cannot measure dynamic factors as a static measure of cross-sectional data. Rolf Fare et al. combined the theory of the Malmquist index with DEA so that the Malmquist index compensates for the shortcomings of the static measurement of the standard DEA model in the time dimension. The principle of efficiency measurement in the time dimension is shown in Figure 2. The Malmquist index has been widely used in measuring production efficiency in fields such as finance, industry, medical treatment, energy, and so on [48].
Figure 2 illustrates the principle of calculating the Malmquist index. x 1 and x 2 indicate input variable, y denotes output variables. The superscripts t and t + 1 represent data for periods t and t + 1 , respectively. The frontier for a period t is A t B t C t , and the frontier for a period t + 1 is A t + 1 B t + 1 C t + 1 . The Malmquist productivity index [49,50] for the frontier t is as follows:
E t ( K 1 t ) = O K 2 t O K 1 t , E t ( K 1 t + 1 ) = O K 2 t + 1 O K 1 t + 1 , E t ( K 1 t + 1 ) E t ( K 1 t ) = O K 2 t + 1 / O K 1 t + 1 O K 2 t / O K 1 t
Meanwhile, the Malmquist productivity index for the frontier t + 1 is as follows:
E t + 1 ( K 1 t ) = O K 3 t O K 1 t , E t + 1 ( K 1 t + 1 ) = O K 3 t + 1 O K 1 t + 1 , E t + 1 ( K 1 t + 1 ) E t + 1 ( K 1 t ) = O K 3 t + 1 / O K 1 t + 1 O K 3 t / O K 1 t
The geometric mean of the two Malmquist indexes was used as the Malmquist index of the evaluated DMU by Rolf Fare et al.
M ( K t + 1 , K t ) = E t ( K 1 t + 1 ) E t ( K 1 t ) E t + 1 ( K 1 t + 1 ) E t + 1 ( K 1 t ) = O K 2 t + 1 / O K 1 t + 1 O K 2 t / O K 1 t O K 3 t + 1 / O K 1 t + 1 O K 3 t / O K 1 t
Geometric formulas can be converted into algebraic formulas, as seen below:
M ( x t + 1 , y t + 1 , x t , y t ) = E t ( x t + 1 , y t + 1 ) E t ( x t , y t ) E t + 1 ( x t + 1 , y t + 1 ) E t + 1 ( x t , y t )
In Malmquist’s formula, E t + 1 and E t are the technical efficiency values in two periods, respectively. Both values were also used as technological efficiency changes for two periods by Rolf Fare et al.
E f f c h = E t + 1 ( x t + 1 , y t + 1 ) E t ( x t , y t )
The forward movement of Frontier 2 compared to Frontier 1 can be described as
E t ( K 1 t ) E t + 1 ( K 1 t ) = E t ( x t , y t ) E t + 1 ( x t , y t ) , E t ( K 1 t + 1 ) E t + 1 ( K 1 t + 1 ) = E t ( x t + 1 , y t + 1 ) E t + 1 ( x t + 1 , y t + 1 )
If the ratio of the equation is greater than 1, then the frontier is moving forward, implying technological progress. If the balance of the formula is less than 1, however, the frontier is moving backward, suggesting a technical recession. Rolf Fare et al. used geometric averaging as a technological change, which was as follows:
T e c h = E t ( x t , y t ) E t + 1 ( x t , y t ) E t ( x t + 1 , y t + 1 ) E t + 1 ( x t + 1 , y t + 1 )
The relationship between the Malmquist index, technological efficiency change, and technology changes can thus be expressed as follows:
M = E t ( x t + 1 , y t + 1 ) E t ( x t , y t ) E t + 1 ( x t + 1 , y t + 1 ) E t + 1 ( x t , y t ) = E t + 1 ( x t + 1 , y t + 1 ) E t ( x t , y t ) E t ( x t , y t ) E t + 1 ( x t , y t ) E t ( x t + 1 , y t + 1 ) E t + 1 ( x t + 1 , y t + 1 )
M = E f f c h × T e c h = P e c h × S e c h × T e c h
The Malmquist index measures total factor productivity (TFP), which can be decomposed into efficiency change (Effch) and technological change (Tech). The Effch can be decomposed into pure technical efficiency change (Pech) and scale efficiency change (Sech) E f f c h = P e c h × S e c h .
Technical efficiency change (Effch) represents the relative efficiency change under the condition of constant return to scale (CRS) and free disposal of factors and measures the degree the production system catches up with the production boundary from a period of t to a period of t + 1 . If Effch > 1, the front surface is close to the front cover of the previous period. Meanwhile, if Effch < 1, the front surface is separated from the front surface of the last period, and technical efficiency decreases. Assuming variable returns to scale (VRS), Pech implies a contribution from technological advances in frontier surface changes. Scale efficiency change (Sech) indicates a contribution from scale change in frontier surface changes. When the Malmquist Index is less than 1, the productivity level decreases, and the productivity level improves when the Malmquist index exceeds 1 [51].

4. Results and Analysis

The fishing industry can be classified into five primary forms: Trawling, Seine net, Fixed net, Drift net, and Angling, each with differing carbon emissions requirements. Trawling, which uses fuel-burning vessels to drag nets across the sea floor, highly depends on hydrocarbons. This type of fishing does not discriminate against catch, resulting in significant ecological damage, especially when the nets are dragged along the seabed. Furthermore, Trawling operations can cause irreversible harm to the sea bed. Despite this, this approach’s practicality and easy operability make it a popular choice for fishermen. However, this type of fishing is not conducive to sustainable fisheries management.
The fishing methods used in the Seine net are purposeful and rely on the pre-detection of the location of the catch. This ensures a higher fishing efficiency, making it a preferred method. However, this method requires a specific scale and close cooperation among fishing vessels, often belonging to fleet fishing operations. Implementing this method is difficult for individual fishermen and relies on a voluntary or coordinated organization. The Fixed net and Drift net mainly involve setting the gear in the water so that the fish enter the Fixed net and Drift net, so it is a passive fishing method and not very profitable. As an environmentally friendly fishing method, Angling has the benefit of limiting large-scale fishing. Its strength lies in the accurate positioning of the fishing grounds. However, this method is generally only employed in specific types of fishing, such as squid fishing. Thus, this study examines the carbon emission efficiency of the five fishing methods and their unique characteristics.

4.1. Carbon Efficiency Analysis

Table 3 was calculated using Formula (4) to measure CO2 emission efficiency. Figure 3 presents the carbon efficiency of Table 3 utilizing a box plot, which effectively illustrates the relationship between the quartiles and the mean.
A multivariate analysis of variance is employed to examine the effects of multiple factors, and the results are shown in Table 4.
Based on the table, the following conclusions can be drawn: the independent variables of method, area, year, year: method, year: space, and method: area all have a significant effect on the dependent variable (with p values less than 0.1). Method: area has the most considerable impact among all the interaction effects, with an F value of 7.136 and a p value of 0.000. The year: method and year: area interaction effects also significantly impact the dependent variable (with p values of 0.070 and 0.036, respectively, less than 0.1). Through a multifactor analysis of variance, it can be seen that the carbon emission efficiency of the fishing industry varies across time, fishing methods, and regions. The following detailed analysis is focused on time, fishing methods, and areas. Figure 3 is a boxplot drawn from Table 3, which includes the maximum, minimum, and mean values.
Based on Figure 3 and Table 3, the results can be analyzed as follows:
The carbon efficiency distribution of the Trawler is relatively concentrated, and the efficiency level is between the low-efficiency level and the medium-efficiency level. The efficiency value of the Trawler shows an upward trend, indicating that carbon efficiency is improved. However, the dispersion value of the Trawler among regions shows an increasing trend, which means that the gap has widened between areas. This divides the development pattern of carbon efficiency into two types according to regional carbon emission efficiency: one is that the carbon efficiency of the Trawler shows a trend of rapid growth, which is seen in regions such as Tianjin, Jiangsu, and Hainan. CO2 efficiency is at the forefront of the country.
Another is the slow growth of CO2 efficiency seen in regions such as Hebei, Liaoning, Shanghai, Zhejiang, Fujian, Shandong, Guangdong, and Guangxi. The large scale in these areas makes promoting fishery technology and upgrading equipment difficult and slow. Meanwhile, as a significant and long-time fishery-producing area, fishery resources are exhausted, thus resulting in the slow improvement in the CO2 emission efficiency of the Trawler.
The dispersion degree of CO2 emission efficiency of Drift net is similar to that of the Trawler. The development trend of CO2 emission efficiency of Drift net also keeps the same level for a long time, between the low- and medium-efficiency levels. Drift net is a fishing method with low output efficiency. This also causes damage to the existing ecological environment, thus causing the death of animals such as dolphins and turtles. Hence, it was gradually replaced and discarded. The Shanghai region is suitable for Drift net operation. Thus the CO2 emission efficiency of Drift net is relatively high therein.
The CO2 emission efficiency of Seine net, Fixed net, and Angling has excellent dispersion. From 2016 to 2019, the CO2 emission efficiency of Fixed netting and Angling showed a significant upward trend. According to the efficiency of the Seine net, the CO2 emission efficiency of Hebei, Jiangsu, Hainan, and other places has been at a low-efficiency level for a long time. Shandong, Guangdong, and Guangxi are at a medium-efficiency level for carbon. Additionally, for the high-efficiency level, there are Tianjin, Liaoning, and Zhejiang. Fixed net CO2 efficiency shows that the CO2 emission efficiency of regions such as Hebei and Shandong is at a high-efficiency level. For example, the CO2 emission efficiency of Hebei province reached the perfect-efficiency level in the years 2012, 2013, 2017, and 2019.
Meanwhile, the value of Shandong Province is concentrated at a highly high-efficiency level for an extended period. The CO2 efficiency of Guangxi and Hainan has recently improved, showing an upward trend. Hainan’s efficiency value reached an extremely high-efficiency level in 2016, 2018, and 2019. The main operation area of fisheries in Guangxi and Hainan is in the South China Sea, but the fishery resources in Hainan are more abundant than those in Guangxi. Thus, fishery resources have a particular impact on CO2 emission efficiency.
The CO2 efficiency of Angling is at the medium-efficiency level, showing an upward trend from 2015 to 2019, mainly due to fishing technology’s promotion and equipment updates in recent years. The efficiency of Angling is the highest among all fishing methods, reaching 0.6142, which plays a significant role in CO2 emission reduction. In 2015, Hebei, Jiangsu, Shandong, Guangdong, and Guangxi significantly improved Angling’s CO2 efficiency. The value of Angling has since changed from medium- to high-efficiency levels in Jiangsu and Guangxi. For example, the CO2 emission efficiency of Angling in Jiangsu reached 1 in 2018–2019, which is the perfect-efficiency level.
In this article, the data from Table 3 are visualized in terms of correlation coefficients to generate the map in Figure 4, which illustrates the correlation between the efficiency of the five fishing methods. The analysis of Figure 4 is presented below:
From the correlation degree of Trawling efficiencies, regions such as Guangxi, Guangdong, and Fujian are both close in proximity and have vast degrees of correlation in Trawling efficiency, forming a consistent unity. The development of CO2 emission efficiency in south China is similar. The Seine net correlation analysis shows no significant correlation among regions. Only Fujian and Hainan have a positive correlation, while “Guangdong and Zhejiang”, and “Fujian and Liaoning”, have a negative correlation. The focus of Drift net correlation is mainly in Shandong and Hebei, and the correlation is scattered in southern China.
A comparative analysis of fishing distribution characteristics shows that fisheries’ efficiency is relatively scattered and that the fishing industry in Tianjin, Shandong, and Jiangsu has a strong correlation and concentration. China’s fishery CO2 emissions are concentrated in Trawl and Drift nets, with a high correlation between regions. This is related to scientific and technological progress and the scale of regional development. Therefore, the TFP model was adopted to decompose the scale effect and technological progress.
These reveal the ongoing efforts towards efficiency in capturing fisheries trends. However, it is necessary to study how the factors from the scale and technological progress influence efficiency change. The current study thus constructs total factor productivity (TFP) to measure low-carbon fishery development.

4.2. Further Discussion on the Effects of Technological Changes

This text uses formula 13 to calculate the total factor productivity (TFP) and analyzes the four main components that make up TFP: efficiency change (Effch), technological change (Tech), physical capital (Pech), and human capital (Sech). The calculation results are shown in Figure 4.

4.2.1. Trend Analysis

Trend Analysis of TFP

The trend analysis of the TFP shows that the low-carbon efficiency of the five fishing methods presents an upward trend. From 2010 to 2013, the low-carbon TFP of the five fishing methods was more significant than 1, indicating that the total factor productivity was improved. From 2012 to 2013, this period substantially increased the low-carbon TFP of the five fishing methods. However, the low-carbon TFP of the five fishing methods was less than 1 in the years 2014 to 2015, indicating a decrease in total factor productivity compared with the previous period. Some scholars posit that the fluctuation of international oil prices led to declining efficiency [34]. Additionally, reducing fossil energy costs leads to an increase in CO2 emissions, ultimately leading to the excess input of resources and the decline of low-carbon total factor productivity.
The efficiency of the Trawler and the Seine net showed a similar tendency, increasing from 1.043 and 1.044 to 1.092 and 1.080, respectively, between the years 2010 and 2019. Due to its small scale, Drift net does not have the advantage of scale. Therefore, during external shocks, the TFP efficiency value of the Drift net is more sensitive compared to the Trawler and Seine net, thus showing greater volatility. The TFP efficiency of Fixed netting and Angling also showed an increasing trend, with TFP of 1.072 and 1.074, respectively, from 2010 to 2011, ranking first and second in the operating methods. In 10 years, the TFP values have reached 1.144 and 1.110, respectively, indicating significant potential for low-carbon total factor productivity.

Effch and Tech Trend Analysis

After the TFP decomposition method, total factor productivity was decomposed into Effch and Tech for analysis. In 2010–2011, the Effch and Tech values of Trawler, Seine net, Fixed net, and Angling were more significant than 1, indicating that Effch and Tech had made progress. Effch values of Trawler, Seine net, and Angling were higher than the Tech values, which means that Effch contributes more to the growth of TFP than Tech. However, the Tech value of the Fixed net is more significant than the Effch value, which means the Tech of the Fixed net contributes more to the growth of TFP. Drift and Fixed net have been developed well, and Effch and Tech show a growing trend. However, the Effch values of Trawler, Seine net, and Angling decreased to below 1, while Tech remained above 1, indicating that Tech became the main reason for supporting the growth of TFP.

Pech and Sech Trend Analysis

The paragraph above thus posits that Effch provides a significant change, and the composition of Effch is Pech and Sech, thus representing the contribution degree of technology and scale in frontier changes. In 2010–2011, it was more important than 1 for the Pech values of all five fishing. Meanwhile, during 2010–2013, the Trawler, Seine net, Drift net, and Fixed net were improved by both the Pech and Sech. However, during 2014–2015, there was a significant decline, with the Pech and Sech of Trawler, Seine net, Drift net, and Angling all falling below 1. From 2016 to 2019, the pure technical efficiency (Pech) of Trawler continued to decline, while the Sech gradually recovered to 1.079. The Pech and Sech of Seine net, Drift net, and Angling have experienced fluctuations. Ultimately, Pech was situated below 1, although Sech increased to above 1. Therefore, Pech deteriorates while Sech improves. Hence, the decline of the Effch value is mainly due to Pech’s deterioration rather than Sech’s. This means that the growth of TFP is not dependent on Pech and is instead reliant on Sech. The scale expansion increases the utilization efficiency of carbon resources but ultimately leads to increased total CO2 emissions. Therefore, investment in low-carbon technologies should be gradually increased to promote the progress of low-carbon technologies.

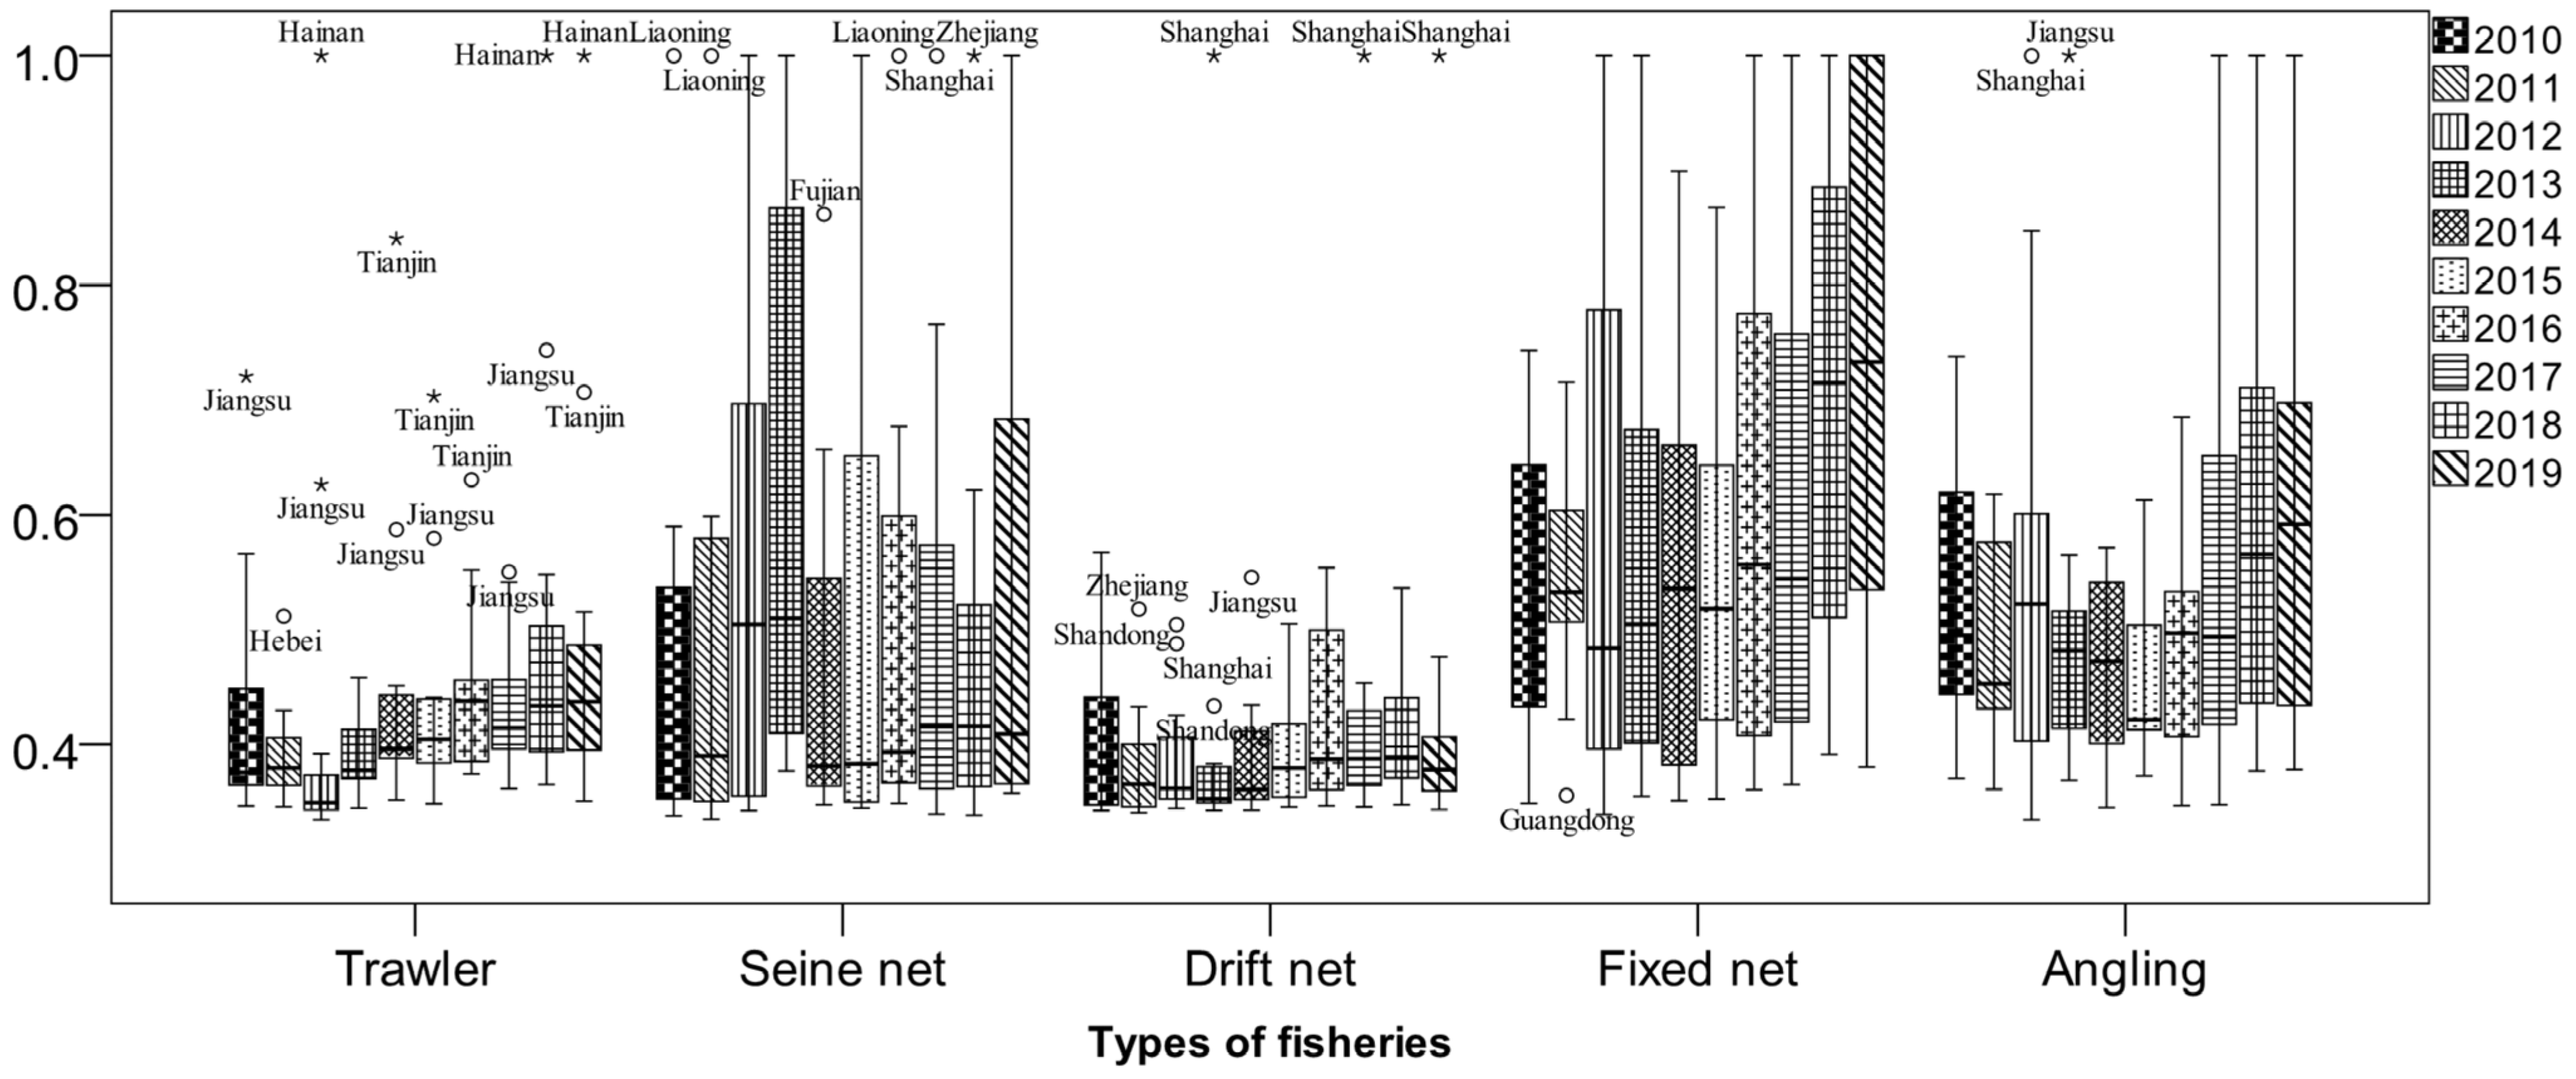
4.2.2. Spatial Analysis

A visualization of the average time of Table 5 was performed to obtain the bar graph Figure 5, revealing the differences in efficiency values in three dimensions: type of fishing, region, total factor production factors, and their components. The analysis of Figure 5 leads to the following results.

TFP Distribution Analysis

Among the five types of fishing methods, the TFP values of Tianjin, Shanghai, Jiangsu, Zhejiang, Guangxi, and Hainan are all above 1. The top four TFP cities are Shanghai, Hainan, Zhejiang, and Tianjin in Trawler, Seine net, and Drift net. Meanwhile, Hebei, Shanghai, Zhejiang, and Hainan are the top four in Fixed net. Anglings’ top four regions were Guangxi, Jiangsu, Tianjin, and Shanghai. The Trawler is an operation method widely used for long periods. The Trawler is relatively mature. Hence, the TFP is generally high. However, there is more potential in the sustainable development of the Fixed net and Angling compared to the Trawler.

Effch and Tech Distribution Analysis

The Tech of Trawler, Drift net, Fixed net, and Angling is generally better than Effch. The difference between the Tech and Effch of Trawler and Drift net is noticeable in Hebei, Liaoning, Shandong, Guangdong, and Guangxi. According to the spatial distribution of the Seine net, the Tech of Shanghai and Hainan is the highest, and the Effch of Jiangsu is the highest, meaning that the growth of low-carbon TFP of the Seine net in both regions depends on different main factors, respectively.

Pech and Sech Distribution Analysis

Pech was less than 1 in almost all provinces. In Shandong and Guangdong, the Pech values are the lowest in Trawler and Drift net, which means Pech is facing a significant decline. However, the Sech value of Trawler and Drift net is relatively high in Shandong and Guangdong, indicating that the proportion of resources invested can be reduced when the scale is expanded. Effch growth depends on Sech, although it faces the problem of overfishing, which depletes fishery resources. The Pech of Tianjin, Shanghai, Zhejiang, and Hainan is 1, which means that pure technological progress has maintained the original level.

5. Conclusions and Suggestions

5.1. Conclusions

Given the current state of global CO2 emission reduction, developing a low-carbon capture fishery is significant in various discussions on marine emissions. China’s emission reduction plan and Effch should be globally recognized as an important fishing and CO2 emitter country. This paper used SBM to measure the CO2 emission efficiency of five fishing methods and then used the Malmquist index to analyze the technology and scale that affect the low-carbon efficiency of fishing.
Through these methods, the characteristics of the CO2 emission efficiency of China’s capture fishery can be summarized into three conclusions. First, from the global mean values, the sequence with the highest to lowest efficiency values is Angling, Seine Net, Fixed yield, Drift net, and Trawler in that specific order. The CO2 emission efficiency of Angling and Seine net is, therefore, much higher than that of traditional Trawling. Second, the CO2 emission efficiency of Trawler and Drift net is concentrated at the lower-middle level. Although CO2 emission efficiency has an inevitable upward trend, it is nonetheless faced with significant growth constraints. Third, the CO2 emission efficiency of Fixed net and Angling is high and has dramatically increased in recent years. Hence, there exists much potential for CO2 emission reduction in methods such as Fixed net, Seine net, and Angling.
The impact of scale expansion and technological progress on low-carbon fisheries is divided into several main points. Previous studies analyzed the positive contribution of technological progress to the CO2 emission reduction effect in their studies [52,53,54,55]. However, these studies do not distinguish the relationship between technological progress and technical efficiency. This paper thus used the Malmquist index to analyze the role of technological progress and technical efficiency in CO2 emission reduction. First, TFP experienced a significant decline during 2014–2015, mainly due to the increase in CO2 emissions by the collapse of international oil prices. Fixed net and Angling have high total factor productivity. Although the regional distribution of their efficiency is not balanced, Fixed netting and Angling promote the development of low-carbon fisheries. Second, following the composition of the TFP, capture fisheries must also maintain their technical and technological progress.
However, Effch showed a declining trend, and the lack of Pech likewise caused the decline of Effch. Tech denotes technological progress, and Pech indicates technological efficiency. Results show that technology progresses, but technical efficiency decays, meaning that the growth of technology does not lead to an increase in efficiency. Shandong and Guangdong have the lowest Pech value, indicating that Pech significantly decreases. Still, the lack of Pech is covered by increased scale efficiency. The proportion of resources consumed can be reduced by the advantage of scale economy brought by the fishing industry’s increase in scale efficiency. This shows that emission reduction requires technology growth and must also consider the emission reduction efficiency of this technology.

5.2. Suggestions

In global emission reduction, capture fisheries account for a large share of the world’s CO2 emissions. The CO2 efficiency of fishing continues to increase, although this increase is mainly due to economies of scale rather than technological progress. The development of the Seine net, Fixed net, and Angling provide low CO2 emission, but the fishing boats used in these methods developed slowly due to low economic efficiency. Therefore, more subsidies can be given to such fishing boats to support their development. Given the difference in output efficiency, Angling and Trawling will unfairly distribute resources; thus, the government can set up particular fishing areas for Angling. On the one hand, this protects the sustainable development of fishery resources. On the other hand, it also promotes the progress of emission reduction technology in the fishing industry. This helps avoid the Tragedy of the Commons regarding high CO2 emissions.
Technological advances have not led to technological efficiency growth. Hence, the government increases investment to promote the efficiency of CO2 reduction technologies. This includes expanding subsidies for netting and fishing-related fishing techniques and encouraging technological innovation. Trawling is a mature technology with low-cost input worldwide. However, the increase in external costs brought by CO2 emissions is not considered. Therefore, increasing the corresponding emission tax or fee can encourage fisheries to use low-carbon technology and improve technological emission reduction. Total factor productivity has regional characteristics. Hence, local fishery characteristics have a particular impact on the low-carbon fishery, and fishery administration construction may even promote the development of low-carbon fishery.
Additionally, actively promoting energy-saving ship models, energy-saving technologies, and products for fishing boats and accelerating the application of solar energy and wind power in fishing boats may effectively reduce emissions. Promoting waste heat from fishing vessels and electric propulsion, diesel, and natural gas hybrid combustion devices to improve fishing vessels may also save energy and reduce emissions. The fishery sector must also promote restructuring fishing operations, reduce the Trawl mode of operation, and promote energy-saving fishing methods.
Firstly, incentive-based policies can be developed, such as offering tax breaks or subsidies to companies that incorporate energy efficiency and emission reduction measures. Secondly, technological innovation can improve efficiency, such as developing more efficient fishing gear and boats or adopting advanced aquaculture techniques. Finally, the government can strengthen the monitoring and management of marine fishing to ensure compliance with environmental regulations and prevent overfishing.
In summary, policymakers can balance stakeholders’ interests, prioritizing operability and technological innovation to improve China’s marine fishing industry’s CO2 emission efficiency and overall productivity. Achieving higher efficiency in marine fishing carbon resource utilization and overall factor productivity requires consideration of various factors, including technology, policy, and stakeholder interests.
Several suggestions include promoting efficient fishing gear and boats, optimizing fishing techniques and timing, implementing sustainable fishery policies, and establishing a scientific fishery management mechanism. Ultimately, improving marine fishing carbon resource efficiency and overall factor productivity requires collaboration among policymakers, scientists, industry practitioners, and the public to achieve sustainable development goals while considering technological, policy, and socio-economic factors.

Author Contributions

Conceptualization, G.L.; methodology, G.L.; software, G.L. and W.Z. (Weikun Zhang); validation, G.L. and W.Z. (Weikun Zhang); formal analysis, G.L., W.Z. (Weikun Zhang) and W.Z. (Wolin Zheng); investigation, C.T.; resources, C.T.; data curation, G.L.; writing—original draft preparation, G.L.; writing—review and editing, G.L. and W.Z. (Weikun Zhang); visualization, Y.L.; supervision, Y.L.; project administration, W.Z. (Weikun Zhang); funding acquisition, W.Z. (Weikun Zhang). All authors have read and agreed to the published version of the manuscript.

Funding

This research was funded by the Guangdong Philosophy and Social Sciences Planning Youth Project (Grant Number: GD22YGL19), the Guangdong Philosophy and Social Sciences Planning Youth Project (Grant Number: GD22YDXZGL01), and General programs of humanities and social sciences in Lingnan Normal University (Grant Number: WT2212).

Institutional Review Board Statement

Not applicable.

Informed Consent Statement

Not applicable.

Data Availability Statement

Not applicable.

Conflicts of Interest

The authors declare no conflict of interest.

References

  1. Shan, Y.; Guan, D.; Zheng, H.; Ou, J.; Li, Y.; Meng, J.; Mi, Z.; Liu, Z.; Zhang, Q. China CO2 emission accounts 1997–2015. Sci. Data 2018, 5, 170201. [Google Scholar] [CrossRef] [Green Version]
  2. Mi, Z.; Wei, Y.-M.; Wang, B.; Meng, J.; Liu, Z.; Shan, Y.; Liu, J.; Guan, D. Socioeconomic impact assessment of China’s CO2 emissions peak prior to 2030. J. Clean. Prod. 2017, 142, 2227–2236. [Google Scholar] [CrossRef] [Green Version]
  3. Huang, S.; He, Y. Management of China’s capture fisheries: Review and prospect. Aquacult. Fish. 2019, 4, 173–182. [Google Scholar] [CrossRef]
  4. Bianchi, M.C.G.; Chopin, F.; Farme, T.; Franz, N.; Fuentevilla, C.; Garibaldi, L.; Laurenti, A.L.G. FAO: The State of World Fisheries and Aquaculture; Food and Agriculture Organization of the United Nations: Rome, Italy, 2014; pp. 1–230. [Google Scholar]
  5. Hamdiyah, S.; Supriatna, J.; Prihanto, Y.; Adi, N.S.; Pranowo, W.S. Social and economic influences on CO2 emission from capture fisheries in West Java Province. Earth Environ. Sci. 2020, 530, 012026. [Google Scholar] [CrossRef]
  6. Zhang, F.; Chen, Y.; Chen, Q.; Feng, Y.; Shang, Y.; Yang, X.; Gao, H.; Tian, C.; Li, J.; Zhang, G.; et al. Real-World Emission Factors of Gaseous and Particulate Pollutants from Marine Fishing Boats and Their Total Emissions in China. Environ. Sci. Technol. 2018, 52, 4910–4919. [Google Scholar] [CrossRef] [PubMed]
  7. Hao, X. Report on fishery industry energy conservation and emissions reduction research in China. Fish. Modern. 2008, 35, 1–7. [Google Scholar]
  8. Li, C.; Feng, W.; Shao, G.L. Spatio-temporal difference of total carbon emission efficiency of fishery in China. Econ. Geogr. 2018, 38, 179–187. [Google Scholar]
  9. Buglioni, G.E.C.J.M.; Notti, E.; Sala, A. E-Audit: Energy Use in Italian Fishing Vessels; Sustainable Maritime Transportation and Exploitation of Sea Resources: Boca Raton, FL, USA, 2011; Volume 2, pp. 1043–1047. [Google Scholar]
  10. Demirci, A.; Karagüzel, M. The evaluation of fishing vessels fuel consumption and pollutions emissions in the İskenderun Bay. Fresen. Environ. Bull. 2018, 27, 508–514. [Google Scholar]
  11. Deb, S.; Mandal, B. Soils and sediments of coastal ecology: A global carbon sink. Ocean Coast. Manag. 2021, 214, 105937. [Google Scholar] [CrossRef]
  12. Maravelias, C.D.; Tsitsika, E.V. Economic efficiency analysis and fleet capacity assessment in Mediterranean fisheries. Fish. Res. 2008, 93, 85–91. [Google Scholar] [CrossRef]
  13. Boopendranath, M.R.; George, V.C.; Hameed, M.S. Fish production and energy requirement during demersal and aimed midwater trawling by intermediate range freezer trawler. Asian Fish. Sci. 2009, 22, 415–428. [Google Scholar] [CrossRef]
  14. Na, J.-H.; Choi, A.-Y.; Ji, J.; Zhang, D. Environmental efficiency analysis of Chinese container ports with CO2 emissions: An inseparable input-output SBM model. J. Transp. Geogr. 2017, 65, 13–24. [Google Scholar] [CrossRef]
  15. Li, H.; Shi, J.-F. Energy efficiency analysis on Chinese industrial sectors: An improved Super-SBM model with undesirable outputs. J. Clean. Prod. 2014, 65, 97–107. [Google Scholar] [CrossRef]
  16. Zhang, N.; Choi, Y. Environmental energy efficiency of China’s regional economies: A non-oriented slacks-based measure analysis. Soc. Sci. J. 2013, 50, 225–234. [Google Scholar] [CrossRef]
  17. Du, Y.-W.; Jiang, J.; Li, C.-H. Ecological efficiency evaluation of marine ranching based on the Super-SBM model: A case study of Shandong. Ecol. Indic. 2021, 131, 108174. [Google Scholar] [CrossRef]
  18. Zhou, Y.; Xing, X.; Fang, K.; Liang, D.; Xu, C. Environmental efficiency analysis of power industry in China based on an entropy SBM model. Energy Policy 2013, 57, 68–75. [Google Scholar] [CrossRef]
  19. Chang, Y.-T.; Park, H.-S.; Jeong, J.-B.; Lee, J.-W. Evaluating economic and environmental efficiency of global airlines: A SBM-DEA approach. Transp. Res. Part D Transp. Environ. 2014, 27, 46–50. [Google Scholar] [CrossRef]
  20. Iyer, G.; Hultman, N.; Eom, J.; McJeon, H.; Patel, P.; Clarke, L. Diffusion of low-carbon technologies and the feasibility of long-term climate targets. Technol. Forecast. Soc. Chang. 2015, 90, 103–118. [Google Scholar] [CrossRef]
  21. Bai, Y.; Deng, X.; Jiang, S.; Zhang, Q.; Wang, Z. Exploring the relationship between urbanization and urban eco-efficiency: Evidence from prefecture-level cities in China. J. Clean. Prod. 2017, 195, 1487–1496. [Google Scholar] [CrossRef]
  22. Dubey, R.; Gunasekaran, A.; Childe, S.J.; Papadopoulos, T.; Luo, Z.; Wamba, S.F.; Roubaud, D. Can big data and predictive analytics improve social and environmental sustainability? Technol. Forecast. Soc. Chang. 2019, 144, 534–545. [Google Scholar] [CrossRef]
  23. Zhang, X.; Han, J.; Zhao, H.; Deng, S.; Xiao, H.; Peng, H.; Li, Y.; Yang, G.; Shen, F.; Zhang, Y. Evaluating the interplays among economic growth and energy consumption and CO2 emission of China during 1990–2007. Renew. Sustain. Energy Rev. 2012, 16, 65–72. [Google Scholar] [CrossRef]
  24. Gerlagh, R.; van der Zwaan, B. A Sensitivity Analysis of Timing and Costs of Greenhouse Gas Emission Reductions. Clim. Chang. 2004, 65, 39–71. [Google Scholar] [CrossRef] [Green Version]
  25. Dong, F.; Zhu, J.; Li, Y.; Chen, Y.; Gao, Y.; Hu, M.; Qin, C.; Sun, J. How green technology innovation affects carbon emission efficiency: Evidence from developed countries proposing carbon neutrality targets. Environ. Sci. Pollut. Res. 2022, 29, 35780–35799. [Google Scholar] [CrossRef] [PubMed]
  26. Munir, K.; Ameer, A. Assessing nonlinear impact of urbanization, economic growth, technology, and trade on environment: Evidence from African and Asian emerging economies. GeoJournal 2021, 87, 2195–2208. [Google Scholar] [CrossRef]
  27. Chen, J.; Gao, M.; Mangla, S.K.; Song, M.; Wen, J. Effects of technological changes on China’s carbon emissions. Technol. Forecast. Soc. Chang. 2020, 153, 119938. [Google Scholar] [CrossRef]
  28. Yang, X.; Jia, Z.; Yang, Z.; Yuan, X. The effects of technological factors on carbon emissions from various sectors in China—A spatial perspective. J. Clean. Prod. 2021, 301, 126949. [Google Scholar] [CrossRef]
  29. Alvarez-Herranz, A.; Balsalobre-Lorente, D. Energy Regulation in the EKC Model with a Dampening Effect. J. Environ. Anal. Chem. 2015, 2, 1000137. [Google Scholar] [CrossRef]
  30. Zhang, Y.-J.; Sun, Y.-F.; Huang, J. Energy efficiency, carbon emission performance, and technology gaps: Evidence from CDM project investment. Energy Policy 2018, 115, 119–130. [Google Scholar] [CrossRef]
  31. Guttormsdóttir, A.B. Life Cycle Assessment on Icelandic Cod Product Based on Two Different Fishing Methods; University of Iceland: Reykjavik, Iceland, 2009. [Google Scholar]
  32. Vázquez-Rowe, I.; Moreira, M.T.; Feijoo, G. Life cycle assessment of horse mackerel fisheries in Galicia (NW Spain): Com-parative analysis of two major fishing methods. Fish. Res. 2010, 106, 517–527. [Google Scholar] [CrossRef]
  33. Madin, E.M.; Macreadie, P.I. Incorporating carbon footprints into seafood sustainability certification and eco-labels. Mar. Policy 2015, 57, 178–181. [Google Scholar] [CrossRef]
  34. Cheilari, A.; Guillen, J.; Damalas, D.; Barbas, T. Effects of the fuel price crisis on the energy efficiency and the economic performance of the European Union fishing fleets. Mar. Policy 2013, 40, 18–24. [Google Scholar] [CrossRef]
  35. Tao, W.; Guang-Shun, H.; Jing, G.; Yue, Y.; Lin-Lin, L. Energy consumption and economic growth in China’s marine economic zones-an estimation based on partial linear model. Energy 2020, 205, 118028. [Google Scholar] [CrossRef]
  36. I Santosa, P.; Pranatal, E. Study of emission quantification in catamaran fishing vessels based on fossil energy. J. Phys. Conf. Ser. 2021, 1833, 012042. [Google Scholar] [CrossRef]
  37. Prussi, M.; Scarlat, N.; Acciaro, M.; Kosmas, V. Potential and limiting factors in the use of alternative fuels in the European maritime sector. J. Clean. Prod. 2021, 291, 125849. [Google Scholar] [CrossRef]
  38. Chen, Y.; Miao, J.; Zhu, Z. Measuring green total factor productivity of China’s agricultural sector: A three-stage SBM-DEA model with non-point source pollution and CO2 emissions. J. Clean. Prod. 2021, 318, 128543. [Google Scholar] [CrossRef]
  39. Zhang, C.; Chen, P. Applying the three-stage SBM-DEA model to evaluate energy efficiency and impact factors in RCEP countries. Energy 2022, 241, 122917. [Google Scholar] [CrossRef]
  40. Driscoll, J.; Tyedmers, P. Fuel use and greenhouse gas emission implications of fisheries management: The case of the new england atlantic herring fishery. Mar. Policy 2010, 34, 353–359. [Google Scholar] [CrossRef]
  41. Ziegler, F.; Valentinsson, D. Environmental life cycle assessment of Norway lobster (Nephrops norvegicus) caught along the Swedish west coast by creels and conventional trawls—LCA methodology with case study. Int. J. Life Cycle Assess. 2008, 13, 487–497. [Google Scholar] [CrossRef]
  42. Devi, M.S.; Xavier, K.M.; Singh, A.S.; Edwin, L.; Singh, V.V.; Shenoy, L. Environmental pressure of active fishing method: A study on carbon emission by trawlers from north-west Indian coast. Mar. Policy 2021, 127, 104453. [Google Scholar] [CrossRef]
  43. Parente, J.; Fonseca, P.; Henriques, V.; Campos, A. Strategies for improving fuel efficiency in the Portuguese trawl fishery. Fish. Res. 2008, 93, 117–124. [Google Scholar] [CrossRef]
  44. Parker, R.W.; Hartmann, K.; Green, B.S.; Gardner, C.; Watson, R.A. Environmental and economic dimensions of fuel use in Australian fisheries. J. Clean. Prod. 2015, 87, 78–86. [Google Scholar] [CrossRef]
  45. Wang, Q.; Wang, S. Carbon emission and economic output of China’s marine fishery—A decoupling efforts analysis. Mar. Policy 2022, 135, 104831. [Google Scholar] [CrossRef]
  46. Tone, K. A slacks-based measure of efficiency in data envelopment analysis. Eur. J. Oper. Res. 2001, 130, 498–509. [Google Scholar] [CrossRef] [Green Version]
  47. Tone, K.; Sahoo, B.K. Scale, indivisibilities and production function in data envelopment analysis. Int. J. Prod. Econ. 2003, 84, 165–192. [Google Scholar] [CrossRef] [Green Version]
  48. Johnes, J. EFFICIENCY AND PRODUCTIVITY CHANGE IN THE ENGLISH HIGHER EDUCATION SECTOR FROM 1996/97 TO 2004/5*. Manch. Sch. 2008, 76, 653–674. [Google Scholar] [CrossRef] [Green Version]
  49. Pastor, J.T.; Lovell, C.A.K. A global Malmquist productivity index. Econ. Lett. 2005, 88, 266–271. [Google Scholar] [CrossRef]
  50. Tone, K. Malmquist Productivity Index. In Handbook on Data Envelopment Analysis; International Series in Operations Research & Management Science; Springer: Boston, MA, USA, 2004; Volume 71. [Google Scholar] [CrossRef]
  51. Abdulwakil, M.M.; Abdul-Rahim, A.S.; Alsaleh, M. Bioenergy efficiency change and its determinants in EU-28 region: Evidence using Least Square Dummy Variable corrected estimation. Biomass Bioenergy 2020, 137, 105569. [Google Scholar] [CrossRef]
  52. Kang, Z.-Y.; Li, K.; Qu, J. The path of technological progress for China’s low-carbon development: Evidence from three urban agglomerations. J. Clean. Prod. 2018, 178, 644–654. [Google Scholar] [CrossRef]
  53. Liu, W.; Du, M. Is Technological Progress Selective for Multiple Pollutant Emissions? Int. J. Environ. Res. Public Health 2021, 18, 9286. [Google Scholar] [CrossRef]
  54. Huang, J.; Chen, X.; Yu, K.; Cai, X. Effect of technological progress on carbon emissions: New evidence from a decomposition and spatiotemporal perspective in China. J. Environ. Manag. 2020, 274, 110953. [Google Scholar] [CrossRef]
  55. Liu, Y.; Chen, L.; Huang, C. Study on the Carbon Emission Spillover Effects of Transportation under Technological Advancements. Sustainability 2022, 14, 10608. [Google Scholar] [CrossRef]
Figure 1. The method is calculated based on the slack variable. Q is the envelope curve, P is the production point, C is carbon emissions, k is the input of factors of production.
Sustainability 15 06331 g001
Figure 2. Malmquist method.
Sustainability 15 06331 g002
Figure 3. Carbon efficiency distribution. The ○ and * both represent outliers.
Sustainability 15 06331 g003
Figure 4. Regional analysis of correlation degree.
Sustainability 15 06331 g004
Figure 5. Spatial distribution.
Sustainability 15 06331 g005
Table 1. Description of data.
VariablesMeanStdMaxMin
Vessel3085.044837.7430,601.001.00
Worker646,706.60472,044.41,489,2755004.00
Technology promotion agency531.50400.76123613.00
Technology promotion fund (millions)91.9082.36364.221.44
GDP of fishing (millions)15,664.2912,842.6158,216.05639.05
Carbon emissions61,987.2899,867.57629,746.940.97
Table 2. The efficiency level is classified as follows.
LevelInefficiency LevelLow-Efficiency LevelMedium-Efficiency LevelHigh-Efficiency LevelExtreme High-Efficiency LevelPerfect-Efficiency Level
Value0–0.20.2–0.40.4–0.60.6–0.80.8–11
Table 3. Carbon efficiency value.
MethodYearMeanTianjinHebeiLiaoningShanghaiJiangsuZhejiangFujianShandongGuangdongGuangxiHainan
Trawler2010–20110.3870.4270.5390.3460.3770.5430.3660.4390.3770.3810.3750.358
Trawler2012–20130.3830.350.3970.350.3680.5020.3640.3950.3940.3580.3680.687
Trawler2014–20150.4210.7720.4460.350.3850.5830.3890.4370.4330.3840.4000.386
Trawler2016–20170.4260.5860.4610.4230.3890.5510.3890.4520.4260.3840.4180.371
Trawler2018–20190.4440.6270.4550.390.3580.6290.4340.4570.4290.3900.3981.000
Seine net2010–20110.3780.5870.3441.000.3360.3460.5640.4030.3570.5590.4850.359
Seine net2012–20130.5160.6710.3720.7520.6760.3700.8680.6290.7150.5490.5640.381
Seine net2014–20150.5170.6910.3520.3810.3540.3690.6880.7740.3460.5880.5280.382
Seine net2016–20170.5970.3440.3560.6810.6970.3670.6640.6540.3920.5540.5090.370
Seine net2018–20190.6140.8110.3650.5780.3530.3741.0000.5740.4150.4510.3870.368
Drift net2010–20110.3570.4470.3410.3470.3640.4540.5430.3690.4000.3440.3960.346
Drift net2012–20130.3580.350.3430.3520.7440.3570.3740.3800.4690.3440.4040.355
Drift net2014–20150.5050.3560.3610.3540.4220.5250.3610.3800.4310.3450.4080.350
Drift net2016–20170.5040.4870.3990.3510.7770.4650.4410.3870.3730.3770.3700.349
Drift net2018–20190.5290.4110.3960.3480.7540.5060.3670.3890.3700.4150.3770.347
Fixed net2010–20110.390.5170.5740.6320.4730.6280.4410.4270.7000.3520.5400.616
Fixed net2012–20130.4260.3781.000.6980.5970.4020.3830.4540.6580.3550.6750.784
Fixed net2014–20150.4430.4330.7790.5270.5300.3960.3750.4350.8250.3520.7200.618
Fixed net2016–20170.7300.3640.8910.4620.5500.6930.3790.4620.9410.3760.7930.805
Fixed net2018–20190.5031.000.8740.6870.6720.7250.5180.5230.9300.3860.7241.000
Angling2010–20110.4100.4450.3660.4880.5790.6700.6360.4960.4700.5360.5330.427
Angling2012–20130.6490.3770.3680.5370.7040.8050.6900.5520.3980.4060.4700.511
Angling2014–20150.4140.3750.3710.4540.4320.4910.5920.5620.4170.3860.4740.525
Angling2016–20170.8400.3470.3810.4170.6360.6020.5290.5180.5620.5380.7620.474
Angling2018–20190.7580.6370.3770.4020.4151.000.6000.5260.7710.5530.8610.486
Table 4. The results of multivariate analysis of variance.
DfSum_sqMean_sqFPR (>F)
Year40.2840.0716.9260.000
Method41.2270.30729.9280.000
Area100.2250.0222.1940.020
Method: area402.9250.0737.1360.000
Year: method160.2650.0171.6160.070
Year: area400.6250.0161.5240.036
Residual1601.6400.010
Table 5. The Malmquist index results.
YearFishing MethodEffchTechPechSechTfpch
2010–2011Trawler1.0331.0141.0361.0131.043
2012–2013Trawler1.1251.5681.1191.0561.636
2014–2015Trawler0.8940.9210.9310.9700.834
2016–2017Trawler0.9691.1110.9841.0041.058
2018–2019Trawler0.9841.1130.9181.0801.092
2010–2011Seine net1.0291.0271.0191.0131.045
2012–2013Seine net1.1051.5011.0801.0231.541
2014–2015Seine net0.9730.8970.9780.9920.875
2016–2017Seine net1.0041.0311.0330.9861.007
2018–2019Seine net0.9711.1160.9481.0231.081
2010–2011Drift net0.9941.0361.0390.9831.029
2012–2013Drift net1.2231.5971.1891.1081.860
2014–2015Drift net0.8690.9110.9110.9690.806
2016–2017Drift net0.9461.1200.9670.9991.057
2018–2019Drift net1.0251.0630.9471.0981.092
2010–2011Fixed net1.0211.0641.0121.0101.072
2012–2013Fixed net1.1051.5561.1011.0341.638
2014–2015Fixed net0.9920.8770.9971.0040.868
2016–2017Fixed net0.9861.0851.0220.9691.028
2018–2019Fixed net1.0371.0991.0141.0311.144
2010–2011Angling1.0641.0101.0451.0171.074
2012–2013Angling1.0701.6141.0091.0481.541
2014–2015Angling0.9840.9060.9860.9980.889
2016–2017Angling1.0191.2081.0260.9901.330
2018–2019Angling0.9891.1270.9481.0401.110
Disclaimer/Publisher’s Note: The statements, opinions and data contained in all publications are solely those of the individual author(s) and contributor(s) and not of MDPI and/or the editor(s). MDPI and/or the editor(s) disclaim responsibility for any injury to people or property resulting from any ideas, methods, instructions or products referred to in the content.

