Abstract
In order to explore the potential influence of new mobile payment services on the Ephesus model developed by Kao and Hwang (2008), we investigated the relative performance of 19 Taiwanese banks from 2018 to 2021. The network efficiency was divided into two parts: management efficiency and profitability efficiency. Only one bank achieved total efficiency from 2019 to 2021. The stage efficiencies showed increments during the first three years (2018–2020), but they declined in 2021. Most banks had low efficiency in the management stage and high efficiency in the profitability stage, suggesting that there are weaknesses in the management of physical resources but high awareness that mobile payment services can be exploited to achieve high profitability. Our results prove that mobile payment is a potential and profitable new service that Taiwanese banks should take advantage of. Comparing the results between the CCR model and the NDEA model, we observed that the NDEA model has more explanatory power, as it provides insight into the internal structure of the working process of Taiwanese banks.
1. Introduction
Technology is a driving force for development in many industries. Innovations in technology can lead to both social and economic growth. In 1912, Schumpeter first developed a theory of innovation based on technology and economics. Later, economists continued to expand this theory to explain the relation between technological evolution and economic development. In recent decades, the world has witnessed the rapid advancement of information technologies. The use of the internet and mobile phones has become a norm in both daily and business activities. E-commerce provides various advantages, including a large range of goods and services, accessibility, and an international reach [1]. This has led to new anxieties for both buyers and sellers. One party is anxious about the quality of goods and services, while the other worries about receiving their payments. Credit risks, identity theft, internet fraud, and fraudulent card use are problems that need to be addressed.
Mobile payment started as early as 1997, when Coca Cola first experimented with vending machines that accepted SMS payments [2]. Since then, alongside the development of e-commerce, mobile payment has been widely investigated. However, most research concentrated on how the technology has been applied and how consumers have adopted the new payment method [3,4,5]. There are other aspects of mobile payment that can be explored. One possible approach is to observe its impact on commercial banks, as mobile payments are both a complement and a substitute for banking services. Previous studies on this topic are very few and have usually focused on internet banking [6].
With the utilization of new technologies on mobile devices, mobile banking has become a popular banking channel offered by banks. It is now a worldwide phenomenon [7,8,9], with benefits for both customers and banks. Mobile banking services facilitate online money transfers, automatic check payments, bill payments, savings plans, etc. The growth of this channel has helped extend the adoption of banking services to rural areas in both developed and emerging countries, which in turn has encouraged banks to adopt more services based on mobile technologies. Mobile payment services represent an aspect of this growing trend [10].
Moreover, new opportunities have been created through the fast evolution of e-pay technology. Instead of letting non-bank competitors take away potential customers, taking advantage of the new technology and providing mobile payment services not only generates more profit but also reduces costs for banks [11]. Along with mobile banking, various banks now allow their customers to pay utility fees using their banking app or offer point-of-sale services for cashless payment. One such service in Taiwan is Taiwan Pay, a mobile paying network that has the cooperation of 16 financial institutions. Even so, in addition to the benefits of mobile payment, banks have also had to face new obstacles. Different types of costs and risks are associated with developing and sustaining new services. As a result, it would be beneficial for banks to gain insights into whether adopting mobile payment would actually increase their profitability.
The purpose of this paper is to examine how mobile payment services affect the efficiency of Taiwanese banks using the shared-input network data envelopment analysis (NDEA) model. Data envelopment analysis (DEA) is a non-parametric mathematical programming technique that can be used to estimate the efficiency of a process in accordance with its inputs and outputs. The traditional DEA, or black-box DEA, first proposed by Charnes et al. (1978) [12], has been applied to a wide variety of research in the banking sector. However, as its name suggests, traditional DEA bypasses the finer details of a production process; the whole process is considered to be a black box, and it only focuses on how inputs create final outputs. Consequently, with this technique, when there is more than one stage, we are unable to observe what happens in the actual process. To compensate for this, NDEA, developed by Färe and Grosskopf (1996) [13], opens “the box” and lets us examine the internal structure of these frameworks.
Not many studies have used NDEA to examine the performance of the financial industry. Seiford and Zhu (1999) [14] were the pioneers in this field, who employed a two-stage NDEA to examine the profitability and the marketability of US banks. Kao and Hwang (2008) [15] proposed a method to calculate the efficiency of a two-stage NDEA using data from Taiwanese non-life insurance companies. Galagedera et al. (2017) [16] introduced a three-stage NDEA model to appraise the efficiency of US mutual funds. Zhou et al. (2019) [17] explored a bank’s internal structure with three sub-stages: capital organization, capital allocation, and profitability.
The banking sector is one of the most important industries, and it is one of the main contributors to a country’s wealth [18]. Wang et al. (2014) [19] indicated that the banking sector plays an increasingly critical role in the development of the financial system. With the development of mobile payment, it is important to explore its impact on the efficiency of banks. Berger, Hunter, and Timme (1993) [20] stated that for banks, efficiency represents profitability, capital inflows, consumer prices, improved service quality, and the security to increase capital buffers and absorb risk. Therefore, we referenced the works of Seiford and Zhu (1999) [14] and Kao and Hwang (2008) [15] and employed a two-stage NDEA model to examine the effects of mobile payment services on Taiwanese banks’ efficiency in this paper. The model also exhibits shared resources, which are fixed assets and employees, since these inputs are needed in both stages to generate their respective outputs [17,21]. Using empirical research, we attempted to observe evidence of changes and investigate whether adopting e-payment services is a profitable decision for traditional banks.
Investigating the effects of mobile payments on efficiency has some significant benefits. Firstly, by understanding internal efficiency, banks would be able to evaluate the value of mobile payment services and utilize them to their full potential. Secondly, this research provides warnings about operational inefficiencies, allowing managers to reconstruct future strategies and reduce operating costs. Finally, this research can help the government understand the situation and provide suitable regulations to encourage the further development of mobile payments. Moreover, there have been few applications of NDEA in research into mobile payments. Our paper contributes to bridging this gap in the literature.
In summary, our main research questions are as follows: Q1: Does mobile payment impact the performance of Taiwanese banks? Q2: Does NDEA have a stronger discriminating power in analyzing efficiency than traditional DEA methods in mobile payment cases? Q3: Does mobile payment influence management efficiency as well as profitability efficiency? Q4: How do inefficient DMUs improve their sub-branch efficiencies as well as their overall efficiency?
The structure of this paper is organized as follows: In the next section, we introduce mobile payment and the current situation in Taiwan. In Section 3, we summarize some of the literature regarding the NDEA model. In Section 4, we present our model and data. In Section 5, we analyze and discuss the results. The final section presents the conclusion.
2. Mobile Payment and Literature Review
2.1. Mobile Payment
Electronic payment in general consists of an automatic teller machine (ATM), point of sale (POS), mobile money transfer (MMT), and online money payment (WEB). Among these, the use of ATMs began as early as 1967. Most platforms providing payment services were created by non-financial institutions. These services are referred to as internet third party payment (TPP) services, which connect to bank payments and settlement systems of e-commerce companies and commercial banks [22]. TPP is a method used to resolve obstacles related to trust and security between suppliers and consumers [23]. PayPal was a pioneer of this branch of service, having been offered in the US market since 1998. TPP has utilized the innovative payment technology offered by the internet to provide a safe and convenient environment for e-commerce practice [24].
The COVID-19 pandemic has had a heavy negative impact on household consumption, especially in urban areas. Most offline shopping has shifted to online shopping. Liu et al. (2020) [25] found that “mobile payment can improve transaction efficiency and facilitate consumption while overcoming the traditional space-time limitations. Thus, mobile payment can induce the transition from offline to online consumption.” Furthermore, according to the State of the Union: Global Digital Payments and Fintech Ecosystem Report (2021) [26], digital wallets now account for a large proportion of global consumer spending. “In 2020, wallets represented 27% of in-store spending, 41% of e-commerce spending and 46% of m-commerce spending. By 2025, they will account for more than $10 trillion in global transaction volume between in-store and e-commerce.” The pandemic created an environment for a larger and faster surge of mobile payments compared to the pre-pandemic period.
There are many studies regarding mobile payments and electronic payments. According to Dahlberg et al. (2015) [2], most studies focused on technological aspects or customer intentions. Oliveira et al. (2016) [27], for instance, used survey research and the SEM model to try to determine the key factors influencing the uptake of mobile payments and the likelihood that users would suggest this technology to others. Regression analysis was used by Humbani and Wiese (2018) [28] to examine customer preparedness to embrace mobile payment services and the moderating role of gender. Little research has paid attention to how companies, especially financial institutions, have adjusted to these accelerated changes and developments in technology. Therefore, this is a gap in the literature that can possibly be exploited.
According to the Financial Supervisory Commission’s (FSC) data, there are 29 TPP institutions in Taiwan, including Jkopay Co., Ltd., O’Pay Electronic Payment Co., Gama Pay Co., Ltd., etc. The real e-payment transactions in July of 2020 amounted to 5.27 billion TWD (175.67 million USD). The government has also enacted various laws and acts to regulate electronic payment services and institutions. In 2019, the Financial Supervisory Commission asked the Financial Information Service Co. to set up a platform that merged all services from all 29 electronic payment companies.
In addition to the international services offered by famous TPPs, such as Google Pay, Line Pay, Apple Pay, etc., Taiwanese banks started to introduce their own applications. Along with their own mobile banking apps, 16 Taiwanese banks cooperated to create a mobile payment platform called Taiwan Pay. This tool not only allows users to make payments directly by scanning QR codes, but also includes a function for users to pay utility bills and taxes. Due to the cooperation of the banks, users can use Taiwan Pay or any banking application belonging to the 16 banks to pay using their phones.
After the pandemic started in 2019, there were changes in the attitudes toward adopting mobile payment in Taiwan. According to a Mastercard survey, more than 75% of consumers in Taiwan increased their use of mobile payments due to the social distancing policy. The older generation became more reliant on mobile payments, as 30% of respondents aged 60 or older confirmed the use of contactless payments on a daily basis [29]. The technical requirements for extending the use of mobile payments have already been satisfied in Taiwan. The new environment caused by the pandemic might allow Taiwan’s immersion in this cashless payment method to be accelerated.
2.2. Literature Review
The data envelopment analysis (DEA) model is a mathematical programming approach that evaluates the relative efficiency of peer decision-making units (DMUs) with respect to multiple inputs and outputs [30]. It was first mentioned by Charnes et al. (1978) [12]. They proposed the constant return to scale (CCR) model, which suggests that any change in inputs should produce a proportional change in outputs. Later, in 1984, Banker et al. [31] developed the BCC model, which assumed a variable return to scale and did not require efficient DMUs to have the same outputs over inputs ratio as the most productive DMU. This type of simple DEA model is called the black-box model because it considers the production system as a single process and neglects possible divisions existing in the internal workings of a firm.
To examine how external factors or qualitative indicators affect the performance of firms, an external two-stage DEA model is used by many economists [32,33]. This type of model consists of calculating the efficiency indices at the first stage and using these indices to power other techniques which can be some type of regression, such as an analytical hierarchy process (AHP) or an artificial neural network (ANN), at the second stage [34]. In terms of evaluating efficiency scores, this model uses the traditional DEA, so it has all the weaknesses of the black-box model. However, the extra stage provides a means to determine the impact of exogenous elements on firm performance.
To obtain more reliable and detailed information, DMUs can be viewed in a network structure. Instead of just considering a whole manufacturing process a black-box system, the entire production can be divided into various sub-processes or sub-stages. The network DEA model (NDEA) was developed to provide both overall and divisional efficiency. It was first introduced by Färe and Grosskopf (2000) [35] and extended by other authors, such as Kao and Hwang (2008) [15], Chen et al. (2009) [30], and Tone and Tsutsui (2010) [36]. From explaining the relational relationship between divisions to presenting methods for calculating each stage’s weight, research has gradually polished the NDEA model.
The DEA model has been applied to explore the efficiency of financial institutions in many studies. Kao and Hwang (2008) [15] and Yakob et al. (2014) [37] used a two-stage DEA model to investigate the performance of insurance companies. Banks play a big role in the financial industry; therefore, studies to gain an understanding of their efficiency and productivity are essential. Numerous analyses have been conducted by scientists. Wanke and Barros (2014) [38] stimulated the network DEA model to observe the efficiency drivers in Brazilian banks. Yang and Liu (2012) [39] observed the management efficiency of branches in the Taiwanese banking system and evaluated the results between state-owned and mixed-ownership banks. Henriques et al. (2020) [34] reviewed more than 50 articles using two-stage DEA to evaluate the performance of the banking sector.
Different types of DEA models are used to estimate banks’ activities. A two-stage DEA with double bootstrapped truncated regression has been applied to examine if changes in financial conditions would affect banks’ performances [40]. NDEA, consisting of more than two stages, is often implemented to evaluate the level of efficiency of the banking sector [17,41]. The dynamic NDEA and the slack base NDEA models are also used [42,43,44]. Researchers have explored a wide range of topics, but there are rarely any studies about the effect of fintech and other high-tech services on the operation of the banking industry. One of the few papers that addressed this issue is by Yang et al. (2017) [45], who used the cost Malmquist productivity index to estimate the effect of fintech on the banking sector.
The Malmquist index measures the change in productivity between two periods by dividing it into several components, including technical efficiency change and technological change. This method has been applied in various disciplines. Andrejić et al. (2021) [46] developed a DEA model to evaluate the change in efficiency over time, using logistic companies as their sample. Coelli et al. (2005) [47] used the Malmquist index to evaluate the efficiency of Australian banks over the period of 1998–2002 and found the increasing productivity of the banking sector during this period was driven mainly by technological change.
Seiford and Zhu (1999) [14] applied a two-stage NDEA model to examine 55 US banks. They found that bank size might have a negative impact on marketability. In addition, by being aware of inefficient processes, banks could devise strategies to improve their performance. Wanke and Barros (2014) [38] showed that most Brazilian banks were more efficient at converting their expenses into assets and equity than managing their physical resources.
Most previous studies on mobile payment have focused on examining human behavior and individuals’ reactions to mobile payment adoption using the structural equation modeling (SEM) model or qualitative analysis [27,28]. These studies have helped in understanding people’s attitudes towards mobile payment. Although regression analysis could provide an understanding of how certain factors affect productivity as a whole, it is challenging to observe the effect on the internal operations of firms. They also have not provided useful insights into how mobile payments impact DMUs overall performance or how to influence the operational processes of financial intermediaries.
Traditional DEA models are based on the assumption of the “black-box” production process. Since we have no sense of what happens within the production process at large, such models are not only limited to identifying inefficient factors but, more seriously, often lead to misleading assessments of decision-making units (DMUs) [17,48]. In particular, since banks are considered financial intermediaries, neglecting their transitional activities could distort scientific results. To correct this weakness, several papers have tried to construct banking production under a network framework. Seiford and Zhu (1999) [14] and Luo (2003) [49] split the banking production into two stages, profitability and marketability. Similarly, some studies split banks’ operational processes into productivity and profitability [50,51].
In this paper, we propose a two-stage network structure to explore the impact of banking businesses using innovative mobile payments. The NDEA model enables us to investigate the influence of mobile payment on both the overall and sub-process efficiencies, providing a more comprehensive and useful view for managers. Therefore, we focused on how mobile payments, as a part of the internal working structure of a bank, affect a variety of efficiencies of sub-branches.
3. Methodology and Data
3.1. DEA–CCR Model
The black-box DEA model introduced by Charnes et al. (1978) [12] is a simple non-parametric model in which the ratio between outputs and inputs is used as a proxy to gauge the performance of companies. We assume that there is a set of n DMUs denoted by DMUj (j = 1,…, n) and that each DMUj has m inputs denoted by xij (i = 1,…, m). The outputs are denoted by yrj (r = 1,…, s). w and u are x and y respective weight. The efficiency of this model, θj, is calculated as follows:
3.2. NDEA Model
In this paper, the two-stage network DEA was employed to analyze the efficiency indices of the DMUs. Figure 1 illustrates our proposed framework for the evaluation of the impact of mobile payment services on banking systems.
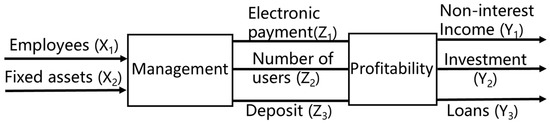
Figure 1.
Bank’s production process.
An additive two-stage DEA framework was proposed by Chen et al. (2009) [30], who suggested that the total efficiency of an entire system can be determined by the weighted average of the two sub-stage efficiencies. As shown in Figure 1, the model includes inputs, intermediates, and outputs. Therefore, based on the proposed structure for the NDEA model [30], each stage’s efficiency can be obtained through Equations (2) and (3):
Suppose that there is a set of n DMUs denoted by DMUj (j = 1,…, n), and the first stage has two inputs, denoted by x1 and x2. There are 3 intermediates denoted by z1, z2, and z3. The outputs of the second stage are denoted by y1, y2, and y3. The first and second stage are denoted by eiA and eiB, respectively.
As we applied the additive method from Chen et al.’s work (2009) [30], the weights for the weighted average of efficient scores of stages 1 and 2 were computed as follows:
Here, wA = wB = w are the weights that represent the importance of two sub-stages in the overall efficiency of each DMU. The total efficiency is the weighted average of both stages.
In the calculation, we first attempted to obtain the overall indices using Equation (5) with the following constraints:
However, model (6) is the envelopment form of the DEA model, and thus, we needed to exercise the transformation method from Charnes and Cooper’s work (1962) [52] to put the model into its linear multiplier form.
After achieving the total scores, Equations (1) and (2) could be used to gain sub-process efficiency. Based on one stage’s result, we applied Equation (5) to obtain the other stage.
3.3. Variable Definition and Statistical Descriptive
We attempted to use the model in this paper to measure the impact of mobile payments on the efficiency of banking activities. To observe how mobile payments affect the final income, the process was divided into two stages. The first stage, called the management stage, is where resources are generated to provide the service. The second stage, the profitability stage, reflects how efficient the new service is at raising income.
The first stage, the management stage, is where resources are generated to provide the service. The second stage, the profitability stage, reflects how efficient the new service is at raising income.
The selection of input and output variables is based on the DEA literature, such as Wang et al. (2014) [19] and Ashrafi and Jaafar (2011) [53]. In a one-stage case, employees and fixed assets are usually set as inputs, while non-interest income, investments, and loans are set as outputs. In a two-stage NDEA case, based on Seiford and Zhu (1999) [14] and Zhou et al. (2019) [17], at the first stage, the management stage, the number of employees and fixed assets are utilized to produce the intermediate services, which include payment volume, number of users, and deposit. At the second stage, while intermediates are inputs, the final output of this stage consists of the financial profit or loss represented by non-interest income, investment, and loans. Table 1 provides the comprehensive definition of our variables.

Table 1.
Variable definitions.
The official website of the Taiwanese Financial Supervisory Commission (FSC) only provides the complete data on e-payment services relating to 19 Taiwanese banks in the period from 2018 to 2021. As a result, the sample only covered 19 banks, among the 36 banks that currently exist, in these 4 years. Other data were taken from the TEJ database.
The basic statistics of key variables are shown in Table 2. As we can see, there was a case of extreme values in one variable, where the minimum value was 0.004 and the maximum was 1464.773. This variable was the number of users (Z2). Another variable that exhibited the same extremity was the payment volume, with the minimum being 10−8 and the maximum being 17.1827. The gaps between the biggest and the smallest number were large. This was caused by the variance in the size of banks and the duration for which banks have provided mobile payments to their customers.
Table 2.
Descriptive statistics for 19 Taiwanese banks (from 2018 to 2021).
Most banks increased their number of users during this period (2018–2021). However, Far Eastern, the bank with the smallest number of users, did not gain any new clients; their number of users remained at a constant of 0.038. This was the smallest number from 2019 to 2021.
4. Empirical Results
The NDEA model in this paper included two stages: management and profitability. At the first stage, management efficiency shows how efficiently banks use their physical resources, such as fixed assets and employees, to generate profitable services. The second stage shows how banks utilize their resources to transform these services into actual income and earning assets. In this case, our focus was on the impact of the electronic payment services, as represented by the intermediaries, payment volume, and number of users.
4.1. Management Efficiency
We investigated data from 4 years, 2018–2021, but we only presented the results of the last 2 years for the sake of a concise explanation. Table 3 displays the results of management efficiency in the period from 2020 to 2021. For management efficiency, in 2020, six banks had full efficiency. All the banks in the top tier remained the same compared to 2019. Most banks increased their efficiencies, except for Taishin International Bank and Taiwan Business Bank. Their scores decreased to 0.52 and 0.66, respectively. On the other hand, Shanghai Commercial & Savings Bank, which was at the bottom of the ranking in the previous year, improved significantly and reached 0.9 along with Taipei Fubon Bank. In 2020, no bank had an efficiency score below 0.5. Taishin International Bank had the worst score of 0.52, which was an obvious step up from the previous year. The average efficiency reflected this improvement by rising to 0.82.
Table 3.
Management efficiency of 19 Taiwanese banks with weights (2020–2021).
In 2021, slight changes occurred. Six banks were champions. However, Taipei Fubon replaced Far Eastern in the top tier. This was interesting, as these banks practically reversed their ranks; Taipei Fubon had ranked 7 in 2020, and Far Eastern ranked 7 in 2021. Taishin was still at the bottom of the ladder with a lower efficiency (0.49). It was the only bank with an efficiency below 0.5. This decrease was not an exception in 2021, as most banks lost their upward trend and exhibited lower management efficiencies. The average efficiency dropped from 0.82 to 0.8.
Among the six champions in 2021, five had a large number of deposits: more than two trillion NTD, which was the average for the 19 banks. Only Sinopac had lower numbers, at approximately 1.7 trillion. As deposits are the main funding source for banks, it is understandable why banks with high deposits achieve high management efficiency. In addition, both Sinopac and E. Sun had the highest number of users. Their payment volumes were among the best as well. On the other hand, Land Bank was among the banks with the lowest payment volumes in 2021, but its other outputs were high enough to compensate for this. Therefore, at the first stage, the management stage, deposits play a vital role in achieving efficient performance because they are the main sources of the generation of loans and investments for banks at the next stage. Non-interest services, such as electronic payments, in this case, can enhance the result but are not the main contributors.
We can consider the operation of a specific champion. For example, Taipei Fubon invested in developing its own digital platform, collaborating with the Taipei City Government to create a smart payment platform called “pay.taipei”. It also introduced a “credit factory” model, which allows the bank to fully automate its loan approval process and reduce the turnaround time. The bank won an award, the “World Economic Magazine Awards 2021—Best Micro Fintech Finance Bank Taiwan”, from World Economic Magazine. Taipei Fubon increased its investment in mobile payments and received notable results.
By comparing one of the champions, Sinopac, to the bank with the worst managerial result, Taishin, we can partly illustrate the causes of the differences in this stage’s efficiency. In 2021, Sinopac had half the number of inputs, in terms of both fixed assets and employees, but achieved a similar volume of deposits and more than 20 times the number of users (434,002–23,191). Moreover, Sinopac had a coherent strategy and budget for research and development in digital banking, while the annual report of Taishin presented an ambiguous plan.
Furthermore, from 2020 to 2021, observing the intermediates, it could be seen that only deposits uniformly increased in all six efficient banks. The number of users increased for most, except for Mega and Taipei Fubon. Mega lost more than half of its number of users, from one thousand seven hundred down to approximately eight hundred. On the other hand, only a handful of users, 34, stopped using Taipei Fubon’s services. The general upward trend in this factor was a sign that banks were aware of the opportunity electronic payment services present and were expanding them by attracting more customers. Payment volumes also increased slightly during this period, except for Mega and Taipei Fubon. The coronavirus pandemic, or COVID-19, was not at its peak during this period. Economies around the world were gradually recovering, and Taiwan was not an exception. People started to increase their spending, but economic activity was still low. These might partially explain the light growth in payment volume in 2021.
From 2020 to 2021, the average weight of the first stage had risen slightly, from 0.553 to 0.558, which coincided with a drop in the average efficiency, from 0.82 to 0.8. In 2021, Taishin International Bank had the highest weight of 0.67, but this bank only achieved 0.49 in management efficiency, the lowest score this year. Sunny Bank (0.65) was in second place, with a management efficiency of 0.53. The lowest weight was 0.5. All six champions in the management stage achieved this weight. This suggests that banks should equalize their use of resources. A heavy focus on management would only lead to low efficiency. This was further proven by the slight increase in the average management weight in 2021 (0.55), which coincided with the decrease in average efficiency. Far Eastern, which fell out of the top tier, had a higher weight (0.52) compared to 2020 (0.5). On the other hand, Taipei Fubon reduced its weight to 0.5 and attained full efficiency in management.
Among the intermediate inputs, deposit was the focus output of this stage. It was the main activity in banks and an important contributor to stage efficiency. On the other hand, payment volumes and numbers of users reflected the activities of mobile payment services in commercial banks. As deposits exhibited a stable rise in these years, the imperfect management efficiency suggests that banks did not use their resources to generate the electronic payment services efficiently. This result is appropriate because these non-interest services have been new expansions for banks in recent years. Many banks are concentrating more on their traditional activities, and mobile payment only accounts for a small branch of their services. However, banks remain aware of the opportunity to profit from this type of service and improve their efficiency over time.
4.2. Profitability Efficiency
In contrast with the first stage, the average profitability efficiency at the second stage was close to the peak in both 2020 and 2021, but it was also on a downward trajectory. As shown in Table 4, the average efficiencies were 0.91 (2020) and 0.88 (2021). In 2020, there were five banks with full efficiency scores. This number lowered to four in 2021, but the winners remained the same, except for Taiwan Business. While Chinatrust, Land Bank, Taishin, and Shanghai remained in their champion positions, Taiwan Business lost its title. Its efficiency dropped to 0.98. In 2021, E. Sun kept its seat at the bottom with 0.58. Most of the top-tier banks in this stage did not generate a large number of outputs in the first sub-process, but the profit earned at the second stage was high in comparison.
Table 4.
Profitability efficiency of 19 Taiwanese banks with weights (2020–2021).
The average weight of the profitability stage was 0.45 in 2020, and it fell to 0.44 in 2021. The highest weight at the second stage was 50 percent. However, only one bank achieved full efficiency in the profitability stage and had a weight of 0.5. Other top-tier banks demonstrated that the lower their weight, the higher their efficiency. The most exemplary case was Taishin International Bank, which had the lowest efficiency rank in 2019 and soared to the maximum score in 2020. At the same time, Taishin’s second-stage weight dropped from 0.43 (2019) to 0.34 (2020). Similarly, Taiwan Business’ weight increased while its efficiency decreased. There was a slight fall in the average weight of the second stage from 2020 to 2021. Nevertheless, the change was not significant, being only 0.1 percent. This indicated that banks were more focused on generating services and funding than turning them into income.
At the second stage, there was a role reversal compared to the previous stage, as the champion became the “loser”, and vice versa. Taishin had the worst result in the management stage, while E. Sun was one of the best. As this stage focused on profitability, we could observe that E. Sun possessed a huge number of users (1,464,773) and a large payment volume (15.3) compared to Taishin (23,191; 0.15). However, the non-interest income that E. Sun generated was less than twice the amount of Taishin. This proved that E. Sun was inefficient in turning its services into actual profit.
In the profitability stage, the most efficient banks were those with a large amount of non-interest income, mostly higher than the average of the 19 banks. The Land Bank of Taiwan was an exception, but it also had far fewer intermediates than other banks in the same rank. This suggests that the good results at this stage were not only dependent on their success in traditional services reflected in loans and investments, but also on non-interest services such as e-payment. However, the profitability stage does not require a lot of attention. More concentration at this stage would lead to low efficiency. This was reflected in the efficiency scores and weights in this stage.
The profitability stage measures the capability of Taiwanese banks to turn services into income. Based on the table above, the second division, the profitability process, appeared to have highly positive results. This suggests that mobile payment services represent a potential investment, and banks recognize this prospect.
4.3. Overall Efficiency
In this research, we examined the effect of e-payment services on Taiwanese banks’ efficiency, which was reflected in the intermediate products of this model, payment volume, and numbers of users. Our data covered 4 years, from 2018 to 2021. However, we only show the results of 2021 in Table 5 for the sake of our explanation.
Table 5.
Overall efficiency of 19 Taiwanese banks with weights and CCR efficiencies (2021).
In terms of overall efficiency, only one of the nineteen banks achieved the unique overall efficiency of 1. This showed that few banks had managed to effectively exploit the new services during the whole process. Divisionally, each performance stage had more banks with full efficiency scores. The management stage provides evidence that despite deposits being the main activity in bank operation, non-interest services such as mobile payment are important contributors to banks’ efficiency. However, generating a large number of deposits and services does not equate to the ability to turn these into income. In the profitability stage, the banks achieving high efficiency had a lower-than-average number of users and payment volume and a small number of deposits, but they incurred high non-interest income, investments, and loans, which suggests that banks were better at profiting from their services.
According to the results from Table 5, only the Land Bank of Taiwan achieved 100% efficiency in both years. The runner-up in 2021 was Mega, with a 95% level of efficiency. Sunny Bank achieved the lowest results in overall efficiency in both years: 0.65. From 2019 to 2020, the mean scores increased to 0.85 due to the rise in management efficiency and the changes in the weight of each stage. However, this still showed that many banks could not completely exploit the benefits of the new service, mostly because of their low score in the management stage. In 2021, as both stages’ efficiencies adopted downward trends, the average overall efficiency also decreased to 0.83. This might have been caused by the reduced online consumption after the pandemic.
In terms of applying new technology, Landbank launched its digital finance transformation in line with government policy and fintech development. To provide customers with new options for mobile use, Landbank initiated various projects, such as big data applications, digital financial infrastructure, intelligent services, the optimization of the internet and mobile banking APP, mobile payment, mobile phone transfer, Taiwan Pay a bonus point service, a single-service platform for personal finance, etc., and cooperated with various electronic payment institutions (e.g., JKOPAY, LinePay, iPASS, etc.). This explained the steady rise in the intermediates of the bank over the years and the high management efficiency. Moreover, the bank also provided training on digital banking and fintech to employees, as well as investing in various research to improve their electronic services.
In general, most banks had one good stage and one bad stage. As there were less efficient banks and a stronger fluctuation in efficiency at the second stage, this could have implied that the second stage was the main problem causing inefficiency. Another possible explanation is that the Land Bank of Taiwan was good at allocating resources to accomplish the highest result in each sub-process. They did not accumulate a large number of any inputs or intermediates; everything was in medium proportion compared to others, allowing them to control their resources more efficiently by moderating an appropriate number of inputs for each division. On the other hand, the inefficiency of the management stage, the focus of the bank on this process, and its lower-than-average quantity of intermediates and outputs were the reasons Sunny Bank stayed at the bottom of the ranking.
According to the work of Kao and Hwang (2008) [15], the rank of a bank should lie between the ranks of its sub-processes or in its neighborhood. From the rank of the efficiency scores, there were large differences between the overall ranking and the divisional ranking. Large differences among these ranks revealed the source of the problem. For example, the Bank of Taiwan achieved the highest rank (1) at the first stage and was among the worst (14) at the second stage. As a result, it ranked fourth in overall efficiency. Similarly, Sinopac, E. Sun, and Taipei Fubon all ranked first in management, but they had low ranks in profitability: 18, 19, and 12, respectively. In terms of overall efficiency, their ranks were 8 (Sinopac), 13 (E. Sun), and 3 (Taipei Fubon). On the other hand, China Trust, Taishin, and Shanghai all had perfect profitability efficiencies, but their management efficiency scores were low. Their first-stage rankings were 16, 19, and 10, respectively. Therefore, their overall scores were the same as the champions of the first stage.
In Table 6, a steady increase in management efficiency from 0.78 to 0.82 over the first three years was observed, followed by a drop to 0.8 in 2021. This was concurrent with a gradual decrease in management weight and a sudden increase in 2021. In contrast, average profitability efficiency had been declining over the years, decreasing from 0.93 to 0.88. This was reflected in the increase in average weights from 0.43 to 0.44. This suggests that the decision of the banks to reduce the resources of the first stage was a viable strategy. However, banks need to increase the number of outputs produced at the second stage to prevent the intermediates generated at the first stage from becoming burdens for the entire operation. Furthermore, the constant increase in overall efficiency in the first three years (2018–2021) and its decline in the last year indicated that overall efficiency was significantly influenced by management efficiency. Banks with higher management efficiency were better able to compensate for their weaknesses than those with high profitability efficiency.
Table 6.
Average efficiency scores and weights of Taiwanese banks (2018–2021).
The current main disadvantages of most Taiwanese banks are their inability to fully exploit new services. Despite being able to generate huge amounts of services and funds, banks are unable to transform them into profit. This is reflected in the discrepancy between management efficiency and profitability efficiency. As a result, they achieved a low score overall. The Land Bank of Taiwan was the only bank to be successful in both stages, which suggests that Taiwanese banks should re-examine their strategies on how to allocate their resources as well as how to utilize them to generate profitable services.
4.4. Comparing NDEA with the Black Box Method
To emphasize the explanatory power of our model, we compared the performance indices between two models: the CCR model without the intermediate processes and the two-stage network DEA model. Table 7 lists the results of banks’ overall efficiency scores in 2020–2021. We found that the two models indicated similar situations. The average efficiency decreased. In terms of the number of efficient DMUs, the CCR model provided 13 in 2020 and 10 in 2021, while our model only generated 1. The average score in 2021 was 0.96 for the CCR model and 0.83 for the NDEA model.
Table 7.
Efficiency scores—comparing two models (2020–2021).
Moreover, regarding the dispersion of the scores’ distribution, the minimum values from the CCR model were 0.8 and 0.81 for 2020 and 2021, respectively, which were higher than those from the NDEA model (0.66 and 0.65), as shown in Table 8.
Table 8.
Descriptive Statistics of Efficiency Score—comparing 2 models (2020–2021).
Furthermore, with a black-box model, it is impossible to understand which factors play the main roles in creating inefficiency and how to improve the current state of affairs. The two-stage NDEA model allowed us to pinpoint the exact culprit of low performance and strategize appropriate solutions. Therefore, it is obvious that the discriminating power of network DEA models is significantly higher in comparison to the CCR model.
4.5. Mann–Whitney U Test
We used the Mann–Whitney U Test to determine if there was a significant difference between the efficiencies of the NDEA model and the CCR model. Our H0 was that the efficiencies of the NDEA model were not statistically different from the CCR model. After testing, the U value was 36 and the p-value was 0.00001. Therefore, we rejected H0 (p < 0.05). The results of the two models were significantly different.
5. Conclusions
5.1. Managerial Implications
Currently, the Taiwanese government is encouraging the use of mobile payments. It is expected to penetrate 90% of the population through tax incentives and infrastructure. According to FSC data, the number of users of electronic payments in July 2020 reached 9,664,000. Taiwan’s e-payment business is still growing. Therefore, by offering mobile payment services, banks can exploit great opportunities and increase profitability.
From the results above, it can be seen that Taiwanese banks are aware of this perspective and are trying to maximize their results from this new branch of services. However, there are limitations to their efforts. As mobile payment development in banks is in its initial stages, the number of services generated is low. To fully take advantage of the current situation, banks should utilize their resources to produce more suitable products. In addition to implementing diversified services, extending the area of applicability is also necessary to attract new customers.
Based on the current evidence, we suggest that banks with large amounts of resources, employees, and fixed assets should strategize to take advantage of the current situation. With large budgets and customer bases, they should focus on transforming them into profit rather than just generating new services. The current government policies have created good opportunities for banks to take advantage of.
Medium- and small-sized banks are already aware and are concentrating on this new opportunity. However, despite being able to turn the services into revenue, they lack the resources to generate them. As a result, these banks should initiate strategies that can help them manage their assets and personnel more efficiently.
5.2. Conclusions
All our four main research questions, shown in the introduction, have been explored, and some innovative results have been verified. For Q1: Does mobile payment impact the performance of Taiwanese banks? With NDEA, although we assume that mobile payment might impact a bank’s operation, the empirical results do show that it significantly affects the performance of the sub-branches and the whole system of banks. It is further verified, by the Mann–Whitney U-test in Section 4.5, that taking into account the impact of mobile payments will result in a different empirical outcome.
For Q2: Does NDEA have a stronger discriminating power in analyzing efficiency than traditional DEA methods in mobile payment cases? Our empirical results show that, compared to the traditional DEA model, the NDEA model has more explanatory power in analyzing the operational performance of Taiwan’s banks impacted by mobile payment. For example, despite having some efficient DMUs in each sub-stage, the number of banks that achieved full overall efficiency was limited. In 2019 and 2020, only the Land Bank of Taiwan reaches an overall efficiency of 1.
For Q3: Does mobile payment influence management efficiency as well as profitability efficiency? Despite different degrees, our empirical results show that mobile payments do influence management efficiency and profitability efficiency. Furthermore, we find that banks with high management efficiency would achieve low profitability efficiency, and vice versa. As a result, the actual obstacle might be the second stage, in which most banks are not able to achieve perfect results.
For Q4: How do inefficient DMUs improve their sub-branch efficiencies as well as their overall efficiency? We find that the rise in profitability weight that coincided with the slight dip in its efficiency implies that the increasing focus on the second stage does not necessarily create much benefit. Banks should apply better strategies to adopt and exploit mobile payment services. Furthermore, banks should better allocate resources to generate services and concentrate on turning these services into actual income.
Few DEA literatures have dealt with the new fintech tools in banking systems. We have successfully set up a NDEA model to account for how mobile payments impact the operation of Taiwan’s banking industry. Although we did make some insights to bridge the gap in the literature, our paper has some limitations. First, the sample size can be increased. Although we exploit 19 Taiwanese banks over a four-year period, the sample can be expanded to include international banks. Second, the main variables of mobile payment, payment volume and the number of users can be enriched to capture all aspects of mobile payment. Third, the actual internal operation processes of banks could be more complicated than the two stages NDEA set forth in this study.
Future research can address these limitations by incorporating more data from other countries, such as China and Southeast Asia, to increase the reliability and representativeness of the results. Combining the Malmquist Index with NDEA could be a useful approach to investigating efficiency changes over time, both overall and divisional. Furthermore, finding other variables that better reflect the properties of mobile payment can improve the accuracy of the model. Finally, extending the model to a three-stage NDEA or a parallel structure model can provide a more comprehensive understanding of the true properties of mobile payment.
Author Contributions
Conceptualization, C.-P.C. and L.-W.L.; methodology, C.-P.C. and B.-N.T.; software, B.-N.T. and Liu, Y-J.; validation, C.-P.C., L.-W.L. and B.-N.T.; formal analysis, C.-P.C. and B.-N.T.; investigation, L.-W.L. and B.-N.T.; data curation, Y.-J.L.; writing—original draft preparation, B.-N.T. and Y.-J.L. writing—review and editing, C.-P.C. and L.-W.L.; visualization, B.-N.T. and L.-W.L.; supervision, C.-P.C. and L.-W.L.; project administration, C.-P.C. All authors have read and agreed to the published version of the manuscript.
Funding
This research received no external funding.
Conflicts of Interest
The authors declare no conflict of interest.
References
- Junyong, X.; Linbo, J. Electronic Commerce in China: Current Status, Development Strategies, and New Trends. China Financ. Econ. Rev. 2014, 3, 70–94. [Google Scholar]
- Dahlberg, T.; Guo, J.; Ondrus, J. A critical review of mobile payment research. Electron. Commer. Res. Appl. 2015, 14, 265–284. [Google Scholar] [CrossRef]
- Koenig-Lewis, N.; Marquet, M.; Palmer, A.; Zhao, A.L. Enjoyment and social influence: Predicting mobile payment adoption. Serv. Ind. J. 2015, 35, 537–554. [Google Scholar] [CrossRef]
- Lu, Y.; Yang, S.; Chau, P.Y.K.; Cao, Y. Dynamics between the trust transfer process and intention to use mobile payment services: A cross-environment perspective. Inf. Manag. 2011, 48, 393–403. [Google Scholar] [CrossRef]
- Shao, Z.; Zhang, L.; Li, X.; Guo, Y. Antecedents of trust and continuance intention in mobile payment platforms: The moderating effect of gender. Electron. Commer. Res. Appl. 2019, 33, 100823. [Google Scholar] [CrossRef]
- Stoica, O.; Mehdian, S.; Sargu, A. The Impact of Internet Banking on the Performance of Romanian Banks: DEA and PCA Approach. Procedia Econ. Financ. 2015, 20, 610–622. [Google Scholar] [CrossRef]
- Mohammadi, H. A study of mobile banking loyalty in Iran. Comput. Hum. Behav. 2015, 44, 35–47. [Google Scholar] [CrossRef]
- Afshan, S.; Sharif, A. Acceptance of mobile banking framework in Pakistan. Telemat. Inform. 2016, 33, 370–387. [Google Scholar] [CrossRef]
- Malaquias, R.F.; Hwang, Y. Mobile banking use: A comparative study with Brazilian and US participants. Int. J. Inf. Manag. 2019, 44, 132–140. [Google Scholar] [CrossRef]
- Kapoor, K.K.; Dwivedi, Y.K.; Williams, M.D. Examining the role of three sets of innovation attributes for determining adoption of the interbank mobile payment service. Inf. Syst. Front. 2015, 17, 1039–1056. [Google Scholar] [CrossRef]
- Ha, K.H.; Canedoli, A.; Baur, A.W.; Bick, M. Mobile banking—Insights on its increasing relevance and most common drivers of adoption. Electron. Mark. 2012, 22, 217–227. [Google Scholar] [CrossRef]
- Charnes, A.; Cooper, W.W.; Rhodes, E. Measuring the efficiency of decision making units. Eur. J. Oper. Res. 1978, 2, 429–444. [Google Scholar] [CrossRef]
- Färe, R.; Grosskopf, S. Productivity and intermediate products: A frontier approach. Econ. Lett. 1996, 50, 65–70. [Google Scholar] [CrossRef]
- Seiford, L.M.; Zhu, J. Profitability and marketability of the top 55 U.S. commercial banks. Manag. Sci. 1999, 45, 1270–1288. [Google Scholar] [CrossRef]
- Kao, C.; Hwang, S.N. Efficiency decomposition in two-stage data envelopment analysis: An application to non-life insurance companies in Taiwan. Eur. J. Oper. Res. 2008, 185, 418–429. [Google Scholar] [CrossRef]
- Galagedera, D.U.; Roshdi, I.; Fukuyama, H.; Zhu, J. A new network DEA model for mutual fund performance appraisal: An application to US equity mutual funds. Omega 2018, 77, 168–179. [Google Scholar] [CrossRef]
- Zhou, X.; Xu, Z.; Chai, J.; Yao, L.; Wang, S.; Lev, B. Efficiency evaluation for banking systems under uncertainty: A multi-period three-stage DEA model. Omega 2019, 85, 68–82. [Google Scholar] [CrossRef]
- Paradi, J.C.; Rouatt, S.; Zhu, H. Two-stage evaluation of bank branch efficiency using data envelopment analysis. Omega 2011, 39, 99–109. [Google Scholar] [CrossRef]
- Wang, K.; Huang, W.; Wu, J.; Liu, Y.N. Efficiency measures of the Chinese commercial banking system using an additive two-stage DEA. Omega 2014, 44, 5–20. [Google Scholar] [CrossRef]
- Berger, A.N.; Hunter, W.C.; Timme, S.G. The efficiency of financial institutions: A review and preview of research past, present and future. J. Bank. Financ. 1993, 17, 221–249. [Google Scholar] [CrossRef]
- Phung, M.T.; Cheng, C.P.; Guo, C.; Kao, C.Y. Mixed Network DEA with Shared Resources: A Case of Measuring Performance for Banking Industry. Oper. Res. Perspect. 2020, 7, 100173. [Google Scholar] [CrossRef]
- Yao, M.; Di, H.; Zheng, X.; Xu, X. Impact of payment technology innovations on the traditional financial industry: A focus on China. Technol. Forecast. Soc. Change 2018, 135, 199–207. [Google Scholar] [CrossRef]
- Cheng, Y.W.; Hsu, S.Y.; Lo, C.P. Innovation and imitation: Competition between the US and China on third-party payment technology. J. Chin. Econ. Foreign Trade Stud. 2017, 10, 252–258. [Google Scholar] [CrossRef]
- Micu, A.E. Modeling a fuzzy system for assisting the customer targeting decisions in retail companies. An. Stiintifice Ale Univ. Ovidius Constanta Ser. Mat. 2016, 24, 259–274. [Google Scholar] [CrossRef]
- Liu, T.; Pan, B.; Yin, Z. Pandemic, mobile payment, and household consumption: Micro-evidence from China. Emerg. Mark. Financ. Trade 2020, 56, 2378–2389. [Google Scholar] [CrossRef]
- Mckee, J. The State of the Union: Global Digital Payments and Fintech Ecosystem. SP Glob. Mark. Intell. 2021, 2021, 30. [Google Scholar]
- Oliveira, T.; Thomas, M.; Baptista, G.; Campos, F. Mobile payment: Understanding the determinants of customer adoption and intention to recommend the technology. Comput. Hum. Behav. 2016, 61, 404–414. [Google Scholar] [CrossRef]
- Humbani, M.; Wiese, M. A Cashless Society for All: Determining Consumers’ Readiness to Adopt Mobile Payment Services. J. Afr. Bus. 2018, 19, 409–429. [Google Scholar] [CrossRef]
- Huang, T.-T. Taiwan’s local COVID outbreak leads to increase in mobile payments. Taiwan News, 24 June; 2021.
- Chen, Y.; Cook, W.D.; Li, N.; Zhu, J. Additive efficiency decomposition in two-stage DEA. Eur. J. Oper. Res. 2009, 196, 1170–1176. [Google Scholar] [CrossRef]
- Banker, R.D.; Charnes, A.; Cooper, W.W. Some Models for Estimating Technical and Scale Inefficiencies in Data Envelopment Analysis. Manag. Sci. 1984, 30, 1078–1092. [Google Scholar] [CrossRef]
- Mostafa, M.M. Modeling the efficiency of top Arab banks: A DEA-neural network approach. Expert Syst. Appl. 2009, 36, 309–320. [Google Scholar] [CrossRef]
- Wu, D.; Yang, Z.; Liang, L. Using DEA-neural network approach to evaluate branch efficiency of a large Canadian bank. Expert Syst. Appl. 2006, 31, 108–115. [Google Scholar] [CrossRef]
- Henriques, I.C.; Sobreiro, V.A.; Kimura, H.; Mariano, E.B. Two-stage DEA in banks: Terminological controversies and future directions. Expert Syst. Appl. 2020, 161, 113632. [Google Scholar] [CrossRef] [PubMed]
- Färe, R.; Grosskopf, S. Network DEA. Socio-Econ. Plan. Sci. 2000, 34, 35–49. [Google Scholar] [CrossRef]
- Tone, K.; Tsutsui, M. Dynamic DEA: A slacks-based measure approach. Omega 2010, 38, 145–156. [Google Scholar] [CrossRef]
- Yakob, R.; Yusop, Z.; Radam, A.; Ismail, N. Two-stage DEA method in identifying the exogenous factors of insurers’ risk and investment management efficiency. Sains Malays. 2014, 43, 1439–1450. [Google Scholar]
- Wanke, P.; Barros, C. Two-stage DEA: An application to major Brazilian banks. Expert Syst. Appl. 2014, 41, 2337–2344. [Google Scholar] [CrossRef]
- Yang, C.; Liu, H.M. Managerial efficiency in Taiwan bank branches: A network DEA. Econ. Model. 2012, 29, 450–461. [Google Scholar] [CrossRef]
- Fernandes, F.D.S.; Stasinakis, C.; Bardarova, V. Two-stage DEA-Truncated Regression: Application in banking efficiency and financial development. Expert Syst. Appl. 2018, 96, 284–301. [Google Scholar] [CrossRef]
- Rachita, G.; Sunil, K. Analysing banks’ intermediation and operating efficiencies using the two-stage network DEA model: The case of India. Int. J. Product. Perform. Manag. 2017, 66, 500–516. [Google Scholar]
- Lozano, S. Slacks-based inefficiency approach for general networks with bad outputs: An application to the banking sector. Omega 2016, 60, 73–84. [Google Scholar] [CrossRef]
- Tone, K. Dealing with undesirable outputs in DEA: A Slacks-Based Measure (SBM) approach. In Proceedings of the North American Productivity Workshop, Toronto, Japan, 23–25 June 2004; pp. 44–45. [Google Scholar]
- Yu, M.M.; Lin, C.I.; Chen, K.C.; Chen, L.H. Measuring Taiwanese bank performance: A two-system dynamic network data envelopment analysis approach. Omega 2019, 98, 102145. [Google Scholar] [CrossRef]
- Yang, Y.-L.; Hsueh, H.-W.; Huang, M.-H.; Cho, T.-Y.; Kishi, Y. Effect of Fintech on the Productivity in the Taiwan Banking Industry. Int. J. E-Educ. e-Bus. e-Manag. e-Learn. 2017, 7, 255–263. [Google Scholar] [CrossRef]
- Andrejić, M.; Kilibarda, M.; Pajić, V. Measuring efficiency change in time applying Malmquist Productivity Index: A case of distribution centres in Serbia. Facta Univ. Ser. Mech. Eng. 2021, 19, 499–514. [Google Scholar] [CrossRef]
- Coell, T.J.; Rao, D.S.P.; Battese, G.E. An introduction to Efficiency and Productivity Analysis, 2nd ed.; Springer: Berlin/Heidelberg, Germany, 2005. [Google Scholar]
- Wu, Y.; Ke, Y.; Zhang, T.; Liu, F.; Wang, J. Performance efficiency assessment of photovoltaic poverty alleviation projects in China: A three-phase data envelopment analysis model. Energy 2018, 159, 599–610. [Google Scholar] [CrossRef]
- Luo, X. Evaluating the profitability and marketability efficiency of large banks: An application of data envelopment analysis. J. Bus. Res. 2003, 56, 627–635. [Google Scholar] [CrossRef]
- Zha, Y.; Liang, N.; Wu, M.; Bian, Y. Efficiency evaluation of banks in China: A dynamic two-stage slacks-based measure approach. Omega 2016, 60, 60–72. [Google Scholar] [CrossRef]
- Kong, W.-H.; Fu, T.-T.; Yu, M.-M. Evaluating Taiwanese Bank Efficiency Using the Two-Stage Range DEA Model. Int. J. Inf. Technol. Decis. Mak. 2016, 16, 1043–1068. [Google Scholar] [CrossRef]
- Charnes, A.; Cooper, W.W. Programming with linear fractional functionals. Nav. Res. Logist. Q. 1962, 9, 181–186. [Google Scholar] [CrossRef]
- Ashrafi, A.; Jaafar, A. Performance measurement of two-stage production systems with undesirable factors by data envelopment analysis. J. Appl. Sci. 2011, 11, 3515–3519. [Google Scholar] [CrossRef]
Disclaimer/Publisher’s Note: The statements, opinions and data contained in all publications are solely those of the individual author(s) and contributor(s) and not of MDPI and/or the editor(s). MDPI and/or the editor(s) disclaim responsibility for any injury to people or property resulting from any ideas, methods, instructions or products referred to in the content. |
© 2023 by the authors. Licensee MDPI, Basel, Switzerland. This article is an open access article distributed under the terms and conditions of the Creative Commons Attribution (CC BY) license (https://creativecommons.org/licenses/by/4.0/).