Abstract
To study the heterogeneity and local heterogeneity of gangue particle size distribution (PSD) under ball milling, gangue from northern Shaanxi coal mine was taken as a research object. The multifractal pattern of PSD and the variation trend of characteristic parameters of gangue under different ball-to-gangue ratios and grinding times were analyzed by introducing multifractal theory and microscopic research methods such as laser particle size analysis and scanning electron microscopy. The results show that the multifractal characteristics of the gangue particle size distribution with different ball-to-gangue ratios and grinding time periods demonstrate obvious changes. When the ball-to-gangue ratio is 3~9, the multifractal parameters D(0), D(1), Δα, and Δf all show linear changes with grinding time. It is demonstrated that due to the phenomenon of particle agglomeration during ball milling, the multifractal characteristics of the particle size distribution of the gangue changes significantly when the ball-to-gangue ratio is 12~15. Furthermore, the results indicate that with the increase in time, D(0), Δα, and Δf show a trend of decreasing first and then increasing, and D(1) and D(1)/D(0) show a trend of first increasing and then decreasing, and both reach their extreme values at 30 min.
1. Introduction
In recent years, with the large-scale mining of coal resources, a large amount of coal gangue is produced and accumulated on the surface. Gangue has become a serious scientific and engineering issue in the current environment of green mining. Chen Y Coal pointed out that gangue accumulates in huge coal gangue piles, occupying lots of land as well as having a striking influence on the neighboring environmental effects [1,2]. In order to reduce the accumulation of waste rock on the surface, scholars have proposed a variety of waste rock resource utilization methods [2], such as making bricks [3], making cement [4], making geotechnical materials [5], etc. The prerequisite for the successful implementation of the above application methods lies in the smooth progress of the gangue crushing process; after the particle size reaches the requirements of a millimeter or even micron scale, different methods of resource utilization can be carried out [6,7,8]. This requires the use of fine crushing equipment such as ball mills to achieve the transition of gangue from large to small particle sizes in the multi-path application stage. The current research on gangue crushing focuses on the indoor crushing experiment stage [9,10]. For example, Yang et al. [11] studied the crushed particle size distribution (PSD) of gangue under dynamic impact through the split Hopkinson pressure bar (SHPB) experimental device. Feng et al. [12] studied the crushing characteristics of crushed limestone during static compression. Therefore, further study is required to analyze the factors affecting the crushing of gangue in the ball mill based on the on-site gangue ball milling process to realize the control and optimization of the gangue particle size and structure.
In certain measures, gangue after macroscopic crushing demonstrates fractal characteristics under the action of crushing machinery [13]. In recent years, the use of fractal models to calculate the fractal dimensions of particles to characterize the structure and uniformity of particle groups has become a new method to quantitatively describe the internal structural characteristics [14,15,16]. However, the previous studies [13,17] on the PSD of bulk materials were mostly based on single fractals. Monofractal theory can only describe PSD features holistically and averagely. In contrast, multifractal theory describes different local conditions of fractal structure through spectral functions or special structural behaviors and characteristics caused by different levels in the evolution process. To study its inclusive characteristics, the statistical physics method is used to examine the distribution law of characteristic parameter probability, which reflects the local heterogeneity and non-uniformity of PSD [18,19,20,21,22].
In the crushing process, the PSD characteristics of gangue exhibit a complex variation system. As a result of natural effects such as collisions and handling during excavation, transportation, and accumulation, particles are gradually worn down and broken. The particle size structure approaches the fractal structure continuously. Additionally, under the action of crushing equipment such as ball mills, the edges, corners and internal cracks of the particles will be broken again in the impact of random machines, resulting in more complex particle structures. Considering that gangue is a solid waste resource with large reserves, it has good prospects for utilization around the world, and the current common utilization methods such as filling, cement making, ceramics making, and chemical products all affect the particle size and shape of gangue. There are high requirements, so the research results are of great significance for controlling the process parameters of gangue in the ball milling process and guiding the resource utilization of gangue.
2. Materials and Methods
2.1. Preparation of Gangue Samples
Figure 1 shows the sampling site of the gangue and the stratum where the gangue is located. The gangue was taken from the Mahuangliang Coal Mine in Yulin City, Shaanxi Province, China. The mine is located in the border area between the Maowusu Desert and the Loess Plateau in northern Shaanxi. The ecological environment is fragile; therefore, more attention needs to be paid to the treatment of surface gangue [23]. The gangue used in this study is mudstone gangue [24], which is generally irregular in shape and has sharp edges and corners. The specific parameters are shown in Table 1.
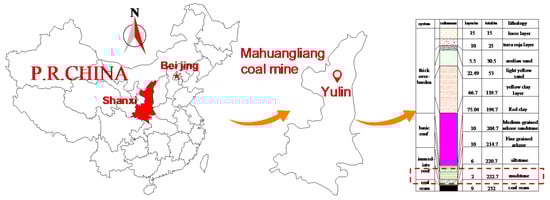
Figure 1.
Schematic diagram of gangue sampling site and stratum.

Table 1.
Mechanical parameters of coal gangue samples.
2.2. Test Apparatus and Procedure
The model of the ball mill used in the test was a SMφ500 × 500 mm test mill (Figure 2), the power of the equipment was 1.5 kW, and the speed was 48 rpm. The steel ball was used as the grinding medium, and the gangue was crushed by impacting the gangue with the steel ball in the experiment [25].
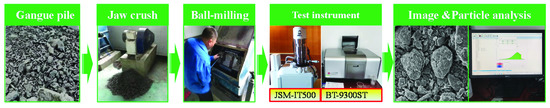
Figure 2.
Test apparatus and process.
To obtain gangue samples under different grinding times and ball-to-gangue ratios, the test steps as shown in Figure 2 and Table 2 were as follows:
Table 2.
Experimental scheme of ball mill crushing.
Step 1: Jaw crush the gangue, and sieve and weigh the crushed gangue as a sample for ball milling.
Step 2: According to Table 2, select steel balls and gangue of appropriate quality, mix them evenly, put them into the barrel of the ball mill, and prepare to start the ball mill.
Step 3: Stop the operation of the ball mill every 10 min, open the sealing plate on the cylinder, take out the gangue sample with a sample divider, and test the particle size distribution of the sample through laser particle size analyzer (Figure 3).
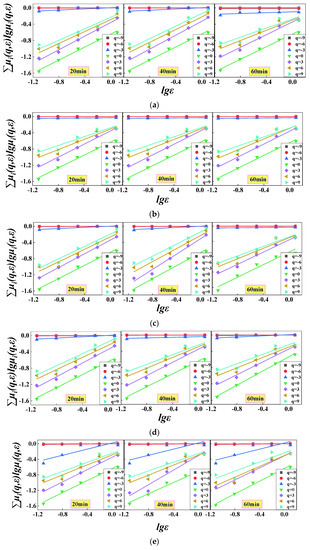
Figure 3.
Partition function clusters of the gangue powder. All of the correlation coefficients (R2) are greater than 0.90. (a) The ball-to-gangue ratio is 3. (b) The ball-to-gangue ratio is 6. (c) The ball-to-gangue ratio is 9. (d) The ball-to-gangue ratio is 12. (e) The ball-to-gangue ratio is 15.
Step 4: Reseal the barrel of the ball mill, then start the ball mill and run for 10 min, 20 min, 30 min, 40 min, 50 min, and 60 min in sequence, and repeat step 3.
All the test samples were allowed to pass through a 2 mm sieve and were mixed evenly. Each sample was divided into two parts—one part was used for PSD characteristic analysis of gangue powder, and the other was used to observe the structure and morphology of the powder. The BT-9300ST laser particle size analyzer was used to test PSD. The repeated measurement error of this instrument was less than 2%, and each sample weighed 0.5 g. After the particles in the equipment were dispersed, and the air bubbles were removed, we stirred evenly. Finally, we drew the sample with a straw to determine the volume percentage of the particle size. The morphology characterization tests were conducted on gangue particles as depicted in Figure 2. A JSM-IT500 scanning electron microscope (SEM) was used to scan and observe the gangue samples coated with a conductive film.
2.3. Multifractal Algorithm for PSD of Gangue Particles
Taking the measurement interval I = [0.02, 2000] of the laser particle size analyzer, the interval I was divided into 100 sub-intervals Ii = [φi, φi+1], i = 1, 2, …, 100. When dividing, the sampling interval was equal to a logarithmic increase, and lg(φi+1/φi) represents a constant. vi is used to represent the volume percentage content of gangue PSD in each sub-interval .
In order to use the multifractal method to analyze the PSD characteristics of interval I, the length of each sub-interval must be the same. Hence, a new dimensionless interval J = [lg(0.02/0.02), lg(2000/0.02)] = [0,5], then there are 100 equidistant subintervals Ji in the interval. The multifractal analysis of the PSD of the bulk material involved dividing the entire span of the PSD of the bulk material into equal “boxes” of scale ε, and the total number of boxes obtained was N. In J, there are N(ε) = 2k small intervals of the same size, where ε = 5 × 2−k. To ensure that the minimum subinterval included the measured value, the value range of k here is 1–6. Therefore, interval J was divided equally by 2, 4, 8, 16, 32, and 64, and the corresponding interval sizes were 2.5, 1.25, 0.625, 0.312, 0.156, and 0.078. The probability density of the PSD of the gangue material in each subinterval Ji is denoted by μi(ε), which is the sum of all the measured values vi in the subinterval Ji.
A family of partition functions were constructed using μi(ε) as follows [26,27].
In the formula: μi(q,ε) is the q-order probability of the i-th sub-interval, and q is a real number.
Then, the formula for calculating the generalized fractal dimension D(q) is:
The multifractal singularity index of PSD is:
Then, the multifractal spectral function of PSD relative to α(q) is:
When q = 0, 1, the corresponding D(0), D(1) are the capacity dimension and information entropy dimension, respectively [28,29]. D(0) describes the average characteristics of the PSD of the gangue particles; the larger the value of D(0) is, the wider the PSD range is. In contrast, D(1) describes the dispersion of the PSD distribution measurement of the material; the larger D(1) is, the higher the degree of PSD inhomogeneity is. D(1)/D(0) describes the concentration of PSD of bulk materials [30].
The singularity index α(q) and multifractal spectral function f(α(q)) are other measures of the PSD fractal structure of gangue particles, which reflect the local characteristics of the multifractal spectrum [31,32]. The spectral width of the multifractal spectrum (Δα = αmax − αmin) reflects the non-uniformity degree of probability measuring the distribution of physical quantities on the whole fractal structure.
3. Results and Discussion
3.1. PSD Characteristics of Gangue in Ball Milling Process
In ball milling, the structure of mudstone gangue will be broken or damaged, changing the particle size structure. The PSD of gangue under the different ball-to-gangue ratios and grinding times is shown in Table 3. It can be seen from the table that the particle size of the gangue in the study area is mainly distributed around 10–2000 μm in the process of ball milling. The particle size of gangue under different ball-to-gangue ratios and grinding times varies greatly, indicating that the PSD of gangue under different ball-to-gangue ratios and times has different fractal characteristics.
Table 3.
Particle size percentages of gangue after ball milling.
Formula (1) was used to calculate the partition function of gangue PSD characteristics such as Table 3. As shown in Figure 3, gangue particle sizes were partitioned when the ball grinding time was 10–60 min and the ball-to-gangue ratio was 3–15. In the multifractal system, whether ∑μi(q,ε), lgμi(q,ε) and lg(ε) are linear is a key index to judge whether the research object has multifractal characteristics in the study scale [33]. Figure 3 elucidates that the variation of the relation curve of ∑μi(q,ε)lgμi(q,ε)~lg(ε) with q can be fitted by a cluster of oblique lines. The linear relationship is significant (R2 > 0.90) and exhibits good scale invariance over the whole scale, making it possible to conduct multifractal analysis of PSD under different ball milling conditions.
3.2. Multifractal Generalized Dimension Spectrum of Gangue PSD during Ball Milling
According to the generalized dimension spectrum algorithm, with a step size of 1, the generalized dimension spectrum curve D(q)~q in the range of −10 ≤ q ≤ 10 is calculated and depicted in Figure 4. Generally, in the range of −10 ≤ q ≤ 10, the generalized dimension D(q) presents an inverse “S”-shaped decreasing change with the increase in q, and gradually decreases with the increase in q. This shows that the grain size distribution of gangue in the study area has obvious multifractal characteristics, and further validates the ability of the multifractal method to analyze PSD structure of gangue when ball milling occurs.
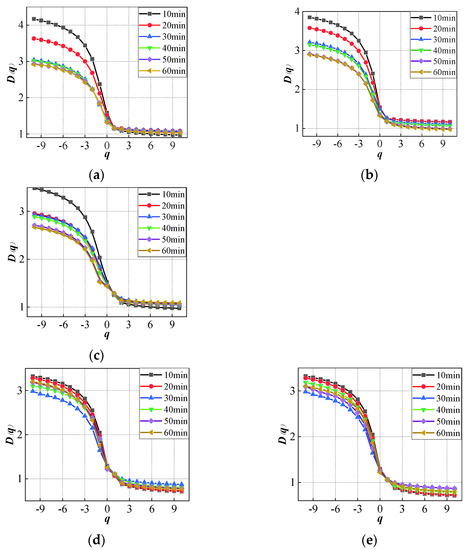
Figure 4.
Generalized dimension spectrum curve of gangue under different ball-to-gangue ratios and grinding times. (a) The ball-to-gangue ratio is 3. (b) The ball-to-gangue ratio is 6. (c) The ball-to-gangue ratio is 9. (d) The ball-to-gangue ratio is 12. (e) The ball-to-gangue ratio is 15.
In the significance represented by the parameters of multifractals, the greater the distribution of D(q), the greater the imbalance of algebraic table distribution [28]. From the overall analysis, the non-uniformity of particle size and fractal structure of the gangue varies greatly under different ball-to-gangue ratios and grinding times. According to Figure 4a–c, when the ball-to-gangue ratio is 3~9, D(q) decreases with the increase in the ball-to-gangue ratio, indicating that a larger ball-to-gangue ratio leads to smaller non-uniformity of gangue size structure. The range of D(q) decreases with the increase in time, implying that the non-uniformity of the particle size fractal structure gradually decreases, and the particle size structure of gangue gradually tends to be concentrated. According to Table 3, the final particle size is concentrated in the range of 2~250 μm.
It can be seen from Figure 4d,e that the fractal characteristics of particle size are very similar when the ball-to-gangue ratio is 12~15. This is because the increase in the ball-to-gangue ratio to a particular value influencing the uniformity of the particle size structure of the gangue no longer exists. By comparing the range of D(q) under different grinding times, it is found that the grain size of the gangue will decrease and concentrate in a fixed range in a short time due to the increase in the ball-to-gangue ratio. The variation of D(q)~q curve at each time point is slight. In addition, when the ball-to-gangue ratio is 12~15, the gangue grain size structure range is the smallest at 30 min, and when the time is longer than 30 min, the size structure of the gangue increases again within a small range with the increase in time. This is because the decrease in particle size causes agglomeration between particles during ball milling, which leads to an increase in particle size and a change in particle size structure [34,35].
The capacity dimension D(0), the information entropy dimension D(1), and the ratio of the information entropy dimension to the capacity dimension D(1)/D(0) are essential parameters reflecting the multifractal characteristics of granular material PSD [36]. Figure 5 describes the generalized dimension spectrum parameters D(0) and D(1) of gangue under different ball milling conditions, When the ball-to-gangue ratio is 3~9, D(0) ranges from 1.3 to 1.6 and gradually decreases within 60 min, and D(1) ranges from 1.12 to 1.17 and gradually increases within 60 min. This is because the particles are refined in the process of ball milling. While the large particles are reduced, the number of small particles increases, the overall particle distribution range is narrowed, and the degree of variation of particle size distribution is increased.
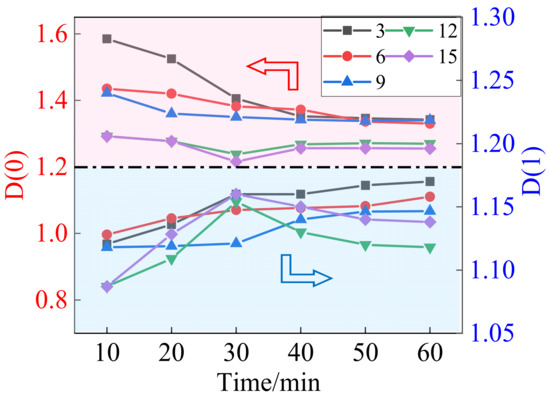
Figure 5.
Generalized dimension spectrum curve of the gangue under different ball-to-gangue ratios and grinding times.
The range of D(0) is only 1.25 to 1.29 for ball-to-gangue ratios greater than 9, when D(0) decreases from 0 to 30 min and increases from 30 to 60 min, while D(1) increased from 0 to 30 min and decreased from 30 to 60 min, within a range of 1.08 to 1.16. This indicates that the size range and unevenness of gangue change little when the ball-to-gangue ratio is greater than 9, showing that the size structure of gangue only changes slightly when the ball-to-gangue ratio and grinding time exceed a certain value.
As a result of analyzing the above, it can be seen that when the ball-to-gangue ratio is constant, the longer the grinding time is, the smaller the D(0) and the larger the D(1) are. This is because increasing the grinding time means that the collision frequency of the gangue during the grinding process is increased. Therefore, with the increase in time, the particle size range is gradually reduced, and the degree of unevenness is steadily increased. Increasing the number of grinding media to increase the ball-to-material ratio means that the collision probability between the gangue and the grinding media in unit time is increased. Therefore, the gangue particle size can reach a smaller level in a short time under the condition that the ball-to-gangue ratio is greater than 9, and the change in the gangue particle size is smaller when the grinding time is increased.
Table 4 depicts the variation of the generalized dimension spectral parameter D(1)/D(0) of gangue during ball milling. D(1)/D(0) reflects the density of the PSD structure [37]. According to the data in the table, the variation trend of D(1)/D(0) is similar to the variation trend of the D(1) value. It is worth noting that when the ball-to-gangue ratio is 12–15, the D(1)/D(0) value of gangue grain size structure increases within 0~30 min and decreases within 30~60 min, indicating that the concentration degree of the gangue grain size structure increases firstly and then decreases. This is because as the size of gangue decreases continuously, the size effect becomes more and more obvious [38], which makes it difficult to further refine the crushing size of gangue after 30 min. The overall PSD structure of the particle is relatively concentrated, showing that the D(1)/D(0) value fluctuates within the range of 0.88~0.92.
Table 4.
Generalized dimension spectrum parameters D(1)/D(0) of gangue in ball milling process.
3.3. Multifractal Singular Spectrum of Gangue PSD during Ball Milling
D(q) can only characterize the multifractal characteristics of the gangue particle size distribution as a whole. In order to further reveal the waste rock particle size distribution, in-depth analysis of the local change features was carried out using Formulas (4) and (5). As shown in Figure 6, the singular index and characteristics of waste rock granularity distribution were determined by calculating the distribution function at specific f(α(q))~α(q) results, while the multifractal singularity spectrum parameters during ball milling under the conditions of Δα and Δf are shown in Figure 7.
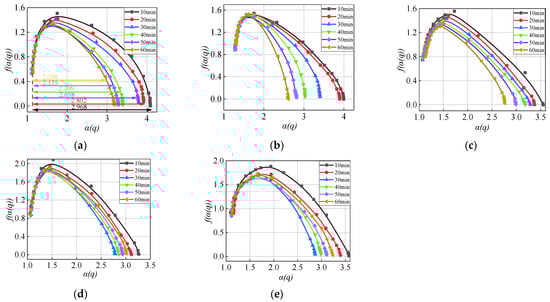
Figure 6.
Multifractal singular spectrum curves of gangue dispersion under different ball-to-gangue ratios and grinding times. (a) The ball-to-gangue ratio is 3. (b) The ball-to-gangue ratio is 6. (c) The ball-to-gangue ratio is 9. (d) The ball-to-gangue ratio is 12. (e) The ball-to-gangue ratio is 15.
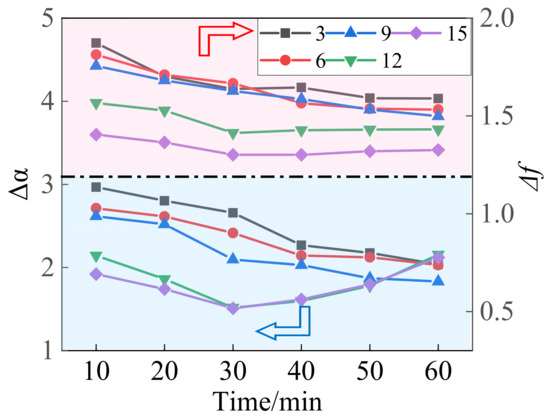
Figure 7.
Parameters of the multifractal singular spectrum of gangue powder during ball milling (Δα = αmax − αmin; Δf = f(αmin) − f(αmax)).
Figure 6 depicts multifractal singular spectrum curves of gangue dispersion under different ball-to-gangue ratios and grinding times. The singular spectrum curve shape reflects the shape of the multifractal spectrum characteristics and local variation of the structure characteristics of the PSD when Δf > 0, with a left-hook shape, reflecting symmetrically dispersed particles, and a large size dominates, with a greater variation in large size than in small size [39]. The f(α(q))~α(q) curves under each working condition in the figure are all asymmetrical “left hook” curves, indicating that the spatial variability of gangue particle size during the ball milling process is dominated by the variation of large particles. In addition, the size of Δf reflects the variability of the research object. The distribution of the singular spectrum parameter Δf in the ball milling process of the finishing gangue is shown in Figure 7. When the ball-to-gangue ratio is 3~9, Δf shows a gradually decreasing trend, with a variation range of 1.49~1.87. When the ball-to-gangue ratio is 12~15, Δf decreases firstly and then increases, and reaches a maximum value at 30 min, demonstrating that the variation degree of gangue’s large particle size gradually decreases and then increases. The variability of gangue’s particle size structure is the strongest at about 30 min. Compared with the working conditions of 3~9, the gangue particle size structure with a high gangue ratio has a faster variation degree and a greater degree of variation under the same grinding time.
It can be seen from Figure 7 that when the ball-to-gangue ratio is 3~9, Δα gradually decreases with the further increase in the grinding time. It is worth noting that the decrease range is small within 0~30 min and increases within 30~60 min, signifying that when the ball-to-gangue ratio is relatively small, the variation of the heterogeneity degree of the particle size of gangue increases over time. This is because the collision probability between gangue and grinding medium is small when the ball-to-gangue ratio is small in the grinding process. At the same time, due to the short grinding time, the grain size of gangue is still generally large in the grinding process, resulting in small changes in the heterogeneity of gangue size distribution within the range of a 3~9 ball-to-gangue ratio. With the continuous increase in grinding time, the collision frequency between the gangue and grinding medium will increase, increasing the spatial heterogeneity of the change in gangue particle size. When the ball-to-gangue ratio is 12 and 15, the width of the multifractal spectrum first decreases and then increases with the increase in grinding time. From 0 to 30 min, the spatial heterogeneity of particle size structure is debilitated. The reason for this phenomenon may be that the particle size structure of gangue continues to decrease after it reaches a low level in a short timeframe (30~60 min). As a result of agglomeration among some small particles, the particle size increases due to extrusion, or some small particles become embedded in large particles’ voids or attached to their surfaces (Figure 8). The spatial heterogeneity of the particle size structure is enhanced. There are always tiny strips and flakes attached to the surface of large particles, and the pores are also filled by small particles. Therefore, when the grinding medium acts on large particles, part of the energy is used for crushing the small particles, which leads to the re-crushing of the small particles, which intensifies the heterogeneity of the overall particle size distribution of the gangue.
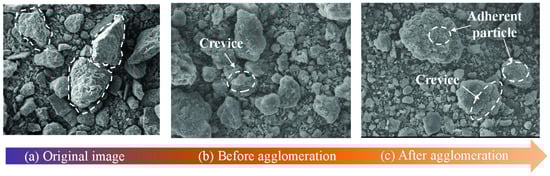
Figure 8.
Electron microscope images of gangue at different ball milling stages.
3.4. Correlation Analysis of Particle Morphology and Multifractal Parameters during Ball Milling
The gangue crushing is mainly achieved by means of the interaction between the gangue and the grinding medium in the ball milling process. This study found that the gangue particles are mostly broken along the defects of their own structure during the ball milling. The crushing methods are mainly divided into three types: impact crushing, extrusion and surface grinding [40], as shown in Figure 9. In order to further analyze the non-uniformity of PSD caused by the particle breakage of gangue, the particle shape coefficient was selected to quantitatively analyze the structure and morphology of the bulk material. The particle shape coefficient is the ratio of the equal-area circumference of the irregular scattered particles to the actual circumference of the particle. The larger the particle shape coefficient, the closer the particle shape is to a circle [41,42].
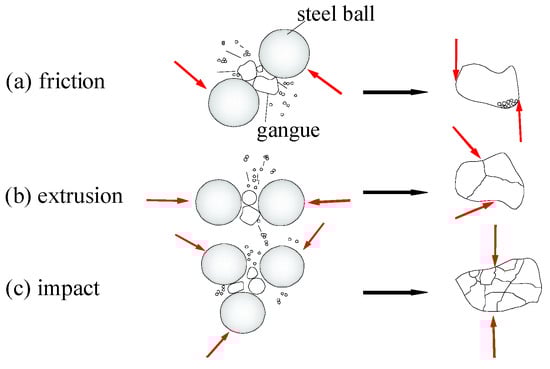
Figure 9.
Broken forms of gangue during ball milling [40].
The shape coefficients of gangue particles at different time stages under any ball-to-gangue ratio are shown in Figure 10. It can be seen from the figure that the initial average shape coefficient of the gangue is relatively small, and the particles are independent of each other without intercalation. As the ball grinding time increases, the shape coefficient decreases. This is because gangue has many weak structures, and the impact and extrusion will break the gangue from its fragile structure, thus forming small particles with irregular shapes. This process not only reduces the grain size of the gangue but also increases the irregularity of the gangue, so the shape coefficient gradually decreases. With the increase in time, the grinding effect is realized through point contact between the grinding medium and the gangue. In this process, the irregular particles generated by the new fracture rotate, the prominent edges and corners are gradually worn down, and the roundness of the particles increases continuously, which further increases the shape coefficient. The final gangue structure is ellipsoid, and the particle surface is rough due to the development of a large number of tiny particles inlaid and micropores. In the process of ball milling, the shape coefficient of gangue is consistent with the change process of multiple analysis parameters such as D(0) and D(1).
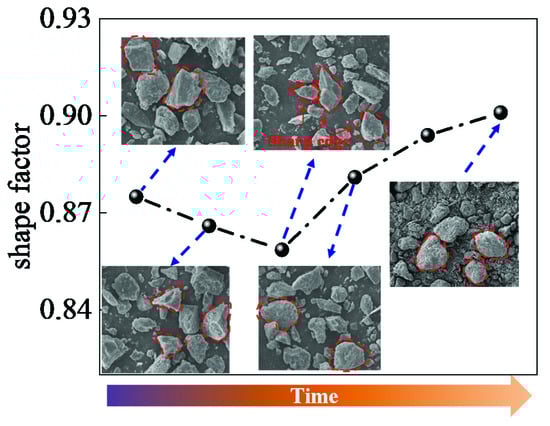
Figure 10.
Shape factor of gangue particles.
4. Conclusions
(1) The PSD of the gangue in the ball milling process has obvious multifractal characteristics. The capacity dimension D(0), the information entropy dimension D(1), and the singular spectrum parameters Δα and Δf can reflect the heterogeneity and local heterogeneity of gangue PSD from different angles.
(2) The ball-to-gangue ratio and the grinding time together affect the change in the fractal characteristics of the gangue. When the ball-to-gangue ratio is 3~9, with the increase in the ball-to-gangue ratio, D(q) decreases continuously, which means the the non-uniformity of the gangue particle size structure is smaller. From the changes in parameters such as D(0), D(1) and D(1)/D(0), it can be seen that with the increase in grinding time, the particle size range of gangue gradually decreases, and the degree of inhomogeneity and concentration gradually increases. When the particles are small to a certain extent, due to the agglomeration phenomenon, the size range of the particles increases with increasing grinding time.
(3) Multifractal analysis can quantify the influence of the pellet-to-material ratio and grinding time on gangue PSD local information. The variability of the particle size structure of the gangue is dominated by the variation in large particle sizes. In addition, the changes in the multifractal parameters Δα and Δf in the ball milling process are similar. The microscopic mechanism of the changes in Δα and Δf is analyzed based on the changes in gangue morphology in the electron microscope images during the milling process.
(4) The gangue particles are impacted, extruded and rubbed, resulting in particle shape change during ball milling. The shape coefficient of the particles in the process of ball milling is closely related to the evolution of multiple analysis parameters of PSD. Therefore, the multifractal parameters of PSD of gangue can indirectly reflect the particle size and morphology parameters.
(5) Taking into account the variations of multifractal parameters and the internal mechanism of ball milling, when selecting the main parameters of the gangue ball milling process, selecting parameters with a ball-to-gangue ratio less than or equal to 9 and a grinding time less than 60 min is suggested to reduce the agglomeration phenomenon and reduce grinding energy consumption. For different types of gangue, the optimal ball-to-gangue ratio and grinding time need to be further studied, which requires consideration of the matching relationship between rock mechanics parameters and ball milling parameters in future research.
Author Contributions
L.Z.: Conceptualization, Methodology. W.G.: Writing-Original draft preparation, Sample testing, Data analysis. F.Q.: Sample collection and data analysis. P.Z.: Data curation. All authors have read and agreed to the published version of the manuscript.
Funding
This research received no external funding.
Institutional Review Board Statement
Not applicable.
Informed Consent Statement
Not applicable.
Conflicts of Interest
The authors declare no conflict of interest.
References
- Chen, Y.; Jiang, Y.; Wang, H. Assessment of ambient air quality in coal mine waste areas—A case study in Fuxin, China. N. Z. J. Agric. Res. 2007, 50, 1187–1194. [Google Scholar] [CrossRef]
- Li, J.; Wang, J. Comprehensive utilization and environmental risks of coal gangue: A review. J. Clean. Prod. 2019, 239, 117946. [Google Scholar] [CrossRef]
- Zhou, C.; Liu, G.; Wu, S.; Lam, P.K.S. The environmental characteristics of usage of coal gangue in bricking-making: A case study at Huainan, China. Chemosphere 2014, 95, 274–280. [Google Scholar] [CrossRef] [PubMed]
- Zhang, Y.; Ling, T.C. Reactivity activation of waste coal gangue and its impact on the properties of cement-based materials–a review. Constr. Build. Mater. 2020, 234, 117424. [Google Scholar] [CrossRef]
- Ashfaq, M.; Heeralal, M.; Moghal, A.A.B. Characterization studies on coal gangue for sustainable geotechnics. Innov. Infrastruct. Solut. 2020, 5, 1–12. [Google Scholar] [CrossRef]
- Li, Z.; Gao, Y.; Zhang, J.; Zhang, C.; Chen, J.; Liu, C. Effect of particle size and thermal activation on the coal gangue based geopolymer. Mater. Chem. Phys. 2021, 267, 124657. [Google Scholar] [CrossRef]
- Guan, X.; Chen, J.; Zhu, M.; Gao, J. Performance of microwave-activated coal gangue powder as auxiliary cementitious material. J. Mater. Res. Technol. 2021, 14, 2799–2811. [Google Scholar] [CrossRef]
- Zhao, H.; Chen, Y.; Duan, X. Study on the factors affecting the deep reduction of coal gangue containing high contents of iron and sulfur. Fuel 2021, 288, 119571. [Google Scholar] [CrossRef]
- Hu, L.; Li, X. Damage and fragmentation of rock under experiencing impact load. J. Cent. South. Univ. Technol. 2006, 13, 432–437. [Google Scholar] [CrossRef]
- Zhou, Z.; Li, X.; Zuo, Y.; Liang, H. Fractal characteristics of rock fragmentation at strain rate of 100–102s−1. J. Cent. South. Univ. Technol. 2006, 13, 290–294. [Google Scholar] [CrossRef]
- Feng, G.; Zhao, J.; Wang, H.; Li, Z.; Fang, Z.; Fan, W.; Yang, P.; Yang, X. Study of the internal re-breaking characteristics of broken limestone during compression. Powder Technol. 2022, 396, 449–455. [Google Scholar] [CrossRef]
- Yang, D.; Li, J.; Du, C.; Zheng, K.; Liu, S. Particle size distribution of coal and gangue after impact-crush separation. J. Cent. South. Univ. 2017, 24, 1252–1262. [Google Scholar] [CrossRef]
- Panagiotopoulos, P.D.; Panagouli, O.K.; Mistakidis, E.S. Fractal geometry and fractal material behaviour in solids and structures. Arch. Appl. Mech. 1992, 63, 1–24. [Google Scholar] [CrossRef]
- Wei, X.; Li, X.G.; Wei, N. Fractal features of soil particle size distribution in layered sediments behind two check dams: Implications for the Loess Plateau, China. Geomorphology 2016, 266, 133–145. [Google Scholar] [CrossRef]
- Fernández, E.; Jelinek, H.F. Use of fractal theory in neuroscience: Methods, advantages, and potential problems. Methods 2001, 24, 309–321. [Google Scholar] [CrossRef]
- Perfect, E.; Kay, B.D. Fractal Theory Applied to Soil Aggregation. Soil Sci. Soc. Am. J. 1991, 55, 1552–1558. [Google Scholar] [CrossRef]
- Tsujii, K. Fractal Materials and Their Functional Properties. Polym. J. 2008, 40, 785–799. [Google Scholar] [CrossRef]
- Lopes, R.; Betrouni, N. Fractal and multifractal analysis: A review. Med. Image Anal. 2009, 13, 634–649. [Google Scholar] [CrossRef]
- Kravchenko, A.N.; Boast, C.W.; Bullock, D.G. Multifractal analysis of soil spatial variability. Agron. J. 1999, 91, 1033–1041. [Google Scholar] [CrossRef]
- Wang, J.; Lu, X.; Feng, Y.; Yang, R. Integrating multifractal theory and geo-statistics method to characterize the spatial variability of particle size distribution of minesoils. Geoderma 2018, 317, 39–46. [Google Scholar] [CrossRef]
- Martín, M.Á.; Montero, E. Laser diffraction and multifractal analysis for the characterization of dry soil volume-size distributions. Soil Tillage Res. 2002, 64, 113–123. [Google Scholar] [CrossRef]
- Biswas, A.; Cresswell, H.P.; Si, B.C. Application of multifractal and joint multifractal analysis in examining soil spatial variation: A review. In Fractal Analysis and Chaos in Geosciences; InTech: Wellington, New Zealand, 2012; pp. 109–138. [Google Scholar] [CrossRef]
- Guo, L.Y.; Ren, Z.Y.; Liu, Y.S. The causes of land landscape changes in semi-arid area of Northwest China: A case study of Yulin city. J. Geogr. Sci. 2006, 114, 192–198. [Google Scholar] [CrossRef]
- Zhai, X.; Cheng, Z.; Ai, K.; Shang, B. Research on Environmental Sustainability of Coal Cities: A Case Study of Yulin, China. Energies 2020, 13, 2470. [Google Scholar] [CrossRef]
- Bian, X.; Wang, G.; Wang, H.; Wang, S.; Lv, W. Effect of lifters and mill speed on particle behaviour, torque, and power consumption of a tumbling ball mill: Experimental study and DEM simulation. Miner. Eng. 2017, 105, 22–35. [Google Scholar] [CrossRef]
- Zhou, W.X.; Wu, T.; Yu, Z.H. Geometrical characteristics of singularity spectra of multifractals Ⅱ. Partition function definition. J. East. China Univ. Sci. Technol. 2000, 26, 390–395. [Google Scholar]
- Yan, H.; Zhang, J.; Wang, J.; Zhou, N.; Zhang, S. Multifractal characteristics of particle size distribution of granular backfilling materials under different loads. Mater. Test. 2018, 60, 202–208. [Google Scholar] [CrossRef]
- Liu, H.; Zhang, J.; Zhou, N.; Guo, Y.; Li, B.; Yan, H.; Deng, X. Investigation of spatial stratified heterogeneity of cemented paste backfill characteristics in construction demolition waste recycled aggregates. J. Clean. Prod. 2020, 249, 119332. [Google Scholar] [CrossRef]
- Cowie, P.A.; Sornette, D.; Vanneste, C. Multifractal scaling properties of a growing fault population. Geophys. J. Int. 1995, 122, 457–469. [Google Scholar] [CrossRef]
- Caniego, F.J.; Espejo, R.; Martın, M.A.; Jose, F.S. Multifractal scaling of soil spatial variability. Ecol. Model. 2005, 182, 291–303. [Google Scholar] [CrossRef]
- Zhao, Z.Y.; Zhu, J.; Xia, B. Multifractal fluctuation features of thermal power coal price in China. Energy 2016, 117, 10–18. [Google Scholar] [CrossRef]
- Tang, J.; Zeng, F.; Fan, Q. Multifractal spectrum identification of partial discharge in GIS based on fluorescence optical fiber detection. High. Volt. Eng. 2014, 40, 465–473. [Google Scholar]
- Peitgen, H.O.; Jurgens, H.; Saupe, D. Chaos and Fractals, 2nd ed.; Springer: New York, NY, USA, 1992. [Google Scholar]
- Guzzo, P.L.; Tino, A.A.A.; Santos, J.B. The onset of particle agglomeration during the dry ultrafine grinding of limestone in a planetary ball mill. Powder Technol. 2015, 284, 122–129. [Google Scholar] [CrossRef]
- Fadda, S.; Cincotti, A.; Concas, A.; Pisu, M.; Cao, G. Modelling breakage and reagglomeration during fine dry grinding in ball milling devices. Powder Technol. 2009, 194, 207–216. [Google Scholar] [CrossRef]
- Liu, H.; Zhang, J.; Li, B.; Zhou, N.; Xiao, X.; Li, M.; Zhu, C. Environmental behavior of construction and demolition waste as recycled aggregates for backfilling in mines: Leaching toxicity and surface subsidence studies. J. Hazard. Mater. 2020, 389, 121870. [Google Scholar] [CrossRef]
- Sirveiya, A.K.; Thote, N.R. Measurement and Analysis of Blast Fragmentation, 1st ed.; Taylor & Francis Group: London, UK, 2013; pp. 139–144. [Google Scholar]
- Posadas, A.N.D.; Giménez, D.; Bittelli, M.; Vaz, C.M.P.; Flury, M. Multifractal characterization of soil particle-size distributions. Soil Sci. Soc. Am. J. 2001, 65, 1361–1367. [Google Scholar] [CrossRef]
- Zuo, R.G.; Wang, J. Fractal/multifractal modeling of geochemical data: A review. J. Geochem. Explor. 2015, 164, 33–41. [Google Scholar] [CrossRef]
- Gao, M.; Forssberg, E. Prediction of product size distributions for a stirred ball mill. Powder Technol. 1995, 84, 101–106. [Google Scholar] [CrossRef]
- Zhou, Z.; Zhang, S.; Gao, Z.; Cai, X.; Li, H. Multifractal characterization of gangue particle size distribution structure during ball milling process. Powder Technol. 2022, 412, 117970. [Google Scholar] [CrossRef]
- Olson, E. Particle shape factors and their use in image analysis part 1: Theory. J. GXP Compliance 2011, 15, 85. [Google Scholar]


Disclaimer/Publisher’s Note: The statements, opinions and data contained in all publications are solely those of the individual author(s) and contributor(s) and not of MDPI and/or the editor(s). MDPI and/or the editor(s) disclaim responsibility for any injury to people or property resulting from any ideas, methods, instructions or products referred to in the content. |
© 2023 by the authors. Licensee MDPI, Basel, Switzerland. This article is an open access article distributed under the terms and conditions of the Creative Commons Attribution (CC BY) license (https://creativecommons.org/licenses/by/4.0/).