1. Introduction
In the coming years, the growth of internal combustion cars in the region and the world will affect the demand for fossil fuels as an energy source, in addition to the increase in emissions of Greenhouse Gases (GHG) and other pollutants in the atmosphere. By the year 2050, according to the International Energy Agency in [
1], the growth of the automotive fleet in the Latin American region could triple, reaching more than 200 million units, which would affect the demand for fossil fuels and the increase in GHG emissions into the atmosphere, which could increase by up to 70%. That is why the governments and private companies of the region are obliged to change the paradigm, propose strategies for the sustainability of transport, and improve the quality of life of people. In [
1], one of the strategies gaining strength is the electrification of transportation as a mechanism for energy efficiency and mitigation of environmental pollution. Thus, the world stock of electric vehicles (EV) in 2018 displaced the consumption of approximately 21 million tons of oil equivalent (Mtoe) (0.43 MBoe) of petroleum products.
The transition toward electric mobility is growing exponentially; according to the IEA in [
2], it estimates that the world fleet of EVs by 2030 will be 125 million. Despite this technological advance, adoption levels are relatively low in most developing countries compared to industrialised countries that lead the technology market. However, studies [
3] show this growth, mainly in public transport systems.
According to [
4], Ecuador’s primary energy matrix is mainly of non-renewable energy sources; fossil fuels represent 87.5% and natural gas 4.7% of total energy production, compared to 7.8% of renewable energies. The positive is that the scarce participation of renewable energy each year gains ground and displaces conventional energy sources, whereas the public transport system represents the primary energy consumption sector, demanding 48.8% of the total energy available, it is equivalent to an average consumption of 46 million barrels of oil equivalent per year (MMBOED) [
4].
Ecuador seeks to change the paradigm in planning. It proposes strategies for adopting a sustainable, efficient, and clean transport system through the renewal of the electric traction public transport fleet for more efficient and less polluting systems, applicable emission standards, and stricter energy efficiency policies. Currently, it has policies and laws that encourage the acquisition of goods and services in favour of the decarbonisation of transport, such as the Organic Law for Productive Development [
5], which exempts electric vehicles from use of income tax (IR) particularly, public transport, cargo, and value-added tax (VAT).
The electric charging for all 100% electric vehicles is also exempt from VAT. The special condition tax (ICE) was eliminated for electric vehicles with a price more excellent than USD 40,000.00 [
6]. At the same time, the Organic Law on Energy Efficiency [
7] proposes the mandatory use of electric traction vehicles for public service from 2025.
Despite the available tax incentives, the city of Cuenca (Ecuador) does not show significant progress in electric mobility due to factors such as the cost of the units, the limited supply of manufacturers in the local automotive market, ignorance and fear of people to use EVs, and lack of adequate charging infrastructure. For this reason, in the city of Cuenca, studies have been carried out for the integration of the Battery Electric Bus (BEB) and test EVs in the public transport system and the installation of charging stations (CSs) in different points of the city all to promote the acquisition of this type of vehicle.However, the lack of public charging stations in the city constitutes the main problem for the massification of this technology; at the moment and in coordination with the academy, there is a public slow charging station in alternating current (AC) with a capacity of 7.2 kW (charging standards CCS combos 1 and 2, CHAdeMO and Mennekes) located in the city centre and the first 50 kW direct current (DC) fast charging multi-connector station located in the Microgrid Laboratory of the University of Cuenca [
8].
Cuenca city has one of the most emblematic projects in Ecuador, such as the Cuenca Tram System, the most important public transport system designed to solve mobility and environmental pollution problems. The system operates commercially with 11 units as cited in [
9] that circulate for 16 h/day between 06:00 and 22:00 h uninterruptedly with a frequency of arrival of the units at the stops of 10 min. In this period, the approximate energy consumption of 11 MWh/day is recorded, considering the traction of rolling stock, installations at stops, auxiliary services, and traction in garages and workshops. The maximum demand of the tram system can reach 1.60 MW at the time of significant commercial demand, which occurs around 05:00 pm. Considering the penetration levels of EVs and BEBs that are intended to be achieved in the future, it is essential to think that the reduction in this load could cause impacts on the electricity networks, causing the unavailability of the systems and a decrease in the quality of energy. For this reason, this research develops planning studies of electrical networks considering the new energy integration challenges demanded by electric mobility.
The contribution of the research is:
To methodologically evaluate the integration of EV charging stations in an electric tram system to optimise its electric power distribution infrastructure through power flow simulations.
Using the open source OpenDSS tool to determine the technical impacts on voltage magnitudes, peak power, and energy losses in medium voltage electrical networks.
Proportionately, a novel approach could be implemented and replicated in intermediate cities with massive public transportation systems.
The use of electric mobility systems as an efficient, profitable, and sustainable alternative to the problems of current public transport.
This paper aims to present a comprehensive review of the following:
Section 2 describes the impacts of the charging of EVs and BEBs on the electrical distribution network.
Section 3 describes the methodology used in the case study.
Section 4 determines the technical impacts on the Tramway Electric Network. In
Section 5, the results obtained from the methodological implementation are reported through simulations carried out for the different operation and penetration scenarios of EVs and BEBs. In this section also, the results obtained are reviewed and discussed. Furthermore,
Section 6 presents the conclusions of the study.
2. State of the Art: Impacts of the Penetration of the Charging of EVs and BEB in Electrical Distribution Network
Based on the review of the state of the art regarding the study of the behaviour of electrical distribution networks (DN) against the penetration of EVs and BEBs, the authors agree that for the transition to be carried out in the best technical conditions, significant integration challenges must be considered. In [
10], three types of analysis are proposed: a static analysis, a probabilistic analysis, and a time series analysis [
11]. In a static analysis, it is generally considered that the loading process takes place in the same time interval [
12]. Time-series studies use EV charging profiles as inputs for a load flow analysis [
12], which is essential to assess the technical impact on DN by incorporating charging stations. Other studies propose that probabilistic models represent the load profile more realistically than the deterministic load profiles used in a static analysis. Due to the stochastic nature of the load, in [
11,
13], the probabilistic load flow solution is proposed by employing the Monte Carlo technique, which solves the problem for various energy production and consumption scenarios. The scenarios are randomly generated from a probability density function. Although the Monte Carlo method provides a high degree of precision in the results of this type of study, on the other hand, it requires a large number of iterations to converge, which makes the calculation time increase significantly [
14]. For the types of analysis proposed, a time series analysis will be used to simulate the charging of different EV and BEB penetration scenarios in this project.
Studies such as [
15,
16,
17,
18], show that the incorporation of CS can cause negative impacts on the DN, reducing the quality of the energy supplied and the availability of the network. Therefore, in [
15], a time series in power flow analysis is used to obtain short-term and long-term impacts on DN. This study presents a prototype developed in the Open Distribution System Simulator (OpenDSS) and the MATLAB software tool. The effects of EV charge are visualised, unlike other power flow solvers available on the market, which are usually used in analysing transmission networks.
In [
16], a methodology based on probabilistic methods is proposed to analyse the technical impact of different types of electric vehicle charging, considering different levels of integration in the system and the charging’s characterisation due to its stochastic nature influenced by the patterns of mobility and user habits. The case study simulates in OpenDSS and determines through the power flow the behaviour of the DN due to the integration of the EVs; it also recommends the use of OpenDSS for its speed, reliability, and efficiency when solving power flows. The main problems identified in [
15] and increased power losses.
In [
17], the study of the impact of recharging a BEB in a test system (IEEE 33 Bus Test System) is considered through power flow simulations calculated using the Newton–Raphson method. It is evident that the addition of this load demands more power than an EV, causing severe problems in stability, reliability, and losses in the DN; therefore, it suggests that the charging of a BEB be carried out from a medium voltage (MV) level. For example, in [
18], the operation of the Chiang Mai substation is modelled and simulated in the DIGSILENT Power Factory software, including the load profile of each primary feeder, plus the load profile of a fleet of electric vehicles, in particular, corresponding to a percentage (10% to 50%) of the maximum load of the feeder. These simulations show that EV charging can cause the power transformer’s overload in the substation due to increased peak load, variations in the MV profiles, and harmonic distortion. One of the most significant electric vehicle penetration studies, the MEA (My Electric Avenue) project [
19], coincides with the above problems. Considering the advantages exposed in [
15,
16] over the methodology used to determine the impacts on the DN, in this project, OpenDSS will be used to model and simulate the DN for different EV and BEB penetration scenarios.
In [
20,
21,
22,
23,
24], the effects of transformer loading and output voltage levels of simulated feeders in a 24-h time series have been investigated. The results show that uncontrolled charging causes network congestion, reinforcing the available electrical infrastructure. The study presented in [
25] agrees with this theory, concluding that electric mobility requires the construction of electrical infrastructure and the support of DN to guarantee its reliability and stability. Finally, in [
26], a study argues that adopting EVs causes substantial problems in low voltage (LV) networks, mainly fluctuations in voltage levels and network congestion, to mitigate these impacts. Therefore, a dynamically intelligent charging strategy based on a constant charging impedance flow model is proposed through simulations with EV charging projections, residential electricity demand, and photovoltaic generation. The charging power to be optimised depends on the capacity network available.
At the local level, studies such as [
27] present the impacts produced in the DN of Cuenca’s historic centre by incorporating EV charging stations. The study [
27] shows the harmonic voltage distortion, which is less than the worst-case 1.36%; at the same time, the capacity of the networks requires resizing. In [
28,
29], it is determined that the generation affects the quality of the energy supplied by the DN of the city since it is determined that the level of voltage harmonics is in the order of 15.74%, over the limits established in the IEEE 519-Norm 2014, whereas the harmonics produced in the current barely reach 1.54%. Currently, no studies show the impacts on the DN due to the operation of the Tramway. However, in Ecuador, studies such as [
30,
31] analyse the impacts on the electric distribution networks due to the incorporation of the “Metro de Quito”, concluding that the main results are evident in the levels of tension, harmonic distortion, and overload of electricity the DN.
In [
32], integration scenarios of the electrical infrastructure available for the supply of fast charging stations are proposed, taking advantage of the low-voltage transformers of the distribution networks. Additionally, studies such as [
33] show that intermediate cities can probably integrate several BEB lines in their MV network, in a night load or lower demand scenario, without causing significant effects on the DN. In contrast, to [
32,
33], this study uses the existing infrastructure of the tram to increase its utilisation factor, incorporating recharging stations in the MV network that feeds the tramway. This proposal reduces one of the main problems of the transition to electric mobility in intermediate cities with little or no electric charging infrastructure for electric vehicles and buses.
Table 1 presents a summary of the state-of-the-art review where several studies are made to identify the significant technical impacts on DN due to the integration of charging stations and methodology.
3. Methodology
3.1. Description
The OpenDSS software architecture determines the impacts on the tram distribution networks due to the inclusion of charging stations at different system operation points. Three operation scenarios are taken; the first is with slow night charging 42 electric buses at a power of 80 kW; during this period, the tram is not in operation. The second scenario is fast charging between 80 and 500 kW with 192 vehicles and 12 electric buses during the commercial operation of the tram, and the third scenario combines slow and fast charging features. The detail of the methodology is shown in
Figure 1. Once the solver has been determined, as a first action, the simulation scenarios are established considering the commercial exploitation of the Tramway and the penetration percentage of EVs and BEBs according to the city’s specificities of the public transport system, according to operating scenarios and available information. In a second action, the load profiles of the tram’s commercial operation and the EV and BEB charging process are modelled to be included as input in the OpenDSS simulation tool. As a third action, the electrical circuit of the tram is implemented in the simulation software to establish, in a fourth action, the geographical location of the charging stations and the connection to the MV network of the tram. Finally, the results of the simulations are presented graphically to analyse the performance of the monitored indices. In addition, as part of the analysis, a mathematical model is proposed to calculate the energy intensity of a BEB from actual data obtained in the tests of the commercial operation in the city to determine the need for partial recharging during the day due to its function.
One of the limitations of the proposed methodology is the amount of EVs and BEBs that can charge their batteries in the different simulation scenarios. This is due to the maximum power we can obtain from the electrical network of the tram. In a future investigation, the adequacy of the electric tram network and the increase in demand can be considered so that more units charging their batteries in the different proposed scenarios can be connected.
3.2. Simulation Software Architecture
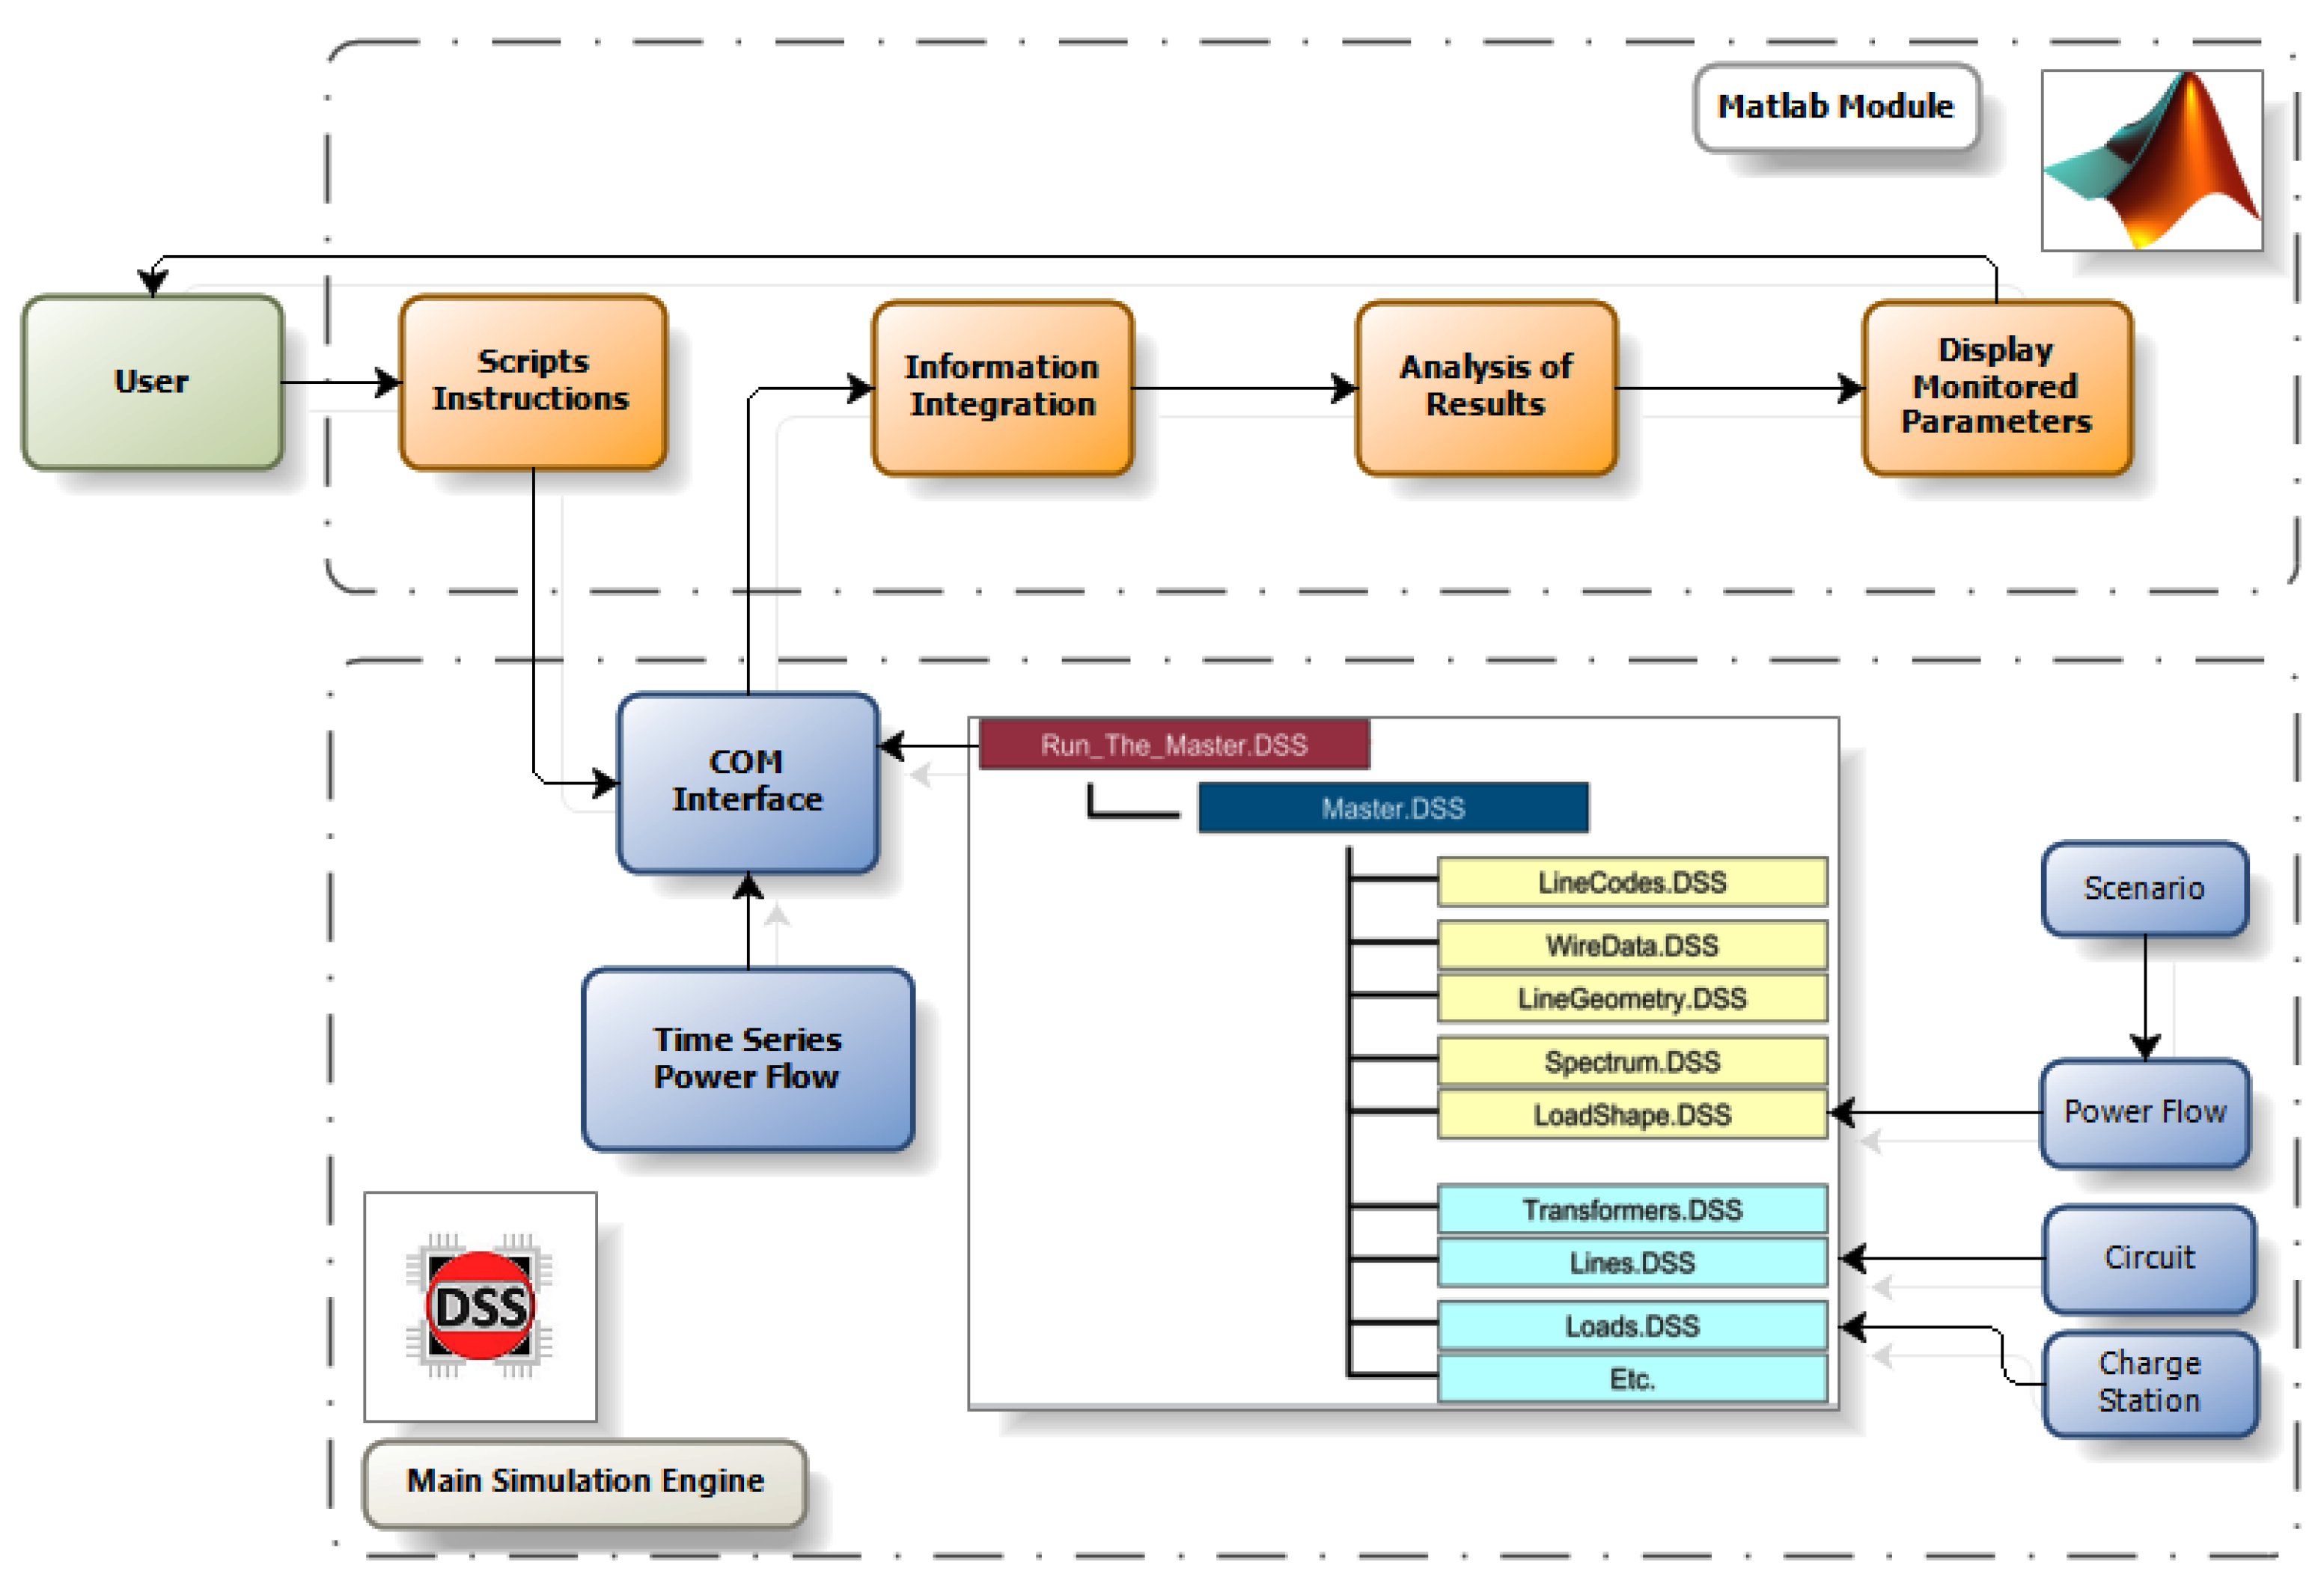
The architecture of the proposed simulation model is observed in
Figure 2. A daily mode power flow from the OpenDSS software is used as a solver for a radial distribution network for the time series analysis. The information exchange between OpenDSS and MATLAB is conducted through the (COM) interface; the MATLAB modules generate random numbers, execution control, data collection, and presentation of results.
In contrast, the OpenDSS modules assemble the positive sequence circuit and its solution through a flow of time series loading. The positive sequence circuit model and the different libraries contain the technical characteristics. The solution mode is considered daily (24 h) with a resolution of 15 min. The software solves the power flow based on Gauss’s iterative algorithm from the distribution network model. It builds the primitive admittance matrix of each electrical element through which electric current flows in the circuit to make the admittance model of circuit system Y. The cycle of iterations begins with the definition of an initial vector of voltages and the calculation of the currents injected by all the power conversion elements; these are initially modelled as linear to execute a direct solution of the expression I = Y × V and, thus, determine the current vector I. The vector I, a function of the voltage, and the matrix Y form the nonlinear equations of form I(V) = Y × V that are solved simultaneously.
The solution to the power flow consists of iteratively determining the voltage matrix V through the computation of the set of nonlinear equations until the difference results from comparing the values in the present iteration with the previous one and converges to a value of 0.0001 pu established as a convergence criterion. To iteratively solve the matrix containing the set of nonlinear equations, OpenDSS through the “KLUSolve” solver for electrical systems, which consists of a group of routines to solve matrices of this type.
3.3. Analysis of Mobility in Cuenca City
Electric mobility is closely related to the supply of available means of transport and people’s needs. In Cuenca, the primary means of transport is the light vehicle, followed by urban and rural public transport buses, cargo trucks, and motorcycles [
34]. According to the perception survey published in [
34], the bus is the one with the highest rate of motorisation (30%) and, therefore, the one with the most significant influence and acceptance among users from the economic and social points of view, closely followed by the private car, and a little more distant the taxi, the bicycle, and finally the motorcycle. Cuenca’s public transport system comprises 475 buses and 3553 light vehicles used as taxis. The bus fleet covers 29 routes, where each unit travels an average of 216 km per day, considering an average way of approximately 32 km for each line [
34]. Public transport by taxi covers an entire daily route of roughly 360 km, of which 242 km correspond to ways without passengers and 118 km are used routes with approximate passengers [
35]. With these results,
Table 2 specifies the average daily performance of buses and taxis for their commercial operation in Cuenca. These data show that the energy required by a standard bus is approximately 1034.00 kWh/day, and a taxi requires 478.42 kWh/day approximately. Daily, the public transport system requires 2.19 GWh/day, equivalent to 800 GWh/year (471 kBoe) from fossil fuels, equivalent to 11.78% of the total consumption in the city’s transport sector [
4]. GHG emissions from public transport in the city are around 200 t of CO
2 e/year, equivalent to 30% of the total generated by the transport sector. Therefore, the local government seeks to promote energy efficiency in this sector by incorporating it as a public policy with an energy, economic, and environmental focus. These proposals support the optimisation of resources that contribute to the decarbonisation of the transport sector and the replacement of fossil-based technologies and techniques.
3.4. Simulation Scenarios
The simulation scenarios are proposed according to the operating conditions of the city’s public transport system, including the tram, and the technical characteristics of the electric traction units considered taxis and buses. Although tests have been carried out in the city to integrate BEBs and EsV into the public transport system, there is no conclusive information on the charging habits of this type of unit in an accurate commercial operation that allows modelling and predicting their behaviour with certainty. However, from the available information, a static analysis is proposed with reloading simulation scenarios for EVs and BEBs. Thus, this study suggests load periods according to
Figure 3. In these scenarios, only fast loading for EVs and BEBs and slow night load for BEB are considered due to the operating conditions and dynamics of the current public transport system in the city. A slow night load scenario will be considered in the hours of minimum demand of the tram system from 23:00 h to 05:00 h the following day exclusive to BEB, and a fast loading scenario in the commercial operation period of the tram between 05:00 h and 23:00 h for the EVs and BEBs they require. Each simulation scenario is considered the worst-case due to the maximum number of units of each type that can charge their batteries based on the nominal charging available in the tram’s electrical system, and the power required by the charging stations will be considered.
3.5. Charging Profiles
According to the proposed operation scenarios, the load profiles obtained from the information available on the EV and BEB test loading processes and the actual commercial operation of the tram system are handled. For the slow night charging process of the BEB, the experimental charging carried out in the laboratory is considered, whose charging profile is that of
Figure 4, where the charging station delivers a maximum power of 80 kW. The charging process begins once the units enter the station after their commercial operation (23:00) and end when they are ready to start their journeys again (05:00).
For the fast charging process during the day, the daily charging profiles of
Figure 5 are considered. These charging profiles have been obtained from real laboratory charging methods for EVs and BEBs. It has been assumed that the process does not last more than 30 min.
Figure 5a shows the charging profile for each EV with a power of 80 kW, considering that in the laboratory, experimentally, this power can be obtained from the charging station. In contrast, in
Figure 5b, the load profile is observed for each BEB, where a load power of 500 kW is considered to maintain a charging period according to the time the units remain parked in the stations. The charging process is concentrated in the period of most significant demand for urban public transport in the city, and the simultaneous charging of units is not considered.
To implement the load profile of the tram system, the typical daily load profile of
Figure 6 is considered, which corresponds to its commercial operation, where the maximum demand is around 1.6 MW between 16:00 h pm and 17:00 h.
3.6. Implementation of the Electric Circuit of the Tram
The implementation of the model of the electrical circuit of the tram is carried out through specific programming scripts in the OpenDSS software.
3.7. Selection of the Location of Charging Stations
In this study, a charging station is where a specific fleet of EVs and BEBs will be supplied. The charging stations to be fed from the MV electrical network of the tram system will be strategically located along the tram route based on the fulfilment of two selection criteria that consider the following variables:
- (a)
The first criterion considers the variable distance between the traction substation of the tram and the place where the operation of the charging station is planned to reduce the voltage drop and power losses in the lines that supply the transformer of the charging station, potential places are in the vicinity of the traction substation of the tram system, such as gas stations, supermarkets, commercial premises, transfer stations, and bus stops.
- (b)
The second criterion considers the physical space available in the potential places determined by the first criterion that allows the installation of a group of charging stations in addition to providing the conditions and facilities necessary to accommodate a specific fleet of EVs and BEBs that will access throughout the day to recharging their batteries, without significant interventions and structural modifications of these places. The places that provide facilities to host a fleet of EVs and BEBs in the city are the public transport transfer stations located in the “Feria Libre” and “Terminal Terrestre” and the premises of “Expo Azuay” near the courtyard of the tram workshop.
3.8. Analysis Indices
Based on the state-of-the-art impacts on the DN due to the incorporation of charging stations in the study, monitoring real-time highlights indices such as voltages in MV bars of the substation of traction of the tram, maximum power, energy consumption, power losses, percentage of the utilisation factor of the electrical installations of the electric tram system, and the power factor. According to [
36], some of the acceptable levels of the indices according to the norm and the characteristics of the network that will be considered referential in the present study are specified in
Table 3.
The data collection of the variables to be measured is implemented in the simulation software, monitors in the power transformer in the substation and each tram transformer of the tram, and an energy meter at the feeder’s head. Monitors record complex variables such as voltage, current, and power of all phases over time. Energy meters record active and reactive energy consumed by peak load, power losses, and the overload of circuit elements. The application proposes the presentation of results graphically through MATLAB’s graphical user interface (GUI) module.
3.9. Mathematical Model to Determine the Energy Intensity of EVs and BEBs
To determine the energy intensity of the BEB of a particular route, the proposed model determines the energy consumption based on the variation in the state of charging (
) of the battery when making a specific route. This model was calibrated with the data obtained from a test BEB under commercial operating conditions in Cuenca. The
depends on the variation of the altitude level of the route (
), the variation of the speed (
) in that section, and a calibration constant (
k) that depends on the scenario in which it is mobilising the unit, according to expression (
1):
The scenarios and values described in
Table 4 are considered to determine the value of
k, which were established in such a way that the value resulting from expression (
1) agrees with a minimum error concerning the actual value of the variation of the SOC of the BEB battery after a particular commercial test run. For an acceleration scenario, a harmful
k is considered due to the increase in energy consumption that decreases the SOC of the battery. In contrast, a positive
k is regarded for a deceleration scenario due to the minimum increase in SOC due to the charging contribution of the brake regenerative of the BEB.
The model proposed to determine the current SoC (
_
cu) of the battery is based on Equation (
2), which considers the SoC at the beginning (
_
ini) and a percentage of the variation of the SoC (
) of the battery that represents the consumption of energy inherent in the operation of the BEB.
The constant 0.01689 has been experimentally determined in the laboratory as an adjustment value that allows the actual state of charging of the battery to be determined about the actual energy consumption of the BEB. To determine the energy the BEB consumes on the journey, Equation (
3) is applied. The equivalent energy demanded is calculated depending on the difference in SoC and the capacity in kWh of the battery (Battery_Cap).
The algorithm that describes the calculation process described to determine the energy consumed by an EV in a particular route is shown in
Figure 7.
5. Analysis of Results and Discussion
The simulation analyses focus on the MV bus voltage profile of the Tram’s substation and the system load profile for each scenario. In addition, they provide information such as energy consumption, utilisation factor, power losses, and power factor of the circuit.
5.1. Voltage Profiles
The voltage profile ratio referenced to the grid nominal voltage value for each simulation scenario is seen in
Figure 16. The maximum and minimum voltage value inputs are detailed in
Table 7. In all cases, the top level is reported in the MV bar of substation-05, which is the closest to the power substation, whereas the lowest level is presented in the MV bar of substation-01, considered the farthest from the source. The voltage level drops when the BEB trickle starts below the minimum value set in [
43] for the combined and overnight trickle charging scenarios. Under these conditions, such methods could not technically be considered. However, a new simulation considering the slow charging of 14 BEBs at each point for 42 BEBs maintains a minimum voltage level within the allowed range, as evidenced in
Figure 17. Based on this consideration, BEB slow charging at night will be considered under these conditions for the implementation to be technically feasible. The voltage levels are within the allowable ranges for the other simulated scenarios.
5.2. Peak Load of the Tram Electrical System
For the different simulated scenarios, the load profiles in
Figure 18 are obtained, from which it is observed that in no case is the installed load of the system exceeded, which is 4 MW. The peak load levels for each scenario are presented in
Table 8. For the slow night charging scenario, the highest demand occurs during the charging period (11:00 pm). The highest demand for fast and combined charging scenarios begins at the commercial tram operation (around 08:00 am). Under these operating conditions, all simulated scenarios are technically feasible to implement.
5.3. Energy Consumption and Utilisation Factor
The energy consumption data and the utilisation factor corresponding to each simulation scenario are presented in
Table 9. The highest energy consumption, and therefore the highest utilisation factor, occurs in the combined system, where 29% can increase it over the baseline scenario.
Figure 19 shows a typical monthly load profile for the commercial operation of the tram system, including the power required by the charging stations for the combined scenario. It is observed that the peak power is within the established maximum limit (4 MW). Therefore, it is feasible for the technical implementation of scenarios that consider both the quiet nighttime of BEB and the fast charging in the day for EVs and BEBs from the point of view of power required from the network.
5.4. Active Power Losses
Concerning active power losses, the data are presented in
Table 10. In the base scenario, the losses reach 5.03 kW, representing 2.33% of the total load of the circuit. Thus, the slow night charging scenarios present low losses considering the base scenario. However, the major issues are present in the fast and combined charging procedures on the day, reaching around 11.74% and 15.28%, respectively, with the circuit load, making them technically unlikely scenarios to consider.
5.5. Power Factor
Circuit power factor data for each simulation scenario is shown in
Table 11. For all the methods, the power factor is within the range allowed by [
44]; therefore, according to this criterion, all the scenarios are technically feasible to implement.
The novel proposed methodology to consider the use of the electrical infrastructure of the tram for the energy integration of transport in the city was applied considering the characteristics of public mobility in Cuenca, involving three simulation scenarios based on the period of commercial operation of the tram system and the installed power in the distribution network from which it has supplied. In addition, in this study, the methodology is based on the free access software OpenDSS used to implement the Tram’s electrical network and the simulations of operating scenarios, capable of carrying out the proposed technical impact study with a high degree of precision.
In the development of the presented methodology, some limitations arose. The first limitation is the lack of information to simulate real load scenarios of electric traction transport units. Due to this, a static recharging simulation analysis is proposed for EVS and BEBs instead of intelligent charging analysis, taking as reference data from tests carried out in the city with EVs and BEBs. However, this option could be considered in future works to reduce the technical effects on the distribution networks and increase the utilisation factor of the system since the application of demand management strategies for EVs and BEBs, such as those presented in [
45,
46], make the network much more economical, efficient, and reliable. The second limitation is related to the location of the charging stations since they were established according to the availability of physical space to accommodate a fleet of EVs and BEBs and the proximity to the traction substation of the tram to these places. The main problem of the transition towards electric mobility in intermediate cities such as Cuenca is the lack of adequate intelligent charging infrastructure and establishing tariff incentives that are viable and attractive for the transport sector. That is why this study proposes an innovative solution to the problem, taking advantage of the available electrical infrastructure of the tram system to supply energy to charging stations without making significant investments. The proposal aims to improve the utilisation factor of the tram system facilities, which are currently underutilised.
The simulations determine that the scenario considering the nocturnal slow charging, with a fleet of 48 BEBs and a power of 80 kW for each unit, demands total energy in the 4.04 MVA; the power network can supply this demand of the Tram. However, the simulations determine that there is a voltage drop below the established minimum (0.94 pu) in the substation furthest from the source (substation-01), so that, technically, it would not be a feasible scenario to implement in this exact scenario, the simulations determine that the voltage levels, charging ability, and power losses in the network remain within the acceptable ranges if the load is carried out with 42 BEBs. As a result of the simulations, it has been determined that incorporating slow charging stations for 42 BEB, which represent 9% of all bus units in the city, is technically feasible and that its utilisation factor can be increased to 11%.
At the same time, the scenarios involving the fast charging of 16 EVs to 80 kW and 1 BEB to 500 kW per hour in the period of commercial operation of the Tram (06h00 to 22h00) are unlikely to be implemented in the electrical network of the Tram under certain conditions due to the overhead that is presented in network elements as MV lines and the considerable increase in power losses in the system, reaching levels of 11.74% and 15.28%, respectively, for the total demand for fast charging scenarios and combined. In this sense, for quick charging scenarios to be technically feasible, proper charging management is required so that the technical parameters remain within the expected ranges, increasing their utilisation to 40%.
Based on the determined results, it is evident that it is possible to take advantage of the electrical infrastructure available for mass electric transport systems to achieve energy integration with other electric traction transport systems, such as EVs and BEBs, under certain operating conditions. In addition, the increase in demand due to the massification of electromobility can cause adverse effects on distribution networks since these are not dimensioned to supply the new demand, which is why this research presents the analysis of the behaviour of networks in MV against the current load requirements, mainly those derived from electric mobility, and that can be adapted to any need and operational restrictions.
The present study also presents an alternative business attractive to the business manager of the tram of Cuenca city, such as obtaining income from the sale of energy in times of low and high demand, inclusive of the tram system operators’ public transport buses and taxis, taking advantage of current fare benefits in Ecuador. In this regard, the managing company could consider as an incentive for the sale of energy only one item for energy consumed for the charging of the batteries of the EVs and BEBs since the manager of the tram would assume the required power item without variations because the addition of the demand from the loading stations does not exceed the power contracted in its supply contract.
6. Conclusions
This research provides a methodology to evaluate the technical impacts generated in distribution networks due to the incorporation of charging stations through simulations of time series power flows using the OpenDSS software as a solver. The distribution network considered as a case study is the available electrical system of the Cuenca city tram, where the incorporation of charging stations is proposed with a view to energy integration between the tram, EV, and BEB. This research suggests a novel solution to the lack of charging infrastructure for EVs and BEBs in intermediate cities to decarbonise their public transport systems, which proposes incorporating charging stations without making significant modifications and investments in infrastructure, electricity, and the quality and reliability of the network.
Cuenca’s tram system allows for the incorporation of charging stations into its network since the maximum demand for its commercial operation is around 1.60 MW, being able to take advantage of the remaining approximately 2.40 MW. The utilisation factor under these operating conditions is barely 11%, which can be technically exploited.
As a result of the simulations, it is determined that nighttime slow charging of a fleet of up to 42 BEBs is technically feasible, which represents 9% of the current bus public transport system in the city. In this scenario, a substantial increase of up to 32% of the grid utilisation factor is projected, keeping the electrical parameters within limits established in the standard and with power losses very similar to the base case. Furthermore, no overload of the network elements was recorded in this scenario.
For the EVs and BEBs and combined daytime fast charging scenarios, and under the conditions considered for the simulations, it is not technically feasible to view due to the substantial increase in power losses concerning the entire load circuit due to the overloading of MV lines. However, to mitigate the problem, reducing the charging power of the EV set to 500 kW could be considered, considering that this action directly impacts the charging time of the units.
Additionally, and as future work based on these results, the development of a prototype that allows simulating intelligent charging scenarios by managing the demand of the units in such a way that the parameters such as voltage levels in busbars and a load of the system elements remain within allowable values by the standard could be considered. For this, more precise information on EV and BEB recharging habits must be available following the reality of the local transport system.


 ,
, 


