Article

Closed-Loop Supply Chain Decision-Making and Coordination Considering Fairness Concerns under Carbon Neutral Rewards and Punishments

School of Management, Jiangsu University, Zhenjiang 212000, China
*
Author to whom correspondence should be addressed.
Sustainability 2023, 15(8), 6466; https://doi.org/10.3390/su15086466
Submission received: 24 February 2023 / Revised: 3 April 2023 / Accepted: 6 April 2023 / Published: 11 April 2023
(This article belongs to the Section Sustainable Management)

Abstract

:
The cheap price of carbon sink trading in certification emission reduction (CER) makes it more popular than the carbon emission allowance (CEA); trading in carbon-neutral, enterprises are more inclined to purchase carbon sinks to achieve their own carbon neutrality goals and promote decarbonization of the whole chain. Companies urgently need to figure out how to achieve carbon neutrality with government rewards and punishments. Moreover, as an important factor affecting the effectiveness of supply chain, it is particularly important to study how to coordinate fairness concerns of such objects. Therefore, a centralized and two-stage Stackelberg game model of a closed-loop supply chain (CLSC) of one manufacturer and one retailer is constructed, and the cost-sharing contract, revenue-sharing contract, and cost–revenue-sharing contract are used to coordinate it, taking into account the fairness concerns of downstream enterprises while pursuing carbon neutrality, ensuring the overall benefits of the supply chain, and considering the impact of government subsidies and rewards and punishments on the carbon neutrality of the supply chain. Research shows that (1) compared with the other two contracts, the cost–revenue-sharing contract performs better and can effectively achieve the Pareto optimum; (2) the cost-sharing contract performs better in accomplishing the carbon neutrality of the CLSC; (3) excessively high carbon sink prices are not only detrimental to enterprise efficiency, but also to the realization of carbon neutrality goal; and (4) higher supply chain utility is pursued by enterprises when the unit reward and punishment are not great enough; otherwise, carbon neutrality is pursued. The research results can not only provide decision support for the product pricing, carbon sink reserve and contract design of CLSC enterprises under the goal of carbon neutrality, but can also provide a reference for the setting of government subsidies and rewards and punishment.

1. Introduction

In order to solve the increasingly serious climate problem, governments all over the world have formulated their own emission reduction and energy saving strategies, and encouraged enterprises to participate in the emission reduction plan by issuing various environmental protection policies, among which the most popular one is the Carbon Peak and Carbon Neutrality Plan issued by the Chinese government in 2021. So, not only in response to the government’s call, but to reflect corporate values and demonstrate social responsibility, more and more enterprises have taken carbon neutrality as their core strategy and developed their own carbon neutrality plans [1]. Enterprises usually use carbon emission reduction, carbon transfer and carbon sink purchases to achieve the goal of decarbonization [2]. However, these carbon neutralization measures will bring huge initial investment, cause instability of capital flow in the supply chain, and even discourage enterprises from participating in carbon neutralization [3]. Therefore, the government needs to reasonably set subsidies, rewards and punishments and other policies. In addition, considering that fairness concerns may affect the utility of closed-loop supply chains and hinder the realization of supply chain carbon neutrality, and in order to solve the risk of supply chain utility decline caused by fairness concerns, this study aims to find out how to make pricing, recycling and carbon sink purchase decisions in the closed-loop supply chain with carbon neutrality targets when the retailer has fairness concerns, considering government recycling subsidies and carbon neutral rewards and punishments, and to design a contract that can effectively coordinate the retailer’s fairness concerns.
Currently, there are companies that have already achieved carbon neutrality through buying carbon sinks, implementing green supply chain management, developing low-carbon technologies and using clean energy. For instance, Apple Inc. (Cupertino, CA, USA) announced at its product launch in September 2021 that it had successfully achieved carbon neutrality in its operations by adopting measures such as auctioning 38.4 million tons of carbon sinks in 2015 to offset its own carbon emissions, and using clean energy and environmentally friendly materials. Moreover, Apple Inc. continuously evaluates how well other members of its supply chain are decarbonizing, and calls on them to do the same in order to decarbonize their entire supply chain. In April 2022, Apple also announced that it would cooperate with the China Green Carbon Sink Foundation to pilot a forest carbon sink project in Sichuan Province, China, and gradually expand it to the whole country and even the world. Among them, the auction of carbon sinks in just 15 years has incurred nearly 1.4 billion dollars of costs for Apple, which is undoubtedly a huge investment risk for business operation. Classical cases of carbon neutrality in multinational corporations not only provide examples, but also reveal problems [1,4]. First, measures for enterprises to realize carbon neutrality, such as carbon sequestration and carbon removal, require a large amount of capital investment. Enterprises that blindly pursue carbon neutrality will undoubtedly face money problems [5]. Then, with the promulgation and implementation of various government subsidies and incentive and punishment measures, the government is more inclined to encourage carbon emitters to participate in the process of carbon neutrality by means of guidance, reward and punishment [2]. In addition, it is not always rational that enterprises in the supply chain tend to punish each other for “fairness” due to profit differences caused by income gap. This phenomenon is also known as fairness concern [6]. Fairness concern can not only change the profits of the entire supply chain, but can also lead to a decline in enterprises’ enthusiasm for participating in carbon neutrality, which brings risks to the function of the supply chain and contracts that are designed to achieve a state of coordination in the supply chain [6]. So, when a supply chain-leading enterprise such as Apple requires other members of its supply chain to decarbonize, will its supply chain utility be damaged due to the irrational behavior of member enterprises? Can contracts coordinate such problems? How can contracts be designed to better solve this problem? How can government play a facilitating role here? Therefore, in order to accelerate the goal of reaching carbon neutrality while pursuing supply chain stability and profit maximization, it is particularly important for leading enterprises in the supply chain to make the right decisions when purchasing carbon sinks and designing contracts to solve the problem of impaired utility caused by fairness concerns. Moreover, due to the restrictions on existing carbon emission accounting technologies (due to immaturity) and the lack of rewards and punishments related to carbon emissions, existing measures to promote low-carbon, reduced-emissions enterprises are mainly fines. In addition, studies have found that compared with subsidies and carbon regulation policies, carbon tax and carbon trading can better reduce the impact of manufacturers on the environment [7,8], but barely directly consider carbon neutral behavior together with carbon policies and carbon trading of enterprises. Therefore, the way in which we use carbon trading to achieve carbon neutrality through reasonable rewards and punishments is particularly important.
Therefore, in order to prevent the risk of capital chain breaks and benefit decreases caused by retailers’ fairness concerns due to various carbon neutral efforts required of manufacturers under various carbon policies, and to provide better management enlightenment for the government to formulate relevant policies, this study establishes a closed-loop supply chain consisting of a manufacturer and a retailer, with government subsidies and carbon neutral rewards and punishments. In the supply chain, manufacturers need to purchase carbon sinks to achieve carbon neutrality, and retailers have a tendency to be concerned about fairness. How should the manufacturer and retailer make decisions to ensure their own profits? How should contracts be designed to distribute benefits between manufacturers and retailers to coordinate the decrease in supply chain utility caused by retailers’ fairness concern? Which contract can better improve the supply chain utility? Through the numerical simulation, what kind of subsidies and carbon neutral reward and punishment policies can better promote the enthusiasm of enterprises to participate in carbon neutrality? The research results can provide decision support for CLSC enterprises in product pricing, carbon sink reserves and supply chain contract selection, under the goal of carbon neutrality. It has theoretical value and practical significance for accomplishing the goal of carbon neutrality while taking corporate profits into account. The structure of this paper is as follows. In Section 2, the literature in related research fields is summarized; In Section 3, the model background, relevant assumptions and parameters are elaborated. In Section 4, the model is established, the equilibrium solution is obtained, and the comparative analysis is carried out. In Section 5, numerical simulation and analysis are carried out to obtain management insight and explain the possible reasoning; finally, Section 6 describes the conclusions, deficiencies and future research directions of this paper.

2. Literature Review

2.1. Carbon Neutral in Supply Chain

Carbon neutrality, which lies in maintaining the balance between carbon emission and carbon utilization, as well as the balance between carbon source and carbon sink, has a focus on the development of carbon circular economy based on carbon trading [9]. Some scholars have reviewed a large number of existing studies from the perspective of value chain to verify the importance of circular economy [10]. Scholars have found that climate finance and carbon pricing can significantly affect air quality and even help improve people’s health [11]. In a carbon circular economy, the carbon trading commodities are mainly carbon emission allowance (CEA) and carbon sink projects. Carbon emission enterprises can purchase carbon sink projects through the carbon trading market to offset their carbon emissions so that they can reach the stipulated carbon emission requirements, thereby recognizing the ecological value of carbon sink carriers such as forests [12]. Since the carbon pricing of carbon allowance in the existing carbon trading market is generally higher than that of carbon sink trading, enterprises are more inclined to choose carbon sink trading as their main method of carbon offsetting [2]. As an important part of the circular economy, scholars have reviewed a large amount of the literature on the game theory of the closed-loop supply chain, and found that incentive is an important factor affecting the closed-loop supply chain [13]. So, how can governments create incentives for closed-loop supply chains? They can do this through policies, especially subsidies, incentives and market mechanisms. Not only is the efficiency of emission reductions based on market mechanisms much higher than that of the administrative order; carbon trading is also favored by the government and enterprises because of its economy, stability and controllability [7,14,15]. Plenty of studies have been conducted on carbon market trading in the supply chain, which mainly focus on decisions in the production, pricing and emission reduction of enterprises in the supply chain under the carbon cap-and-trade market. Benjaafar et al. introduced carbon allowance trading into the supply chain for the first time and discussed the impact of carbon emission costs on production decisions and the total costs of enterprises [16]. Then, scholars found that enterprises’ decision-making is influenced by fairness concerns to a certain extent [17,18]. Therefore, with the continuous improvement of the carbon trading market and mechanisms, supply chain coordination issues arising from carbon emission allowance allocation and its reward and punishment system have become the focus of research.

2.2. Cost-Sharing Contract

To achieve the goal of carbon neutrality, enterprises in the supply chain often take various measures, including the use of low-carbon materials and low-carbon technologies, which undoubtedly bring a huge burden of cost. Therefore, some scholars have studied the coordination effect of cost-sharing contract on the risk aversion and investment behavior of enterprises in the supply chain. Zang et al. studied the two-stage supply chain of risk-averse suppliers and manufacturers that shared the external failure cost, and found that the leader of the supply chain did not always have the highest profit under the premise of a sufficiently high external cost ratio [19]. To further investigate the impact of cost-sharing contracts on remanufacturing, Chen et al. established a CLSC considering remanufacturing process innovation and its cost-sharing mechanism, and found that the cost-sharing mechanism could effectively coordinate the utility of the supply chain, but it would reduce the profits of those less power members [20]. However, most of these studies are in a certain context. Considering the uncertainty of supply chain information, Ma et al. proposed an alternative decision rule based on confidence. Under this rule, enterprises in the supply chain tend to maximize potential profits under confidence, and it is found that manufacturers can significantly improve profits through cost-sharing [21]. For other uncertain parameters in the supply chain, Kuchesfehani et al. established a stochastic dynamic game model of a closed-loop supply chain composed of a manufacturer and a retailer, and found that sharing the manufacturer’s green cost can promote product recovery [22]. While considering carbon allowance trading, Lee and Yoon found that cost-sharing contracts could effectively coordinate the profitability and sustainability of supply chains, and the operability of cost-sharing contracts was affected by government carbon allowance [23]. Li and Gong considered the impact of dual-source supply and low-carbon manufacturing on the closed-loop supply chain system, constructed a two-stage CLSC model led by suppliers, and coordinated the supply chain through cost-sharing contracts. The results show that the cost-sharing contract is applicable and effective for both economic and environmental development [24]. It can be seen that in the green and low supply chain, enterprises tend to avoid the risks caused by green efforts through cost-sharing contracts, but cost-sharing contracts are rarely used to coordinate fairness concerns issues. Cost-sharing contracts are mostly used to coordinate the rise in costs caused by the increase in input, which is conducive to the risk avoidance of enterprises in the supply chain, but rarely used in fairness concerns.

2.3. Revenue-Sharing Contract

As an important factor that reduces the utility of supply chain, fairness concern has been widely studied. It may exist in every aspect of the supply chain. Diao et al. studied the influence of consumers’ fairness concerns on enterprises’ dynamic pricing strategies and channel profits, and found that consumers’ fairness concerns can bring a win-win situation to the whole chain [25]. Xia et al. studied fairness concerns in the remanufacturing process and found that fairness concerns have a large marginal effect on the quantity of remanufactured products, as do the environmental impacts of the supply chain. Xia et al. established three Stackelberg game models without fairness concern, retailer’s fair concern and manufacturer’s altruistic preference, and found that the retailer’s fairness concern increased its own profit, but reduced the manufacturer’s optimal emission reduction and profit [26]. So, in order to counter the decline in supply chain utility caused by fairness concerns, scholars propose to use revenue-sharing contracts. Cachon and Lariviere et al., inspired by the video rental industry, studied the revenue-sharing contract under the general supply chain model where the revenue is determined by the retailer’s purchase quantity and price. They found that the contract can not only realize the coordination of supply chain profits, but can also reduce the quantity of competition [27]. Many scholars have applied revenue-sharing contracts to various aspects of carbon policy, not just to coordinate the fairness concern problem. Yuan et al. introduced the revenue-sharing contract into the supply chain of carbon emissions cap-and-trade system, modeled and coordinated the self-cleaning technology input of manufacturers and the fairness concern of consumers, and found that the contract could coordinate and maximize the profit of the whole supply chain [28]. Considering the impact of carbon tax and carbon subsidy on the emission reduction of low-carbon supply chains, Ran and Xu enhanced the enterprise’s enthusiasm for emission reduction by designing revenue-sharing contracts under the constraints of low-carbon policies [29]. Under the constraint of carbon allowance, Wang et al. built a carbon emission reduction coordination game model for coal-fired power supply chain enterprises and designed a revenue-sharing coordination mechanism among the chain. They found that Pareto optimality could not always be achieved, so they analyzed the implementation conditions of the game model. This showed that revenue-sharing contracts do not always guarantee Pareto optimal solutions in the supply chain [30]. It can be seen that although revenue sharing can be used to coordinate carbon policy and equity concerns, it does not always achieve Pareto optimization. Therefore, scholars now turn to coordinating the supply chain by combining multiple contracts.

2.4. Multiple Contracts

Limited by the complexity of real-world scenarios, a single contract has been unable to fully coordinate the supply chain. While considering carbon emission reduction, Yang et al. studied the impact of retailer-led revenue-sharing and cost-sharing contracts on manufacturers’ carbon emission reduction efforts and the profitability of the two companies when consumers’ environmental awareness and carbon tax increases. The results showed that revenue-sharing contracts could improve utility and promote emission reduction, but failed to achieve Pareto optimality [31]. Under consumers’ environmental concerns, Qiao et al. studied the impact of environmental investment by both suppliers and manufacturers on the sustainability and utility of the supply chain, and used quantity discounts and cost-sharing contracts to improve the utility of the supply chain. The results show that the contract can effectively make all the parties in the supply chain achieve Pareto improvement [32]. Yin and Liu established a CLSC model with new energy vehicle manufacturers as the leader within the carbon trading system, and used cost-sharing and revenue-sharing contracts to coordinate the model. They found that when the cost of carbon emission reduction technology was too high, manufacturers’ technology research and development and innovation were reduced, leading to the failure of the contract to achieve system optimization [33]. Li et al. established four models of cost-sharing, revenue-sharing, cost–revenue-sharing and no contract. Through comparison and analysis, they found that the coordination of the supply chain depends more on the bargaining ability of both parties and the environmental awareness of consumers [34]. Mohamad et al. established a two-stage closed-loop supply chain model with uncertain demand under the impact of the pandemic, and used a call-option contract and revenue-sharing contract to coordinate the risks caused by uncertainty in the supply chain. The results showed that both contracts could bring win-win results for both companies, but that green suppliers are more inclined to choose the call-option contract, while retailers are more likely to accept revenue-sharing contracts in return [35]. Bai et al. studied a retailer-led supply chain under the supervision of the carbon cap-and-trade policy, and used the cost-sharing and revenue-sharing contracts to coordinate the decentralized system. The results showed that this contract could effectively improve economic and environmental sustainability [36]. It can be seen that better coordination effect can be achieved when using a multi-contract combination for coordination, but there are still limitations that cannot achieve Pareto optimization.

2.5. Research Gap and Conclusion

We collated most of the literature mentioned in this chapter and obtained Table 1.
In summary, most of the existing studies adopt cost-sharing contracts to solve the problems caused by enterprises’ low-carbon efforts, while using revenue-sharing contracts to solve problems caused by fairness concerns or carbon policies, but fail to use them to solve both of the three problems. Moreover, most of these are coordination studies of one single-contract model, and there are few studies that comprehensively compare and analyze the coordination contract situation under different situations and explore the optimal coordination method under different situations. Therefore, in order to explore how to make optimal decisions under carbon neutrality, this study considers a manufacturer’s carbon neutrality efforts together with a retailer’s fairness concerns, government subsidies and carbon neutrality rewards and penalties. By designing and analyzing three supply chain coordination contracts, the cost-sharing contract, revenue-sharing contract and cost–revenue-sharing contract, this study aims to explore the best way of coordinating the supply chain in different situations, when the manufacturer has to purchase carbon sink to realize its goal of carbon neutrality, and the retailer has fairness concerns under government subsidies and carbon neutrality rewards and penalties.

3. Problem Description and Assumption

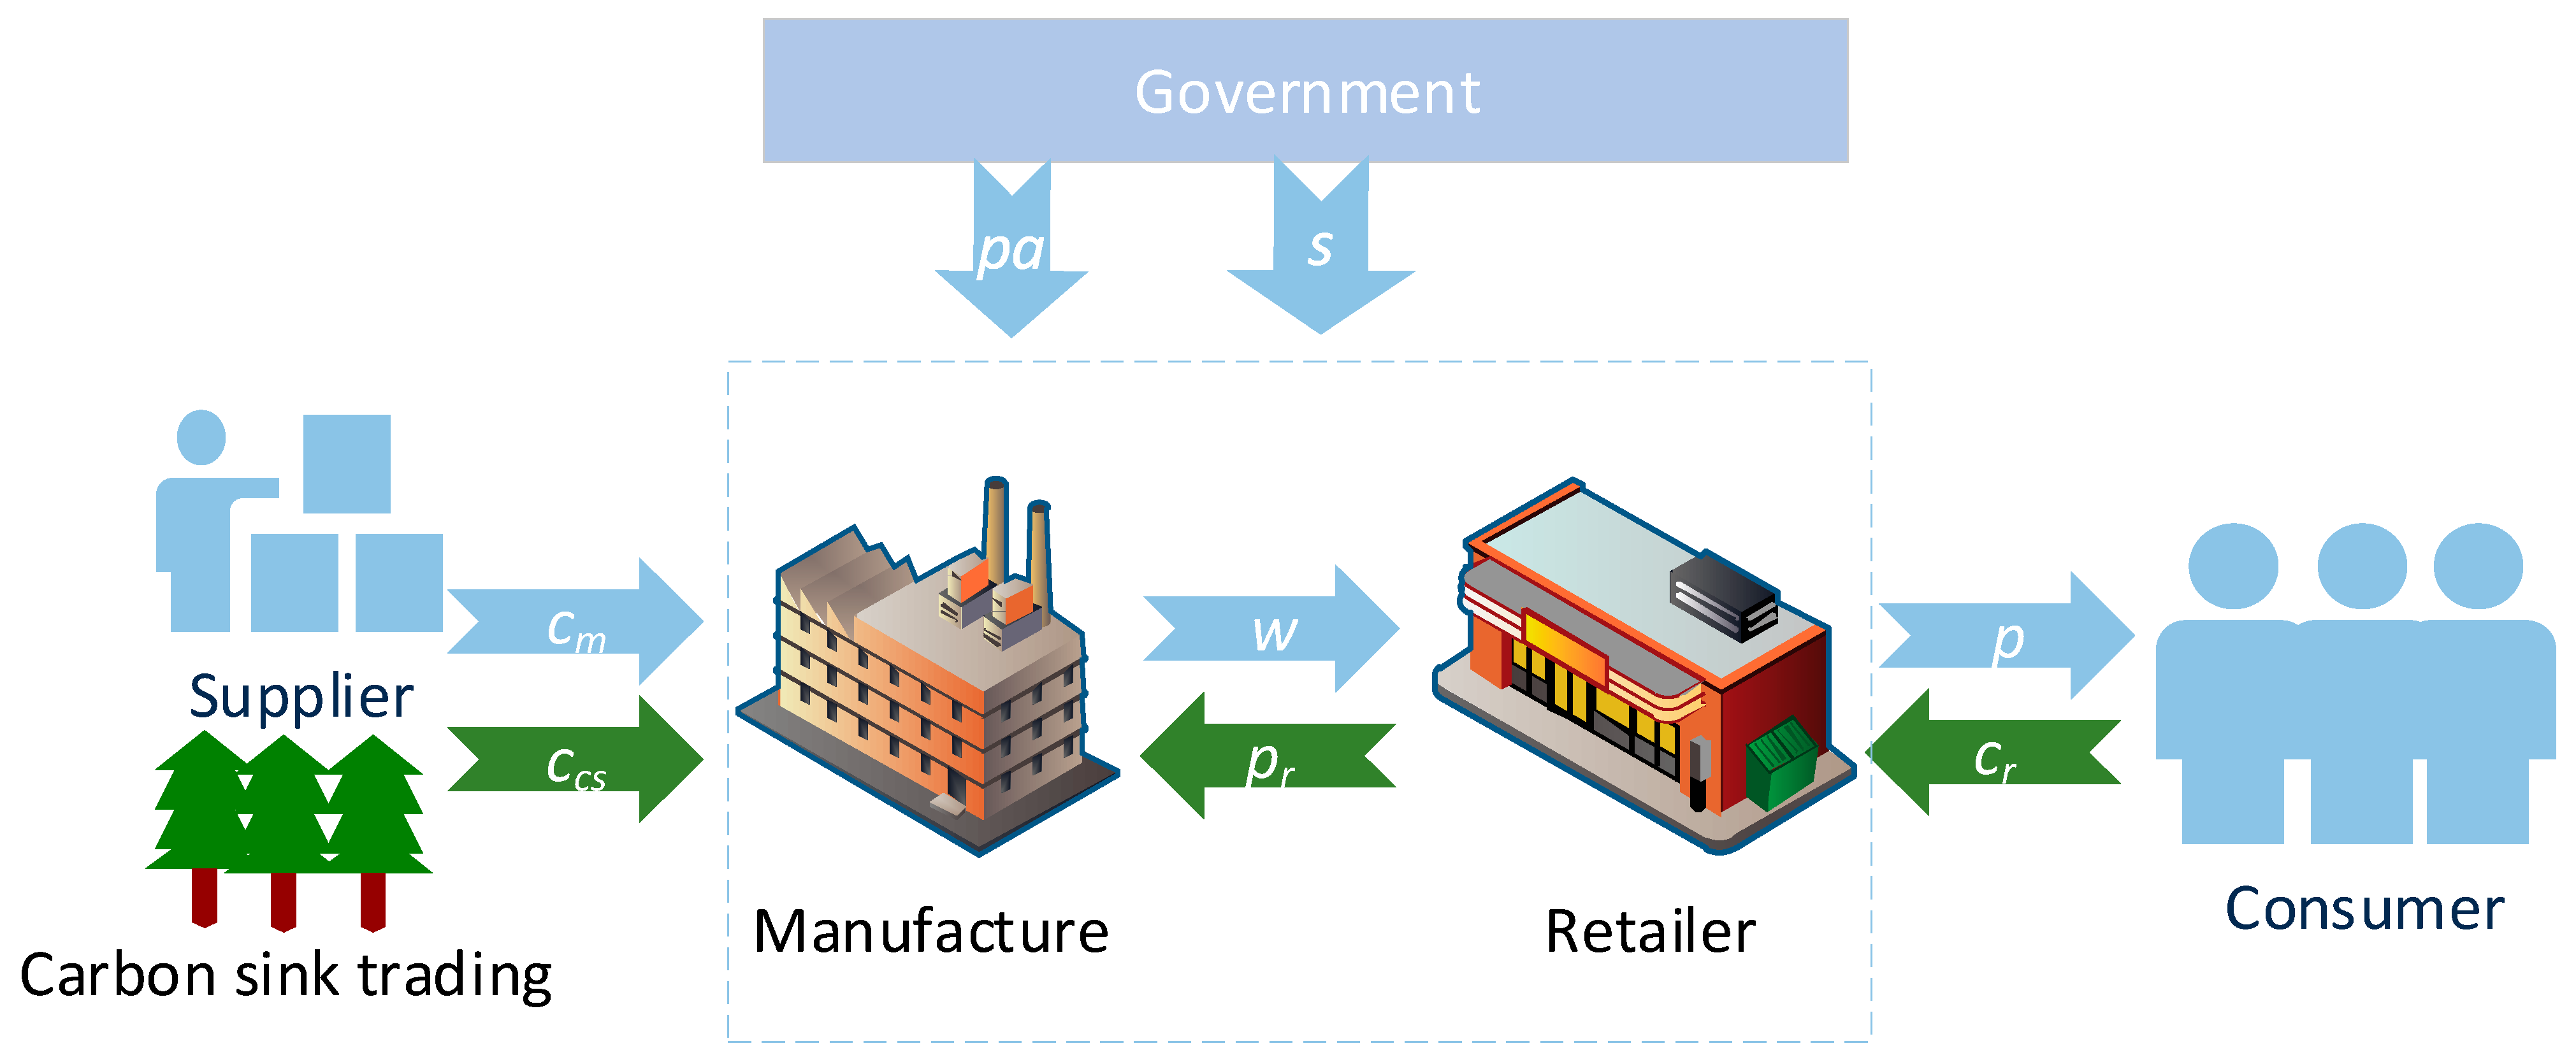
3.1. Problem Description

In this section, a CLSC model consisting of a single manufacturer and a single retailer is established, in which the manufacturer plays a leading role while the retailer plays a subordinate role. Additionally, specific parameter symbols and their descriptions in the model are shown in Table 2.
In this model, the retailer collects used goods from consumers and dismantles them into recycled materials, and the recycled materials are recycled by the manufacturer. Additionally, the manufacturer is responsible for production, which includes processing raw materials and recycling old materials into products and selling them to the retailer; the retailer buys new and remanufactured products from manufacturers and sells them to consumers, as is shown in Figure 1.

3.2. Parameters and Assumptions

Considering the complexity caused by the different particularities of products and industries in reality, in order to obtain reasonable and universal research results, the realistic scenario is simplified according to economic logic, itself according to existing research:
Hypothesis 1. 
It is assumed that there is only a material difference between new products and remanufactured products, and each unit of raw materials and recycled materials can produce the same products with no difference in quality and appearance, so consumers will show the same acceptance [37,38].
Hypothesis 2. 
The carbon emissions are mainly from manufacturers’ operations, so supply chain transportation and retailers’ operations emissions can be ignored. That is, ( D R ) e + R e r represents the carbon emissions e m of supply chain.
Hypothesis 3. 
Remanufactured products have the same manufacturing cost but a lower material cost compared to new products, which means c m > c 1 + p 1 .
Hypothesis 4. 
Assuming that the manufacturer and retailer price the new product and the remanufactured product the same, the manufacturer wholesales the product to the retailer at the wholesale price w and sells the product to the consumer at the sales price p .
Hypothesis 5. 
It is assumed that the product sales are equal to the actual market demand D , and can be affected by the price and the green perception of consumers. Because consumers perceive the green level of products through personal experience, product carbon footprint and corporate carbon information disclosure, the green level of products is affected by the inherent green degree of products and low carbon input of products [39]. Low carbon investment of manufacturers includes low carbon technology investment and carbon sink purchases, in which carbon sink purchases can be used to offset the carbon footprint of enterprises and increase the performance of corporate carbon information disclosure. Therefore, in this study, market sales are affected by carbon sink purchases and retail prices. The carbon sink purchase and market function is expressed as D = Q + d ( t + g ) a p , where Q is the nominal market demand and g is the intrinsic green attribute of the product.
Hypothesis 6. 
The product recycling quantity R is affected by recycling effort I and recycling price c r . When the recycling price c r exceeds the psychologically expected recycling price p r , the recycling quantity will be promoted, denoted as R = r + b I + c ( c r p 1 ) .
Hypothesis 7. 
It is assumed that the members of CLSC are subsidized by piece. Therefore, the government has a limited capacity to subsidize unit recycling and remanufacturing, and the total amount of unit government subsidy in the supply chain is s , in which the manufacturer is the remanufacturing subsidy, which can be shown as f · s per production unit of remanufactured goods. The retailer is subsidized for recycling, which is ( 1 f ) s per unit of product recycled.
Hypothesis 8. 
In reverse logistics, the retailer recycles the used products at the price of c r , disassemses them into recycled materials, and the manufacturer recycles them at the price of p r , where the dismantling cost is c 1 .

4. Model and Analysis

4.1. CLSC Game Model under Carbon Neutral Rewards and Punishments

4.1.1. Centralized Decision-Making

In this model, the manufacturer and the retailer make decisions based on the optimal profit of the whole supply chain. At this time, the market demand and recovery of the supply chain is D = Q + d ( t + g ) a p , R = r + b I + c ( c r p 1 ) , e m = ( D R ) e + R e r .
π C o = D ( p C o c m ) + ( t e m ) p a + R ( c m c 1 c r C o + s ) c c s t I
By combining π C o p C o = 0 , π C o c r C o = 0 , π C O c s m C o = 0 , the equilibrium solution of centralized decision-making is obtained.
p C o = c c s p a + d e p a + d c m d
c r C o = A 1 s r + c c s b I 2 c
t C o = 2 a c c s d 2 g 2 a p a + a d e p a d Q + a d c m d 2
Substitute the solution into Equation (1)
π C o = d ( d ( r + I   b ) 2 2 c ( 2 I   d + 3 A 2 A 5 ) + c 2 d A 1 2 ) 4   a c ( c c s p a ) ( A 3 ) 4   c d 2
in which A 1 = c 1 c m e p a + e r p a + p 1 s , A 2 = 2   Q p a 2   c c s   ( Q + d g ) + 2   d g p a , A 3 = c c s + c m d + p a ( d e 1 ) .
Theorem 1. 
The function π C o has a unique optimal solution.
Proof. 
We can see H = ( 2 a 0 d 0 2 c 0 d 0 0 ) = 2 c d 2 . Since c > 0 d > 0 , so H > 0 , the function π C o is negatively definite, so there is a unique optimal solution and the proof is completed. □

4.1.2. Decentralized Decision-Making

In this model, the manufacturer and the retailer make decisions based on their own optimal profits, as
π m D = D ( w D c m ) + R ( c m c 1 p r D + f s ) t D c c s + ( t D e m ) p a
π r D = D ( p D w D ) + R ( p r D c r D + ( 1 f ) s ) I
By solving the model, we can figure out that
w D = 2 c c s 2 p a + c m d + d e p a d
p r D = r + c ( A 1 2 f s + 2 s ) + I b   2 c
t D = Q d 4 a c c s + 4 a p a + d 2 g a c m d a d e p a d 2
p D = 3 c c s 3 p a + c m d + d e p a d
c r D = 3 ( b I + r ) + c ( 4 p 1 A 1 ) 4 c
Substitute into Equations (6) and (7)
π m D = ( 8 a c ( c c s p a ) ( A 3 + c c s p a ) + d ( d ( b I + r ) 2 + c 2 d ( A 1 ) 2 + 2 c A 5 ) ) 8 c d 2
π r D = I + a ( c c s p a ) 2 d 2 + 1 4 ( f 1 ) s ( A 4 ) + ( A 4 2 + 4 A 4 c s ( 1 f ) ) 16 c
in which A 4 = b I r + c A 1 , A 5 = ( 2 A 2 + d r ( A 1 ) + b d I ( A 1 ) ) .
In this case, the total profit of the supply chain is
π D = ( 16 a c ( c c s p a ) A 3 + d ( 3 d ( b I + r ) 2 + 3 c 2 d ( A 1 ) 2 + 2 c A 6 ) ) 16 c d 2
A 6 = 8 d I 4 A 2 3 d r A 1 3 b d I A 1

4.2. CLSC Model with Fairness Concerns

Referring to the existing research, the utility function when the retailer has fairness concerns is set as U F r = π r λ ( π m π r ) ; at this time, U m F = π m , where λ is the fairness concern coefficient [40,41].
U m F = D ( w F c m ) + R ( c m c 1 p r F ) t F c c s + ( t F e m ) p a + f s R
U r F = D ( p F w F + ( c m + p F 2 w F ) λ ) + R ( p r F c r F + s f s ) I + ( c c s t F + ( e m t F ) p a + R ( c 1 c m p r F + s + 2 f s + 2 p r F ) I ) λ
By using the backward induction, we can figure out:
w F = 2 c c s + c m d 2 p a + d e p a d
p r F = ( ( b I + r ) ( 1 + λ ) + c ( A 7 + ( 3 A 7 2 p 1 + 2 ( 1 f ) s ) λ ) ) 2 ( c + 2 c λ )
t F = d ( d g + Q ) + a ( c m d + ( 8 + d e ) p a + 4 ( c c s + p a + 2 c c s λ ) 1 + λ ) d 2
p F = c m d ( 1 + λ ) + c c s ( 3 + 6 λ ) + p a ( 3 6 λ + d e ( 1 + λ ) ) d ( 1 + λ )
c r F = 3 ( b I + r ) + c ( A 7 + 2 p 1 + 2 ( 1 f ) s ) 4 c
A 7 = c 1 + c m + e p a e r p a + p 1 s + 2 f s
Substitute into Equations (16) and (17):
U m F = ( 2 f s A 4 + A 8 + A 12 / ( c + 2 c λ ) + A 10 + A 4 ( ( b I + r ) ( 1 + λ ) + c A 9 λ c 1 λ ) ) / d 2 ) 8
U r F = a ( c c s p a ) ( A 13 + c c s ( 1 + 2 λ ) ( 1 + 6 λ ) d 2 ( 1 + λ ) ) + ( A 14 2 c A 15 ) 16 c d ,
in which
A 8 = 8 a ( c c s p a ) ( 2 c c s + ( 2 + d e ) p a ) ( 1 + 2 λ ) d 2 ( 1 + λ )
A 9 = c m 3 e p a + 3 e r p a p 1 + s 4 f s
A 10 = 8 c c s ( d ( d g + Q ) ( 1 + λ ) a ( c m d ( 1 + λ ) + c c s ( 4 + 8 λ ) + p a ( d e ( 1 + λ ) 4 8 λ ) ) ) d 2 ( 1 + λ )
A 11 = 4 a ( c m d ( 1 + λ ) c c s ( 4 + d e ) ( 1 + 2 λ ) + p a ( 4 8 λ + d e ( 2 + 3 λ ) ) ) 1 + λ
A 12 = 2 p a ( d ( 4 d g + 4 Q d ( e e r ) A 7 ) + A 11 )
A 13 = c m d λ ( 1 + λ ) + p a ( 1 + d e λ ( 1 + λ ) 4 λ ( 2 + 3 λ ) )
A 14 = ( d ( b I + r ) 2 + c 2 d A 1 2 + 8 I d + d r A 1 ) ( 1 + λ )
A 15 = 8 ( c c s p a ) Q λ + b d I A 1 ( 1 + λ ) + d ( 8 c c s g λ 8 g p a λ )
Corollary 1. 
The inequality π m D > π r D can be solved.
Proof. 
Subtracting Equation (13) from Equation (14),
( 16 a c ( c c s p a ) ( A 3 + 2 ( c c s p a ) ) + d ( d ( b I + r ) 2 + c 2 d A 1 2 + 2 c ( 8 d I 2 A 2 + A 5 ) ) ) 16 c d 2 > 0
It is known that 0 < β < 1 , λ > 0 , r > 0 , Q > r , p a > 0 , b > 0 , c > 0 , d > 0 , e > e r > 0 , i > 0 , g > 0 . So, when A 1 < r c , c c s > p a ,
This inequality has a solution in
{ 0 < a d ( A 1 2 c 2 d + 16 c ( c c s p a ) Q 2 A 1 c d r + d r 2 ) 16 c ( c c s p a ) ( 3 c c s + ( 3 + d e ) p a ) 0 < c 16 c ( A 2 2 + d I ) + d I ( b ( 2 I + b I ) + ( r A 1 c ) 2 ) 16 a c ( c c s p a ) 3 ( c c s p a ) d e p a : end of proof. □
Corollary 1 shows that in a manufacturer-led supply chain, the retailer’s profit is affected by the manufacturer’s decision, so the manufacturer’s profit can be higher than that of the retailer, which makes it possible for the retailer to have fairness concern.

4.3. Supply Chain Coordination

4.3.1. The Cost-Sharing Contract

Due to the influence of fairness concerns, large cost inputs such as carbon sink purchase and recovery investment will cause changes in market demand and recovery, which will eventually lead to fluctuations in supply chain utility. Therefore, cost-sharing contracts are considered to balance invests and coordinate profits. In this contract, the manufacturer and the retailer negotiate to share the cost of carbon sink purchase and recovery investment with the cost-sharing coefficient β , and the profit functions are
π m C S = D ( w C S c m ) + R ( c m c 1 p r C S + f s ) + p a ( t e m ) c c s t C S β ( I c c s t C S )
π r C S = D ( p C S w C S ) + R ( p r C S c r C S + ( 1 f ) s ) I + β ( I c c s t C S )
Let U m C S =   π m C S , U r C S = π r C S λ ( π m C S π r C S )
U m C S = D ( w C S c m ) R ( c 1 c m + p r C S ) + p a ( t e m ) c c s t C S + R f s β ( I c c s t C S )
U r C S   = D ( p C S   w C S + c m λ ) + R ( p r C S c r C S + s ( 1 f ) ) + c c s t λ I + ( ( e m t C S ) p a + R ( c 1 c m c r C S + 2 p r C S + s 2 f s ) + D ( p C S 2 w C S ) I ) λ β ( c c s t I ) ( 1 + 2 λ )  
By using the backward induction, we can figure out:
w C S = 2 c c s + c m d 2 p a + d e p a 2 c c s β d
p C S = c m d ( 1 + λ ) 3 c c s ( 1 + β ) ( 1 + 2 λ ) + p a ( 3 6 λ + d e ( 1 + λ ) ) d ( 1 + λ )
p r C S = ( ( b I + r ) ( 1 + λ ) + c ( A 7 + ( 3 A 7 2 p 1 + 2 ( 1 f ) s ) λ ) ) 2 ( c + 2 c λ )
c r C S = 3 ( b I + r ) + c ( A 7 + 2 p 1 + 2 ( 1 f ) s ) 4 c
t C S = g + 1 d 2 ( d ( a ( c m + e p a ) Q ) 4 a ( p a + c c s ( 1 + β ) ) ( 1 + 2 λ ) 1 + λ )
Substitute into Equations (27) and (28):
U m C S = 1 8 d 2 ( 8 a ( p a + c c s ( 1 + β ) ) A 16 1 + λ + 1 c + 2 c λ d ( A 14 8 I d + d r A 1 1 + λ 2 c A 17 ) )
U r C S = 1 16 ( ( b I + r ) 2 ( 1 + λ ) c + A 18 ) + a ( c c s   2 ( 1 + β ) A 21 + A 20 + c c s A 22 ) d 2 ( 1 + λ )
in which
A 16 = ( c m d ( 1 + λ ) 2 c c s ( 1 + β ) ( 1 + 2 λ ) + p a ( 2 4 λ + d e ( 1 + λ ) ) )
A 17 = ( 4 d g p a + d r A 1 + 4 d I β + 8 p a Q λ + d ( 8 g p a + r A 1 + 8 I β ) λ + b d I A 1 ( 1 + λ ) + 4 c c s ( d g + Q ) ( 1 + β ) ( 1 + 2 λ ) )
A 18 = 2 b I A 1 ( 1 + λ ) + c A 1 2 ( 1 + λ ) + 2 A 19 + 16 Q ( p a λ + c c s ( β λ + 2 β λ ) ) d
A 19 = ( r A 1 + 8 c c s g ( β λ ) + r ( c 1 A 1 ) λ + 8 g ( p a + 2 c c s β ) λ c 1 r ( 1 + λ ) + 8 I ( β 1 λ + 2 β λ ) )
A 20 = p a ( p a c m d λ ( 1 + λ ) d e p a λ ( 1 + λ ) + 4 p a λ ( 2 + 3 λ ) )
A 21 = ( 1 + 2 λ ) ( 1 6 λ + 5 β ( 1 + 2 λ ) )
A 22 = ( c m d ( 1 + λ ) ( β λ + 2 β λ ) + p a ( 2 + d e λ ( 1 + λ ) 8 λ ( 2 + 3 λ ) β ( 1 + 2 λ ) ( 6 + d e 16 λ + d e λ ) ) )
Corollary 2. 
There is a Pareto optimal solution under the cost-sharing contract.
Proof. 
We can know from the assumptions that λ > 0 , I > 0 , b > 0 , c > 0 , c m > 0 , e > e r > 0 , p a > 0 , Q > 0 , r > 0 , g > 0 .
When the above conditions are met, and the subtraction of Equations (34) and (23), and Equations (35) and (24) is positive, it can be seen as a Pareto optimal:
{ β ( d ( d I + c c s ( d g + Q ) ) ( 1 + λ ) + a c c s ( A 16 + 2 ( c c s p a ) ( 1 + 2 λ ) ) ) d 2 ( 1 + λ ) > 0 β ( 1 + 2 λ ) d 2 ( 1 + λ ) ( d ( d I + c c s ( d g + Q ) ) ( 1 + λ ) + a c c s 2 ( A 21 5 ( 1 + 2 ) λ ) + a c c s ( 2 p a ( 3 + 8 λ ) ( d e p a + c m d ) ( 1 + λ ) ) ) > 0  
While 0 < β 2 3 , the inequality group has a solution in
{ 0 < c c s < 2 p a 2 + β 2 ( 2 p a + c c s ( 2 + β ) ) ( 1 + 2 λ ) ( c m + e p a ) ( 1 + λ ) < d 2 p a ( 3 + 8 λ ) + c c s ( 6 + 5 β 16 λ + 10 β λ ) ( c m + e p a ) ( 1 + λ ) a > d ( d I + c c s ( d g + Q ) ) ( 1 + λ ) c c s ( 4 p a + 8 p a λ c m d ( 1 + λ ) d e p a ( 1 + λ ) + 2 c c s ( 2 + β ) ( 1 + 2 λ ) ) : proof completed. □
Corollary 3 shows that both the manufacturer and the retailer are willing to adopt the contract in this range, because the revenue-sharing contract can improve the utility of both manufacturers and retailers. In addition, it can be seen from inequality group (36) that the profit value improved by the cost-sharing contract for both the manufacturer and the retailer is proportional to the value of the cost-sharing coefficient β , but it cannot affect the positivity and negativity of the inequality for β > 0 .
Corollary 3. 
w C S β < 0 , p C S β < 0 , t C S β < 0 , D C S β < 0 .
Proof. 
Substitute w C S , p C S , t C S into the function D = Q + d ( t + g ) a p to obtain D C S = a ( ( 1 + β ) c c s + p a ) ( 1 + 2 λ ) d ( 1 + λ ) .
Taking the derivative of w C S , p C S , t C S and D C S with respect to the cost sharing coefficient β, w C S β = 2 c c s d , p C S β = 3 c c s ( 1 + 2 λ ) d ( 1 + λ ) , t C S β = 4 a c c s ( 1 + 2 λ ) d 2 ( 1 + λ ) and D C S β = a c c s ( 1 + 2 λ ) d + d λ is obtained. For a > 0 , d > 0 , c c s > 0 , the derivative w C S β < 0 , p C S β < 0 , t C S β < 0 , D C S β < 0 : end of proof. □
Corollary 4 shows that wholesale price, retail price, carbon sink reserve and market demand decrease with the increase in the cost-sharing coefficient, while the market recovery price, manufacturer recovery price and recovery quantity are not affected. This is because when the manufacturer and the retailer both agree with the cost-sharing contract, both of the two will have the psychology of making profits, and the margin of making profits will deepen with the degree of cost-sharing, which is reflected in the reduction in the wholesale price and retail price. Therefore, manufacturers tend to reserve fewer carbon sinks to reduce cost input and ensure their own profits. In this case, market demand and sales will suffer under the green perception of consumers.

4.3.2. The Revenue-Sharing Contract

When the retailer has fairness concern, the utility of the supply chain will decline when the retailer’s revenue is lower than that of the manufacturer. Therefore, according to existing studies, a revenue-sharing contract [24,27] is designed based on the agreed wholesale price and recycled material price. Under this contract, the manufacturer and the retailer make the following agreement. While the wholesale price w P S and the recycling material price p r P S after using the revenue-sharing contract are not lower than that without the contract, both of them are going to agree with the contract, and then the manufacturer shares its own revenue with the retailer in the proportion of the revenue-sharing coefficient α . Additionally, the decision is made with the retail price p C o , the market recovery price c r C o , and the carbon sink reserve t C o . The profit function is as follows:
π m P S = D ( ( 1 α ) w P S c m ) + R ( c m p r P S c 1 + f s ) c c s t P S + ( t P S e m ) p a
π r P S = D ( p P S ( 1 α ) w P S   ) + R ( p r P S c r P S + ( 1 f ) s ) I
By setting U m P S =   π m P S , U r P S = π r P S λ ( π m P S π r P S ) , we can get
U m P S = D ( ( 1 α ) w P S c m ) + R ( c m p r P S c 1 + f s ) c c s t P S + ( t P S e m ) p a
U r P S = D ( c m λ + p P S ( 1 + λ ) + w P S ( 1 + α ) ( 1 + 2 λ ) ) + R ( p r P S c r P S + ( 1 f ) s ) I + ( c c s t P S + ( e m t P S ) p a + R ( c 1 c m c r P S + 2 p r P S + s 2 f s ) I ) λ
By solving U m P S p P S = 0 and U r P S c r P S = 0 , we can obtain p P S ˜ and c r P S ˜ , and then make them equal to Equations (2) and (3) in the case of centralized decision-making, and solve to get the agreed wholesale price w P S and the price p r P S of recycled materials:
w P S = ( c m e p a ) α 1
p r P S = c 1 + c m + e p a e r p a + f s
Substitute into Equations (39) and (40):
U m P S = ( c c s p a ) ( a ( 2 c c s + c m d 2 p a + d e p a ) + d ( d g + Q ) ) d 2
U r P S = 1 4 c d 2 ( 4 a c ( c c s p a ) ( c c s + 3 c c s λ + c m d λ + p a ( 1 3 λ + d e λ ) ) + d A 24 )
in which
A 23 = r A 1 + 2 c c s g λ 2 g p a λ + r A 1 λ + 2 I ( 1 + λ )
A 24 = d ( b I + r ) 2 ( 1 + λ ) + c 2 d A 1 2 ( 1 + λ ) 2 c ( 2 ( c c s p a ) Q λ + b d I A 1 ( 1 + λ ) + d A 23 )
Corollary 4. 
The manufacturer agrees to the revenue-sharing contract when p a < c c s and d > 2 ( α 1 ) ( p a c c s ) α ( c m + e p a ) .
Proof. 
The manufacturer agrees to share the revenue with the retailer when the wholesale price and the material recovery price after the use contract are greater than the unused contract. As e > 0 , c c s > p a > 0 , d > 0 , 0 < α < 1 , let the subtraction between Equations (41) and (18) and between (42) and (19) be greater than 0 to obtain the following inequality group:
{ 2 c c s ( α 1 ) + c m d α + p a ( 2 + ( d e 2 ) α ) d ( α 1 ) > 0 b I + r c A 1 + λ 1 + 4 c λ > 0
When 0 < A 1 r + λ c , the inequality group holds in { d > 2 ( α 1 ) ( p a c c s ) α ( c m + e p a ) I > 0 . When A 1 r + λ c , the inequality group holds in { d > 2 ( α 1 ) ( p a c c s ) α ( c m + e p a ) I > ( A c + r + λ ) 2 b 2 : end of proof. □
Corollary 4 states that if the above conditions are met, the manufacturer and the retailer can sell the materials and products at a higher price than they would otherwise have done without the contract, so both can agree to the contract.
Corollary 5. 
There is no Pareto optimal solution under the revenue-sharing contract, but Pareto improvement can be achieved.
Proof. 
As λ > 0 , I > 0 , b > 0 , c > 0 , c m > 0 , e > e r > 0 , p a > 0 , Q > 0 , r > 0 , g > 0 . Let the subtraction between Equations (43) and (23) and between (44) and (24) be greater than 0 to obtain the inequality group
{ ( 45 a ) 1 8 c d 2 ( 1 + λ ) ( 1 + 2 λ ) ( 2 c d 2 ( b I + r ) A 1 4 c ( 4 a ( c c s p a ) 2 + d 2 ( b I + r ) A 1 ) λ 2 c ( 16 a ( c c s p a ) 2 + d 2 ( b I + r ) A 1 ) λ 2 + d 2 ( b I + r ) 2 ( 1 + λ ) 2 + c 2 d 2 A 1 2 ( 1 + λ ) 2 ) > 0 ( 45 b ) 3 ( b I + r ) 2 ( 1 + λ ) 16 c + 3 16 c A 1 2 ( 1 + λ ) ( 3 d 2 ( b I + r ) A 1 + 32 a ( c c s p a ) 2 λ + 6 d 2 ( b I + r ) A 1 λ + 72 a ( c c s p a ) 2 λ 2 + 3 d 2 ( b I + r ) A 1 λ 2 ) 8 d 2 ( 1 + λ ) > 0
The inequality group has no solution, so the revenue-sharing contract cannot achieve Pareto optimality.
However, when c c s > p a and A < r c , the inequality (45a) holds in a > 1 16 ( 2 b 2 d 4 I ( r A 1 c ) 2 ( 1 + λ ) 4 c 2 ( c c s p a ) 4 λ 2 ( 1 + 2 λ ) 2 + d 2 ( b 2 I + ( r A 1 c ) 2 ) ( 1 + λ ) 2 c ( c c s p a ) 2 λ ( 1 + 2 λ ) ) ; inequality (45b) holds in 0 < a < 3 16 ( 2 b 2 d 4 I ( r A 1 c ) 2 ( 1 + λ ) 4 c 2 ( c c s p a ) 4 λ 2 ( 4 + 9 λ ) 2 + d 2 ( b 2 I + ( r A 1 c ) 2 ) ( 1 + λ ) 2 c ( c c s p a ) 2 λ ( 4 + 9 λ ) ) . Therefore, revenue-sharing contracts can achieve Pareto improvement: end of proof. □
Corollary 5 shows that the revenue-sharing contract cannot always improve the utility of both the manufacturer and the retailer, so there is a possibility that one of either the manufacturer or the retailer is not willing to accept the contract.

4.3.3. Cost-Revenue Sharing Contract

Corollary 2 and Corollary 5 show that cost-sharing and revenue-sharing contracts have their own advantages and disadvantages. Therefore, a cost-sharing and revenue-sharing contract based on the agreed wholesale price and the price of recycled materials is formulated, under which the manufacturer and the retailer agree on the following. When the wholesale price w C P and recovery price p r C P are not cheaper than that with fairness concerns, the manufacturer agrees to the contract and shares its own revenue with the proportion of revenue-sharing coefficient α to the retailer. At the same time, both sides jointly undertake the carbon neutrality and recovery efforts with the coefficient β. Additionally, the decision is made with the retail price p C o , the recovery price c r C o and the carbon sink reserve t C o . In this case, the profit function of the two is
π m C P = D ( ( 1 α ) w C P c m ) + R ( c m p r C P c 1 + f s ) c c s t C P + ( t C P e m ) p a β ( I c c s t C S )
π r C P = D ( p C P ( 1 α ) w C P   ) + R ( p r C P c r C P + ( 1 f ) s ) I + β ( I c c s t C P )
Let U m C P = π m C P and U r C P = π r C P λ ( π m C P π r C P ) ,
U m C P = D ( ( 1 α ) w C P c m ) + R ( c m c 1 p r C P + f s ) + β ( c c s t C P I ) c c s t   + p a ( t C P e m )
U r C P = R ( p r C P c r C P + ( 1 f ) s ) + D ( c m λ + p ( 1 + λ ) + w ( α 1 ) ( 1 + 2 λ ) ) + ( e m p a + R ( c 1 c m c r C P + 2 p r C P + s 2 f s ) t C P ( p a + 2 c c s β ) ) λ + c c s t C P ( λ β ) + I ( β 1 λ + 2 β λ )
Solve U m C P p C P = 0 and U r C P c r C P = 0 to obtain p C P ˜ and c r C P ˜ , which is equal to Equations (2) and (3) in the case of centralized decision-making, and obtain the agreed wholesale price w C P and the price p r C P of recycled materials.
w C P = ( c m e p a ) α 1
p r C P = c 1 + c m + e p a e r p a + f s
Substitute into Equations (48) and (49):
U m C P = a ( 2 c c s + c m d + ( d e 2 ) p a ) ( p a + c c s ( β 1 ) ) d ( d g p a + p a Q + c c s ( d g + Q ) ( β 1 ) + d I β ) d 2
U r C P = 1 4 c d 2 ( 4 a c ( c c s 2 ( 1 3 λ + β ( 2 + 4 λ ) ) + p a ( c m d λ + p a ( 1 3 λ + d e λ ) ) + c c s ( c m d ( β λ + 2 β λ ) + p a ( 2 + 6 λ d e λ + ( 2 + d e ) β ( 1 + 2 λ ) ) ) ) + d ( d ( b I + r ) 2 ( 1 + λ ) + c 2 d A 1 2 ( 1 + λ ) + 2 c A 26 ) ) ,
in which A 25 = r A 1 + 2 c c s g ( β λ ) r A 1 λ + 2 g ( p a + 2 c c s β ) λ + 2 I ( 1 + β λ + 2 β λ )
A 26 = ( b d I A 1 ( 1 + λ ) + d A 25 + 2 Q ( p a λ + c c s ( β λ + 2 β λ ) ) )
Corollary 6. 
When p a < c c s , and d > 2 ( α 1 ) ( p a c c s ) α ( c m + e p a ) , the manufacturer agrees to the cost–revenue-sharing contract.
Proof. 
Same as Corollary 4. □
Corollary 7. 
There is a Pareto optimal solution under the cost–revenue-sharing contract.
Proof. 
As λ > 0 , I > 0 , b > 0 , c > 0 , c m > 0 , e > e r > 0 , p a > 0 , Q > 0 , r > 0 , g > 0 . Let the subtraction between Equations (51) and (23) and between (52) and (24) be greater than 0 to obtain the inequality group
{ c 2 d 2 A 1 2 ( 1 + λ ) 2 + 2 c ( A 29 + 2 A 30 λ + 8 a A 31 λ 2 + b d 2 I A 1 ( 1 + λ ) 2 ) d 2 ( b I + r ) 2 ( 1 + λ ) 2 8 c d 2 ( 1 + λ ) ( 1 + 2 λ ) > 0 3 ( b I + r ) 2 ( 1 + λ ) 16 c + c A 1 2 ( 1 + λ ) 16 + ( 8 A 32 β 8 a A 35 λ + 6 d A 34 β λ + A 33 λ 2 3 d 2 A 1 ( b I ( 1 + λ ) 2 + r A 1 ) ) 8 d 2 ( 1 + λ ) > 0
In which A 27 = 2 c c s + c m d 2 p a + d e p a , A 28 = c c s d g + d I + c c s Q , A 29 = 8 a c c s 2 β 4 d 2 I β 4 c c s ( d 2 g β + 2 a p a β + d ( Q a ( c m + e p a ) β ) ) , A 30 = ( 4 a ( c c s p a ) 2 + 6 a c c s A 27 β + d ( d r A 1 6 A 28 β ) ) , A 31 = ( 2 ( c c s p a ) 2 + c c s A 27 β ) + d ( d r A 1 8 A 28 β ) , A 32 = ( a c c s ( 2 c c s + 2 p a d ( c m + e p a ) ) + d ( d I + c c s ( d g + Q ) ) ) , A 33 = 8 a ( 9 ( c c s p a ) 2 2 c c s A 27 β ) + d ( 3 d r A 1 + 16 A 28 β ) , A 34 = d r A 1 + 4 ( d I + c c s ( d g + Q ) ) , A 35 = ( 4 ( c c s p a ) 2 + 3 c c s A 27 β ) .
The inequality set (55) can be seen as
{ k 1 c + m 1 n 1 c > 0   ( k 1 > 0 , n 1 > 0 , k 1 , n 1 ) ( n 2 c ) + k 2 c + m 2 > 0   ( k 2 > 0 , n 2 > 0 , k 2 , n 2 )
The inequality set holds when m 2 R ,   n 1 > 0 , and m 1 > c 2 k + n c ,   n 2 > c 2 k 2   c m 2 .
Since k 1 > 0 , n 1 > 0 , k 2 > 0 , n 2 > 0 , so m 1 > c 2 k + n c , n 2 > c 2 k 2 c m 2 holds, there is a Pareto optimal solution under the cost–revenue-sharing contract. □

5. Numerical Analysis

In order to verify the formula derivation and proposition proof mentioned above and obtain management insight, Matlab2020a was used to simulate and analyze part of propositions and inferences of the model. Following to the existing research [24,28], the values of parameters are assumed as follows: potential market demand Q = 2000; recovery effort I = 20,000; raw material and manufacturing cost c m = 300; unit carbon sink price c c s = 20; inherent green level of the product g = 1; carbon emission per unit of new products e = 25; e r = 22; consumer expected recovery price p r = 100; intrinsic recovery r = 100; recovery price coefficient c = 0.5; unit government subsidy s = 30; subsidy distribution coefficient f = 0.5; unit government rewards and punishments p a = 10; recovery effort coefficient b = 2; remanufactured cost c 1 = 80; consumer green sensitivity coefficient d = 0.4; consumer price sensitivity coefficient a = 3; revenue-sharing coefficient α = 0.3; cost-sharing coefficient β = 0.4. Among them, carbon emission difference refers to the reduction in the carbon sink purchase amount and supply chain carbon emission, namely, t e m , which represents the achievement of carbon neutrality in the supply chain.

5.1. Enterprise

5.1.1. Fairness Concern Coefficient

According to the above assignment, the influence of the change in fairness concern coefficient on the overall utility of the supply chain and the achievement of carbon neutrality in different models are simulated and analyzed, as shown in Figure 2.
As can be seen in Figure 2, the utility of the whole supply chain under the three contracts increases when the retailer’s fairness concern coefficient increases, but the carbon emission difference between the carbon sink reverse and carbon emission shows a decreasing trend. This is because when the manufacturer perceives that the retailer’s concern for fairness increases, the manufacturer tends to take measures to balance the profit gap between the manufacturer and the retailer, which leads to an increase in the overall utility of the manufacturer and the retailer. Among these measures, the manufacturer increases environmentally friendly investment in the product, so that the market demand and sales volume increase under the green perception of consumers. The increase in market sales leads to a change in the production quantity of the manufacturer, which prompts an increase in carbon emissions and a decrease in the carbon difference, thereby failing to reach carbon neutrality. Therefore, it can be seen from Figure 2b that the retailer’s fairness concern will hinder the carbon neutrality process in any case, but all of the three contracts can coordinate well. This is because retailers are less motivated to participate in recycling due to fairness concerns, resulting in a lower proportion of remanufactured products in the supply chain and an increase in carbon emissions. At this time, manufacturers are more inclined to accept punishment rather than achieve carbon neutrality. Therefore, based on Figure 2a,b, when the fairness coefficient of retailers increases, a profit-oriented manufacturer can adopt cost–revenue-sharing contracts to gain utility, while a manufacturer that prefers carbon emission reduction can consider using revenue-sharing contracts to perform better in terms of carbon neutrality.
As shown in Figure 3a, in the manufacturers coordination situation, in most cases, using a revenue-sharing contract can effectively realize the Pareto improvement of manufacturing utility, but cost-sharing contracts and cost–revenue-sharing contracts can only reach Pareto improvement when retailer’s fairness concern is high enough. This is because under the influence of retailer’s fairness concern, manufacturers under cost-sharing contracts and cost–revenue-sharing contracts need to bear the extra recovery costs of retailers, resulting in a decline in their own benefits, and in government penalties for failing to meet carbon-neutral targets. In this case, the benefits of the manufacturer are lower than that of the retailer. The revenue-sharing contract can balance this situation well, which leads to an increase in the manufacturer’s utility. As shown in Figure 3b, it can be found that the cost–revenue-sharing contract can better improve retailer’s utility. This is because when the retailer cares more about fairness, they are increasingly unable to achieve the goal of carbon neutrality in the supply chain, so they can only choose to bear the penalty in pursuit of higher utility, which leads to a decline in manufacturer’s income, even lower than that of the retailer. At this time, a cost-sharing contract can better balance the income gap and improve the efficiency of the retailer. This suggests that the manufacturer should try to eliminate the fairness concerns of the retailer; otherwise, it will not only fail to achieve carbon neutrality in the supply chain, but will also lead to a decrease in the manufacturer’s own utility and bring double losses.

5.1.2. Cost-Sharing Coefficient

In order to explore the impact of fluctuations in the cost-sharing coefficient on the model, this study further simulated and analyzed the effect of cost-sharing coefficient variation on the overall utility and carbon emission difference of the supply chain.
As shown in Figure 4a, when the cost-sharing behavior between manufacturers and retailers in the supply chain becomes more significant, the utility of the whole supply chain increases significantly. When deep enough, no matter which contract is adopted, the enterprise can effectively realize the Pareto improvement of the overall utility of the supply chain, and among the three contracts, and the cost–revenue-sharing contract can always achieve better improvement in the supply chain utility. This is mainly because when the cost-sharing of the two sides is the same, the revenue-sharing can better balance their revenue gap, so that the supply chain benefit is higher than the single-use cost-sharing contract. Additionally, it can be seen from Figure 4b that the deepening of their cost-sharing can also promote their carbon neutrality progress, and it performs the best among the three kinds of contracts. This is because the retailer who shared the recycling cost is more active in participating in recycling, which leads to an increase in the proportion of recycled products in the supply chain, and thus a decrease in carbon emissions. Moreover, since the manufacturer has shared the carbon neutrality effort, they will be more motivated to participate in carbon neutrality and will buy more carbon sinks for carbon offsets. Therefore, if the decision-makers in the supply chain want to accelerate their carbon neutrality process as much as possible while pursuing optimal profit, they should try to increase the degree of cost-sharing between manufacturers and retailers.

5.1.3. Carbon Sink Trading

The global carbon sink market is still being established, and most of the existing carbon sink project transactions are only b2b, which are disclosed after verification. Considering that the uncertainty of carbon sink price can easily lead to the fluctuation of supply chain investment and cause breakage of the capital chain (and therefore risks), this study conducts a simulation analysis on supply chain utility under carbon sink price fluctuation.
As can be seen in Figure 5a, the cost–revenue-sharing contract shows the best performance in coordinating utility in the supply chain when the unit carbon sink price is cheap, and the revenue-sharing contract becomes the best choice when the carbon sink price is too expensive. This is because the enthusiasm of the enterprise to participate in carbon-neutral declines when the price of carbon sinks increases. As is shown in Figure 5b, extremely expensive carbon sink prices are not conducive to the achievement of carbon neutrality. At this time, sharing the cost of carbon neutrality efforts can better balance the revenue gap between the two sides, so as to improve the overall utility of the supply chain. Therefore, when facing price fluctuations, enterprises should both make contracts and negotiate prices with carbon sink suppliers to ensure the healthy growth of the overall utility of the supply chain and the effective realization of the carbon neutrality process.

5.2. The Government

Suitable subsidies, incentives and punishments can improve the utility of the supply chain to attract companies to actively participate in the process of carbon neutrality. According to this, this section simulates the trend of supply chain’s utility and the carbon neutrality of the supply chain, which is affected by different carbon-neutral rewards, punishments and government subsidies.
As shown in Figure 6a, the utility of the whole supply chain rises with the continuous increase in government subsidies, which indicates that subsidies can well stimulate the utility growth of enterprises in the supply chain. Additionally, changes in rewards and punishments will not affect the proportional relationship between subsidies and the utility of the supply chain. When the government’s carbon-neutral rewards and punishments increase, the supply chain utility shows a trend from down to up. Combined with Figure 6a,b, it can be seen that on the one hand, the manufacturers and the retailer tend to pursue higher supply chain utility when p a is low, so they prefer to bear carbon-neutral penalties to maintain a profit-seeking mentality. However, when carbon-neutral rewards and punishments gradually increase, the supply chain is faced with a continuous decline in its utility. On the other hand, when p a is expensive enough, enterprises are more inclined to reduce their carbon emissions and expand their carbon neutral rewards by choosing higher carbon sink reserves. That is, when the rewards and punishments of carbon neutrality are low, enterprises are more inclined to bear the penalty. However, when the number of rewards and punishments is higher than a certain level, enterprises will often choose to overachieve beyond the carbon neutral target to obtain a reward. This suggests that the government should flexibly set the number of rewards and punishments according to social needs, reducing the number of rewards and punishments when it needs to promote regional economic benefits, and setting a higher number of rewards and punishments when it needs to promote the development of carbon finance and accelerate the process of carbon neutrality.
Moreover, it can also be seen in Figure 6b that an increase in government subsidies and unit carbon-neutral rewards and punishments can well promote enterprises to achieve carbon neutrality, but carbon-neutral rewards and punishments perform better. This is because rewards and punishments based on carbon emissions are more likely to influence optimal decision-making than piecework subsidies, especially when they are not too high. In consideration of this matter, the cost–revenue-sharing contract becomes the first choice for enterprises.

5.3. The Market

In reality, to increase the recycling rate of used products, retailers will take various measures to increase the enthusiasm of consumers for recycling, such as advertising, rebates and trade-ins, etc. At this time, changes in recycling will have a great impact on recycling results. Therefore, this section simulates and analyzes the change in the difference between the utility and carbon emissions of the whole supply chain when the consumer expected recovery price and the consumer recovery price sensitivity coefficient change.
As shown in Figure 7a, the utility of the whole supply chain in different models declines when the consumers’ expected recovery price increases. Among them, the performance of revenue-sharing contract and cost–revenue-sharing contract is always better than that of cost-sharing contract. While it is affected by the price sensitivity coefficient of consumer recovery, it decreases first and then increases, and the cost–revenue-sharing contract has the best performance. Therefore, when the parameters related to consumer recycling change in the market, manufacturers and retailers in the supply chain can choose the cost–revenue-sharing contract to improve the utility of the supply chain.
As can be seen in Figure 7b, when the sensitivity coefficient of consumers to the recovering price increases, the carbon offsetting situation in the supply chain shows a completely opposite trend when consumers expect the recovery price to be too high or too low. Specifically, under the same recycling price, when the consumers are not sensitive enough, the amount between carbon emissions and the carbon sink reverse is shown to monotonically decrease with the increase in the recycling price, but shows the opposite trend when the consumers’ sensitivity coefficient is high. On the one hand, when consumers have low expectations of the recycling price provided by the retailer, the increased sensitivity of consumers to the recycling price of the product will lead to an increase in the recycling quantity of the product. At this time, the product sales will remain unchanged, so the quantity of remanufactured products in the supply chain will increase, resulting in the reduction of carbon emissions. In this case, the revenue-sharing contract and cost–revenue-sharing contract are more conducive to promoting the carbon neutrality of the supply chain. On the other hand, when consumers expect a high recycling price, their sensitivity to the recycling price will lead to a decrease in the recycling amount, the gap between carbon emissions and the carbon sink reverse in the supply chain will increase, which is not conducive to the achievement of carbon neutrality. In this case, the cost-sharing contract becomes the optimal choice to pursue carbon offsetting.

6. Conclusions and Outlook

6.1. Conclusions

In order to study how enterprises in the supply chain can ensure their own utility while pursuing carbon neutrality, and how the government should set carbon trading subsidies and carbon neutrality rewards and punishments when retailers have fairness concerns, this paper studies the Stackelberg game model. The retailers’ fairness concern under the government’s carbon-neutral rewards and punishments and the closed-loop supply chain decision-making and coordination under three different coordination modes are compared and analyzed. The following conclusions are made:
(1) The cost-sharing contract and revenue-sharing contract can only achieve Pareto improvement when coordinating the utility of the supply chain, while the cost–revenue-sharing contract can achieve Pareto optimality.
(2) The cost-sharing contract performs better on carbon offsetting in the supply chain, and can always coordinate the difference between carbon sink reserves and carbon emissions in the supply chain. Therefore, while promoting the carbon neutrality process, the cost-sharing contract should be the first choice.
(3) When carbon sink prices rise, the utility of the whole supply chain shows a trend from up to down, and the difference in carbon emissions continues to decrease. Therefore, enterprises should try to negotiate the price of carbon sinks and adopt more revenue-sharing contracts when they are too expensive.
(4) Low government incentives and punishments for carbon neutrality will hinder the carbon neutrality process of the supply chain, and members in the supply chain tend to bear punishments in exchange for higher supply chain utility. Therefore, the government can promote the development of carbon finance and enhance the enthusiasm of enterprises to participate in the carbon neutrality process by appropriately increasing the rewards and punishments.

6.2. Contributions

Since existing studies of supply chain decision-making barely take account carbon neutrality and retailer’s fairness concerns along with government subsidies and carbon neutral rewards and punishments, this study has four main contributions.
Its theoretical contributions:
(1) This study extends theoretical research into carbon neutrality within the supply chain, and provides a theoretical reference for the effective accomplishment of the goal of carbon neutrality in the supply chain by comprehensively considering the carbon neutrality efforts of manufacturers, the fairness concerns of retailers, and government subsidies and rewards and punishments in the supply chain, against the background of carbon neutrality.
(2) This study theoretically proves the possibility of the fairness concern behavior of retailers under this model, and analyzes and compares the coordination effects of three contracts, thereby providing a theoretical basis for supply chain coordination under carbon neutrality.
Its practical contributions:
(1) Through numerical simulation, this study simulates the effects of retailers’ fairness concerns, government subsidies, rewards and punishments, and the degree of cost-sharing changes on the supply chain’s utility and carbon neutrality, both of which can provide practical guidance for enterprises to make decisions on carbon neutrality.
(2) This study also discusses the impact of fluctuations in the carbon sink market under government subsidies, rewards and punishments on the utility of the supply chain and the realization of carbon neutrality through numerical simulation, which provides management insight into the progress of carbon neutrality in enterprises and governments.

6.3. Limitations and Future Study

There are still shortcomings in this study that need to be further explored:
(1) In addition to fairness concerns of retailers, other aspects of the supply chain, such as manufacturers, consumers and suppliers, will also have fairness concerns and even other psychological tendencies, such as altruistic preference, which will also have a great impact on the utility of the supply chain. In future research, we will further focus on research into supply chain decision-making and coordination, while considering manufacturers’ psychological tendencies.
(2) This study only takes wholesale price, sales price, market recovery price, manufacturer recovery price and carbon sink purchase as decision variables; other decision factors such as recycling effort input, carbon emission reduction and product greenness in the supply chain should be taken into consideration in further studies.
(3) In this study, a two-stage model of one manufacturer and one retailer is constructed. However, a multi-stage supply chain involving suppliers and recyclers may be considered in future studies, as well as a model involving multiple manufacturers and multiple retailers, so as to better fit a realistic scenario.

Author Contributions

Conceptualization, Y.S. and T.G.; methodology, T.G. and Z.S.; software, Z.S.; formal analysis, T.G. and Y.S. writing—original draft preparation, T.G. and J.M.; writing—review and editing, Y.S. and T.G.; All authors have read and agreed to the published version of the manuscript.

Funding

This research was funded by Natural Science Foundation of China (Nos. 61702229), Industry-University-Research Collaboration of Jiangsu Province (Nos. BY20210775), the Key Higher Education Reform Research Project of Jiangsu University (Nos. 2021JGZD022), Postgraduate Scientific Research and Innovation Project of Jiangsu Province (Nos. SJCX21_1669), Scientific Research Projects of Jiangsu University (Nos. 20CF0108).

Institutional Review Board Statement

Not applicable.

Informed Consent Statement

Not applicable.

Data Availability Statement

Not applicable.

Conflicts of Interest

The authors declare no conflict of interest.

References

  1. Li, C.; Zhu, C.; Wang, X.; Ren, S.; Xu, P.; Xiang, H. Green finance: How can it help Chinese power enterprises transition towards carbon neutrality. Environ. Sci. Pollut. Res. 2023, 1–19. [Google Scholar] [CrossRef] [PubMed]
  2. Era, I.; Jia, M.; Yang, Q. Carbon Neutrality Strategy of Chinese Firms: Theory and Practice. Foreign Econ. Manag. 2022, 44, 3–20. [Google Scholar]
  3. Chen, J.; Zheng, Y.; Liang, S.; Wang, P.; Chen, W.; Liu, W. Review on Social Responsibility of Chinese Companies in the Context of Carbon Neutrality and Performance. J. Sociol. Ethnol. 2022, 4, 110–119. [Google Scholar]
  4. Apple Environmental Progress Report 2022. 2022. Available online: https://www.apple.com.cn/environment/pdf/Apple_Environmental_Progress_Report_2022.pdf (accessed on 19 April 2022).
  5. Zhu, J.; Dou, Z.; Yan, X.; Yu, L.; Lu, Y. Exploring the influencing factors of carbon neutralization in Chinese manufacturing enterprises. Environ. Sci. Pollut. Res. 2022, 30, 2918–2944. [Google Scholar] [CrossRef] [PubMed]
  6. Pasternack, B.A. Optimal Pricing and Return Policies for Perishable Commodities. Mark. Sci. 1985, 4, 166–176. [Google Scholar] [CrossRef]
  7. Waltho, C.; Elhedhli, S.; Gzara, F. Green supply chain network design: A review focused on policy adoption and emission quantification. Int. J. Prod. Econ. 2018, 208, 305–318. [Google Scholar] [CrossRef]
  8. Xia, X.; Li, M.; Lu, M. Comparative study on the impact of carbon emission reduction policies on authorized remanufacturing. Syst. Eng. Theory Pract. 2023, 1–19. Available online: https://kns.cnki.net/kcms/detail/11.2267.N.20230227.1914.004.html (accessed on 28 February 2023).
  9. McDonough, W. Carbon is not the enemy. Nature 2016, 539, 349–351. [Google Scholar] [CrossRef] [Green Version]
  10. Awan, U.; Sroufe, R.; Bozan, K. Designing Value Chains for Industry 4.0 and a Circular Economy: A Review of the Literature. Sustainability 2022, 14, 7084. [Google Scholar] [CrossRef]
  11. Khan, H.U.R.; Usman, B.; Zaman, K.; Nassani, A.A.; Haffar, M.; Muneer, G. The impact of carbon pricing, climate financing, and financial literacy on COVID-19 cases: Go-for-green healthcare policies. Environ. Sci. Pollut. Res. 2022, 29, 35884–35896. [Google Scholar] [CrossRef]
  12. Sedjo, R.A.; Marland, G. Inter-trading permanent emissions credits and rented temporary carbon emissions offsets: Some issues and alternatives. Clim. Policy 2003, 3, 435–444. [Google Scholar] [CrossRef]
  13. Shekarian, E. A review of factors affecting closed-loop supply chain models. J. Clean. Prod. 2019, 253, 119823. [Google Scholar] [CrossRef]
  14. Keohane, N.O. Cap and Trade, Rehabilitated: Using Tradable Permits to Control U.S. Greenhouse Gases. Rev. Environ. Econ. Policy 2009, 3, 42–62. [Google Scholar] [CrossRef] [Green Version]
  15. Stavins, R.N. Addressing climate change with a comprehensive US cap-and-trade system. Oxf. Rev. Econ. Policy 2008, 24, 298–321. [Google Scholar] [CrossRef]
  16. Benjaafar, S.; Li, Y.; Daskin, M. Carbon Footprint and the Management of Supply Chains: Insights From Simple Models. IEEE Trans. Autom. Sci. Eng. 2012, 10, 99–116. [Google Scholar] [CrossRef]
  17. Kahneman, D.; Knetsch, J.L.; Thaler, R.H. Fairness and the Assumptions of Economics. J. Bus. 1986, 59, S285. [Google Scholar] [CrossRef]
  18. Cui, T.H.; Raju, J.S.; Zhang, Z.J. Fairness and Channel Coordination. Manag. Sci. 2007, 53, 1303–1314. [Google Scholar] [CrossRef] [Green Version]
  19. Zang, L.; Liu, M.; Wang, Z.; Wen, D. Coordinating a two-stage supply chain with external failure cost-sharing and risk-averse agents. J. Clean. Prod. 2022, 334, 130012. [Google Scholar] [CrossRef]
  20. Chen, H.; Dong, Z.; Li, G.; He, K. Remanufacturing process innovation in closed-loop supply chain under cost-sharing mechanism and different power structures. Comput. Ind. Eng. 2021, 162, 107743. [Google Scholar] [CrossRef]
  21. Ma, N.; Gao, R.; Wang, X.; Li, P. Green supply chain analysis under cost sharing contract with uncertain information based on confidence level. Soft Comput. 2020, 24, 2617–2635. [Google Scholar] [CrossRef]
  22. Kuchesfehani, E.K.; Parilina, E.M.; Zaccour, G. Revenue and cost sharing contract in a dynamic closed-loop supply chain with uncertain parameters. Ann. Oper. Res. 2022, 322, 851–877. [Google Scholar] [CrossRef]
  23. Lee, D.-H.; Yoon, J.-C. Decisions on Pricing, Sustainability Effort, and Carbon Cap under Wholesale Price and Cost-Sharing Contracts. Sustainability 2022, 14, 4863. [Google Scholar] [CrossRef]
  24. Li, J.; Gong, S. Coordination of Closed-Loop Supply Chain with Dual-Source Supply and Low-Carbon Concern. Complexity 2020, 2020, 7506791. [Google Scholar] [CrossRef]
  25. Wen, D.; Mushegh, H.; Baojun, J. Consumer Fairness Concerns and Dynamic Pricing in a Channel. Mark. Sci. 2022. ahead of print. [Google Scholar] [CrossRef]
  26. Xia, X.; Chen, W.; Liu, B. Optimal production decision and financing strategy for a capital-constrained closed loop supply chain under fairness concern. J. Clean. Prod. 2022, 376, 134256. [Google Scholar] [CrossRef]
  27. Cachon, G.P.; Lariviere, M.A. Supply Chain Coordination with Revenue-Sharing Contracts: Strengths and Limitations. Manag. Sci. 2005, 51, 30–44. [Google Scholar] [CrossRef] [Green Version]
  28. Yuan, J.; Ma, J.; Yang, W. Revenue-sharing contract for supply chain under a Cap and Trade system. In Proceedings of the 2016 International Conference on Logistics, Informatics and Service Sciences (LISS), Sydney, NSW, Australia, 24–27 July 2016; pp. 1–6. [Google Scholar] [CrossRef]
  29. Ran, W.; Xu, T. Low-Carbon Supply Chain Coordination Based on Carbon Tax and Government Subsidy Policy. Sustainability 2023, 15, 1135. [Google Scholar] [CrossRef]
  30. Wang, B.; Ji, F.; Zheng, J.; Xie, K.; Feng, Z. Carbon emission reduction of coal-fired power supply chain enterprises under the revenue sharing contract: Perspective of coordination game. Energy Econ. 2021, 102, 105467. [Google Scholar] [CrossRef]
  31. Yang, H.; Chen, W. Retailer-driven carbon emission abatement with consumer environmental awareness and carbon tax: Revenue-sharing versus Cost-sharing. Omega 2018, 78, 179–191. [Google Scholar] [CrossRef]
  32. Qiao, A.; Choi, S.; Pan, Y. Multi-party coordination in sustainable supply chain under consumer green awareness. Sci. Total. Environ. 2021, 777, 146043. [Google Scholar] [CrossRef]
  33. Yin, Y.; Liu, F. Carbon Emission Reduction and Coordination Strategies for New Energy Vehicle Closed-Loop Supply Chain under the Carbon Trading Policy. Complexity 2021, 2021, 3720373. [Google Scholar] [CrossRef]
  34. Li, T.; Zhang, R.; Zhao, S.; Liu, B. Low carbon strategy analysis under revenue-sharing and cost-sharing contracts. J. Clean. Prod. 2019, 212, 1462–1477. [Google Scholar] [CrossRef]
  35. Dehghan-Bonari, M.; Bakhshi, A.; Aghsami, A.; Jolai, F. Green supply chain management through call option contract and revenue-sharing contract to cope with demand uncertainty. Clean. Logist. Supply Chain 2021, 2, 100010. [Google Scholar] [CrossRef]
  36. Bai, Q.; Chen, M.; Nikolaidis, Y.; Xu, J. Improving sustainability and social responsibility of a two-tier supply chain investing in emission reduction technology. Appl. Math. Model. 2021, 95, 688–714. [Google Scholar] [CrossRef]
  37. Wang, W.; Zhang, Y.; Zhang, K.; Bai, T.; Shang, J. Reward–penalty mechanism for closed-loop supply chains under responsibility-sharing and different power structures. Int. J. Prod. Econ. 2015, 170, 178–190. [Google Scholar] [CrossRef]
  38. Taleizadeh, A.A.; Moshtagh, M.S.; Moon, I. Pricing, product quality, and collection optimization in a decentralized closed-loop supply chain with different channel structures: Game theoretical approach. J. Clean. Prod. 2018, 189, 406–431. [Google Scholar] [CrossRef]
  39. Zhang, X.P.; Yin, G.F. Research on evaluation method of product green degree based on layered grey relation. Proceeding CSEE 2005, 25, 78–82. [Google Scholar]
  40. Sarkar, S.; Bhala, S. Coordinating a closed loop supply chain with fairness concern by a constant wholesale price contract. Eur. J. Oper. Res. 2021, 295, 140–156. [Google Scholar] [CrossRef]
  41. Yu, N.; Wang, S.; Liu, Z. Managing brand competition with consumer fairness concern via manufacturer incentive. Eur. J. Oper. Res. 2021, 300, 661–675. [Google Scholar] [CrossRef]
Figure 1. CLSC model considering rewards, punishments and subsidies.
Sustainability 15 06466 g001
Figure 2. Supply chain utility and carbon offset situation under the change in fairness concern: (a) utility of supply chain; and (b) carbon neutrality of the supply chain.
Sustainability 15 06466 g002
Figure 3. (a) Utility of the manufacturer; (b) utility of the retailer.
Sustainability 15 06466 g003
Figure 4. Supply chain utility and carbon offset situation under changes in fairness concern and in the cost-sharing coefficient; (a) utility of supply chain; (b) carbon neutrality of the supply chain.
Sustainability 15 06466 g004
Figure 5. Utility of supply chain and carbon offset situation under different unit prices of carbon sinks; (a) utility of supply chain; (b) carbon neutrality of the supply chain.
Sustainability 15 06466 g005
Figure 6. Supply chain utility and carbon emission differences under different government subsidies and carbon neutral rewards and punishments. (a) Utility of supply chain. (b) Carbon neutrality of the supply chain.
Sustainability 15 06466 g006
Figure 7. The utility and carbon offset of the supply chain under the influence of consumers’ recovery price sensitivity coefficient and consumers’ expected recovery price. (a) Utility of supply chain; (b) carbon neutrality of the supply chain.
Sustainability 15 06466 g007
Table 1. Key points of the literature.
Author(s)Carbon Policy?Green Efforts? (Carbon Trading and so on)Fairness Concern?Cost-Sharing?Revenue-Sharing?Other Contracts
Benjaafar et al. [16]
Kahneman et al. [17]
Cui et al. [18]
Zang et al. [19]
Chen et al. [20]
Ma et al. [21]
Kuchesfehani et al. [22]
Li and Gong [24]
Cachon et al. [27]
Xia et al. [26]
Yuan et al. [28]
Wang et al. [30]
Ran and Xu [29]
Yang et al. [31]
Qiao et al. [32]
Yin and Liu [33]
Bai et al. [36]
Table 2. Parameter symbols description.
ParameterMeaning ParameterMeaning
Decision variables w The wholesale priceConsumer D Actual quantity demand
p The retail price R Actual quantity recycling
t Quantity of carbon sink reserves p 1 The expected price of recycling
c r Unit price of recycling products Q Nominal quantity demanded
p r Price of recycled materials r Nominal quantity recycled
a The consumer price-sensitive coefficient
Government s Government subsidy per unit b Coefficient of recovery efforts
p a Government rewards and punishments for each unit c The coefficient of recycling price sensitivity
f Proportion of subsidy distribution in the supply chain d The coefficient of consumer green perception
Manufacturer c m Cost of new productsRetailer λ The coefficient of fairness concerns
c 1 Cost of remanufacturing I Recycling efforts
c c s Price per unit of carbon sink
e Carbon emission per unit of new productsContract β Coefficient of cost-sharing
e r Carbon emissions per unit of remanufactured products α Coefficient of revenue-sharing
Disclaimer/Publisher’s Note: The statements, opinions and data contained in all publications are solely those of the individual author(s) and contributor(s) and not of MDPI and/or the editor(s). MDPI and/or the editor(s) disclaim responsibility for any injury to people or property resulting from any ideas, methods, instructions or products referred to in the content.

