1. Introduction
As the need to combat climate change becomes more urgent, countries all around the world are looking for novel solutions to lower carbon dioxide emissions in the atmosphere. It is becoming more vital to find a balance between industrial decarbonization and economic growth [
1,
2]. The target of reaching the carbon peak in 2030 and carbon neutrality in 2060 was officially proposed by China in September 2020 at the 75th United Nations General Assembly [
3,
4]. In the following decades, this goal will likely have a significant impact on how China formulates its policies and develops socially [
5]. Based on such background, wood forest goods have gained increasing attention as the most emblematic green and sustainable products due to their enormous economic development worth and natural carbon pool function [
6]. From a worldwide standpoint, wood forest products, as a product of the wood processing sector, are crucial to the achievement of carbon reduction targets and ecological benefits for nations all over the world. According to related research, the amount of carbon retained in wood forest products worldwide is likely to increase day by day [
7]. Relevant scholars measured that the annual increment of carbon storage of woody forest products in the world accounts for about 4.7% of the increment of the forest carbon pool [
8]. At the national level, many studies have also affirmed the positive contribution of domestic wood-based forest products in addressing climate change, such as Ireland [
9], Canada [
10], the Czech Republic [
11], the United States [
12], the 15 countries of the European Community [
13], Portugal [
14], Japan [
15], Spain [
16], China [
17], and so on. In this context, the carbon science of the wood processing industry has become a research hotspot worldwide [
18].
China is the world’s greatest producer, consumer, and exporter of wood-based forest products [
18], and the traditional factors that drive the development of the wood processing sector are labor, capital, and natural resources. This is known as a “factor-driven” model [
19]. However, this approach has become more and more challenging to maintain in recent years. First off, a significant portion of China’s wood processing industry still uses conventional, high-carbon fossil fuels [
20]. Some places have a significant amount of outdated production capacity that has to be removed [
21]. It is vital to assess how well resources are being used. In addition, China’s wood industry has yet to release a carbon measurement standard, and the fundamental situation of carbon emissions in each link of the industrial chain is still unclear. It prevents wood industry enterprises from accurately and scientifically assessing the carbon emissions in the production and operation process. The lag of basic research makes it less instructive for the industry to promote carbon emission reduction and achieve the carbon peaking and carbon neutrality goals. Therefore, China’s wood processing industry needs to speed up the promotion of the carbon footprint assessment of the whole life cycle, clarify the sources of carbon emissions and the carbon emissions of the industry’s upstream and downstream, measure and evaluate the carbon emission efficiency of each period, stage, and region, and increase production efficiency. This would enable all Chinese areas to accurately establish carbon emission reduction policies, encourage energy saving and emission reduction, and implement the obligations of all parties in the chain of the wood processing industry.
In previous studies, research on this topic has focused mostly on the different stages of the wood processing industry’s “forest—processing—in use—landfill” life cycle. As Wang pointed out, the forestry sector is crucial in supporting climate change mitigation, and the mitigation potential is assessed by combining forest carbon analysis and wood product life cycle assessment (LCA) [
22]. Kayo et al. and Sedjo et al. believed that the use of logging residues as energy in the processing stage of wood forest products would not produce carbon emissions, and could replace fossil fuels to help reduce the net emissions of greenhouse gases [
15,
23]. Katia (2022) analyzed the life cycle stages of wood processing of ten Brazilian enterprises, estimated the carbon dioxide emissions, and analyzed the carbon dioxide emissions of wood production units to obtain the carbon emission efficiency of different companies [
24]. However, the majority of them concentrate on the study of carbon emissions at one or more stages of the growth and utilization of wood, and there is a dearth of research on carbon emissions throughout the whole life cycle of the sector.
It is noteworthy that the combined use of life cycle assessment and data envelopment analysis, known as the LCA + DEA method, is an emerging and growing research field [
25]. The LCA method can estimate the impact of the wood processing industry on the environment at all stages [
18,
26,
27,
28,
29,
30,
31], and the DEA method can be responsible for a comprehensive assessment of ecological efficiency [
1,
32]. At present, the popular models used for efficiency evaluation in the DEA method mainly include the super slacks-based model (super-SBM), the network slacks-based model (NSBM), the epsilon-based measure model (EBM), and so on, but there are the following problems in effectiveness research [
32]: (1) Most of them use the traditional DEA analysis method and cannot calculate the input–output efficiency of each stage; (2) Although some scholars have considered each stage of the product, they have not considered the connection mechanism between stages and the impact between stages, so they cannot accurately measure the overall efficiency of the product.
In recent years, with the introduction of the DNSBM model, its evaluation results have been more accurate than those of the previous efficiency model [
33]. By combining the life cycle method with the DNSBM model, we can better consider the dynamic impact of each stage, and can deeply analyze the overall carbon emission efficiency and the reasons for the differences in carbon emission efficiency of each stage. At present, there are few studies on the combination of the life cycle method and DNSBM model in China. The research on carbon emission efficiency is limited to the use of a single model. The academic community has not thoroughly investigated the effectiveness of the wood processing industry in reducing carbon emissions.
Therefore, based on the existing research, this paper mainly carries out further analysis on the following aspects. To calculate the carbon dioxide emissions in each stage, this study first built a carbon emission accounting model for the whole life cycle of the wood processing business. It next analyzed the main stages of the wood processing industry, and the energy consumption in each stage. A measurement model for the dynamic network relaxation of the wood processing industry was then built based on the life cycle stage analysis to assess the carbon emission efficiency of the sector. Inter-period variables were included in the model to take into account the effects of production factors in the early stage on the later period as well as the input and output indicators of each stage and intermediate goods moved between each stage. By integrating LCA with the DNSBM model, this study assesses the carbon emission efficiency of the production of the wood processing industry and can accurately assess the industry’s overall environmental impact. The research findings offer a theoretical framework and policy recommendations for the regional differentiation of carbon emission management in the wood processing industry, layout optimization in the industry, and pollution reduction.
2. Materials and Methods
2.1. Life Cycle Assessment Method
As a commonly used assessment method in the field of the environment at present, LCA includes four steps: (1) definition of purpose and scope, (2) inventory analysis, (3) impact assessment, and (4) interpretation of results. This section used the life cycle assessment method to construct a carbon emission accounting model to measure the carbon footprint of the wood processing industry [
34]. This model is preferred for analyzing emission reduction potential and emission reduction paths at different stages because it can evaluate the carbon dioxide emissions of each stage.
2.1.1. System Boundaries
The system boundary determines what processes should be included in the scope of the study. To provide a complete life cycle analysis, this paper defines the system boundary as “cradle to gate”, which covers three subsystems: raw material acquisition, on-site production, and secondary production. Furthermore, this paper established a life cycle model of the wood processing industry. The
Figure 1 displays the life cycle model.
The life cycle model of wood processing industry is divided into the following three subsystems:
- (1)
Raw material acquisition subsystem
This subsystem covers both wood raw material acquisition and accessory chemical material acquisition. The raw materials of wood-based panel mainly include natural raw materials, chemical materials, and processing residues of wood processing enterprises. Chemical materials include adhesives (urea-formaldehyde resin glue), flour, and so on [
35]. Raw materials for sawmill enterprises are mainly logs [
36]. The sources of carbon emissions involved include: carbon dioxide from fuel consumption for land preparation, logging, and transportation of wood; carbon dioxide from the application of chemical fertilizers and farmyard manure; carbon dioxide from spraying pesticides and herbicides; and carbon emissions from the production of chemical materials.
- (2)
On-site production subsystem
The major processors involved in this subsystem include wood processing plants and man-made board processing plants. The system covers its production system and auxiliary production system. The accounting boundary covers emissions from fossil fuel combustion, and emissions from the consumption of purchased electricity and heat [
37].
- (3)
Secondary production subsystem
As an extended use of forest resources, in-use forest products can be considered as a “carbon bank” for long-term carbon storage. Woody forest products can offset some of the carbon footprints and delay the radiative forcing brought on by greenhouse gas emissions. The service life of wood products is typically set at 50 years from the time they leave the factory until they are scrapped, in accordance with the guidelines established by the Intergovernmental Panel on Climate Change of the United Nations. Some of the carbon that has been stored will be released back into the atmosphere during the last step of treatment. This means that the carbon storage and emission of their products before final treatment are postponed for 50 years, so the carbon emissions caused by filling or burning during the final processing of items are not taken into account in this work.
2.1.2. Functional Units
Publicly Available Specification 2050 (PAS 2050) requires that the quality of CO
2 be reported in terms of the functional unit of the product. In this study, the functional unit of the cubic meter (m
3) was used to quantify the life cycle system performance of sawn timber and wood-based panels. By establishing quantitative criteria using the principle of trade-offs, the material and energy inputs as well as the environmental outputs that were less relevant to each aspect of the product life cycle were excluded [
38]. A “1%” trade-off principle was established, according to a study by Wang et al. and citing ISO 14040, which states that materials or energy sources that make up less than 1% of the total materials or energy sources, or CO
2 emissions from a process that contribute less than 1% to the overall result, are excluded from the system boundary.
The carbon footprint from land use change is also an important part of the carbon footprint assessment of agricultural and forestry products [
39]. While GHG emissions from indirect land use do not need to be reported, GHG emissions from direct land use change are required to be reported under PAS 2050 and the GHG Protocol. In China, planted forests account for about 70% of the production of wood-based panels and sawn timber. Since it was assumed in this analysis that wood-based raw materials come from sustainably managed forests, GHG emissions from changing land use were not taken into account.
2.1.3. Distribution Method
As their production systems are multi-output systems that are shared by various products, including forest products and fee coproducts, forest products production systems are typically multifunctional processes [
40]. An allocation method was used to divide the environmental load between multiple products, including energy flow and environmental impact, when multiple products or functions shared the same process [
41]. According to FP Innovations Wood Product Category Rules 2011 (PCR) [
42], quality is the most appropriate parameter to assign the environmental impact of woody forest products. Therefore, based on quality values, energy consumption and carbon emissions were assigned in this paper.
2.2. Carbon Footprint Calculation Methods and Measurements
The carbon footprint is the total CO
2 emissions from the entire product life cycle, plus any implied emissions from the energy that was purchased [
43]. In the quantitative model provided by PAS 2050 and the GHG Protocol based on the 2006 IPCC Guidelines for National Greenhouse Gas Inventories, the carbon dioxide emissions at each stage are usually expressed by multiplying the activity data by the corresponding emission factors [
44]. The data sources for measuring the carbon footprint of each stage in this paper are shown in
Table 1 below.
2.2.1. Stages of Raw Materials Acquisition
The energy and materials consumed during the raw material acquisition stage result in the carbon dioxide emissions listed below:
In the formula, GM denotes the carbon footprint of the raw material acquisition stage, Mi is the physical quantity of material in category i, namely the activity coefficient, Ej is the activity factor of energy in category j, αi is the emission factor of material in category i, βj is the emission factor of energy in category j, and ηij is the material and energy utilization rate in the raw material acquisition stage.
The study of Lun et al. was the source of the emission variables used in the management and harvesting of forests [
45]. Carbon emissions are produced during the acquisition of woody raw materials throughout the forest management phase of managing forest plantations and harvesting forests. This process uses fossil fuels, fertilizers, insecticides, and so on. According to PAS 2050, the production of 1 m
3 of logs during this period results in 79.5 kg of CO
2 equivalent emissions. The processing of sawn timber results in 162.18 kg of CO
2 emissions during the procurement of raw materials. Additionally, urea-formaldehyde resin glue, wheat, and other raw ingredients are needed for the manufacture of artificial boards. According to research by Jia [
35] and other academics, the CO
2 emission equivalents of chemical raw materials and other raw materials needed for plywood, fiberboard, and particleboard are 262.87, 162.51, and 67.25 kg, respectively.
2.2.2. Stages of Product Processing
The carbon footprint of the product processing stage originates from energy consumption and direct greenhouse gas emissions. On-site production mainly consumes electrical and thermal energy, and the carbon emissions generated are:
In the formula, G
p denotes the carbon footprint of the product processing stage,
Ej is the activity factor of consumed energy in category
j, and
βj is the CO
2 emission factor of the
jth type of energy. In addition, the production process has caused the loss of raw materials, and the carbon contained in these losses was also considered as emissions in this study [
51].
The input and output list of the sawn timber production process is analyzed in
Table 2. According to the quality distribution principle, the output data of the sawn timber was allocated proportionally; 70% of the output was allocated to the sawn timber, and 30% of the output was allocated to the wood waste, according to Lv’s study [
36]. The CO
2 generated from energy consumption is referred to as the carbon emission factors published by the Carbon Neutral Professional Committee.
For every 1 m
3 of sawn timber produced, 430 kg of wood waste can be recycled as fuel for the boiler [
52]. According to some studies of LCA, recycling wood waste is preferable to incineration from an environmental standpoint (Bais-Moleman et al., 2018 [
53]; Yan H et al., 2010 [
54]; Rivela et al., 2006 [
55]), though the differences are not great. Werner et al. (2010) [
56], in contrast, draw the conclusion that heat treatment is better than recycling since it reduces the chance of the waste’s contaminants spreading. Both Morris (1996) [
57] and Dodoo et al. (2009) [
58] suggest that using energy is the best course of action. Therefore, after performing the necessary calculations, sawn lumber produced 302.73 kg of CO
2 emissions after being produced and dried, and the loss of wood waste produced 922.01 kg of CO
2 emissions. Total weight was 1224.74 kg.
The carbon emissions produced during the production of plywood, fiberboard, and particleboard were estimated to be 115.94, 301.71, and 195.50 kg, respectively, according to a study by Wang et al. [
22]. Although the study took into account the recycling of processing waste, it did not take into account the losses of raw materials. As a result, the wood waste from processing losses was included in the carbon emissions in this analysis based on the pertinent energy consumption statistics supplied by Shi Lancui’s study [
46]. Plywood, particle board, and fiberboard were estimated to emit 619.44, 268.26, and 222.82 kg of CO
2, respectively, and the CO
2 emissions of particle board and fiberboard due to losses were 57.82 and 783.48 kg. The totals were 619.44, 326.08, and 1006.3 kg, respectively.
2.2.3. Stages of Secondary Production
The product’s direct greenhouse gas emissions and greenhouse gases from energy consumption during utilization stage are both recorded as G
U. Sawn wood and wood-based panels are mostly utilized in furniture, building, flooring, and other home applications. The carbon storage in the use stage can be calculated by the carbon content, as shown in the following
Table 3.
According to
Table 3, the carbon contents of 1 m
3 of sawn wood, plywood, particle board, and fiberboard were calculated to be 377.5, 301.24, 329, and 348.75 kg, respectively. After converting these values to CO
2 amounts, the amounts of carbon sequestered for each product were 1384.17, 1104.55, 1206.33, and 1278.75 kg.
In conclusion, the carbon footprint G for the product’s whole life cycle was computed as:
The carbon stock GR is entered as a negative value in Equation (3) in accordance with the specific criteria, and the net amount represents the entire contribution of the product to GHG over the course of its life cycle.
2.3. Data Envelopment Analysis Model
By combining the benefits of network DEA and dynamic DEA, Tone and Tsutsui (2014) created the DNSBM model, which not only measures the effectiveness of sub-elements but also connects various periods through carryover variables [
59]. The so-called “black box” issue of conventional DEA models, which only take into account inputs and outputs while neglecting intermediate variables and the internal operations of DMUs, is somewhat resolved by the DNSBM model. The DNSBM model can measure specifically: (1) the overall cycle efficiency of the entire observation; (2) the dynamic change of efficiency in different periods; (3) the dynamic change of efficiency at different stages.
The DNSBM model was chosen to assess the total energy efficiency in terms of carbon emissions, the energy efficiency in terms of period energy emissions, and the energy efficiency in terms of stage energy emissions of wood forest products, primarily sawn timber and wood-based panels. It is assumed that there are
n decision units in the examined system, and each decision unit DMU
j(j = 1,2,…,n) contains K(k = 1,2,…,K) interconnected nodes in period T(t = 1,2,…,T), and each node has m
k input variables and r
k output variables in period, denoted as
(i = 1,2,……,m
k, j = 1,2,……,n, k = 1,2,…,K) and
(r = 1,2,……,r
k, j = 1,2,……,n, k = 1,2,…,K), respectively. The overall efficiency is as follows:
| s.t. | |
| |
| |
| |
| |
|
Equations (5)–(7) further explore the efficiency of a single period t, the efficiency of node k, and the efficiency of node k in period t.
The efficiency of period t:
The efficiency of node k:
The efficiency of node k in period t:
The relevant parameters are defined as
Table 4:
2.4. Indicator Selection and Data Sources
In this paper, data from 2014–2020 were chosen based on data availability, and sawn timber and man-made board products were used as two typical woody forest products for research. The data were mainly obtained from the China Statistical Yearbook, Beijing Statistical Yearbook and other statistical yearbooks of 31 provinces in China, as well as the China Forestry and Grassland Statistical Yearbook (named China Forestry Statistical Yearbook until 2018). Individual missing data were filled by a smoothing function or linear interpolation. The process of how carbon is emitted from woody forest products was broken down into three stages: raw materials acquisition, product processing, and secondary production, based on the previous partitioning of the life cycle boundary and the calculation of carbon emissions.
Based on the previous analysis of the life cycle of wood forest products, this paper constructed a structural diagram of the acquisition, processing, and use of raw materials for wood forest products based on the DNSBM model, as shown in
Figure 2. Among them, period t and period t + 1 represent two sub-periods, and the periods are connected by connecting variables, thus indicating the impact of period t on the next period. In the specific calculation, we took the year as the unit of the period. The inputs and outputs of each stage are as described at
Figure 2.
(1) Stage 1 is the stage of raw materials acquisition. This study took capital and labor as input, and the wooden raw materials were desired output and connecting variable to Stage 2. Carbon emissions were taken as undesirable output. Capital input was expressed by the completion of the investment in industrial raw material forests per unit of the output. Labor input was expressed in terms of the number of workers employed per unit of output value of timber harvesting enterprises.
(2) Stage 2 is the product processing stage. This study took energy, capital, and labor as input indicators, and took values of sawn timber and wood-based panel production as output and as the connecting variable with the following stage. Carbon emissions were taken as undesirable output. Energy input was expressed by energy consumption per unit output value of the wood processing industry, and capital input was expressed by fixed asset input per unit output value of wood products processing and manufacturing. Labor input was expressed by the number of workers per unit of output value in the wood processing and wood, bamboo, rattan, palm, and grass products industry.
(3) Stage 3 is the stage of secondary production. This study took labor and energy as input indicators. Furniture manufacture was chosen as the expected output since it is the primary downstream industry for sawn wood and wood-based panels, demonstrating its economic benefits. To determine its ecological worth, the amount of carbon sequestration under the matching output was also taken as the desired output. Energy input was expressed by the amount of energy consumed per unit of output value in the furniture manufacturing industry, and labor input was expressed by the number of workers employed per unit of output value.
The investment in forest creation in each province was chosen as the inter-period carryover variable for Stage 1 because the level of afforestation and forest management in each province has an effect on the stock and supply capacity of raw materials in the following period and is less mobile. The inter-period carry-over variables of Stage 2 and Stage 3 were chosen based on the average investment in new product development projects in each province because the creation of capital is realized through the effective connection and inter-period flow of the production and R&D sectors. The input and output indicators for each stage are shown in
Table 5.
3. Results
In this paper, based on DEA-Solver Pro13.1 software, the DNSBM model was used to measure carbon emission efficiency under the whole life cycle of the wood processing industry, mainly sawn timber and wood-based panels, in 31 provinces (autonomous regions and municipalities directly under the central government) of China from 2014 to 2020. In this paper, the model under input orientation with variable returns to scale was chosen, which contained non-desired outputs. With constant output, it is possible to explore ways to optimize resource inputs. The observation sample in this study was divided into eight regions based on the geographic location and economic development, and with reference to the report released by the Development Research Center of the State Council: the Northeast, the North Coast, the East Coast, the South Coast, the middle reaches of the Yellow River, the middle reaches of the Yangtze River, the Southwest, and the Northwest. The specific regional division is shown in
Table 6.
3.1. Results of Overall Efficiency
The results of the carbon emission efficiency measurement of China’s wood processing industry under the whole life cycle are shown in
Figure 3 and
Figure 4. As a whole, the average value of carbon emission efficiency from 2014–2020 is 0.6161, which shows that there is significant room to improve the carbon emission efficiency level of China’s wood processing industry. There are 14 provinces with above an average efficiency level: Beijing, Jiangsu, Guangxi, Guangdong, Shandong, Ningxia, Tianjin, Qinghai, Zhejiang, Anhui, Jiangxi, Shanghai, Hainan, and Tibet. The fact that these provinces make up 45% of the study’s total sample shows that the wood processing industry’s carbon emission efficiency level is generally low and has not yet reached the country’s average efficiency level.
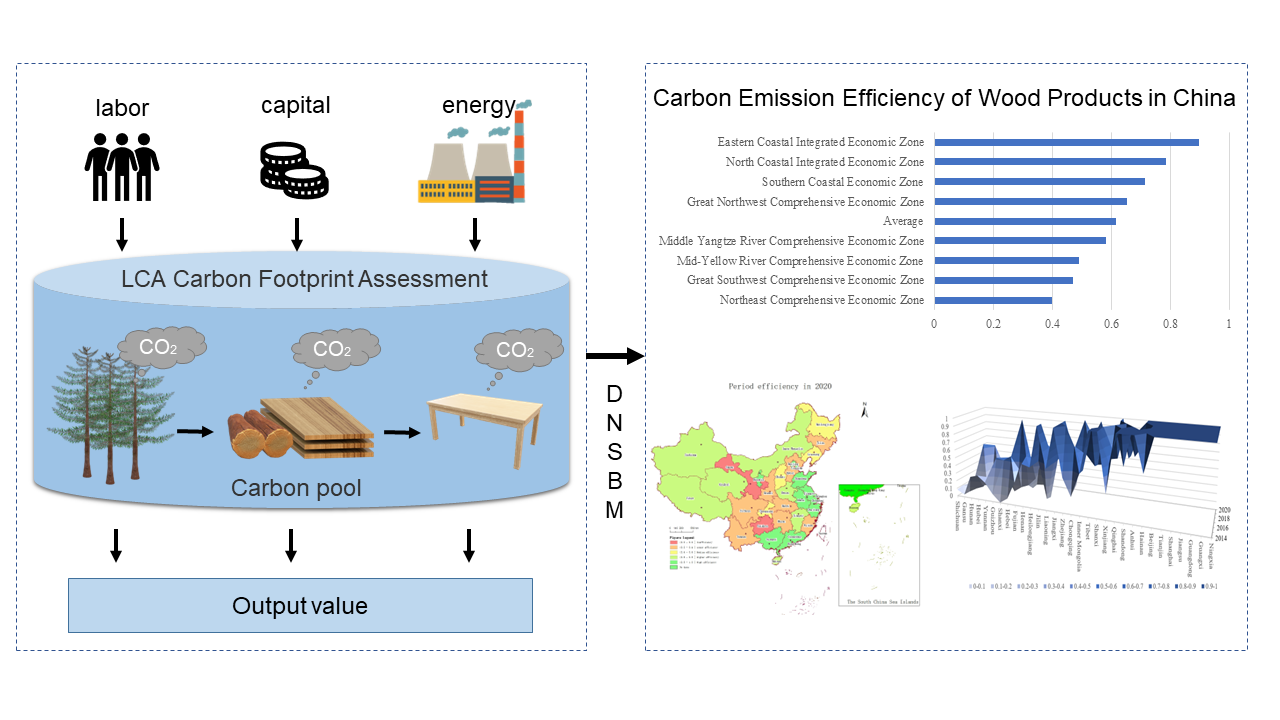
Geographically, four areas in China have efficiency values that exceed the national average. They are the Eastern, Northern, Southern Coastal, and Great Northwest Comprehensive Economic Zones, whose average values are 0.8962, 0.7851, 0.7130, and 0.6545, respectively. In addition, the efficiency value of the Middle Yangtze River Comprehensive Economic Zone is 0.5842. The carbon emission efficiency of three areas is much lower than the national average: they are the Yellow River, the Great Southwest, and the Northeast, whose average values are 0.4914, 0.4707, and 0.4010, respectively. There is an urgent need to improve the carbon emission efficiency of the regional wood processing industry.
3.2. Results of Period Efficiency
In this paper, using 2014, 2016, 2018, and 2020 as the time points, the period carbon emission efficiency distribution of the wood processing industry in 31 provinces (autonomous regions and municipalities directly under the central government) is plotted using ArcGIS software. As shown in
Figure 5, this figure can intuitively show the level of carbon emission efficiency and the laws of space–time evolution in various regions.
In
Figure 5, the carbon emission efficiency levels of wood processing industries in each period are divided into five tiers: 0.0–0.2 for low efficiency; 0.2–0.4 for lower efficiency; 0.4–0.6 for medium efficiency; 0.6–0.8 for higher efficiency; and 0.8–1.0 for high efficiency, which are indicated by the colors from red to green, respectively. The observation samples that have been at high-efficiency levels at the above time points are Beijing, Jiangsu, Zhejiang, Shandong, Guangdong, Guangxi, and Ningxia. No province has maintained a lower efficiency level. Additionally, there are significant regional differences in the evolution of the wood processing industry’s carbon emission efficiency trend. For instance, the carbon emission efficiency of Hebei and Liaoning exhibits a “U” shaped evolution. Their efficiency level in the starting year and the final year is roughly the same, and the efficiency decreases first and then increases in the middle. While Tibet and Gansu exhibit a “Ͷ” shape, their level of carbon emission efficiency first decreases, then increases and decreases.
Notably, Inner Mongolia, Shanghai, Chongqing, and Sichuan have all maintained an increasing status during the observation period. Among them, Inner Mongolia’s carbon emission efficiency increased from a lower level to a higher one, while Chongqing and Sichuan provinces’ carbon emission efficiency levels have been rising, albeit they have not yet reached a higher level.
Figure 6 shows the geometric mean of carbon emission efficiency in different regions. Only Beijing, Jiangsu, Guangdong, and Guangxi have valid DEA during the period under consideration, while Shandong, Ningxia, Tianjin, and Qinghai have close to valid DEA with 0.9677, 0.9129, 0.9127, and 0.9012, respectively. It can be seen that Guizhou province has the lowest carbon emission efficiency, at only 0.1715. This demonstrates that the level of carbon emission efficiency in China’s wood processing business varies significantly by region.
Figure 7 can give more information on regional variations.
Figure 7 uses the period efficiency value of 0.5 as the cutoff point, and divides the observed sample into two categories, upper and lower. It can be found that the average period efficiency of 14 provinces is more than 0.5, which is a level of medium or high efficiency. They are Beijing, Tianjin, and Shandong in the Northern Coastal Comprehensive Economic Zone, Shanghai, Zhejiang, and Jiangsu in the Eastern Coastal Comprehensive Economic Zone, Guangdong and Hainan in the Southern Coastal Comprehensive Economic Zone, Qinghai, Ningxia, Tibet, and Xinjiang in the Northwest Comprehensive Economic Zone, and Jiangxi and Anhui in the Middle Yangtze River Comprehensive Economic Zone. As a result, from a historical perspective, the northwest and coastal regions of China are where the wood processing sector is most developed.
3.3. Results of Staged Efficiency
Several interconnected and independent industries complete the process of developing, processing, and secondary producing wood resources. Each industry is viewed as a stage that contains multiple inputs and outputs, and the level of carbon emission efficiency at each stage will have an effect on the overall carbon emission efficiency of the wood processing industry. Some statistics for each stage in the 31 regions throughout the observation period are shown in the following
Table 7. As can be observed, Stage 3 has the highest average efficiency value whereas Stage 2 has the lowest. Stage 2 has the highest standard deviation, showing that there are significant interprovincial variances in the stage of wood processing.
Figure 8 shows the carbon emission efficiency values of the wood processing industry in each province (autonomous region and municipality directly under the central government) at three stages. Only Stage 1 of Beijing, Jiangsu, Guangdong, Guangxi, Tianjin, Shanghai, Ningxia, Stage 2 of Shandong, Anhui, and Stage 3 of Shandong, Qinghai are found to be at an efficient level. The remaining provinces (autonomous regions and municipalities directly under the central government) and other stages also have efficiency losses. Among them, most areas in the Yangtze River Midstream Comprehensive Economic Zone and the Great Southwest Comprehensive Economic Zone have significant efficiency losses at Stage 1 and Stage 2 that still require improvement.
In order to further understand the changes of carbon emission efficiency levels of each region in different years of Stage 1 and Stage 2, the three-dimensional maps of carbon emission efficiency of the two stages were drawn, as shown in
Figure 9 and
Figure 10.
Figure 9 and
Figure 10 represent the effective frontier surface as roughly the dark blue and dark green planes of the carbon emission efficiency of the wood industry in different years of Stage 1 and Stage 2 in high-efficiency regions. This allows for a clearer understanding of the differences in carbon emission efficiency levels between each province (autonomous region and municipality directly under the central government) in different years.
As can be seen from
Figure 9, Sichuan, Gansu, Hunan, Hubei, Yunnan, Guizhou, and Shaanxi provinces have lower carbon emission efficiency levels in the stage of raw material acquisition. Some provinces have high carbon emission efficiency in a certain period of time, such as Jilin in 2014, Zhejiang in 2015, and Fujian in 2016. The majority of China’s provinces (autonomous regions and municipalities directly under the central government), including Hubei, Jilin, Chongqing, Sichuan, Hunan, Guizhou, Hebei, Shaanxi, and so on, also exhibit low levels of carbon emission efficiency during the processing stage, as shown in
Figure 10. Some provinces have high carbon emission efficiency in a certain period of time, such as Heilongjiang in 2015 and Fujian in 2016.
This study uses Stage 3 as an example and created a graph of the evolution trend of energy carbon emission efficiency in order to more clearly grasp the temporal change trend of the wood processing industry in stages (see
Figure 11).
Figure 11 investigates the general evolution pattern after displaying the stacking effect of Stage 3 carbon emission efficiency values in various years. The entire carbon emission efficiency of Stage 3 exhibits a “peak-like” fluctuating rising trend. Among these years, 2015 and 2017 are key time points, and after 2016–2017, carbon emission efficiency levels have continued to rise.
4. Discussions
4.1. Analysis of Factors Affecting Carbon Emission Efficiency of Wood Processing Industry
From the perspective of regional distribution of the wood processing industry, the carbon emission efficiency is high in the coastal and northwestern regions, and relatively high in the middle reaches of the Yangtze River, while the middle reaches of the Yellow River, the Greater Southwest and the Northeast are below the national average. This might be connected to China’s aggressive promotion of Western development and the quickening transition of the eastern region [
60,
61,
62]. The coastal regions have a thriving economy, advanced technology and equipment, excellent efficiency in the use of wood resources, and attach great importance to environmental preservation [
63,
64]. In contrast, although the wood processing industry is relatively backward in the Northwest Comprehensive Economic Zone, in recent years, affected by the country’s development of the new energy industry, the region has made the most of its topographical advantages and the proportion of clean energy use is high [
65]. Meanwhile, the Yangtze River’s middle reaches have a lot of labor resources, produce a lot of woody forest products, and process wood at a high rate.
In comparison, the advantages of carbon emission efficiency in the three regions are not obvious: the middle reaches of the Yellow River, the Greater Southwest, and the Northeast Economic Zone. This might have occurred as a result of the early industrial construction’s extensive development strategy, which led to the depletion of recoverable forest resources, and the decline of ecological functions [
66,
67]. This causes the overall low carbon emission efficiency of the regional wood processing industry.
Furthermore, locations with steadily increasing carbon emission efficiency can serve as powerful benchmarks for regions with poor efficiency. Analysis of these areas reveals the following. From an input standpoint, (1) the three input indicators in Sichuan have decreased significantly, including the input value of the industrial raw material forest, the input of fixed assets under the unit output value of the wood processing industry and the input of labor force. (2) The value of labor input per unit of output value in Inner Mongolia has significantly decreased, demonstrating a significant increase in labor productivity. Additionally, it is very clear that energy consumption per unit of output value has decreased in Inner Mongolia. (3) Chongqing also showed a significant decline in labor and energy input. Therefore, while the output value and carbon emissions of the above three provinces have been increasing, the proportion of relevant input data has been reduced, resulting in a significant improvement in carbon emission efficiency.
In addition, after analyzing the areas that have maintained a good level during the observation period, we find that the major provinces that process wood include Jiangsu, Guangxi, Guangdong, and Shandong. These provinces have strong economies of scale, the highest production of wood products in the nation, and high levels of carbon sequestration. In addition, the inputs of labor, energy, and capital in these four provinces are lower than those of other large provinces with high output values. This indicates that they have achieved simultaneous improvement in scale efficiency, quality level, and overall efficiency in promoting the transformation and upgrading of the traditional wood processing industry, which has kept the carbon emission efficiency at a high level.
In contrast, some provinces, such as Beijing and Tianjin, have lower labor and energy input values than other provinces. Beijing in particular has minimal CO
2 emissions, and its input values for industrial raw material forest cultivation and employment in units are small during the observation period. Moreover, these areas produce a certain quantity of sawn timber and wood-based panels, which adds to their overall output value. Cities like Beijing and Tianjin give significant importance to overall carbon emission efficiency since they concentrate on R&D and innovative manufacturing, green industry transformation and upgrading, and improving products’ added value [
68]. To increase the overall competitive edge for the nation, the wood processing industry must change from the conventional “factor-driven” model to an “innovation-driven” model.
4.2. Analysis of Carbon Emission Efficiency from the Perspective of Whole Life Cycle
The major variances in the state of carbon emissions have emerged as a result of the significant differences in natural resource endowments, economic development levels, industrial structures, energy structures, technology levels, and other features among different regions of China. This means that different regions should capitalize on the crucial junctures and locations in the wood processing industry’s life cycle and choose regional carbon peak and carbon neutralization pathways. From the perspective of carbon emission efficiency at each stage, there are great differences in the stages of efficiency loss in different regions. For example, Fujian, Yunnan, Gansu, and other places should focus on strengthening the improvement of Stage 1 (raw material acquisition), while Hubei, Hunan, Chongqing, Sichuan, and Guizhou should comprehensively improve the wood processing efficiency of Stage 1 and Stage 2 to improve the overall carbon emission efficiency of the local wood processing industry.
4.2.1. Optimization of Carbon Emission Efficiency in Raw Material Acquisition Stage
In the analysis of carbon emission efficiency at the stage of raw material acquisition, this paper mainly considers the relevant input–output data of forest management and harvesting. By analyzing the regions with large efficiency loss in this stage, this paper finds that: (1) The construction of industrial raw material forest can ensure the supply of wood raw materials and the sustainable growth of forest resources for wood processing enterprises. However, in terms of inputs to industrial raw material forests, Gansu has higher industrial raw material forest inputs per unit of production than other provinces, especially the highest in 2015, 2017, and 2019, which results in a larger proportion of this input factor of Gansu Province. Gansu Province must concentrate on improving the efficiency of wood raw material collection and transportation. (2) In terms of labor input, the ratio of workers to output value in Shaanxi fluctuates around 13, much more than in other provinces. This causes a higher proportion of input factors and lowers Shaanxi’s overall efficiency level. (3) In terms of carbon emission output, the trend of increasing carbon emissions in Yunnan and Guizhou provinces is more significant, which pulls down their overall carbon emission efficiency level. Therefore, the above provinces should take measures in the process of obtaining wood raw materials, increase the technical input in the process of wood harvesting and transportation, and reduce the waste of wood resources and the emission of pollutants.
In this stage, the conversion of carbon storage of wood forest products and forest carbon sinks will also have an impact on the overall ecosystem. According to relevant research, sustainable forest management activities, such as setting a reasonable rotation period, can improve the carbon storage of the forest ecosystem [
69,
70]. However, the current carbon science study that incorporates the forest stage into the life cycle of woody forest products, mostly utilizes empirical models since sustainable forest management policies can only be effective in long-term production practice [
71,
72]. In terms of China, the majority of studies use the upgraded regional models from Europe and America, which will somewhat impair the accuracy of the forest carbon sink accounting. In order to integrate the deforestation stage with the in-use stage and make the life cycle analysis more thorough and scientific, different scenarios for forest management and harvesting can be drawn up in the future.
4.2.2. Optimization of Carbon Emission Efficiency in Product Processing Stage
In the analysis of carbon emission efficiency in the product processing stage, this paper focuses on the areas with large efficiency loss from the perspective of input, and finds that: (1) In terms of labor input, Hebei and Jilin have wood processing enterprises with an average of 15 workers per unit output value, which is much higher than that in other provinces and results in a larger share of their input factors. In addition, the number of workers per unit of output value is also higher in Hubei and Hunan. (2) In terms of fixed asset inputs, Hubei and Sichuan have fixed asset inputs that are significantly higher than those of the other provinces when measured by unit output value, and Guizhou’s fixed asset inputs have increased steadily since 2016 and now account for a larger proportion of its input factors, suggesting that there is more room for improvement in the province’s processing efficiency. (3) In terms of energy input, the energy consumption per unit of output value in all provinces showed a fluctuating downward trend during the observation period. Among them, Hebei province’s energy consumption per unit of output value has been declining since hitting its peak in 2015, but it is still significantly greater than that of other provinces and makes up a larger share of the input elements. Additionally, Jilin, Guizhou, Shaanxi, Hubei, and Hunan have high energy consumption per unit of output value, which contributes to their low carbon emission efficiency at this stage. These provinces should further extend the wood processing industry chain and increase the proportion of deep-processed products, so as to increase the added value of products. At the same time, these provinces should increase technical investment, improve the efficiency of wood raw materials and energy use, and actively explore the application of the circular economy model, so as to reduce resource waste and improve processing and conversion efficiency.
In addition, this paper also considers the carbon emissions of processing residues at this stage, because the processing residues will generally be immediately used as biomass energy raw materials, resulting in energy substitution effects. Some scholars have calculated the energy substitution effect of logging residues as wood fuel, according to the research of relevant scholars, the decay rate of forest cutting residues (such as stumps) in various regions varies during collection and transportation, resulting in varying carbon emission intensities [
73]. However, the process of offsetting through photosynthesis in the process of forest regeneration may take decades or even hundreds of years. Thus, inaccurate estimations could have an impact on the creation of pertinent energy policy. In the future, it will be possible to quantify the temporal value of logging residues in order to calculate the true climatic benefits of the energy substitution effect.
4.2.3. Optimization of Carbon Emission Efficiency in Secondary Production Stage
In the analysis of carbon emission efficiency in the secondary production stage, this paper considers the carbon storage effect of wood forest products in a certain period. By analyzing the overall change trend of China in the secondary production stage, it is found that 2015 and 2017, as key nodes, are closely related to the dynamics of national policies. With the launch of the 13th Five-Year Plan for ecological protection, the nation has vigorously promoted the Five-sphere Integrated Plan. Under the advocacy of the concept of green development, the country has implemented total emission control for key regions and industries. In the report of the 19th National Congress in 2017, the Communist Party of China proposed, “accelerating the establishment of a legal system and policy guidance for green production and consumption and establishing and improving the economic system of green and low-carbon circular development,” which offers policy support for reducing carbon emissions in China’s wood processing industry. In addition, as the nation started to advocate for the implementation of the capacity reduction policy at the same time, wood resources and energy are being more efficiently utilized. As the supply of raw timber becomes more scarce, prices for products derived from its further processing have gone up, and the economic output of Stage 3 has increased.
Other scholars have studied the recovery and treatment of products after reaching their service life. Some wood forest products will be directly incinerated, recycled, or used as fuel, as well as disposed of in landfill, resulting in carbon dioxide emissions. The majority of studies compute carbon emissions using the first-order attenuation approach, which is based on the exponential distribution [
44,
74]. However, complete monitoring data are still needed for an accurate calculation. The building of the life cycle database for Chinese woody forest products is still not flawless, and there are not enough precise laboratory measurement findings available. As a result, it is difficult to estimate the potential of these products to reduce emissions once they have been used. At the same time, there is a severe dearth of data needed to calculate carbon emission efficiency. The
Chinese Environmental Statistical Yearbook does not systematically monitor the labor force and fixed asset investment in the waste recycling industry, while it only provides the generation and comprehensive utilization rate of recycled trash. With the continuous strengthening of China’s investment in renewable resources, it is of great significance to establish and improve the recycling and utilization system of waste materials for promoting the green and low-carbon cycle development of the wood processing industry and helping to achieve carbon peak and carbon neutrality.
5. Conclusions
This paper systematically analyzes the life cycle stages of the wood processing industry (represented by sawn timber and wood-based panels), defines the system boundaries, and then measures the carbon footprint of China’s wood processing industry in the whole life cycle. It provides the latest data support for studying the carbon emissions of China’s wood forest products. Through the carbon footprint measurement of the life cycle, we found that wood-based panels have more carbon emissions than sawn timber, but their carbon storage is lower than that of sawn timber. Finally, using the panel data of 31 provinces in China from 2014 to 2020, the dynamic network slacks-based model was established to measure the carbon emission efficiency level of China’s wood processing industry in the whole life cycle, so as to reasonably evaluate the comprehensive benefits of wood forest products in China from the perspective of economic value and ecological value. The precise findings are listed below.
(1) The efficiency of China’s wood processing industry’s carbon emissions is on the lower end.
The comprehensive carbon emission efficiency level in most regions is relatively low, with an average of 0.6161, and there is much room for improvement. From the perspective of spatial distribution, the carbon emission efficiency of China’s wood processing industry is highest in the coastal and northwest regions, followed by the middle reaches of the Yangtze River. The middle reaches of the Yellow River, the southwest, and the northeast are the key focal points to improve the carbon emission efficiency of wood resource utilization.
(2) The carbon emission efficiency of China’s wood processing industry shows an evolutionary trend of improvement.
From the perspective of carbon emission efficiency during the period, the regions with high carbon emission efficiency in China’s wood processing industry are still the coastal and northwest regions. Analysis of the input–output data for the provinces with rising carbon emission efficiency reveals that these provinces have decreased the proportion of pertinent input data while achieving continuous improvement in output value, which has resulted in a notable improvement in carbon emission efficiency. Several provinces’ carbon emission rates display “U”, “W”, and other time evolution features. No provinces have been identified whose level of carbon emission efficiency has decreased. This demonstrates that China’s carbon emission efficiency is generally on the rise.
(3) The carbon emission efficiency of China’s woody forest products varies greatly at each stage of their life cycle.
From the perspective of stage carbon emission efficiency, the average efficiency value of Stage 3 is the highest, and the standard deviation of Stage 2 is the largest, indicating that there are large inter-provincial differences in the product processing stage. Different provinces need to improve their carbon emission efficiency through technology upgrading, green transformation, and other ways in combination while addressing their own weaknesses. At the same time, they can make full use of biomass energy such as wood processing residues and crop straw to further improve their energy self-sufficiency rate.


