Abstract
In recent years, China’s trade policy has been geared towards expanding imports and enhancing consumer welfare with a focus on sustainability. To investigate the sustainable impact of import trade on the well-being of residents, this study analyzed data from the China General Social Survey (CGSS) and import data from the General Administration of Customs of China spanning from 2003 to 2017. Using the Ordered Logit model, the study found that import trade can significantly improve residents’ happiness in a sustainable manner. The impact of import trade on happiness varied among different education and income groups, with higher education and high-income groups showing the most significant effect. Furthermore, imports from G7 countries and sustainable consumer good imports were found to have the most significant positive impact on residents’ happiness. The study suggests that import trade can promote sustainable development by upgrading product quality, increasing income, promoting employment, and improving health levels. These findings hold vital references and guiding significance for the formulation of sustainable trade policies and the realization of sustained high quality for the Chinese economy.
1. Introduction
In the context of the complex and profound changes observed in the international political and economic landscape, the importance of actively expanding imports as a means to promote sustainable economic development in China has gained increasing recognition. Since 2015, China has been vigorously promoting import development by lowering import tariffs, holding import expos and promoting the building of free-trade zones. In the past decade, China’s import volume has increased significantly, becoming the second largest importer in the world. According to customs statistics, the total value of imports and exports of goods in 2021 is 39.1 trillion yuan, an increase of 21.4 percent over 2020. Of this total, imports amounted to 17.37 trillion yuan, up 21.5 percent. Compared with 2019, China’s foreign trade imports and imports increased by 23.9 percent and 21.2 percent, respectively. China has formulated and implemented the strategy of actively expanding imports for three purposes: first, to increase consumption, adjust the economic structure, and open wider to the outside world; second, to balance China’s import and export trade and ease trade frictions and disputes; third, to promote the liberalization of global trade and promote the growth of world economy [1].
For China, the goal of actively expanding imports is to be both altruistic and self-interested. However, whether it can actually be “self-interested” is uncertain in terms of short-term economic benefits, which require systematic quantitative evaluation and analysis to measure the economic effect of China’s active import expansion strategy. At present, there is abundant literature on the economic impact of China’s import expansion strategy, most of which focuses on four aspects: the impact of import trade on domestic innovation [2,3,4,5]; the impact of import trade on economic growth [6,7]; the influence of imports on export performance of enterprises [8,9]; and the impact of import trade on domestic employment and human capital [10,11,12].
However, there are a limited number of studies examining the effect of imported goods on consumer utility or well-being and research on the direct correlation between import trade and the happiness of Chinese citizens is scarce and lacks systematic analysis. Economic development aims to improve people’s well-being and an increasing number of countries use the national happiness index as a crucial indicator for developing and assessing economic policies. With China’s new phase of opening up, could expanding its import strategy as a significant reform method enhance people’s quality of life and overall happiness? How does the importation of goods influence residents’ happiness and does the impact of import trade on well-being vary depending on consumer heterogeneity and imported product diversity? Finding answers to these inquiries is critical in objectively evaluating the economic impact of China’s import strategy and facilitating China’s high-level engagement with the rest of the world while upgrading citizens’ consumption patterns.
According to trade theory, imports can enhance consumer welfare by decreasing product prices [13,14], diversifying product choices [15,16], and enhancing product quality [1,2,3,4,5,6,7,8,9,10,11,12,13,14,15,16,17,18]. Therefore, increasing imports can satisfy the rising demand for a better life and improve people’s livelihoods and well-being. There are two main reasons why expanding imports is essential. Firstly, it is necessary to keep up with the trend of consumption upgrading as people’s income levels increase. Secondly, expanding imports can address the structural contradiction of excess supply at the low end and relatively insufficient supply at the middle and high ends in China by increasing the supply of medium- and high-end products. Additionally, importing affordable and diverse products can provide consumers with more convenient and satisfactory purchasing experiences, leading to increased happiness and satisfaction. Furthermore, various studies have reported that trade can affect residents’ income, health, employment, and other factors, which can impact their happiness to different degrees [19].
Through the process of upgrading consumption patterns since the reform and opening up, Chinese residents have generally experienced an improvement in their consumption status from “good” to “fine”. This shift towards higher quality and more sustainable consumption has been positively influenced by the expansion of imports. This has not only raised people’s awareness about sustainable consumption practices but also promoted the growth of the consumption market and the upgrading of consumption structures. Overall, these changes have built strong momentum towards achieving sustainable economic development.
Many empirical studies showed that the development of an open economy does not necessarily go hand in hand with the improvement of residents’ happiness and happiness involves all aspects of the humanities and social sciences, with very complex influencing factors. On the subject of import trade, the study of its impact on residents’ happiness and its influence mechanism will help to clarify the evaluation indicators of happiness and evaluate the economic effects of China’s import expansion strategy more objectively, such that the government can conduct more targeted social governance and pay more attention to residents’ happiness while pursuing economic development and trade expansion. To ensure that happiness is achieved, we will create a new pattern of better social governance, maintain political and social stability, and promote sustainable economic development. However, so far, the problem of how import trade affects residents’ happiness has not attracted enough attention from domestic and foreign scholars and there is a lack of systematic and in-depth analysis. Using CGSS data and the import data of the General Administration of Customs of China from 2003 to 2017, this study adopts the Ordered Logit model to systematically investigate the impact of import trade on residents’ subjective well-being, heterogeneity, and transmission channels.
There are three main contributions of the study: firstly, sustainable development aims to improve the well-being of people and society while protecting the environment and this study provides insights into how to import policies can contribute to the improvement of residents’ subjective well-being. By identifying the transmission channels through which imports can improve residents’ happiness, such as by increasing income, promoting employment, and improving health levels, policymakers can design trade policies that support sustainable development.
Secondly, the study highlights the importance of considering heterogeneity in the effects of import policies on residents’ happiness. The finding that higher education and high-income groups benefit the most from imports can inform policies aimed at promoting social equity and reducing inequality. Additionally, the finding that imports from G7 countries and consumer goods imports have the most significant positive effect on residents’ happiness can inform policies aimed at promoting sustainable consumption and production.
Finally, the study emphasizes the importance of quality upgrading in imports rather than merely increasing product diversity. By promoting imports that improve product quality, policymakers can support sustainable development by reducing waste and promoting the use of high-quality and durable goods. Overall, this study provides valuable insights into how trade policies can contribute to sustainable development by promoting residents’ subjective well-being, reducing inequalities, and supporting sustainable consumption and production.
The remainder of this paper is arranged as follows: the second section is a literature review, combing relevant literature to find the effects of imports on residents’ happiness channels. The third section is related to data description and research methods. The fourth section is dedicated to the analysis of the empirical results. Firstly, the impact of imports on residents’ happiness is tested and a robustness test is conducted for the baseline regression. Secondly, the impact of individual heterogeneity of residents and the heterogeneity of imported products is considered and finally, the mechanism of the impact of imports on residents’ happiness is tested. The fifth section is related to the main research conclusions and policy recommendations. The findings of this paper can serve as a valuable guide for China to enhance its import capabilities, discover new avenues for promoting consumer well-being and sustainable economic development, and devise and modify import trade policies as China moves towards complete openness to the global market.
2. Literature Review
Since the time of ancient Greece, people began to think about what the real essence of a good life is. At that time, scholars’ research mostly remained in philosophy and for a significant time, academic research on happiness mostly remained in psychology, sociology, medicine, and other fields. Since 1974, when American economist Easterlin proposed the “happiness paradox” [20], happiness has gradually come into the view of economists. Since then, Easterlin has led a new direction of economic research, i.e., happiness economics. Traditional economics usually takes economic growth as the policy goal while happiness economics explores the essence and core of current economic policies and regards happiness as the main goal and most important standard of government policy-making. At present, more and more countries regard the national happiness index as an important reference for formulating and evaluating public policies. Therefore, the systematic review of the existing literature on happiness economics has a certain positive significance for policy-making.
2.1. The Connotation and Measurement of Happiness
According to research, the ultimate goal of economic development is to enhance the well-being and contentment of citizens [21]. The term “happiness” encompasses various concepts like well-being, eudaimonism, and others that are commonly used to express the idea of happiness in English. Essentially, happiness represents a subjective psychological evaluation and serves as an indicator of an individual’s yearning for a better life. The level of happiness within a country can significantly influence its social and economic progress, with countries that have higher levels of happiness generally having more liberal, innovative, and inspiring social environments [21]. The concept of happiness economics proposes a broader understanding of wealth that incorporates not only the production of material wealth but also its distribution, human desire satisfaction, population factors, and natural factors. Material wealth includes not only goods and services that can be measured in monetary terms but also free natural resources such as unpolluted water and clean air that are becoming increasingly scarce. Spiritual wealth, on the other hand, encompasses knowledge that is vital for human civilization’s progress and subjective experiences such as security, happiness, satisfaction, and fairness that people experience emotionally [19].
When studying subjective well-being, scholars typically utilize the quality of life evaluation method. The World Values Survey (WVS) is an example of a study that uses this approach to assess happiness, with the survey asking respondents, “All things considered, do you feel happy with your life at present?” Participants were then asked to select a number between 1 and 4 based on their subjective feelings, with 1 indicating the least happy and 4 representing the happiest. Numerous studies and investigations have since adopted this life evaluation method [22,23,24].
The focus of this paper is on the subjective happiness of residents, which refers to their personal assessment of their living environment and overall quality of life. In order to measure this subjective well-being, the China General Social Survey posed a question that asked participants to rate their level of happiness on a scale from 1 to 5, with 1 indicating “very unhappy” and 5 indicating “very happy”. This approach quantifies the concept of residents’ subjective well-being, making it easier to analyze and interpret the results.
2.2. The Influencing Factors of Residents’ Happiness
The pursuit of happiness is a shared objective among human beings and is a crucial factor influencing individual behavior and decision-making. Contemporary research in happiness economics primarily centers on measuring subjective well-being and identifying the various factors that contribute to happiness. This is because happiness encompasses a wide range of topics within the humanities and social sciences, making it a complex and multifaceted phenomenon with a plethora of influencing factors.
Mainstream economic theories, following the ideas of Adam Smith, assert that happiness is primarily dependent on an individual’s wealth or income. Level of income is considered the primary indirect indicator of the level of welfare and policies aimed at promoting long-term economic growth are believed to improve social welfare. Need realization theory suggests that the impact of absolute income on subjective well-being arises from the fulfillment of physiological and safety needs. Empirical studies have consistently shown a positive correlation between absolute income and subjective well-being [25,26,27]. However, subsequent research has found that the relationship between absolute income and happiness is not as straightforward as previously assumed [28]. While an increase in income can satisfy basic needs, it may not necessarily fulfill higher-order needs such as love, respect, and self-actualization, and therefore, a rise in absolute income does not necessarily lead to an improvement in happiness [29].
With deepening and expanding research, scholars have found that income or wealth is not the only determinant of happiness. There are many factors affecting individual subjective happiness, which can be divided into the following aspects: macroeconomic factors (including economic growth [20], economic recession [30,31,32], income gap [33,34] and inflation [35,36]), economic policies (income distribution policies and fiscal expenditure) [37,38], behavior of market entities (employment and entrepreneurship [39], income and consumption [40,41,42]); demographic characteristics (including age, sex, health, marriage, fertility, education, and physical appearance) [43,44], and environmental factors and other factors [45]. At the same time, existing research also shows that happiness has a negative effect on factors such as employment, entrepreneurship, and consumption.
2.3. How Import Trade Affects Residents’ Happiness: Theoretical Mechanisms
After summarizing and sorting out the relevant literature, this paper divides the effect mechanism of import trade on residents’ happiness into direct effect and indirect effect.
2.3.1. Direct Effect
One of the goals of import expansion is to improve consumer welfare and meet the increasing material needs of consumers. Trade theory indicates that imports can improve consumer welfare by reducing product price [13,14], enriching product diversity [15,16], and improving product quality [17,18]. Household consumption expenditure will not only affect people’s material life, but also enrich people’s spiritual world and effectively meet people’s needs at different levels, and thus increase people’s happiness experience [42]. On the one hand, expanding imports is an inevitable choice to adapt to the trend of consumption upgrading. At present, with the increase of people’s income level, people’s increasingly strong demand for high-quality goods and services are intertwined with the structural contradiction of relatively excess supply at the low end and relatively insufficient supply at the middle and high ends in China. Under such circumstances, actively expanding imports can more effectively and directly increase medium-and high-end supply to better meet the people’s growing needs for a better life. On the other hand, importing more abundant and inexpensive commodities will bring consumers more convenient, affordable, and diversified purchasing experiences, which will cause people to be happier and more satisfied.
2.3.2. Indirect Effect
Import trade will have an impact on macroeconomic variables such as economic growth, inflation and income gap as well as micro variables such as residents’ income, health status and working pressure, which in turn will have varying degrees of impact on residents’ happiness. In general, import trade exerts indirect influence on residents’ happiness mainly through income effect, employment effect and health effect.
Income Effect
The growth of resident income is the premise and basis for ensuring the import welfare effect. Theoretically, import trade can affect the wage level of enterprise employees through various channels. One is the competitive effect. As an external source of product supply, import trade will impact the production of local manufacturing enterprises in the importing country and the intensification of market competition may lead to the shrinking of the production scale of local enterprises, reduce the demand for local labor force, and reduce the average wage level of labor force [46,47]. The second is the incentive effect. The incomplete substitution between imported products and domestic products increases the types of products that imported enterprises can use and choose, thus reducing the prices and costs of imported machinery and equipment, semi-finished products and raw materials, and ultimately promoting the increase of the production, profits, and real wages of manufacturing enterprises [48].The incentive effect can offset the negative effect of competition effect on the real wages of import enterprises to a certain extent. Therefore, the effect of imports on the wage level of manufacturing enterprises ultimately depends on which of these two channels dominates. If the former dominates, imports will have a negative effect on the wage level. If the latter dominates, imports have a positive effect on wage levels [49].
Employment Effect
Import trade has both a substitution effect and a creation effect on employment. When a country increases the import of input goods, it can not only alleviate the situation of domestic resource shortages, but also help to expand the scale of production, thus increasing the number of jobs. At the same time, input imports reduce labor input in the production process of such products, resulting in labor substitution [50]. When the relationship between imported inputs and domestic production links is complementary, imported inputs can promote employment creation [51]. Conversely, when the relationship between imported inputs and domestic production is one of substitution, imported inputs will cause employment destruction and reduce the employment scale of enterprises [52]. Employment can satisfy at least five psychological needs of individuals, including social interaction needs, collective participation needs, employment identity needs, time structure, and routine activities, and has a positive impact on individual happiness.
Health Effect
Import trade can have an impact on residents’ health through the income effect and the environmental effect. One is the income effect. Most studies have found that there is a linear growth relationship between income and health [53], and import trade will affect residents’ health through its impact on income [54]. On the one hand, the income growth effect generated by imports provides material guarantee for the improvement of residents’ food and nutrition status and medical and health care and reduces working time [55], thus improving residents’ health level. On the other hand, although trade can raise overall income levels, it can also widen income inequality within countries. The widening of the social income gap will lead to socioeconomic comparisons at the individual level, resulting in poor social relations, interpersonal distrust, alienation, and mutual suspicion [40,41,42], causing physical and mental health problems and thus reducing residents’ subjective well-being.
The second is the environmental effect. Environmental pollution will reduce people’s life satisfaction and affect residents’ health and emotions, thus leading to a decline in happiness [45]. First, trade liberalization can expand the production scale of a country. In the case of an unreasonable output structure and relatively backward production technology, increasing output will lead to increased pollution emissions [56]. Secondly, international trade plays a positive role in the industrial structure of a country, which will promote the specialization of labor division and adjust the composition of commodity production and trade. If the expanding industry is pollution-intensive, it will increase pollution emissions; otherwise, it will reduce environmental pollution [57,58]. Thirdly, emerging technologies and clean products and equipment can be spread in trade liberalization so as to improve production technology and reduce production pollution. At the same time, trade can improve residents’ living standards, thus increasing residents’ requirements for a clean environment [59,60].
At present, there are many students who focus on the influencing factors of subjective well-being in China, covering all aspects of life. However, there are few papers directly linking trade with residents’ well-being and there are no clear conclusions yet. Combined with the empirical literature on residents’ happiness in the economic field, trade may enhance happiness by improving people’s livelihood or it may have an impact on people’s livelihood and thus worsen residents’ happiness. First, imports can improve consumer welfare by reducing product prices, enriching product diversity, and improving product quality. Secondly, many studies have found that trade will have an impact on macroeconomic variables such as unemployment, inflation, and the income gap, as well as micro-variables such as resident income, employment, and work pressure. These macro- and micro-variables will have different degrees of impact on residents’ happiness. Therefore, the effect of trade on residents’ happiness is worth further study.
This study can be expanded in several ways when compared to the existing literature. Firstly, it provides a systematic examination of the impact of import trade on residents’ subjective well-being from a research perspective, thereby contributing to the research literature on evaluating the effects of trade welfare. Secondly, it comprehensively evaluates the direct and indirect effects of import trade on residents’ happiness. Thirdly, this paper considers the influence of the heterogeneity of individual characteristics and imported products on the relationship between import trade and residents’ subjective well-being, thereby expanding the economic significance of the study. Finally, to address the endogeneity of import trade, this study employs import-weighted effective exchange rates and import tariffs as instrumental variables of regional import intensity and uses various methods to ensure a scientific conclusion.
3. Materials and Methods
3.1. Data Sources and Variable Descriptions
This article utilizes data obtained from the Chinese General Social Survey (CGSS), conducted by the China Survey and Data Center Organization of Renmin University of China. The CGSS is a large-scale social survey project which employs random sampling surveys across various groups of people in mainland China. The project has two phases, with the first occurring between 2003 and 2008 and the second phase occurring from 2010 until 2019. The CGSS data is widely used for scientific research, teaching, and government decision-making. For this study, individual-level data from the CGSS was utilized from the years 2003, 2005, 2006, 2008, 2010, 2011, 2012, 2013, 2015, and 2017, totaling 96,573 samples. The survey included questions about residents’ subjective well-being, with respondents rating their happiness levels on a scale from 1 to 5, with 63 percent of respondents indicating contentment with their lives (Figure 1). The study’s main explanatory variables were import trade-related data obtained from the National Research Network database, which records import and export transaction information at the product level across China and its various regions from 2003 to 2022. Additionally, district-level data was sourced from the National Bureau of Statistics and the panel data of prefecture-level cities were obtained from the China City Statistical Yearbook from 1999 to 2018.
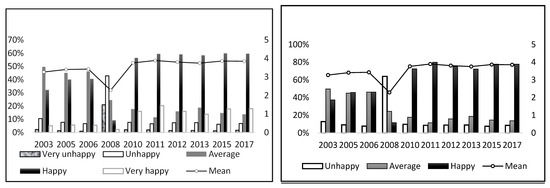
Figure 1.
Temporal variation of subjective well-being of Chinese residents (Note: In the figure on the left, 1 means very unhappy, 2 means relatively unhappy, 3 means average, 4 means relatively happy, and 5 means very happy. In the figure on the right, we merged 1 and 2 into unhappiness and 4 and 5 into happiness).
The explained variable of this study is the happiness index obtained by uniformly counting the respondents’ answers about their happiness according to the scale of 1 to 5 points. The key explanatory variable in this paper is import intensity at the regional level, which is measured by the proportion of the total value of regional imported products in regional GDP. The control variables selected in this paper include the control individual characteristics and the control area characteristics. The variables of individual characteristics are age, gender, education, marriage, household registration, party membership, employment, and income, which are commonly-used control variables in happiness-related research [61,62,63]; regional characteristic variables select for local per capita GDP, number of medical institutions, Internet usage, and employed population (Table 1).

Table 1.
Summary of descriptive statistics.
3.2. Research Methods
To study how imports affect residents’ happiness, the Ordered Logit method is utilized because the explained variable (i.e., residents’ happiness) is an ordered categorical variable. This method involves creating a latent variable that is related to the explained variable, and a regression coefficient is obtained by fitting this latent variable and the explanatory variable. To ensure that the value of the latent variable corresponds to the category of the explained variable, a critical value is set to differentiate between the categories. Here are the specific model settings:
where are to be estimated parameters and are known as cutoff points which are called “cut” in output results of the Stata. denotes the latent variable and can be expressed as follows:
where is the individual number, is the province number, is the import strength of one province, is the control variable of Individual and regional levels, and are respectively denotes the province and year fixed effects.
Suppose , is the distribution function of the standard normal distribution at constant variance [64,65,66,67,68] and zero mean value [69,70,71,72,73]. Then, the conditional probabilities of residents’ happiness are respectively expressed as:
Among them, , (K = 1, 2, 3, 4), .
Supposing obeys the normal distribution, the Ordered Probit model is obtained, in which if the random disturbance is independent from explanatory variables, the sample likelihood function and the MLE estimator can be obtained. If obeys the logistic distribution, the Ordered Logit model can be obtained.
4. Results and Discussion
4.1. Benchmark Regression Results
First of all, this study uses both Ordered Logit and Ordered Probit methods to estimate the benchmark model to test whether imports can improve residents’ happiness and the estimated results are shown in Table 2. Columns 1 and 3 in Table 2 include only individual-level control variables, while columns 2 and 4 add both individual- and region-level control variables. As can be seen from the test results, all four columns in Table 2 are significant at the 1% level, which shows that import trade can improve the happiness of residents as a whole. The possible reasons are as follows: on the one hand, actively expanding the import of high-quality products can increase medium- and high-end supply more effectively and directly, so as to better meet people’s growing needs for a better life and improve residents’ happiness; in addition, importing more abundant and inexpensive commodities will bring consumers more convenient, affordable, and diversified purchasing experiences, which will make people happier and more satisfied. Thirdly, imports may increase residents’ income and thus improve residents’ happiness by expanding enterprises’ production and export scale. Finally, importing more high-quality goods can improve the level of market competition, force domestic enterprises to improve production efficiency, accelerate product innovation, and achieve better quality and efficiency on the supply side, thus improving the happiness of residents. It can be seen from the test results in Table 2 that all the regression results show that imports can improve residents’ happiness, whether using the Ordered Logit method or the Ordered Probit method. The robustness of the empirical results in this paper is proved.
Table 2.
Results of benchmark regression.
The test results of the control variables were as follows: women, employed people, and party members were relatively happy; the regression coefficient of age is significantly negative and the square coefficient of age is significantly positive, indicating a positive U-shaped change between happiness and age; improving levels of education and income can significantly improve the happiness of residents; the happiness of urban residents is higher than that of rural residents; the longer the workweek, the lower the happiness of residents; the improvement of regional economic level and medical levels can significantly improve the happiness of residents; levels of urban employment and Internet use have reverse effects on residents’ happiness; the effect of marriage on residents’ happiness did not pass the significance test.
4.2. Test of Robustness
This section aims to test the strength of the initial findings through several approaches. Firstly, the estimation method (OLS, 2SLS, and IV-Probit) was changed to enhance the robustness of the analysis. To address endogeneity issues related to import intensity, instrumental variables such as import-weighted effective exchange rate and import tariffs were utilized. Secondly, the index of the primary explanatory variable was substituted with the logarithm of the total value of regional imports. Finally, additional control variables were introduced, including income gap (gini), environmental pollution (POULL_p), and consumer price index (CPI) (Table 3). Although the size of the regression coefficient varied, the results indicated a positive correlation between regional import intensity and residents’ happiness regardless of the estimation method used. This implies that imports can significantly enhance the well-being of residents and further confirms the robustness of the research findings.
Table 3.
Results of robustness test.
4.3. Test of Heterogeneity
4.3.1. Heterogeneity Test
In view of the differing technical content and product quality of imported products from different sources, they may have differing effects on residents’ happiness. In this paper, imported products are classified according to whether they come from G7 countries (UK, France, Germany, Japan, Italy and Canada) so as to test whether imported products have differentiated effects on happiness due to different origins. The results in columns (1) and (2) of Table 4 show that, compared with the regression coefficient of total import intensity, the regression coefficient of the import intensity of G7 countries is larger. This indicates that imports from G7 countries have a greater effect on the well-being of Chinese residents than imports from less-developed countries.
Table 4.
Analysis of heterogeneity test.
One possible reason is that G7 countries have more advanced production technology, higher service quality, more recognized product brands, and more utility for residents to obtain from the consumption of G7 countries. Since products with different uses may have different effects on residents’ happiness, we divided products into capital goods, consumer goods, and intermediate goods according to their uses, and tested the heterogeneity of imported products affecting residents’ happiness, the test results in Table 4 show that consumer goods have the largest impact effect, followed by capital goods, while intermediate goods have the smallest impact effect. This may be because compared with other products, residents can directly obtain satisfaction from the consumption of imported consumer goods, while capital goods and intermediate products indirectly affect residents’ happiness by affecting residents’ income and thus the impact on residents’ sense of consumption is relatively weak, among which compared with intermediate goods, capital goods reflect an explicit technological progress, and the improvement of social welfare is relatively stronger.
4.3.2. Individual Heterogeneity Analysis
According to the previous analysis, imports may have different impacts on people with or without higher education. We divided individuals into two groups, namely those with a college degree or above () and those without a college degree () and added an interaction item () into the model. The test results are shown in column 1 of Table 5. This indicates that with the improvement of residents’ education level, the positive impact of import on residents’ happiness becomes larger. In column 2 of Table 5, residents are divided into two groups according to their income level. Interactive items () are added to the model. The test results show that imports have a greater positive impact on the happiness of high-income groups.
Table 5.
Individual heterogeneity analysis.
The possible reasons are as follows: on the one hand, higher education and high-income groups tend to be more interested in pursuing a high-quality life. With the increase of income level, the demand for high-performance and high-quality products is increasingly strong. Driven by the lack of effective supply of high-quality products at home, this group will choose to import high-quality products to meet their daily needs. On the other hand, compared with lower-education groups, higher-education groups tend to be highly skilled workers. Some recent studies have indicated that inputs imported from abroad, such as imported capital goods and imported intermediate products, may be complementary for high-skilled workers, but substitutive for low-skilled workers [74]. Input imports lead to an increase in the demand for high-skilled workers and a decrease in the demand for low-skilled workers, which will increase the wage income of high-skilled workers and decrease the wage income of skilled workers, thus improving the happiness of high-skilled workers and decreasing the happiness of low-skilled workers.
4.4. Analysis of Mechanism
This paper divides the impact of import trade on residents’ happiness into direct effect and indirect effect. On the one hand, import trade can have a direct impact on residents’ happiness through product diversification and product quality upgrading. On the other hand, import trade indirectly affects residents’ happiness through its impact on residents’ income, employment and health status. The following paper will empirically test the effect mechanism of import trade on residents’ happiness from two aspects of direct effect and indirect effect.
4.4.1. Direct Effect
Trade theory points out that imports enrich product diversity, improve product quality and other ways to improve consumer welfare. In the following paper, the index of import product diversification and quality will be constructed first and the empirical model will be substituted to test the direct effect.
In this paper, according to the practice of Bas and Strauss-Kahn [75], we defined the number of imported products as country-product pairs, that is to say, products from different countries with the same HS code are recorded as different product categories. In this paper, the method of Hallak and Schott is adopted to calculate the quality of imported products [76]. Specifically, the product quality is measured by the residual of import quantity and import price. The product quality index at the enterprise level can be expressed as:
where is the trade value of j product imported by the enterprise, and is the value of all products imported by the enterprise.
Table 6 shows that the coefficient for evaluating the quality of imported goods is positive and statistically significant while the coefficient for the diversification of imported products is negative but lacks statistical significance. This implies that an enhancement in the quality of imported goods within the region can lead to a notable surge in the happiness of residents, whereas diversifying imported products does not have an impact on happiness. One explanation for this phenomenon is that the import of high-quality products helps balance supply and demand within the country, reduces the scarcity of high-end goods in China, and supplements local products, thereby improving the consumption structure to meet the needs of consumers for a better quality of life. Hence, enhancing the quality of imported products can significantly contribute to improving residents’ happiness. However, the negligible effect from the diversification of imported products may be attributed to China’s vast manufacturing industry, which offers a wide array of products. As a result, diversification of imported products has only a marginal influence on the happiness of residents.
Table 6.
Mechanism Test-Direct Effect.
4.4.2. Indirect Effect
We found that in addition to the above information about personal characteristics in the questionnaire of “China General Social Survey”, data on individual annual income, health status and employment status of residents could also be obtained. Columns (1), (2) and (3) in Table 7 respectively show the results of instrumental variable regression of income, health status and employment on import intensity. It can be found that imports improve residents’ income level, health status and employment status. Column (4), (5) and (6) respectively represent the regression estimation results of residents’ subjective well-being on income, health status and employment. It is not difficult to see that increasing income, health and employment enhance residents’ subjective well-being. In order to verify the hypothesis of the influence mechanism of imports on residents’ subjective well-being, annual personal income, health status, employment, and import intensity were put into the baseline regression. The estimated results were shown in column (7) of Table 7. Compared with the previous coefficient of 0.1080, the coefficient of import intensity increased to 0.1976. It can be seen that imports improve residents’ income level, employment, and health status and thus improve residents’ happiness.
Table 7.
Mechanism Test-Indirect Effect.
5. Conclusions and Policy Implications
In recent years, happiness economics have become increasingly important in the spheres of politics and academia, with a specific focus on identifying the factors that contribute to people’s subjective well-being in China. Despite this, there has been a lack of research examining the effect that trade has on residents’ happiness and sustainability. To fill this void, a study was conducted to investigate the impact of imports on household happiness. The data utilized for the study was sourced from the China General Social Survey and the General Administration of Customs of China spanning from 2003 to 2017, and the Ordered Logit model was employed. Based on the results, following is the main conclusion of the study.
First, overall, import trade significantly improved household happiness. To investigate the robustness of the estimation results, we used OLS, 2SLS, and IV-Probit models, changed the explanatory variables, and added more control variables for measurement test, all of which verified the robustness test. Second, the heterogeneity analysis found that the impact of imports on residents’ happiness showed significant differences due to the heterogeneity of individual residents (education and income levels) and the heterogeneity of imported products (product source country and import product type). The analysis of individual heterogeneity showed that import trade has a stronger effect on the well-being of higher education and high-income groups. The analysis of product heterogeneity found that the imports from G7 countries and consumer goods have a greater effect on the well-being of Chinese residents. Third, mechanism analysis revealed that the import improved residents’ happiness through direct and indirect effects. Under the direct effect, imports improved residents’ happiness through product quality upgrading, while the impact of product diversity failed to pass the significance test. Similarly, under the indirect effect, import improved residents’ happiness by improving income, health and employment.
This study can provide reference for China to further stimulate the import potential, explore the channels of consumer welfare and sustainable economic growth, and formulate and adjust China’s import trade policies. Based on the results, followings are the main policy implications.
Firstly, China should continue to adopt the strategy of expanding imports, adhere to the concept of sustainable development, introduce relevant laws and regulations, strictly regulate the quality of imported goods, reduce import tariffs and non-tariff barriers, and promote trade facilitation and the integration of institutions, rules and standards. This will not only improve people’s livelihood, but also contribute to the sustainable development of China’s economy.
Secondly, product heterogeneity showed that the import of consumer goods has a stronger positive effect on residents’ happiness. In view of this, China can carry out import trade fairs, promote the development of duty-free shops and duty-free businesses, optimize the import clearance process, support the development of cross-border e-commerce and other means to promote the import of Chinese consumer goods. While promoting the formation of a strong domestic market, we can also make better use of both domestic and international markets and resources, realize more efficient market connectivity and resource sharing, and promote sustainable economic development.
Thirdly, it is necessary to recognize the role of imports in improving income, promoting employment, and improving residents’ health. At the same time, it is imperative to adopt the positive measures to promote import competitiveness of manufacturing enterprises and import commodity structure adjustment, as a future policy point to promote sustainable economic development and improve people’s livelihood.
Finally, to prevent damage to relevant industries, it is important to take into account the realities of China’s domestic rivalry and demand for pertinent items, and to gradually advance the strategy of boosting imports. This necessitates the application of sustainable development strategy. We should actively encourage relevant industries and businesses to implement technological innovation, increase production efficiency, lower prices, and simultaneously improve product quality to increase competitiveness in the face of competition from imported foreign products.
Author Contributions
Software, S.L.; Formal analysis, M.W.; Writing—review & editing, Z.K. and S.C.; Supervision, E.E. All authors have read and agreed to the published version of the manuscript.
Funding
This research was funded by Social Science Foundation Project of Shandong Province (21CJJJ25), and the Taishan Young Scholar Program (tsqn202103070), the Taishan Scholar Foundation of Shandong Province, China.
Institutional Review Board Statement
Not applicable.
Informed Consent Statement
Not applicable.
Data Availability Statement
The datasets analyzed for this study can be found in the public domain: Chinese General Social Survey (CGSS) datebase, http://cnsda.ruc.edu.cn, accessed on 14 November 2022; and China Customs import and export database, http://gdfs.customs.gov.cn/customs/index/index.html, accessed on 15 November 2022.
Conflicts of Interest
The authors declare no conflict of interest.
References
- Li, C.D.; Lang, Y.F.; He, C.T. The economic effect of China’s import expansion strategy. J. Int. Econ. 2021, 21, 597–616. [Google Scholar]
- He, H.L.; Cai, Q.S.; Zhang, T. Import trade liberalization and Chinese firm innovation: Evidence based on the quantity and quality of firm patents. J. Econ. Q. 2021, 21, 597–616. [Google Scholar]
- Li, P.; Shi, Y.R. Import trade, Productivity and Firm Innovation. Int. Trade 2020, 447, 131–146. [Google Scholar]
- Chen, Z.; Zhang, J.; Zheng, W. Import and innovation: Evidence from Chinese firms. Eur. Econ. Rev. 2017, 94, 205–220. [Google Scholar] [CrossRef]
- Liu, Q.; Qiu, L.D. Intermediate input imports and innovations: Evidence from Chinese firms’ patent filings. J. Int. Econ. 2016, 103, 166–183. [Google Scholar] [CrossRef]
- Pei, C.H. Import trade structure and economic growth: Rules and implications. J. Econ. Res. 2013, 48, 4–19. [Google Scholar]
- Xu, G.Y. The correlation analysis of Chinese import trade structure and economic growth. Int. Trade 2007, 290, 3–7. [Google Scholar]
- Yan, Z.J.; Yu, J.P. Trade liberalization of intermediate goods and Domestic value-added of Manufacturing exports: From the perspective of value chain extension. Int. Trade 2023, 481, 124–141. [Google Scholar]
- Wei, H.; Zhang, W.Q. Import market quantity of intermediate goods, market conversion and export product quality of enterprises. Int. Trade 2022, 479, 35–52. [Google Scholar]
- Zhao, C.M.; Li, Z.; Li, H.B. The effect of active import expansion on human capital accumulation in China:long-term evidence from tariff reductions on final goods. J. Int. Econ. 2020, 392, 61–79. [Google Scholar]
- Wei, H.; Li, X.Q. Import inputs and employment changes in Chinese firms. J. Stat. Res. 2018, 35, 43–52. [Google Scholar]
- Zhan, H.; Yu, J.P. Trade policy, expanding imports and unemployment. J. World Econ. Pap. 2016, 230, 52–67. [Google Scholar]
- Amiti, M.; Dai, M.; Feenstra, R.C. How did China’s WTO entry affect US prices? J. Int. Econ. 2020, 126, 103339. [Google Scholar] [CrossRef]
- Redding, S.J.; Weinstein, D.E. Measuring aggregate price indices with taste shocks: Theory and evidence for CES preferences. Q. J. Econ. 2020, 135, 503–560. [Google Scholar] [CrossRef]
- Feenstra; Robert, C. Globalization, Markups, and US Welfare. J. Polit. Econ. 2018, 35, 43–52. [Google Scholar] [CrossRef]
- Feenstra, R.C. New product varieties and the measurement of international prices. Am. Econ. Rev. 1994, 84, 157–177. [Google Scholar]
- Hallak, J. A product-quality view of the Linder hypothesis. J. Rev. Econ. Stat. 2010, 92, 453–466. [Google Scholar] [CrossRef]
- Feenstra, R.C.; Romalis, J. International Prices and Endogenous Quality. Q. J. Econ. 2014, 129, 477–527. [Google Scholar] [CrossRef]
- Li, S.; Yan, M. Recent advances in happiness economics. J. Econ. Perspect. 2022, 742, 123–139. [Google Scholar]
- Easterlin, R.A. Does economic growth improve the human lot? Some empirical evidence. In Nations and Households in Economic Growth; David, P.A., Reder, M.W., Eds.; Academic Press: Cambridge, MA, USA, 1974; pp. 89–125. [Google Scholar]
- Veenhoven, R. Greater happiness for a greater number: Did the promise of enlightenment come true? J. Soc. Indic. Res. 2017, 130, 9–25. [Google Scholar] [CrossRef]
- Bjegovic-Mikanovic, V.; Wenzel, H.; Laaser, U. Data Mining Approach: What Determines the Wellbeing of Women in Montenegro, North Macedonia, and Serbia? J. Front. Public Health 2022, 10, 873845. [Google Scholar] [CrossRef] [PubMed]
- Wei, H.X.; Wei, M.; Xu, Y. Spillover effect of high-quality economic development: Based on empirical evidence of residents’ happiness. J. Econ. 2023, 290, 25–34. [Google Scholar]
- Pan, D.; Hu, Q.Z. The impact of subjective perceived environmental pollution on farmers’ happiness. J. Populat. Resour. Environ. 2022, 32, 119–131. [Google Scholar]
- Veenhoven, R. Is happiness relative? J. Soc. Indic. Res. 1991, 24, 1–34. [Google Scholar] [CrossRef]
- Frijters, P.; Haisken-DeNew, J.P.; Shields, M.A. Investigating the patterns and determinants of life satisfaction in Germany following reunification. J. Hum. Res. 2004, 39, 649–674. [Google Scholar] [CrossRef]
- Liu, J.Q.; Xiong, M.L.; Su, Y. Citizen Happiness in the period of economic growth: A tracking study based on CGSS data. J. China Soc. Sci. 2012, 204, 82–102. [Google Scholar]
- Jebb, A.T.; Tay, L.; Diener, E. Happiness, income satiation and turning points around the world. J. Nat. Hum. Behav. 2018, 2, 33–38. [Google Scholar] [CrossRef] [PubMed]
- Diener, E.; Suh, E.M.; Lucas, R.E. Subjective well-being: Three decades of progress. J. Psychol. Bull. 1999, 125, 276. [Google Scholar] [CrossRef]
- Kang, J.; Kim, S. Government spending news and surprise shocks: It’s the timing and persistence. J. Macroecon. 2022, 73, 103446. [Google Scholar] [CrossRef]
- Akhtar, S.; Akhtar, F.; Jahromi, M. Impact of interest rate surprises on Islamic and conventional stocks and bonds. J. Int. Money Financ. 2017, 79, 218–231. [Google Scholar] [CrossRef]
- Hegerty, S.W. Macroeconomic volatility, monetary union, and external exposure: Evidence from five Eurozone members. Baltic J. Econ. 2020, 20, 117–138. [Google Scholar] [CrossRef]
- Wang, J.F.; Yao, S.J. Income gap, effort index and subjective well-being of residents. J. Nankai Econ. 2022, 226, 3–21. [Google Scholar]
- Hirschman, A.O.; Rothschild, M. The changing tolerance for income inequality in the course of economic development: With a mathematical appendix. Q. J. Econ. 1973, 87, 544–566. [Google Scholar] [CrossRef]
- Akkoc, U.; Kizilirmak, B. Household Level Inflation Rates and Inflation Inequality in Turkey 1. J. Bus. Econ. Res. 2021, 12, 17–32. [Google Scholar] [CrossRef]
- Kragten, N.; Rözer, J. The income inequality hypothesis revisited: Assessing the hypothesis using four methodological approaches. J. Soc. Indic. Res. 2017, 131, 1015–1033. [Google Scholar] [CrossRef]
- Frijters, P.; Clark, A.E.; Krekel, C. A happy choice: Wellbeing as the goal of government. J. Behav. Public Policy 2020, 4, 126–165. [Google Scholar] [CrossRef]
- Bairoliya, N.; Canning, D.; Miller, R.; Saxena, A. The macroeconomic and welfare implications of rural health insurance and pension reforms in China. J. Econ. Ageing 2018, 11, 71–92. [Google Scholar] [CrossRef]
- Puciato, D.; Oleśniewicz, P.; Rozpara, M. Quality of Life with Respect to Physical Activity Level in the Unemployed. Sustainability 2020, 12, 4219. [Google Scholar] [CrossRef]
- Kaplan, G.; Schulhofer-Wohl, S. Inflation at the household level. J. Monet. Econ. 2017, 91, 19–38. [Google Scholar] [CrossRef]
- Orhun, A.Y.; Palazzolo, M. Frugality Is Hard to Afford. J. Mark. Res. 2019, 56, 1–17. [Google Scholar] [CrossRef]
- Wang, H.; Cheng, Z.; Smyth, R. Consumption and Happiness. J. Dev. Stud. 2017, 55, 120–136. [Google Scholar] [CrossRef]
- Becchetti, L.; Conzo, G. The Gender Life Satisfaction/Depression Paradox. Soc. Indic. Res. 2021, 160, 35–113. [Google Scholar] [CrossRef] [PubMed]
- Verma, R.; Ura, K. Gender differences in gross national happiness: Analysis of the first nationwide wellbeing survey in Bhutan. World Dev. 2021, 150, 105714. [Google Scholar] [CrossRef]
- Barrington-Leigh, C.; Behzadnejad, F. Evaluating the short-term cost of low-level local air pollution: A life satisfaction approach. Environ. Econ. Policy Stud. 2016, 19, 269–298. [Google Scholar] [CrossRef]
- Autor, D.H.; Dorn, D.; Hanson, G.H. The China Syndrome: Local Labor Market Effects of Import Competition in the United States. Am. Econ. Rev. 2013, 103, 2121–2168. [Google Scholar] [CrossRef]
- Autor, D.H.; Dorn, D.; Hanson, G.H. Trade adjustment: Worker-level evidence. Q. J. Econ. 2014, 129, 1799–1860. [Google Scholar] [CrossRef]
- Halpern, L.; Koren, M.; Szeidl, A. Imported inputs and productivity. J. Am. Econ. Rev. 2015, 105, 3660–3703. [Google Scholar] [CrossRef]
- Xu, J.Y. Import and employee income: A case study of Chinese manufacturing enterprises. J. Fin. Res. 2020, 484, 131–149. [Google Scholar]
- Rodriguez-Lopez, A.; Yu, M. All-Around Table Liberalization and Firm-Level Employment: Theory and Evidence from China. CESifo Working Paper Series No. 6710. Social Science Electronic Publishing. 2017. Available online: https://papers.ssrn.com/sol3/papers.cfm?abstract_id=3079479 (accessed on 15 November 2022).
- Meschi, E.; Taymaz, E.; Vivarelli, M. Globalization, technological change and labor demand: A firm-level analysis for Turkey. Rev. World Econ. 2016, 152, 655–680. [Google Scholar] [CrossRef]
- Harrison, A.; McMillan, M. Offshoring Jobs? Multinationals and U.S. Manufacturing Employment. Rev. Econ. Stat. 2011, 93, 857–875. [Google Scholar] [CrossRef]
- Chokshi, D.A. Income, poverty, and health inequality. JAMA 2018, 319, 1312–1313. [Google Scholar] [CrossRef]
- Blouin, C.; Chopra, M.; Van der Hoeven, R. Trade and social determinants of health. Lancet 2009, 373, 502–507. [Google Scholar] [CrossRef] [PubMed]
- Lei, Q.Y.; Qi, C.J.; Sun, C.R. Will import trade liberalization improve the health of Chinese residents? A study based on CGSS data from 2010 to 2015. Int. Trade 2021, 465, 51–69. [Google Scholar]
- Coe, D.T.; Helpman, E. International r&d spillovers. Eur. Econ. Rev. 1995, 39, 859–887. [Google Scholar]
- Wei, H.; Zhang, W.Q. Multidimensional imports and regional economic growth in China. J. Res. Econ. Man. 2020, 41, 29–46. [Google Scholar]
- Tao, A.P.; Wu, W.T. Do imports promote high-quality economic development? A supply-side perspective. J. World Econ. 2020, 316, 136–137. [Google Scholar]
- Dai, X.; Jin, B. The technological content of service trade imports and the transformation of China’s industrial economic development mode. J. Man World 2013, 240, 21–31. [Google Scholar]
- Wei, H.; Li, C.; Zhao, C.M. The origin structure of intermediate goods imports and the productivity of Chinese firms. J. World Econ. 2017, 40, 48–71. [Google Scholar]
- Tian, S. The Impact of Exchange Rate Changes on the Exports of Chinese Enterprises; China Economic Press: Beijing, China, 2019. [Google Scholar]
- Chen, Z.; Xu, D.; Liu, X.F. Demonstration Effects and Resident Well-being: Evidence from Shanghai and Shenzhen Communities. J. World Econ. 2012, 4, 79–101. [Google Scholar]
- Zhou, G.S.; Sun, P.Y. Whether internet use improves residents’ happiness—Validation based on household microdata. Nankai Econ. 2017, 3, 18–33. [Google Scholar]
- Elahi, E.; Khalid, Z.; Zhang, Z. Understanding farmers’ intention and willingness to install renewable energy technology: A solution to reduce the environmental emissions of agriculture. Appl. Energy 2022, 309, 118459. [Google Scholar] [CrossRef]
- Elahi, E.; Zhang, H.; Lirong, X.; Khalid, Z.; Xu, H. Understanding cognitive and socio-psychological factors determining farmers’ intentions to use improved grassland: Implications of land use policy for sustainable pasture production. Land Use Policy 2021, 102, 105250. [Google Scholar] [CrossRef]
- Elahi, E.; Zhang, L.; Abid, M.; Altangerel, O.; Khuda, B.; Uyanga, B.; Ahmed, U.; Han, X. Impact of balance use of fertilizers on wheat efficiency in cotton wheat cropping system of Pakistan. Int. J. Agric. Innov. Res. 2015, 3, 1470–1474. [Google Scholar]
- Ahmed, U.; Ying, L.; Bashir, M.; Abid, M.; Iqbal, M. Access to output market by small farmers: The case of Punjab, Pakistan. J. Anim. Plant Sci. 2016, 26, 787–793. [Google Scholar]
- Elahi, E.; Khalid, Z. Estimating smart energy inputs packages using hybrid optimisation technique to mitigate environmental emissions of commercial fish farms. Appl. Energy 2022, 326, 119602. [Google Scholar] [CrossRef]
- Elahi, E.; Khalid, Z.; Tauni, M.Z.; Zhang, H.; Lirong, X. Extreme weather events risk to crop-production and the adaptation of innovative management strategies to mitigate the risk: A retrospective survey of rural Punjab, Pakistan. Technovation 2022, 117, 102255. [Google Scholar] [CrossRef]
- Wang, Y.; Peng, B.; Wei, G.; Elahi, E. Comprehensive Evaluation and Spatial Difference Analysis of Regional Ecological Carrying Capacity: A Case Study of the Yangtze River Urban Agglomeration. Int. J. Environ. Res. Public Health 2019, 16, 3499. [Google Scholar] [CrossRef] [PubMed]
- Altangerel, O.; Ruimei, W.; Dash, B. Investigating the effect of job stress on performance of employees. Int. J. Sci. Technol. Res. 2015, 4, 276–280. [Google Scholar]
- Elahi, E.; Zhang, L.; Abid, M.; Javed, M.T.; Xinru, H. Direct and indirect effects of wastewater use and herd environment on the occurrence of animal diseases and animal health in Pakistan. Environ. Sci. Pollut. Res. 2017, 24, 6819–6832. [Google Scholar] [CrossRef]
- Peng, B.; Chen, S.; Elahi, E.; Wan, A. Can corporate environmental responsibility improve environmental performance? An inter-temporal analysis of Chinese chemical companies. Environ. Sci. Pollut. Res. 2021, 28, 12190–12201. [Google Scholar] [CrossRef]
- Hummels, D.; Jørgensen, R.; Munch, J. The wage effects of offshoring: Evidence from Danish matched worker-firm data. Am. Econ. Rev. 2014, 104, 1597–1629. [Google Scholar] [CrossRef]
- Bas, M.; Strauss-Kahn, V. Does importing more inputs raise exports? Firm-level evidence from France. Rev. World Econ. 2013, 150, 241–275. [Google Scholar] [CrossRef]
- Hallak, J.C.; Schott, P.K. Estimating Cross-Country Differences in Product Quality. Q. J. Econ. 2011, 126, 417–474. [Google Scholar] [CrossRef]
Disclaimer/Publisher’s Note: The statements, opinions and data contained in all publications are solely those of the individual author(s) and contributor(s) and not of MDPI and/or the editor(s). MDPI and/or the editor(s) disclaim responsibility for any injury to people or property resulting from any ideas, methods, instructions or products referred to in the content. |
© 2023 by the authors. Licensee MDPI, Basel, Switzerland. This article is an open access article distributed under the terms and conditions of the Creative Commons Attribution (CC BY) license (https://creativecommons.org/licenses/by/4.0/).