Article

Effect of Codend Design and Mesh Size on the Size Selectivity and Exploitation Pattern of Three Commercial Fish in Stow Net Fishery of the Yellow Sea, China

1
Fisheries College, Ocean University of China, Qingdao 266003, China
2
SINTEF Ocean, Fishing Gear Technology, Willemoesvej 2, 9850 Hirtshals, Denmark
3
The Norwegian College of Fishery Science, UiT The Arctic University of Norway, N-9037 Tromsø, Norway
4
DTU Aqua, Technical University of Denmark, 9850 Hirtshals, Denmark
*
Author to whom correspondence should be addressed.
Sustainability 2023, 15(8), 6583; https://doi.org/10.3390/su15086583
Submission received: 17 March 2023 / Revised: 11 April 2023 / Accepted: 12 April 2023 / Published: 13 April 2023
(This article belongs to the Section Sustainable Management)

Abstract

:
To address the issue of minimum mesh size regulations of the stow net fishery for croaker species, we tested and compared the size selectivity and exploitation pattern for diamond- and square-mesh codends with mesh sizes 35, 45 and 55 mm for little yellow croaker (Larimichthys polyactis), silver croaker (Pennahia argentata), and flower croaker (Nibea albiflora) in the Yellow Sea, China. Our results showed that the legal codend (35 mm diamond-mesh) was inadequate to protect the juvenile croaker species because more than 75% of undersized individuals were retained, and the discard ratios were as high as approximately 60%. Irrespective of mesh shape, increasing the codend mesh sizes could significantly improve the size selectivity and exploitation pattern of croaker species. Between codends with the same mesh size, the square-mesh codends had higher size selectivity than diamond-mesh codends. Based on results, the 55 mm square-mesh codend was recommended for rational exploitation of croaker stocks. This study can provide feasibility and insight for the enforcement and reform of management strategies for sustainable fishing in Chinese stow net fisheries.

1. Introduction

China is the greatest contributor to global marine capture fisheries, and stow net fishery is one of the most socio-economically important fisheries in the Chinese Seas. Stow net fisheries started in the 1950s in China. Over the past decades, stow net fisheries have developed rapidly because of their attributes of low energy consumption, low cost and labor requirements, operation flexibility, and high economic efficiency. These fisheries provide an important source of income and seafood for millions of people employed in capture fisheries along the entire coast of China [1,2]. In 2020, the total fishing production of stow net fisheries was 1,035,779 t, accounting for 10.9% of Chinese national landings [3]. Nowadays, with the development of environmentally friendly fishing gear and methods, stow nets, belonging to “low impact and fuel efficient” fishing gear, are receiving high priority from fishery management authorities [4].
Stow nets are passive fishing gear, usually deployed in areas with strong currents or large tidal flows, with their orientation determined by the direction of the water current so as to catch fish that drift into the nets [5]. Fishing activities are often conducted in the spring and autumn, and target species highly vary between different fishing seasons and areas. Crustacean species, mainly crabs and shrimps, comprise major catches in the spring in the Yellow Sea of China. In the autumn, little yellow croaker (Larimichthys polyactis), silver croaker (Pennahia argentata), and flower croaker (Nibea albiflora) become the dominant target species. These croaker species are among the most economically important fish species in China and are highly preferred by consumers because of their rich nutrition and good taste. Before the 2010s, the annual total landing of little yellow croaker and silver croaker showed an increasing trend and rose to 406,868 and 131,026 t in 2010, respectively [6]. Before 2012, the flower croaker production stabilized at approximately 85,000 t. However, the annual landing of these three species has dramatically declined by 20–30% in varying degrees in the recent decade [7], indicating the stock decline of these traditionally important species as demonstrated by other studies [8,9].
The decline in fish stocks can be closely linked to the exploitation pattern of fisheries, especially fishing intensity and the size selectivity and catch efficiency of fishing gear. It is widely acknowledged that extensive use of fishing gear with poor selectivity is one of the primary drivers contributing to the overexploitation of fishery resources [10,11,12,13,14]. As the main fishing gear for harvesting croaker species, before legislation for stow net fisheries, the commonly used stow nets had small mesh sizes (17–20 mm) in the codend, which was considered nonselective [15]. A substantial number of juvenile fish was caught and landed by local fishers, especially in the abundant fishing ground, resulting in recruitment and growth overfishing. From the long-term perspective, the indiscriminate and intense fishing of juvenile fish has led to biological characteristics changes in the croaker population, marked by individual miniaturization, low age, and early sexual maturity, which reduces the reproductive potential of the fish population, affects the resilience of stocks, and restrains the sustainability of the fishery [16,17,18]. With more attention paid to seafood security and resource conservation, the sustainable development of these high-quality commercial fish has raised concerns of coastal communities and management departments responsible for the Yellow Sea.
To protect fishery resources, the minimum mesh size (MMS) regulation, in which the stow net fisheries in the Yellow Sea should have MMS of 35 mm in the codend (diamond-mesh), was implemented by the Chinese Ministry of Agriculture (MOA) in 2014. Later, the minimum landing size (MLS) for the croaker species was promulgated and implemented by the MOA in 2018. The little yellow croaker and silver croaker are subjected to the MLS of 15 cm in total length, while the flower croaker is 18 cm. However, the enforcement and effectiveness of the MMS and MLS regulations are widely controversial and criticized [19]. The MMS was stipulated for the overall stow net fisheries but not for specific target species. Although it may provide some protection for small-sized crustacean species, the size selectivity of relatively large-sized fish species, such as croaker species, is considered poor [15,20]. In this case, the MMS regulation and the MLS of the croaker species cannot greatly match and play synergistic roles. Thus, in fishing practice, how to deal with the large number of undersized croaker individuals retained in the codend poses a big challenge for fishers. Some fishers still tend to land undersized individuals in the case of lax supervision. For fishers highly compliant with the relevant management regulations, the catch classification would create a tremendous workload for them; meanwhile, the long exposure time of juvenile fish onboard would significantly increase their discard mortality, which could be unfavorable for the sustainability of fishery resources. More importantly, the newly issued 14th Five-Year Plan for National Fisheries Development of China stressed that strengthening fishing gear management is a crucial mission for reforming fishery management and called for improved technical guidelines for mesh size limits [14]. However, the selectivity-related studies of stow net fisheries are limited, especially for important species (e.g., croaker species). To address the issue mentioned above, firstly, the effects of the current MMS on the size selectivity and exploitation pattern of croaker species need to be fully evaluated to clearly reveal and perceive the defects of the current regulations. Secondly, it is necessary to conduct systematic scientific research from the perspective of gear selectivity to fill the knowledge gap of fishers and management departments and develop evidence-based and effective management solutions.
The size selection of the stow nets is mainly achieved by the codend, in which codend mesh size and shape are the main technical features affecting the selectivity of stow net catches [15,21]. Increasing the codend mesh size has been proved to be a simple and effective measure to improve the size selectivity of target species with specific length classes [20]. Li et al. [22] demonstrated the square-mesh codend had better size selectivity than diamond-mesh codend for some specific species, such as Ammodytes personatus and Amblychaeturichthys hexanema. The positive outcomes of these studies suggest that modifying codend mesh size and shape may effectively improve the size selectivity of croaker species.
In this study, we intended to investigate how the size selectivity and exploitation pattern of croaker species would be affected by the mesh sizes and shapes used in the stow net codends. We tested six codends with different mesh sizes (35, 45, and 55 mm) and shapes (diamond and square), with the legal codend (35 mm diamond-mesh) as the baseline. Our study focused on the following research questions:
(1)
How are the selective properties of the legal codend for the three croaker species?
(2)
To what extent can the size selectivity and exploitation pattern of the three croaker species be improved by modifying mesh sizes and shapes in the codend?
(3)
What is the optimal codend modification for improving the size selectivity and exploitation pattern of the three croaker species in stow net fisheries in the Yellow Sea?

2. Materials and Methods

2.1. Experimental Survey

Sea trials were conducted in the coastal waters of the Yellow Sea, China, from 6–18 October 2021 (Figure 1). The study area is a traditional fishing ground for stow net fisheries. The substrate type of study area is sand–muddy, and the depth ranges from 20 to 30 m. A local commercial fishing vessel, “Lurongyuyang 62705”, was used during the sea trials with a speed of approximately 3.0 knots. Ten trials were carried out by researchers in collaboration with experienced local fishers, following the regular fishing strategies.
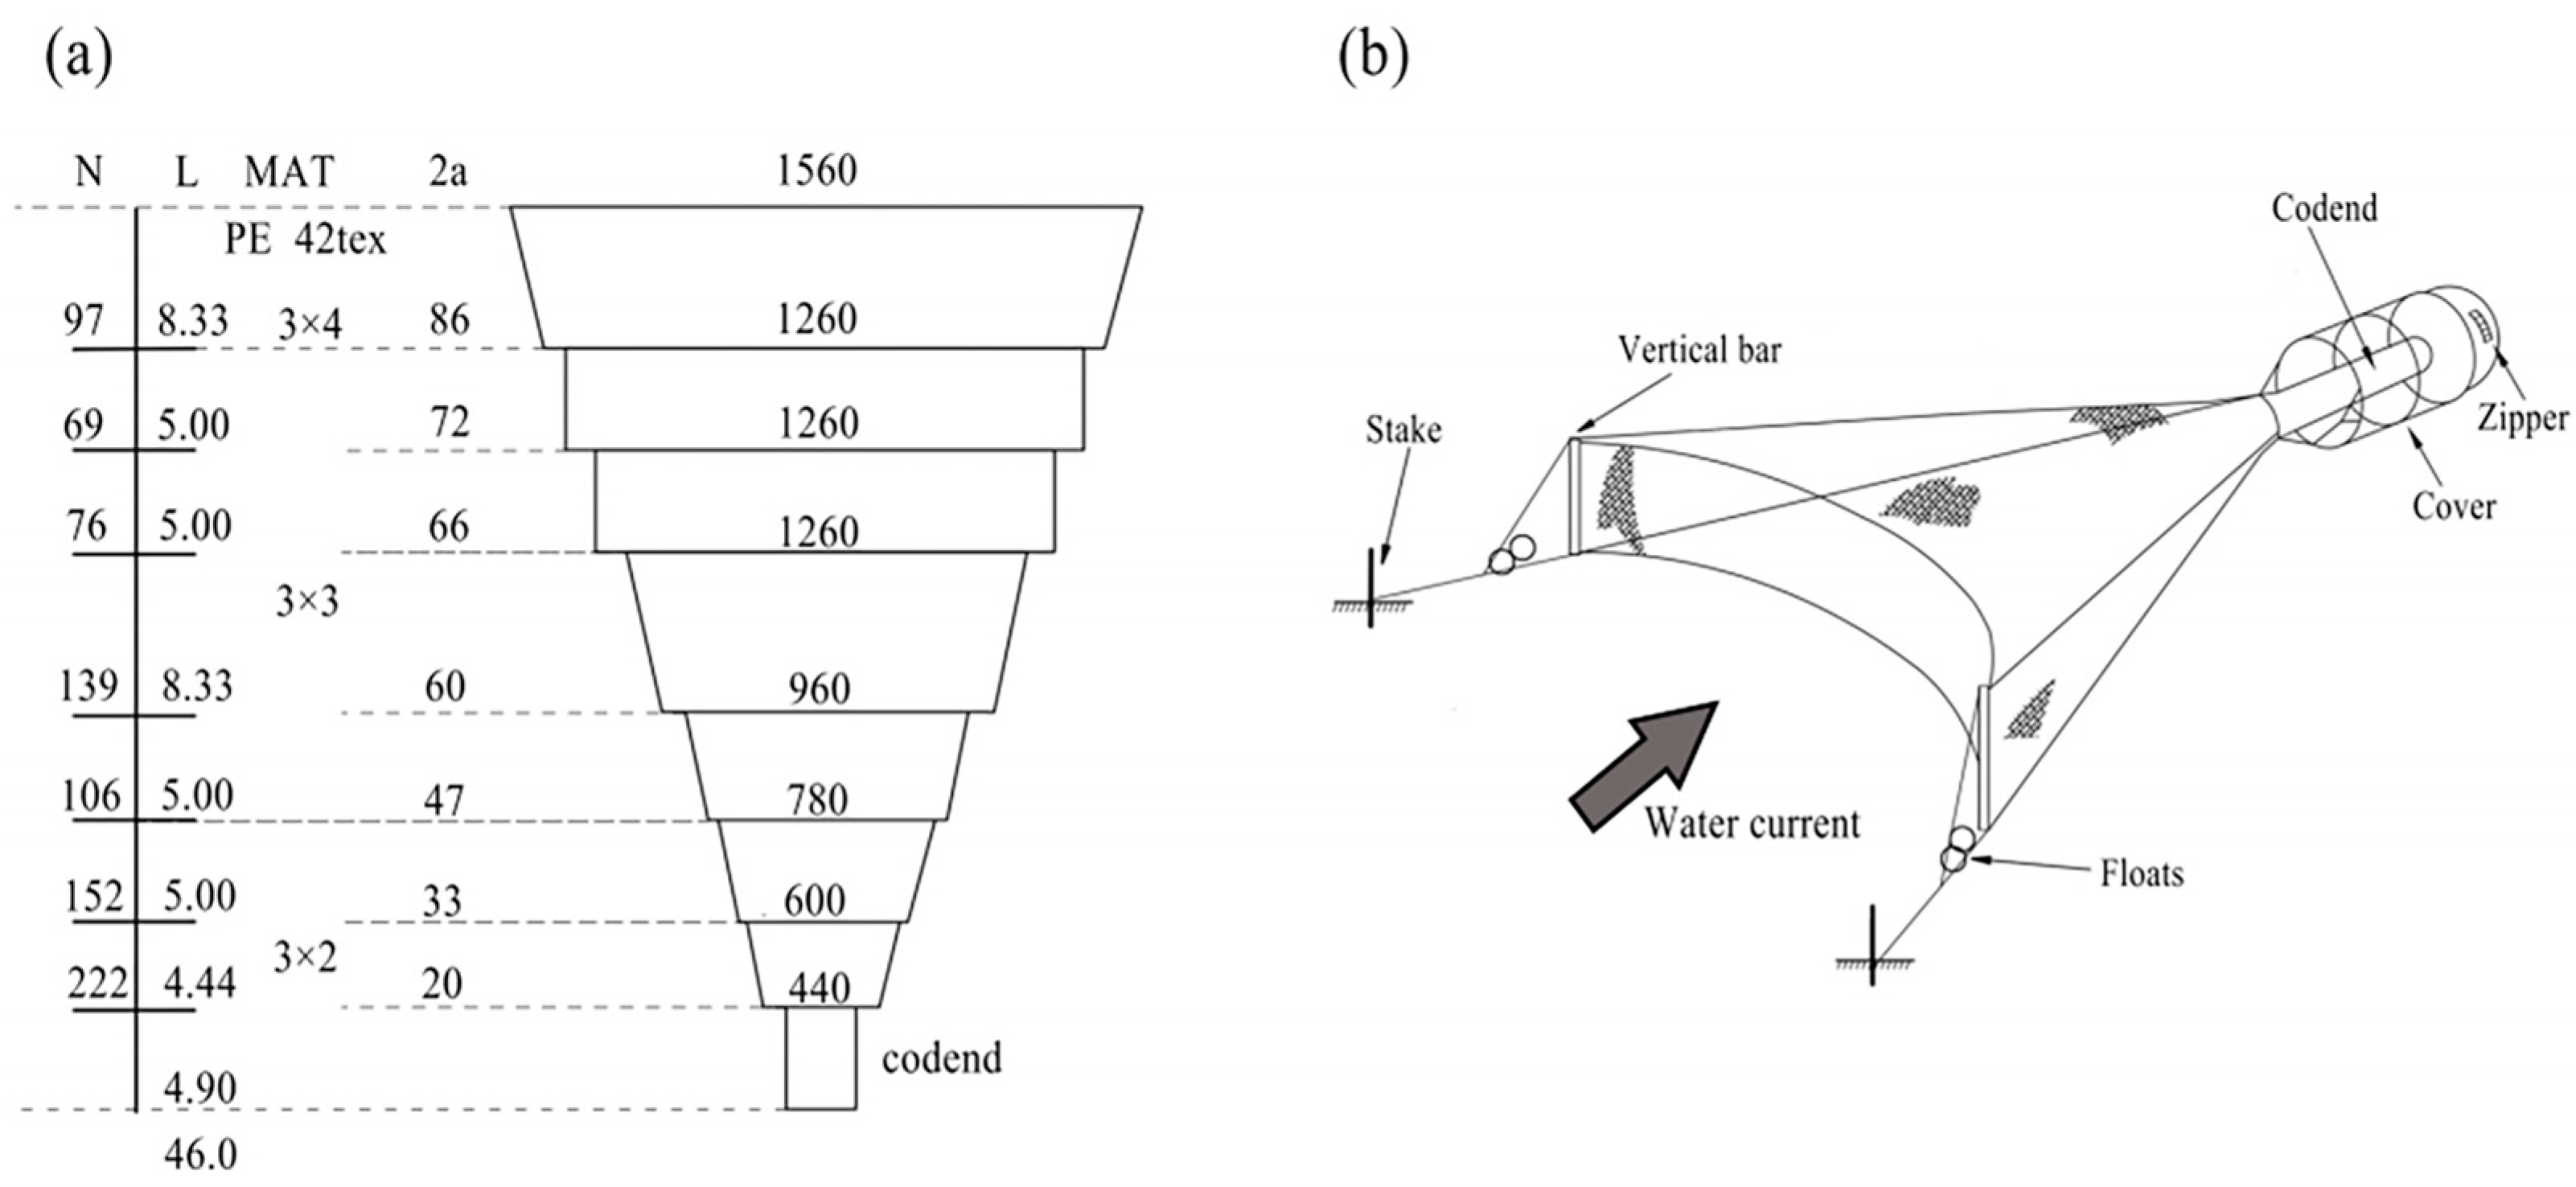
Stow nets relied on two vertical bars mounted on the left and right sides of the net mouth to achieve vertical expansion. Two stakes were used to fix the stow nets and provided horizontal expansion tension of the net mouth (Figure 2). Floats were mounted on the cross ropes to increase floatability. The configurations of stow nets resemble a trawl, consisting of net body and codend (Figure 2). The principal dimensions of stow nets were 56.3 × 46.0 m (net mouth circumference × net length), and the material of nets was polyethylene, which was typical for commercial stow net fisheries. The mesh sizes gradually decrease from the net mouth to the rear part of the stow nets. In this study, six types of codends with different stretched mesh sizes (35, 45, and 55 mm) and mesh shapes (diamond and square) were tested. According to their mesh sizes and shapes, these codends were termed as D35, D45, D55, S35, S45, and S55, respectively. All the tested codends were identical to the commercial codend in terms of twine diameter, material, and dimensions. The mesh number in the circumference and length direction would reduce with an increased mesh size to keep the circumference and length constant. For the same mesh size, the square-mesh codends have more and fewer mesh numbers than diamond-mesh codends in the length and circumference directions, respectively (Table 1). To collect the fish escaping from the tested codends, the covered codend method was used in our experiments. The dimension of the cover was 1.5 times of the tested codend [23]. The cover was made of polyethylene netting with a nominal mesh size of 15 mm (Table 1), which was considered nonselective. To avoid the masking effect, three plastic hoops (diameter of 0.85 m) were mounted on the front, middle, and back part of the cover at intervals of 1.6 m from each other (Figure 2). A zipper was mounted to the cover net to facilitate the collection of the codend and cover catch.
A total of six units of stow nets were deployed, one for each type of test codends. The stow nets were placed approximately 200 m apart to ensure independence. All stow nets were hauled up in the morning after approximately 24 h of soaking time. Catches from each compartment, codend and cover, were collected separately for each tested codend. All catches of the little yellow croaker, silver croaker, and flower croaker were sorted, subsampled (if needed), and frozen for measurement in the laboratory. Each individual was measured for total length to the nearest millimeter and weight to the nearest 0.01 g.

2.2. Size Selectivity Analysis

The size selectivity of each tested codend for each target species was analyzed separately using the method described below. Due to the covered codend method used in the experiments, the catch data was considered a binomial distribution, as the individuals were either retained by the codend or the cover. For each codend, the retention probability r j l of specific species with length l in haul j can be calculated by the catch number of the codend and the total number. However, the value of r j l could be expected to vary between hauls for the same codend [24]. In this study, our main interest was the average size selection over hauls because this would provide information about the consequences of the size selection process when a specific codend was applied in the fishery. Thus, data were pooled from different hauls to estimate the average value of r j l , assuming it could represent how the codend would perform in a commercial fishery [25,26,27]. The average retention probability can be expressed as r a v l , v , where vector v consists of the selectivity parameters of some parametric models. To estimate the parameter values that make the experimental data most likely to be observed, we minimized the following expression:
j = 1 m l n R j l q R j × ln r a v l , v + n E j l q E j × ln 1.0 r a v l , v
where the outer summation is over the m hauls conducted, and the inner summation is over length class l. n R j l and n E j l are the number of fish captured by the tested codend and cover, respectively. q R j and q E j represent the sub-sampling ratios of individuals length measured from the codend and cover, respectively.
Four basic models, Logit, Probit, Gompertz, and Richards, were chosen as candidates to describe r a v l , v . For the first three models, vector v consists of two selective parameters, L50 (50% retention length) and SR (selection range; =L75–L25). For the Richards model, an additional parameter (1/δ) is required to describe the asymmetry of the size selection curve. The formulas for these selection models can be found in Wileman et al. [23].
The ability of each model to fit the experimental obtained data can be evaluated based on the corresponding p-value, which expresses the likelihood of obtaining at least as big a discrepancy between the fitted model and the observed experimental data by coincidence. A p-value larger than 0.05 implies that the model can describe the data sufficiently well [23]. Selection between models was based on comparing Akaike information criterion (AIC) values, with the model with the lowest value being the preferred [28].
Once the size selection model was identified, a double bootstrap method was applied to estimate the confidence intervals (CIs) for the size selection curves and the corresponding parameters by accounting for between-haul and within-haul variations [25,29]. We conducted 1000 bootstrap repetitions to obtain Efron percentile 95% CIs [30] of the selection curves and its parameters.
To compare the size selectivity of codends with different mesh sizes and mesh shapes, the length-dependent difference in retention probability Δ r l was estimated as follows:
Δ r = l r 2 l
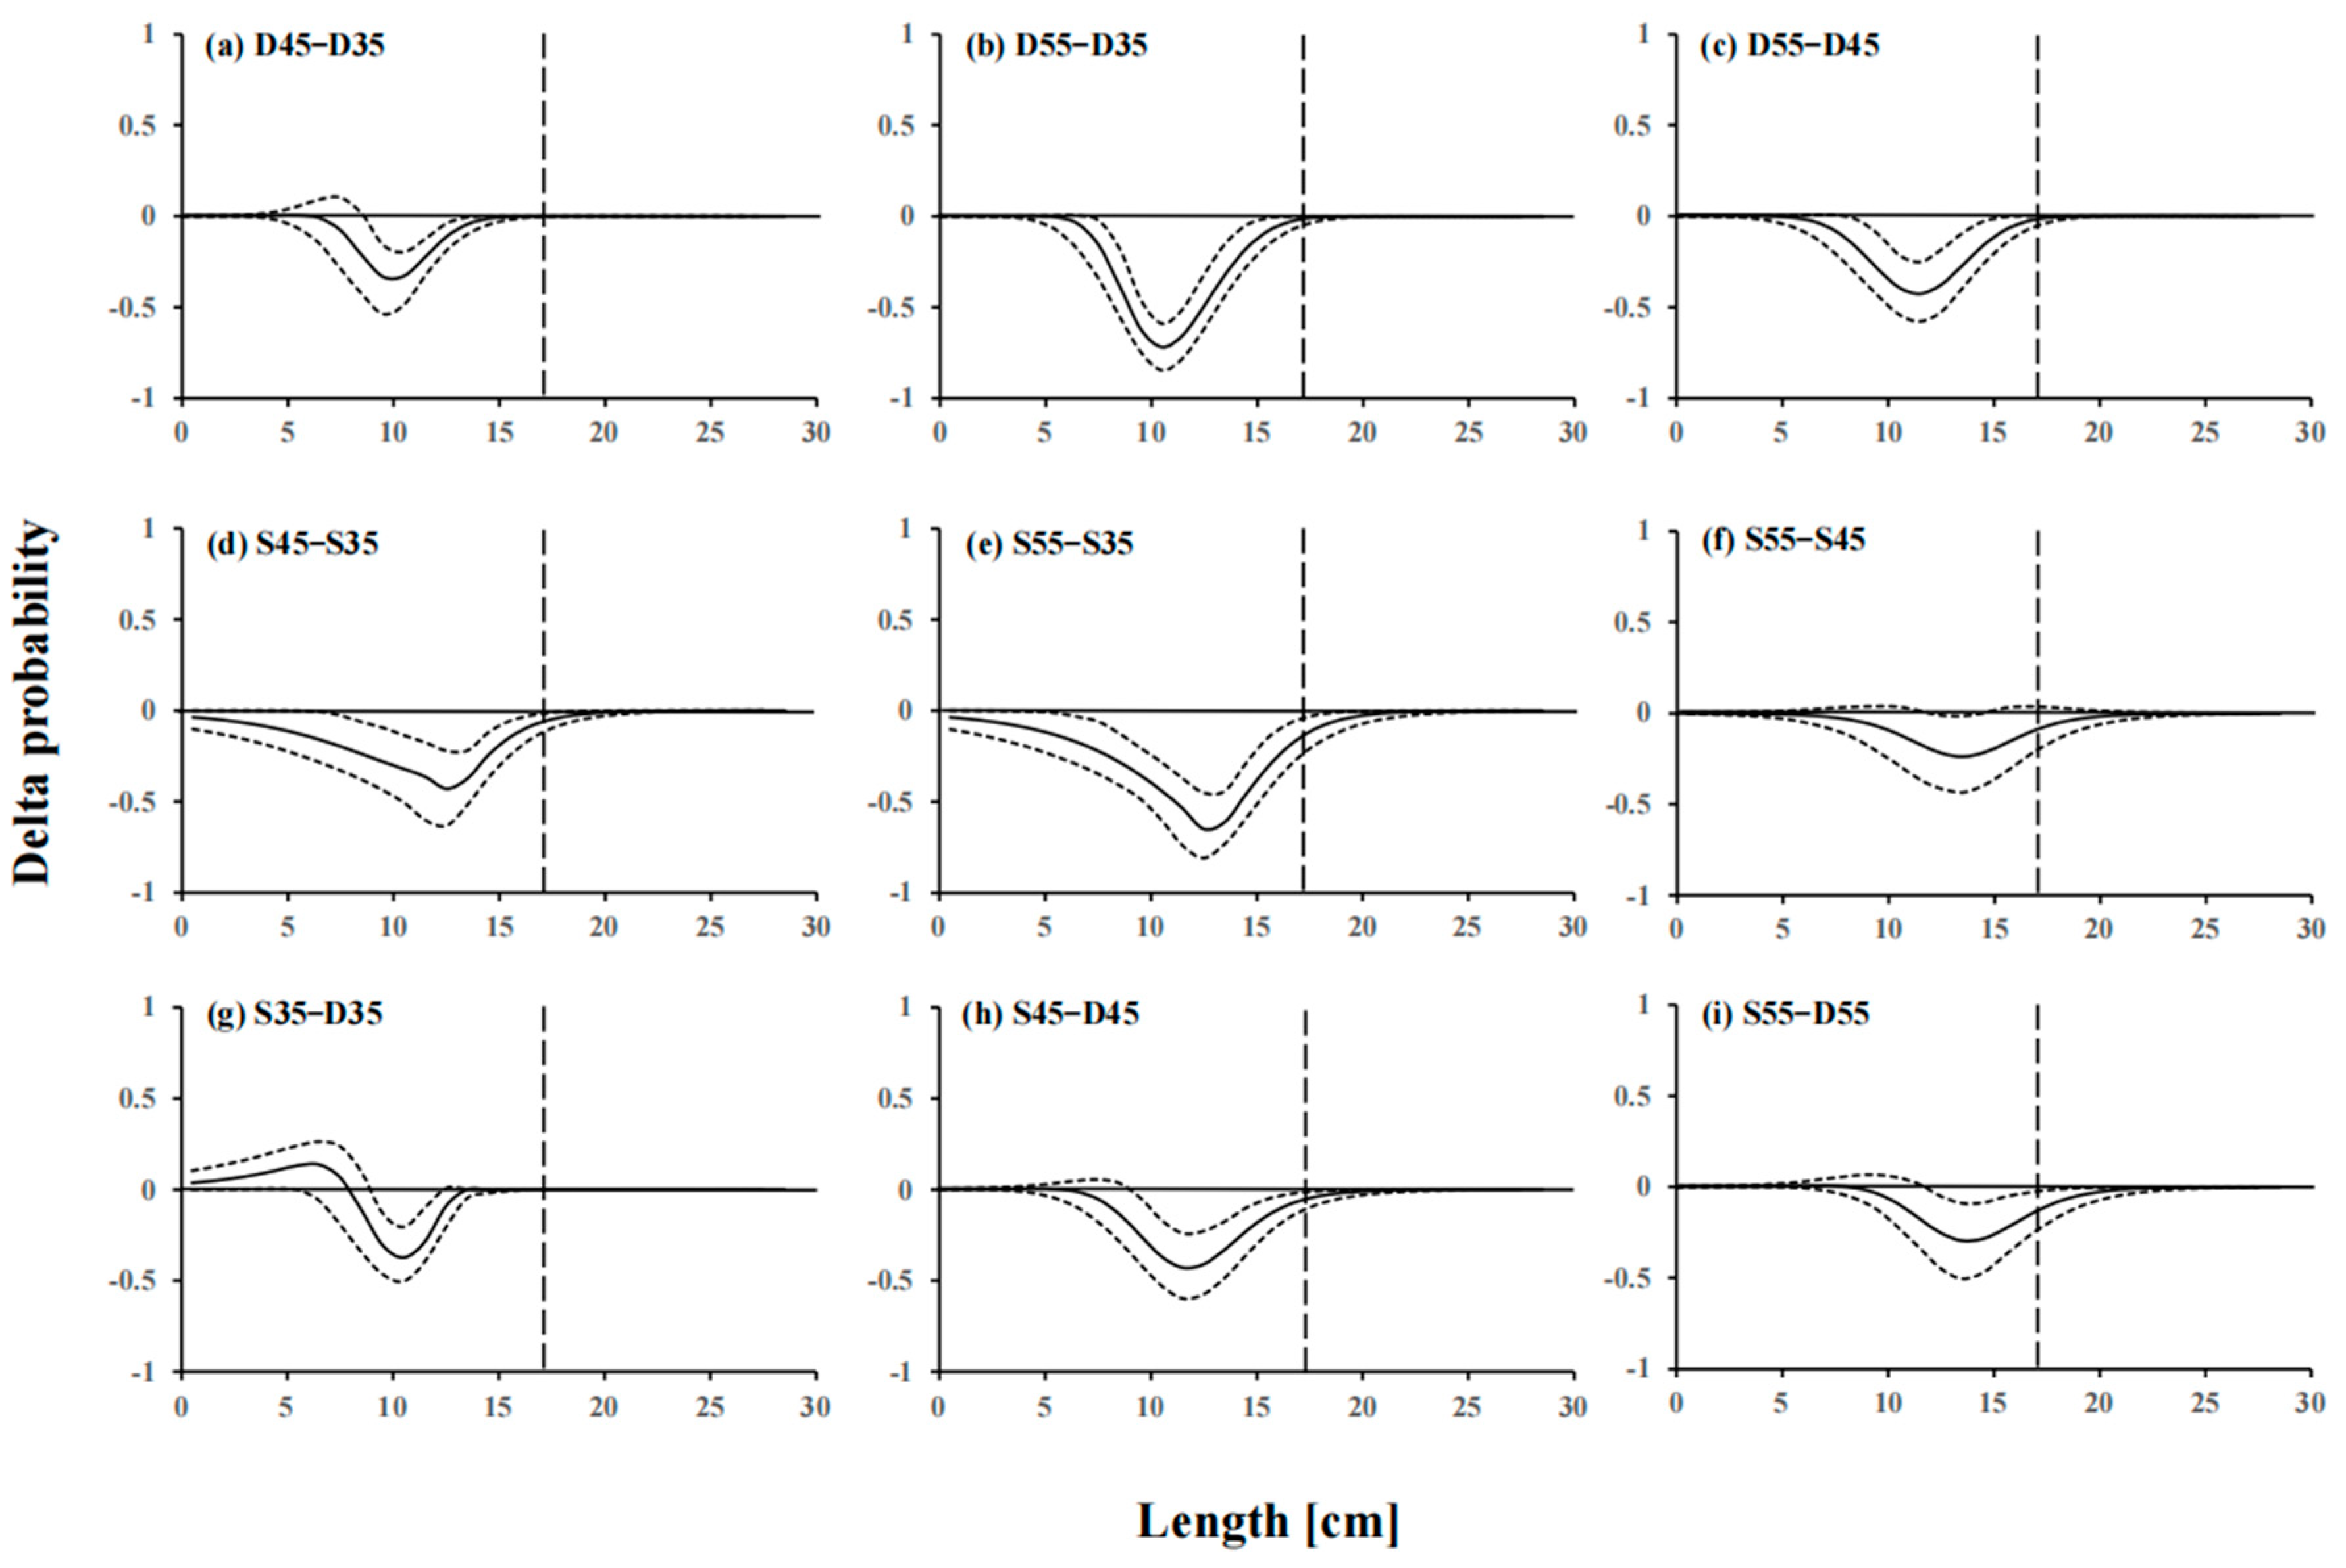
where r 1 l and r 2 l represent the size selectivity of codend 1 and codend 2, respectively. The Efron percentile 95% CIs for the Δ r l were acquired based on the two bootstrap population results for r 1 l and r 2 l . As they were obtained independently, a new bootstrap population of results for Δ r l was validly created [31,32]. Δ r l can vary from −1 to 1, and CIs containing 0.0 indicates no significant length-dependent difference in selectivity. Likewise, the difference was statistically significant if the CIs did not contain 0.0.

2.3. Estimation of Exploitation Pattern Indicators

To evaluate how the tested codends would affect the exploitation patterns of croaker species in the stow net fishery, six exploitation pattern indicators (nP−, nP+, nRatio, ndRatio, wP−, and wP+) were estimated. These indicators were obtained based on the size structure of the fish population encountered during the sea trials. To estimate these indicators, we first pooled catch data from the codend and the cover over all hauls to generate a fishing population scenario ( n P o p l ). Then, by incorporating the size selectivity curves, the MLS of the studied species and the length–weight relationship, these exploitation pattern indicators can be calculated as follows:
n P = 100 × l < M L S r a v l , v × n P o p l l < M L S n P o p l n P + = 100 × l M L S r a v l , v × n P o p l l M L S n P o p l n R a t i o = l < M L S r a v l , v × n P o p l l M L S r a v l , v × n P o p l n d R a t i o = 100 × l < M L S r a v l , v × n P o p l l r a v l , v × n P o p l w P = 100 × l < M L S a × l b × r a v l , v × n P o p l l < M L S a × l b × n P o p l w P + = 100 × l M L S a × l b × r a v l , v × n P o p l l M L S a × l b × n P o p l
where r a v l , v is the size selection curves obtained for the tested codends, n P o p l is the size structure of the studied species in terms of relative frequency, and a and b are coefficients of the length–weight relationship for specific species. nP− and nP+ quantify the percentage of the studied species caught below and above the MLS (in number), respectively. nRatio represents the landing ratio between captured individuals below and above the MLS. ndRatio indicates the percentage of fish individuals below the MLS caught by the tested codends. wP− and wP+ are similar indicators to nP− and nP+, but in terms of weight. Ideally, nP−, nRatio, ndRatio, and wP− are preferred to be close to 0, while nP+ and wP+ preferred to be close to 100%. The Efron percentile 95% CIs of these indicators were estimated using the double bootstrap method mentioned above.
All the data analysis procedures, including size selectivity analysis and estimation of exploitation pattern indicators, were conducted using the software SELNET [29].

3. Results

3.1. Description of Experiments and Catches

We conducted ten trials for each of the six tested codends, in which a total of 56, 49, and 46 valid hauls were accomplished for little yellow croaker, silver croaker, and flower croaker, respectively (Table 2). The water depth ranged from 20 to 25 m, and the soak time varied between 22 and 26 h. Little yellow croaker was the most predominant species captured over all hauls, followed by silver croaker and flower croaker. A total of 2197 little yellow croaker, 1284 silver croaker, and 1232 flower croaker were collected for data analysis. The sub-sampling ratios varied from 0.5 to 1.0 for both codend and cover. The length of little yellow croaker, silver croaker, and flower croaker ranged from 7.1 to 25.9, 5.1 to 24.9, and 6.2 to 26.8 cm, respectively, while the weight was in the range of 3.4–136.2, 1.0–179.1, and 1.2–221.2 g, respectively. The estimated population structure of the three croaker species is shown in Figure 3.
Based on the experimental data of length (l) and weight (W), the length–weight relationships for croaker species were estimated as follows:
Little   yellow   croaker :   W   =   0.0109 l 2.9003   R 2   =   0.94 Silver   croaker :   W   =   0.0039 l 3.3478   R 2   =   0.97 Flower   croaker :   W   =   0.0046 l 3.2918   R 2   =   0.96

3.2. Size Selectivity

By comparing the AIC values of four selectivity models, the selected best models were listed in Table 3. All selected models provided acceptable p-values (p > 0.05), implying that they could describe the experimental data sufficiently well.
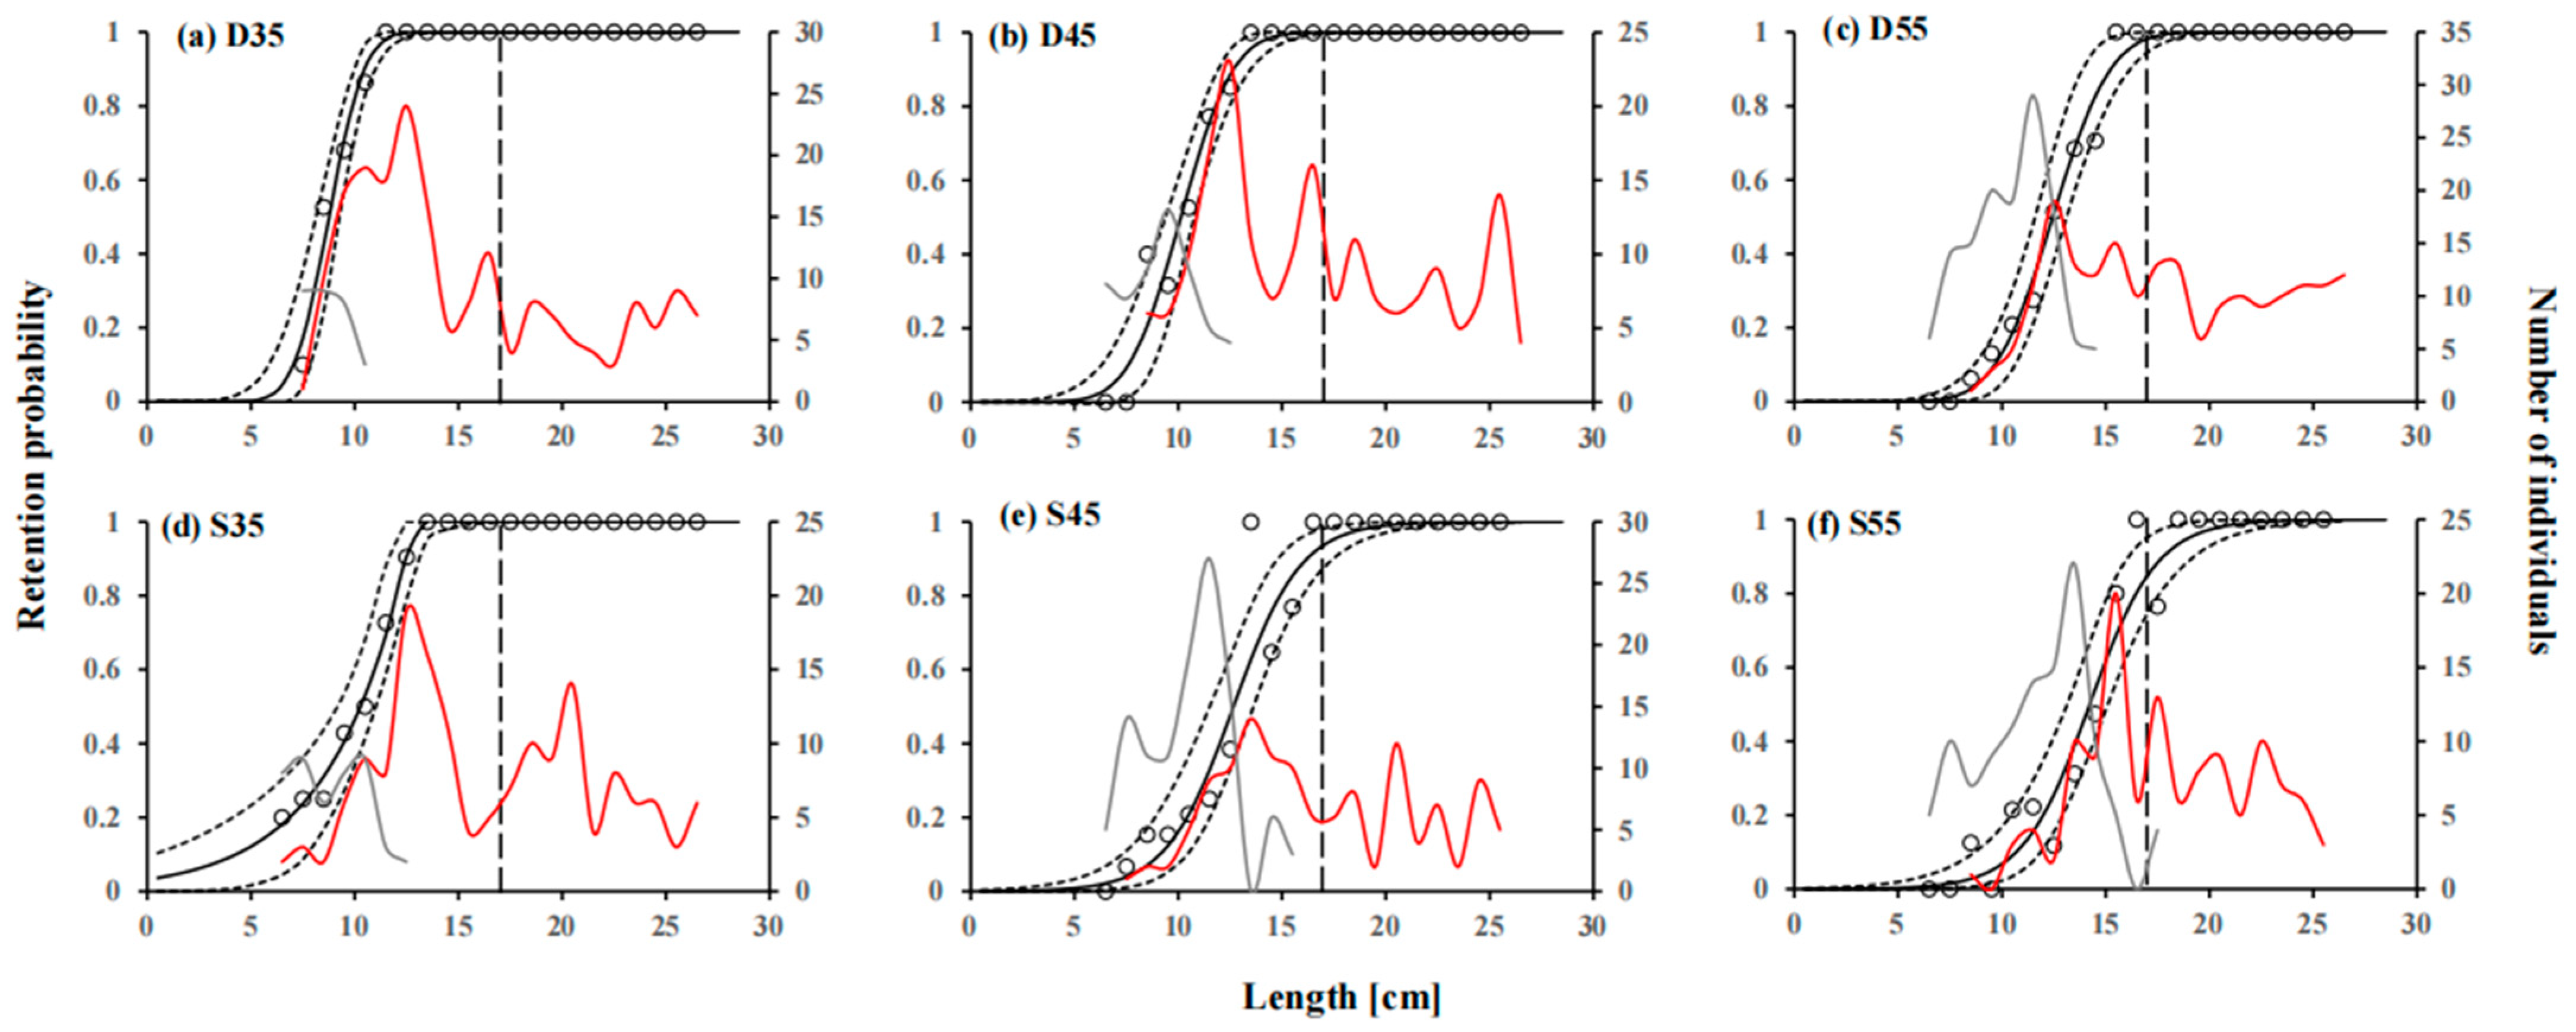
Generally, the selective parameters (L50 and SR) of the tested codends, irrespective of mesh shape, for the target species showed an increasing trend with increasing mesh size. For instance, L50 and SR of the D35 codend for little yellow croaker were 9.92 and 2.16 cm, respectively, while the corresponding values increased to 13.73 and 2.51 cm for the D55 codend, respectively (Table 4). The size selectivity curves also reflected a similar fishing pattern (Figure 4, Figure 5 and Figure 6). As the mesh sizes enlarged, the retention probability of undersized target species decreased. For instance, the retention probability of the S35 codend for three croaker species at MLS would be 100% indicating a high retention risk for juvenile individuals, while for the S55 codend, the retention probability of little yellow croaker, silver croaker, and flower croaker at MLS dropped to 41.91%, 58.23%, and 84.80%, respectively.
For the codends with the same mesh size, the square-mesh codends had larger L50 values for the three croaker species than diamond-mesh codends (Table 4). For instance, L50 of the D35 codend for silver croaker was 8.54 (CI: 8.07–9.05) cm, which was significantly lower than that of the S35 codend, 10.24 (CI: 9.91–10.56) cm. The retention curves showed a rightward trend for the D35 vs. S35, D45 vs. S45, and D55 vs. S55 comparisons, indicating that changing the mesh shape from diamond to square would decrease the retention probability for undersized target species (Figure 4, Figure 5 and Figure 6).
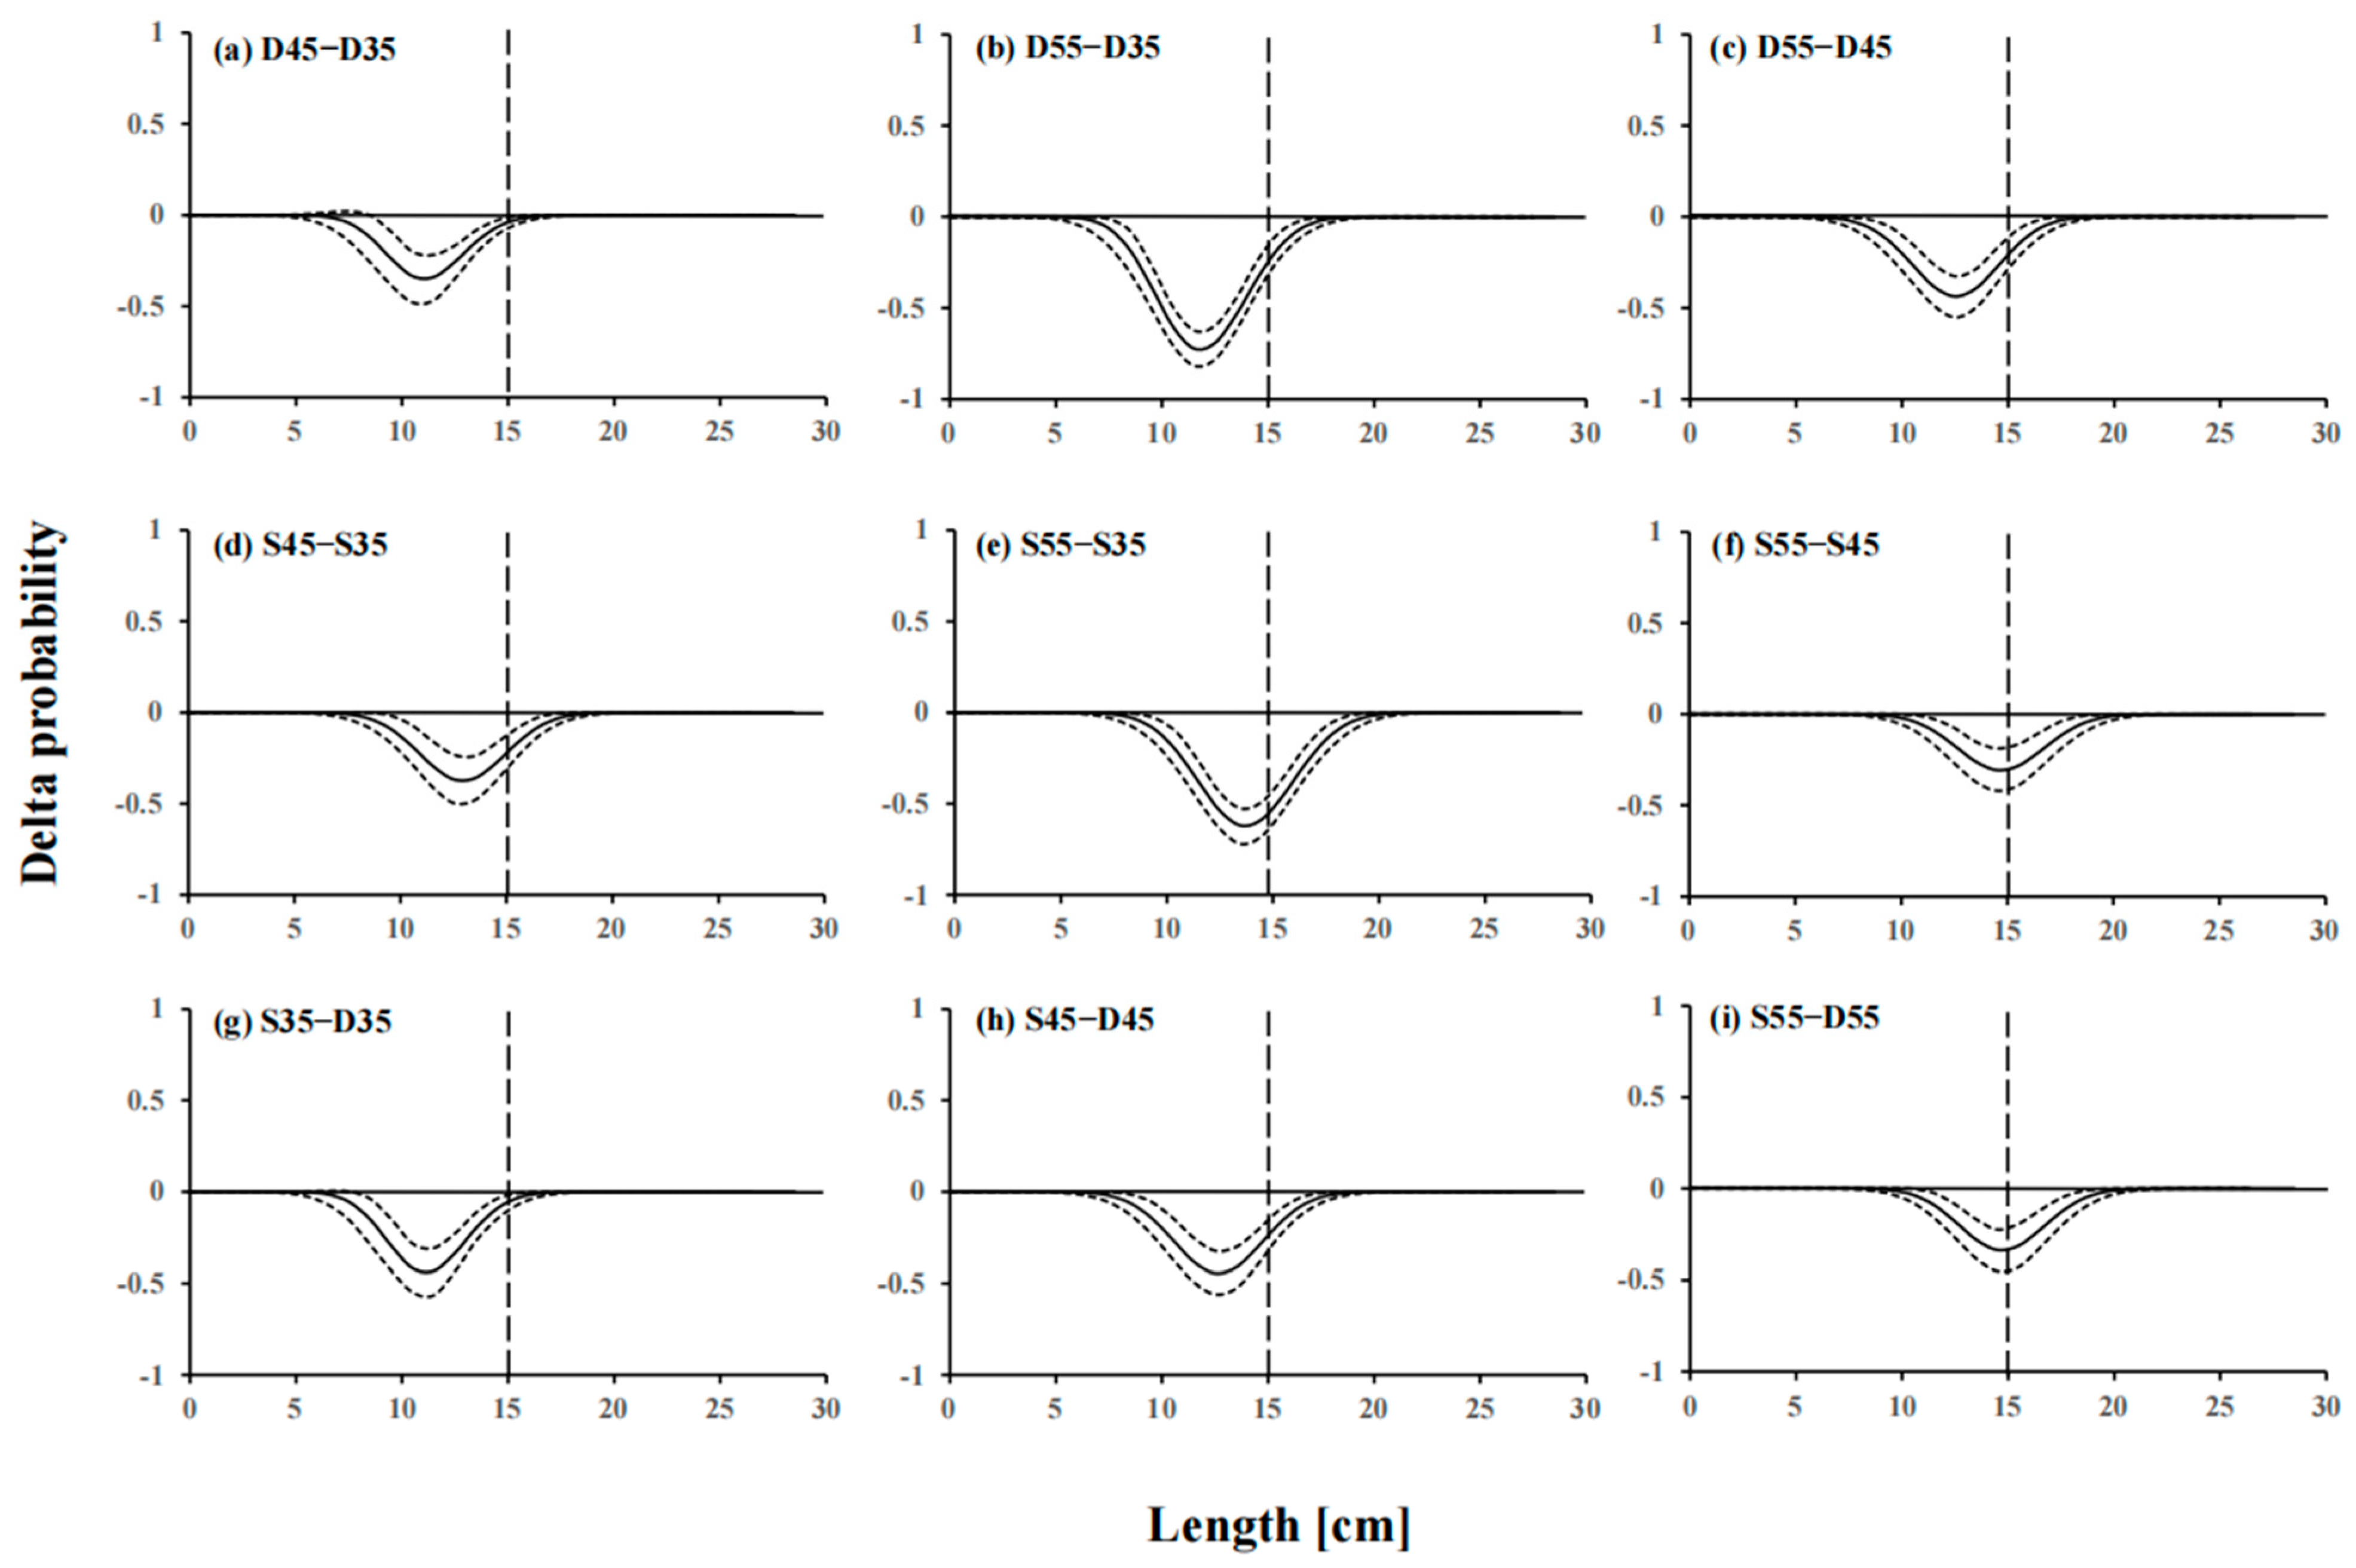
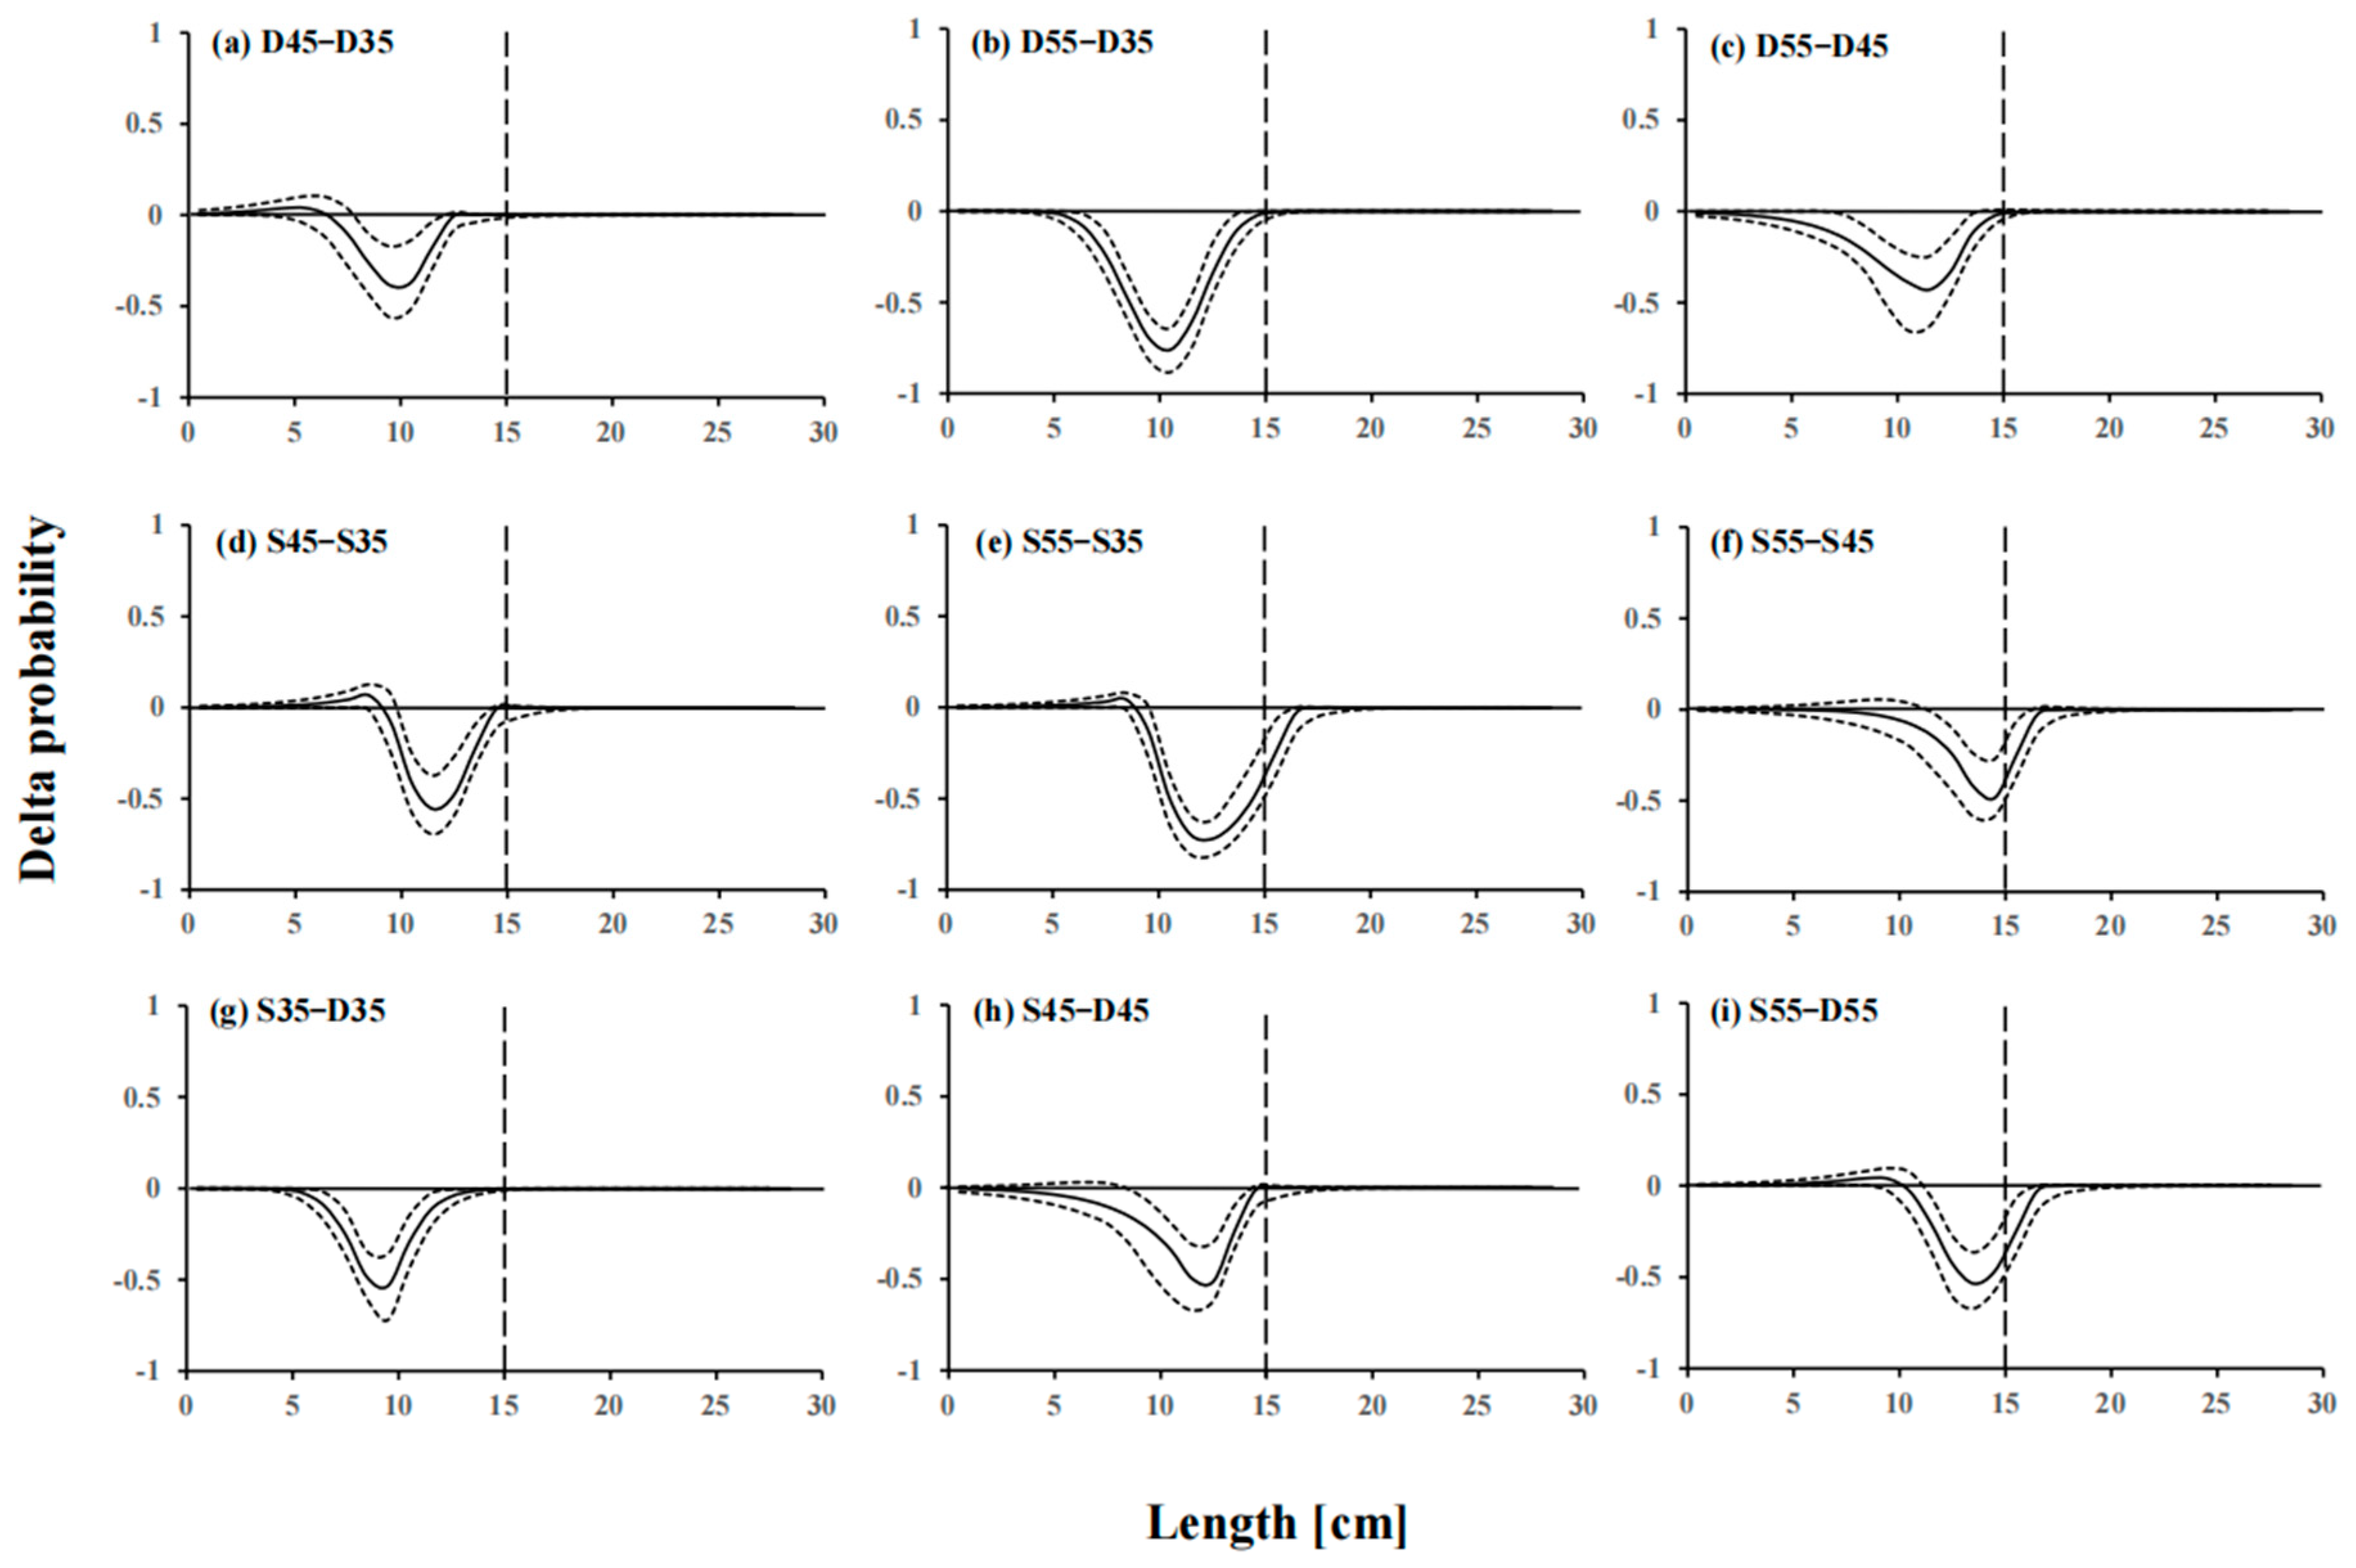
The differences in length-dependent retention probability of six tested codends for three croaker species are shown in Figure 7, Figure 8 and Figure 9. Most of these differences were statistically significant for fish at some specific length range, as the 95% CIs did not contain 0. Compared with the D35 codend, the D45 codend had significantly lower retention probability for undersized target species at the following length range: 8.5–15.5 cm for little yellow croaker (Figure 7a), 8.5–11.5 cm for silver croaker (Figure 8a), and 9.5–14.5 cm for flower croaker (Figure 9a). The comparison between the D35 and D55 codend showed that the retention probability for undersized individuals would further decrease (Figure 7, Figure 8 and Figure 9b). In the comparison between the D45 and D55 codend with the former as the baseline, significant differences in retention probability were obtained in the length class of 7.5–17.5 cm for little yellow croaker (Figure 7c), 7.5–13.5 cm for silver croaker (Figure 8c), and 8.5–15.5 cm for flower croaker (Figure 9c), respectively. A similar tendency was observed for the comparisons between square-mesh codends (Figure 7, Figure 8 and Figure 9d–f). In the three pairwise comparisons between diamond-mesh and square-mesh codends D35 vs. S35, D45 vs. S45, and D55 vs. S55, the squared-mesh codends would have significantly lower retention probability for undersized fish in a wide range of length class (Figure 7, Figure 8 and Figure 9g–i).

3.3. Exploitation Pattern Indicators

The exploitation pattern indicators showed that irrespective of mesh shape, increasing codend mesh size would reduce the catch efficiency of undersized target species, as reflected by the lower values of number-based percentages nP− (Table 5). For instance, the D35 codend retained 77.52% (CI: 72.84–81.95%), 76.02% (CI: 70.30–81.15%), and 82.37% (CI: 77.14–87.09%) of little yellow croaker, silver croaker, and flower croaker below the MLS (nP−), respectively, while the corresponding values of nP- would drop to 27.61% (CI: 22.38–33.67%), 34.98% (CI: 28.28–42.12%), and 41.33% (CI: 33.32–51.51%) for the D55 codend, respectively. Substituting diamond mesh with square mesh would also reduce the catch efficiency of undersized individuals. For instance, the D45 codend retained 67.44% (CI: 59.87–74.21%) of undersized flower croaker; by comparison, the value of nP- dropped to approximately 40% for the S45 codend. The D55 codend retained 27.61% (CI: 22.38–33.67%), 34.89% (CI: 28.28–42.12%), and 41.33% (CI: 33.32–51.51%) of undersized little yellow croaker, silver croaker and flower croaker, respectively, while the S55 codend only retained 11.03% (CI: 7.48–15.25%), 16.72% (CI: 11.10–22.80%), and 25.60% (CI: 18.33–36.21%) of undersized individuals of these three species.
For little yellow croaker, modifying codend mesh sizes and shapes would marginally decrease the catch efficiency of legal-sized individuals (nP+), except for the S55 codend, where a reduction of approximately 17% was observed (Table 5). For silver croaker and flower croaker, the six tested codends did not affect the catch efficiency of individuals above the MLS, except for minor decreases (< 5%) found in the S55 codend for the silver croaker and the S45 and S55 codends for the flower croaker. The weight-based indicators, wP− and wP+, reflected a similar trend with nP− and nP+, respectively. With mesh sizes increment and square-mesh applied, the values of nRatio and ndRatio gradually decreased.

4. Discussion

The MMS and MLS regulations are the most important input and output controls used by fishery management departments in China [19]. Normally, they should supplement each other to facilitate the sustainable development of fishery resources. However, our study demonstrated that the legal D35 codend, which followed the MMS regulations in the Yellow Sea, would be unfavorable to the sustainability of croaker stocks, with the MLS of croaker species as reference points. The L50 of D35 codend for little yellow croaker was 9.92 (CI: 9.43–10.35) cm and even smaller for silver croaker and flower croaker, far below the MLS of these three species. The retention probability of D35 codend for these croaker species at MLS would be 100%, and the exploitation pattern indicators showed that more than 75% of undersized individuals were retained. To the best of our knowledge, this study is the first to systematically evaluate the effectiveness of the current management regulations of the stow net fishery on protecting croaker species. In addition, we also tested the performance of five alternative codends with different mesh sizes and shapes. Our study provides essential information for the adjustment of management regulations of the Chinese stow net fisheries.
Our results demonstrated that increasing the codend mesh size and using square-mesh codend could improve the size selectivity and exploitation pattern of the croaker species. For instance, when the D35 codend was substituted by the D55 codend, the L50 of little yellow croaker would increase from 9.92 (CI: 9.43–10.35) to 13.73 (CI: 13.33–14.09) cm, marginally below the MLS, and the L50 of the other two species also increased to some extent, indicating that the juvenile fish had a larger chance to escape from the codend. The exploitation pattern indicators (nP−, wP−, and ndRatio) also intuitively reflected that a large proportion of juvenile individuals was released as the mesh sizes enlarged. For all three species, the S55 codend, in which the mesh size and shape were both modified, presented the greatest selective properties. In this codend, the catch efficiency of undersized croaker was significantly decreased by approximately 75–89%. Moreover, the catch losses of legal-sized silver croaker and flower croaker for the S55 codend were minor (<5%) in terms of number and weight. Thus, the S55 codend was the optimal option for both silver croaker and flower croaker. For little yellow croaker, the D55 and S45 codends may be more readily accepted by fishers because these two codends have relatively higher catch efficiency of target-sized individuals than the S55 codend. However, these three croaker species are often simultaneously caught by the stow nets due to their similar habitats in the fishing grounds. Therefore, with the comprehensive consideration of the released rate of undersized individuals and retention rate of legal-sized individuals, we recommended the S55 codend for the stow net fisheries targeting croaker species.
The likelihood of successful escapement for a given sized species is highly dependent on the matching degree between its morphological characteristics and mesh openings [33,34]. Our study found that the square-mesh codends had significantly higher size selectivity for the croaker species than diamond-mesh codends with the same mesh sizes. This can be explained by the square-mesh codend exhibiting larger and stabler mesh opening than the diamond-mesh codend under water currents [35]. Equally important, the square mesh shape can better match the fusiform body shape of the croaker species. Zhang et al. [21] and Huang et al. [15] also suggested that square-mesh codends presented a better performance for releasing fusiform and round fish, while diamond-mesh codends were better for compressiform fish, which was consistent with our findings.
Although operating principles differ between stow nets and trawls, some successful cases and lessons of gear modifications in trawl fisheries can provide guidance for improving the size and species selectivity of stow net fisheries because of the similar structure of these two types of fishing gear. Some previous studies have demonstrated that some selection devices (e.g., square mesh panel and sorting grids) successfully applied in trawl fisheries may have great potential to improve the selectivity and exploitation pattern of multispecies stow net fisheries [2,36]. More field experiments are needed to focus on these technical measures in our future work. Moreover, passive fishing gear selection is not solely a mechanical process; the behavior of target species also plays an important role. The swimming capability, interspecies-interactive behavior, vertical distribution in the codend, and in which position and direction it contacts the fishing gear are highly relevant for the size selection of fishing gear. Future research will explore the effects of these factors on the size selectivity of croaker species in stow net fisheries using underwater video recordings.
The formulation of management strategies should take confounding factors into account, such as the discrepancy in the species distribution, species abundance, and population structure between different fishing seasons and areas [37]. The MMS of 35 mm was implemented not only for stow net fisheries in the Yellow Sea of China but also in other fishing regions of China, including the Bohai Sea, East China Sea, and South China Sea. Due to the regional differences in catch composition and the multispecies nature of stow net fisheries, it is unreasonable to adopt uniform MMS to exploit various morphologically different species on the entire coast of China. In several fisheries worldwide, the MMS was formulated for specific species for improving the sustainable use of fishery resources. For instance, the codend with an MMS of 130 mm was compulsory in the Barents Sea cod directed demersal trawl fishery to catch a maximum of 15% of fish below MLS [38]. In Chinese gillnet fisheries, the MOA has implemented MMS regulations for certain commercial species to protect their fishery resources [19]. For example, the MMS of 50 mm, 90 mm, and 110 mm were regulated for mantis shrimp (Oratosquilla oratoria), Chinese herring (Ilisha elongate), and swimming crab (Portunus trituberculatus), respectively. Therefore, we recommended a two-step approach in stow net fisheries’ MMS implementation: starting from stipulating species-specific MMS regulations according to corresponding MLS and then expanding to fishery-level spatial-temporal management plans. In this way, fishing activities can be carried out based on fishing dynamics (e.g., fishing period and grounds) of different target species under explicit criteria. Meanwhile, the output control measures with catch limits should be incorporated into the management system. Moreover, it is necessary to establish a long-term monitoring system for the exploitation status of commercial species and timely adjust the management strategies based on their maximum sustainable yield.

Author Contributions

Conceptualization, M.Y. and Y.T.; methodology, M.Y. and B.H.; software, B.H.; validation, M.Y., L.Z., C.L. and Y.T.; formal analysis, M.Y. and B.H.; investigation, M.Y. and L.Z.; resources, Y.T.; data curation, M.Y.; writing—original draft preparation, M.Y.; writing—review and editing, M.Y., B.H., C.L., L.Z. and Y.T.; visualization, M.Y.; supervision, B.H. and Y.T.; project administration, Y.T.; funding acquisition, Y.T. All authors have read and agreed to the published version of the manuscript.

Funding

This research was funded by the Project of Marine and Fishery Technology Innovation of Shandong (No. 2017HYCX007).

Institutional Review Board Statement

This study did not involve any endangered or protected species. Experimental fishing was conducted onboard a commercial vessel in accordance with the fishing permit granted by the Ministry of Agriculture and Rural Affairs of China. No other authorization or ethics board approval was required to carry out this study. Information on animal welfare and steps to ameliorate suffering and methods of sacrifice is not applicable, as the animals were not exposed to any additional stress other than that involved in commercial fishing practices.

Informed Consent Statement

Not applicable.

Data Availability Statement

The data presented in this study are available on request from the corresponding author.

Acknowledgments

We would like to thank the captain and crews of the research vessel “Lurongyuyang 62705” for their invaluable suggestions and help during the sea trials.

Conflicts of Interest

The authors declare no conflict of interest.

References

  1. Sun, Z.; Zhou, J.; Wang, J.; Zhao, Z.; Zhuang, S.; Chen, B.; Yan, W. Stow net fishery in the Yellow Sea and Bohai Sea area. Prog. Fish. Sci. 2012, 33, 94–101. [Google Scholar]
  2. Huang, L.; Chen, Y.; Gao, H.; Xu, Q.; Cheng, H.; Liu, C.; Tang, Y. Study on selectivity of square mesh escape window of Tanzi net. J. Ocean Univ. China 2018, 48, 15–23. [Google Scholar]
  3. MARA. China Fishery Yearbook 2021; China Agriculture Press: Beijing, China, 2021. [Google Scholar]
  4. Suuronen, P.; Chopin, F.; Glass, C.; Løkkeborg, S.; Matsushita, Y.; Queirolo, D.; Rihan, D. Low Impact and Fuel Efficient Fishing—Looking beyond the Horizon. Fish. Res. 2012, 119–120, 135–146. [Google Scholar] [CrossRef]
  5. He, P.; Chopin, F.; Suuronen, P.; Ferro, R.S.T.; Lansley, J. Classification and illustrated definition of fishing gears. In FAO Fisheries and Aquaculture Technical Paper; No. 672; FAO: Rome, Italy, 2021. [Google Scholar]
  6. MARA. China Fishery Yearbook 2011; China Agriculture Press: Beijing, China, 2011. [Google Scholar]
  7. MARA. China Fishery Yearbook 2022; China Agriculture Press: Beijing, China, 2022. [Google Scholar]
  8. Shan, X.; Jin, X.; Dai, F.; Chen, Y.; Yang, T.; Yao, J. Population Dynamics of Fish Species in a Marine Ecosystem: A Case Study in the Bohai Sea, China. Mar. Coast. Fish. 2016, 8, 100–117. [Google Scholar] [CrossRef] [Green Version]
  9. Kang, B.; Liu, M.; Huang, X.; Li, J.; Yan, Y.; Han, C.; Chen, S. Fisheries in Chinese seas: What can we learn from controversial official fisheries statistics? Rev. Fish Biol. Fish. 2018, 28, 503–519. [Google Scholar] [CrossRef]
  10. Zhang, J.; Shi, X.; He, P.; Shi, J. Effectiveness of Escape Vent Shape in Crab Pots for Releasing Swimming Crab Portunus Trituberculatus in the East China Sea. Aquac. Fish. 2023, 8, 332–340. [Google Scholar] [CrossRef]
  11. Xu, G.; Zhu, W.; Xu, L. Gillnet selectivity for swimming crab Portunus trituberculatus in the East China Sea. Fish. Sci. 2021, 87, 31–38. [Google Scholar] [CrossRef]
  12. Yu, M.; Liu, C.; Tang, Y.; Zhang, L.; Zhao, W. Effects of escape vents on the size selection of whelk (Rapana venosa) and Asian paddle crab (Charybdis japonica) in the small-scale pot fishery of the Yellow Sea, China. Hydrobiologia 2022, 849, 3101–3115. [Google Scholar] [CrossRef]
  13. Yu, M.; Liu, C.; Sun, L.; Zhang, L.; Tang, Y. A New Concept for Bycatch Reduction in Small-Scale Accordion-Shaped Trap Fisheries of the Yellow Sea, China. Fish. Res. 2023, 263, 106685. [Google Scholar] [CrossRef]
  14. Sun, M.; Li, Y.; Chen, Y. Unveiling unselective fishing in China: A nationwide meta-analysis of multispecies fisheries. Fish Fish. 2022, 24, 142–158. [Google Scholar] [CrossRef]
  15. Huang, L.; Gao, H.; Tang, Y.; Liu, C.; Xu, Q.; Sun, P. A study on the selectivity of codend mesh of Tanzi net in Haizhou bay. J. Ocean Univ. China 2016, 46, 143–150. [Google Scholar]
  16. Jin, X. Long-term changes in fish community structure in the Bohai Sea, China. Estuar. Coast. Shelf Sci. 2004, 59, 163–171. [Google Scholar] [CrossRef]
  17. Vasilakopoulos, P.; O’Neill, F.G.; Marshall, C. Misspent youth: Does catching immature fish affect fisheries sustainability. ICES J. Mar. Sci. 2011, 68, 1525–1534. [Google Scholar] [CrossRef]
  18. Cheng, J.; Nguyen Van, Q.; Sasaki, K.; Hoshino, K.; Sakai, T.; Santos, M.; Liu, M.; Yang, C.; Chen, M.; Yeh, H.M.; et al. Larimichthys polyactis. The IUCN Red List of Threatened Species 2020: E.T49182929A49229050. Available online: https://dx.doi.org/10.2305/IUCN.UK.2020-1.RLTS.T49182929A49229050.en (accessed on 16 March 2023). [CrossRef]
  19. Shen, G.; Heino, M. An overview of marine fisheries management in China. Mar. Policy 2014, 44, 265–272. [Google Scholar] [CrossRef] [Green Version]
  20. Xu, Q.; Li, X.; Sun, S.; Fan, G. Selectivity of codend mesh of stow nets with double pile vertical hole in Haizhou Bay in autumn. Fish. Sci. 2020, 39, 388–393. [Google Scholar]
  21. Zhang, J.; Zhang, P.; Shi, J.; Chen, X. Size selectivity of diamond and square mesh codends in single-stake stow net fisheries. Mar. Fish. 2011, 33, 213–220. [Google Scholar]
  22. Li, C.; Zhang, X.; Chen, P.; Zhang, P. Selectivity of codend mesh sizes in stow nets during spring on the coast of Zhaitang Island, Qingdao. J. Fish. Sci. China 2015, 22, 799–811. [Google Scholar]
  23. Wileman, D.; Ferro, R.S.T.; Fonteyne, R.; Millar, R.B. Manual of Methods of Measuring the Selectivity of Towed Fishing Gear. ICES Coop. Res. Rep. 1996, 215, 38–99. [Google Scholar]
  24. Fryer, R.J. A model of between-haul variation in selectivity. ICES J. Mar. Sci. 1991, 48, 281–290. [Google Scholar] [CrossRef]
  25. Millar, R.B. Incorporation of between-haul variation using bootstrapping and nonparametric estimation of selection curves. Fish. Bull. 1993, 91, 564–572. [Google Scholar]
  26. Xu, Q.; Li, X.; Sun, S.; Zhang, X. Studies on the cod-end mesh selectivity of pelagic pair trawls in Yellow Sea. J. Ocean Univ. China 2020, 50, 53–60. [Google Scholar]
  27. Herrmann, B.; Krag, L.A.; Feekings, J.; Noack, T. Understanding and predicting size selection in diamond-mesh cod ends for Danish seining: A study based on sea trials and computer simulations. Mar. Coast. Fish. 2016, 8, 277–291. [Google Scholar] [CrossRef] [Green Version]
  28. Akaike, H. A new look at the statistical model identification. IEE Trans. Automat. Contr. 1974, 19, 716–723. [Google Scholar] [CrossRef]
  29. Herrmann, B.; Sistiaga, M.; Nielsen, K.N.; Larsen, R.B. Understanding the size selectivity of redfish (Sebastes spp.) in north atlantic trawl codends. J. Northwest Atl. Fish. Sci. 2012, 44, 1–13. [Google Scholar] [CrossRef] [Green Version]
  30. Efron, B. The jackknife, the bootstrap and other resampling plans. In SIAM Monograph No. 38, CBSM-NSF Regional Conference Series in Applied Mathematics; SIMA: Philadelphia, PA, USA, 1982. [Google Scholar]
  31. Herrmann, B.; Krag, L.A.; Krafft, B.A. Size selection of Antarctic krill (Euphausia superba) in a commercial codend and trawl body. Fish. Res. 2018, 207, 49–54. [Google Scholar] [CrossRef]
  32. Herrmann, B.; Sitiaga, M.; Larsen, R.B.; Brinkhof, J. Effect of three different codend designs on the size selectivity of juvenile cod in the Barents Sea shrimp trawl fishery. Fish. Res. 2019, 219, 105337. [Google Scholar] [CrossRef]
  33. Yang, B.; Yang, L.; Tan, Y.; Yan, L.; Zhang, P.; Li, J. Size Selectivity of Combined Square and Diamond Mesh Codends of Shrimp Beam Trawl for Banded Scad Caranx (Atule) Kalla in the Northern South China Sea. J. Oceanol. Limnol. 2018, 36, 1880–1890. [Google Scholar] [CrossRef]
  34. Sala, A.; Lucchetti, A.; Piccinetti, C.; Ferretti, M. Size Selection by Diamond- and Square-Mesh Codends in Multi-Species Mediterranean Demersal Trawl Fisheries. Fish. Res. 2008, 93, 8–21. [Google Scholar] [CrossRef]
  35. Guijarro, B.; Massutí, E. Selectivity of diamond- and square-mesh codends in the deepwater crustacean trawl fishery off the Balearic Islands (western Mediterranean). ICES J. Mar. Sci. 2006, 63, 52–67. [Google Scholar] [CrossRef]
  36. Wang, Z.; Gao, Z.; Zhang, J. Selectivity study on Y-shaped exclusion device for mantis shrimp and swimming crab in Chinese stow net. South China Fish. Sci. 2017, 13, 117–123. [Google Scholar]
  37. Chen, D. Fishery Ecology in Yellow Sea and Bo Hai Sea; China Ocean Press: Beijing, China, 1991. [Google Scholar]
  38. Brinkhof, J.; Sistiaga, M.; Herrmann, B.; Grimaldo, E.; Larsen, R.B. Managing size selectivity: The relevance of compulsory and alternative selection devices in the Northeast Atlantic bottom trawl fishery. ICES J. Mar. Sci. 2022, 79, 2399–2412. [Google Scholar] [CrossRef]
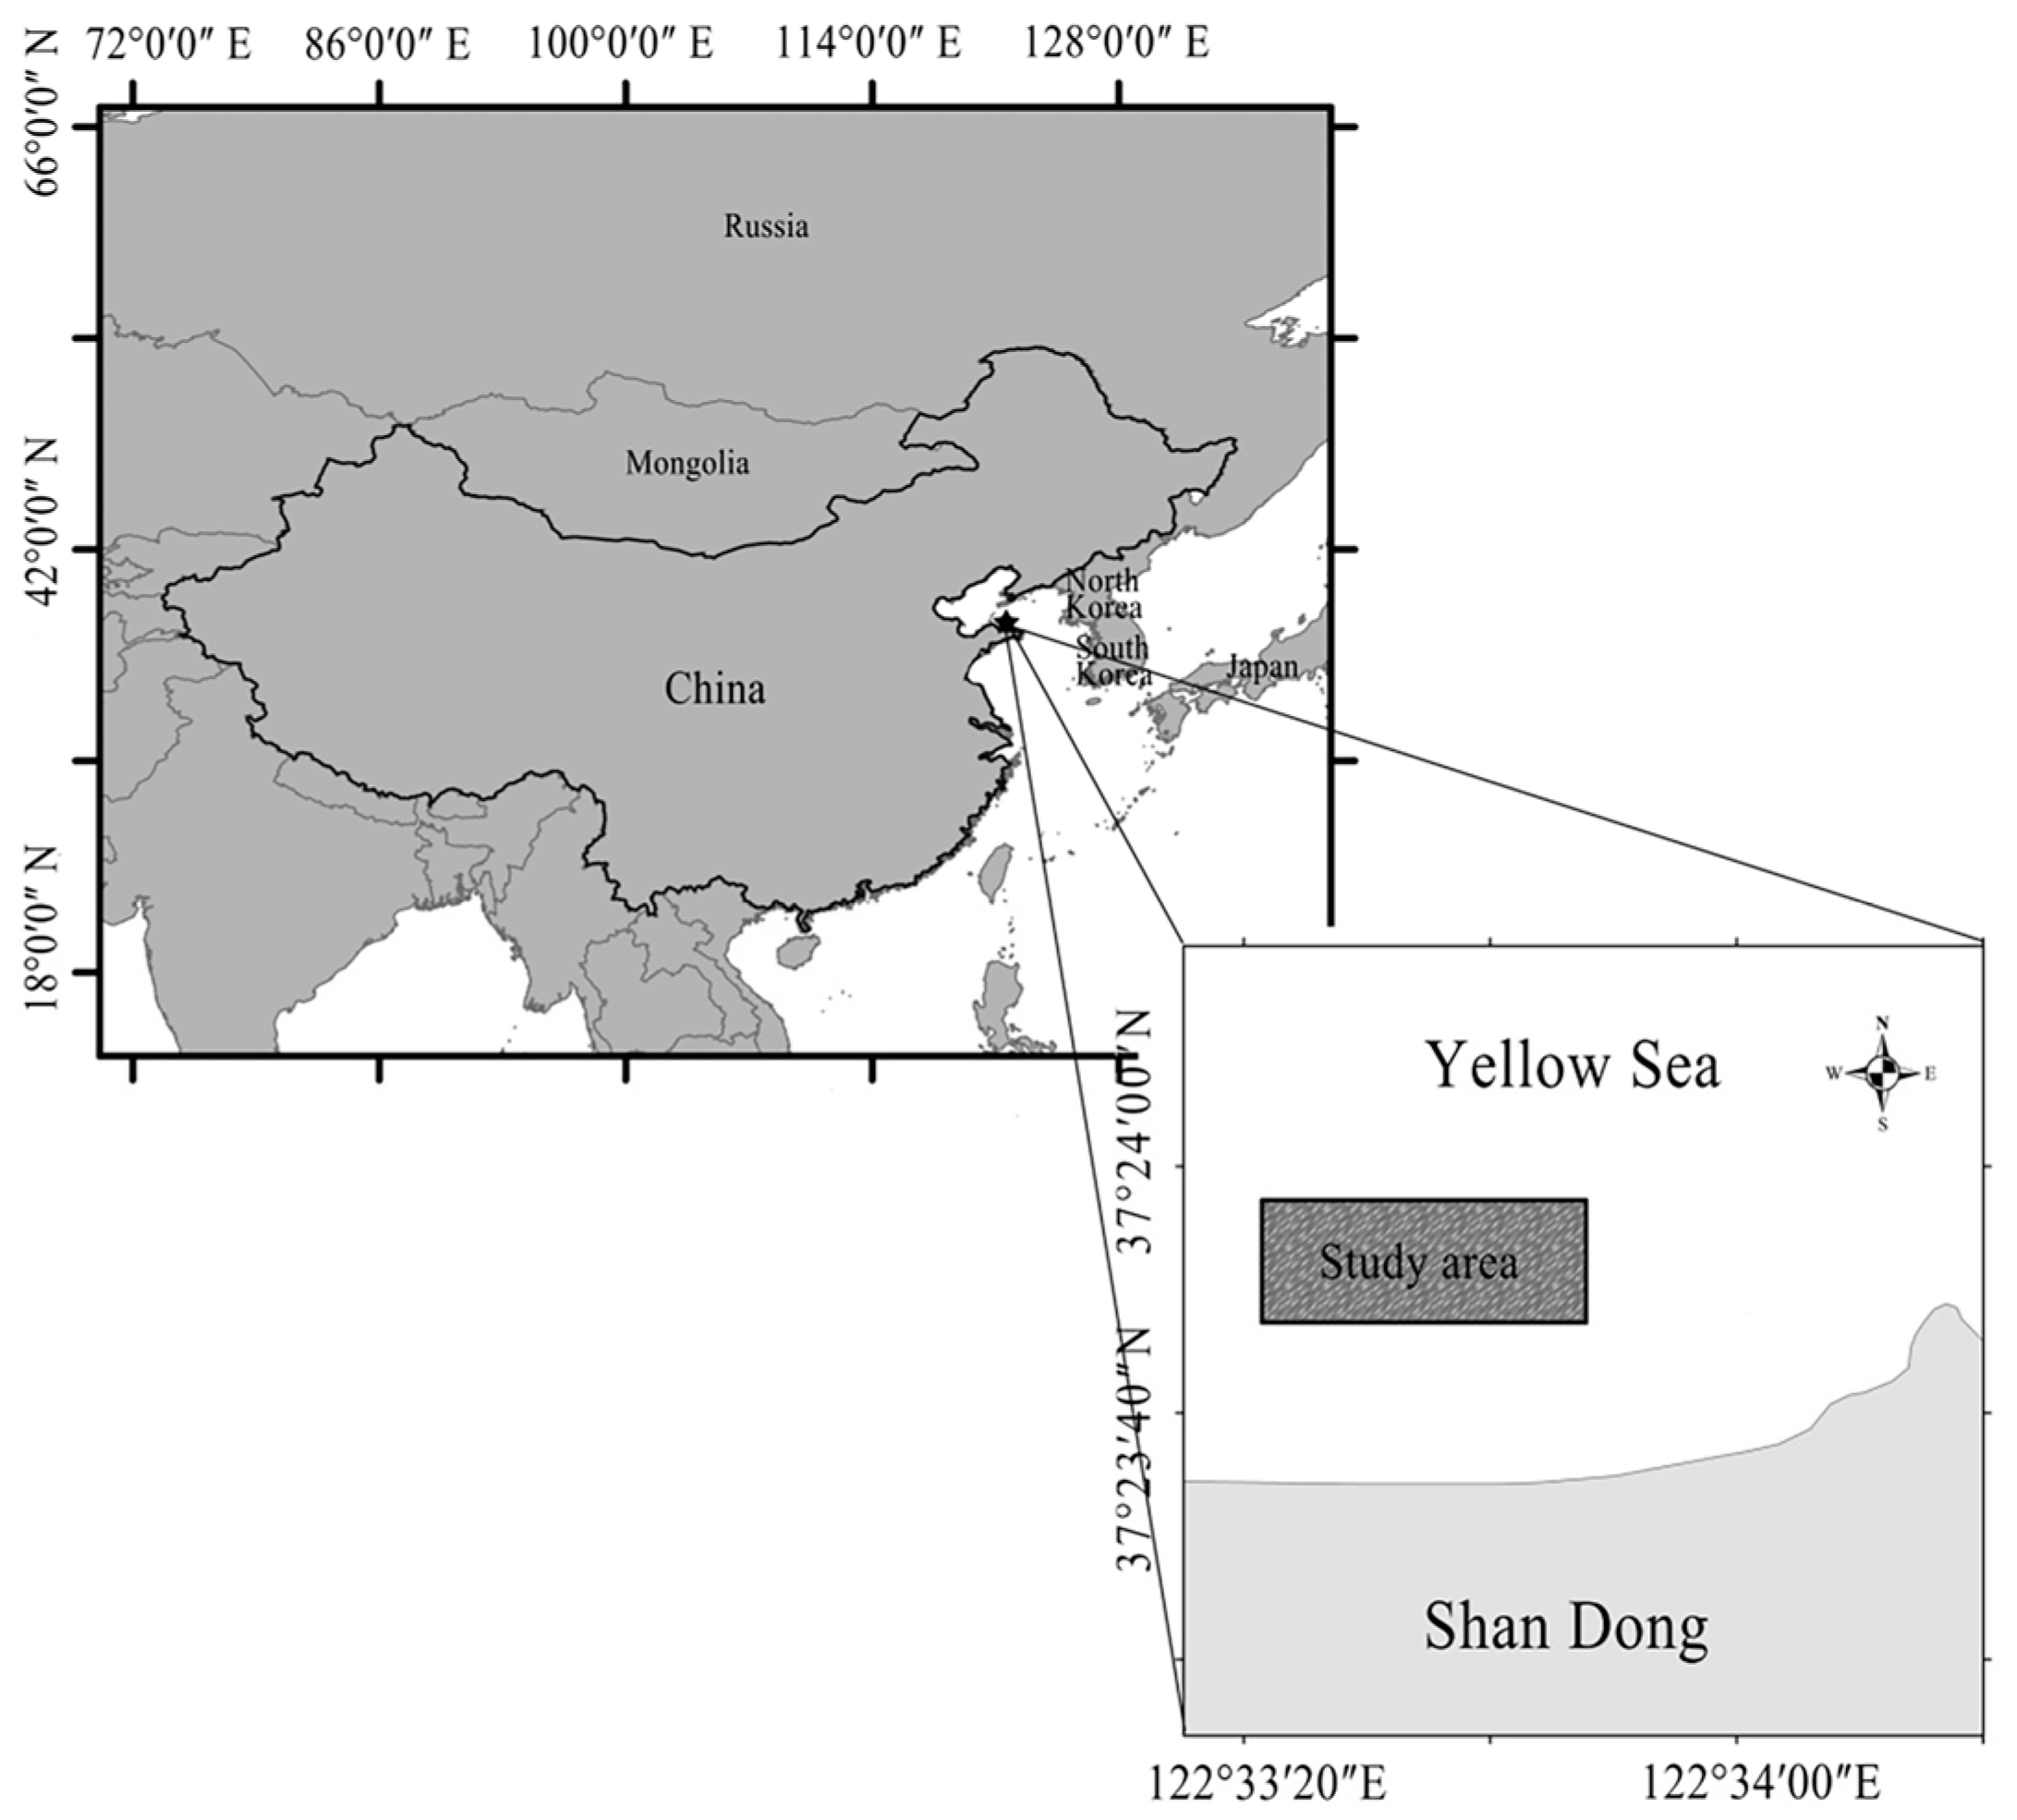
Figure 1. Map of the study area.
Sustainability 15 06583 g001
Figure 2. (a) Specifications of the stow nets. N, vertical mesh number of nets; L, stretched length of vertical mesh; MAT, material; PE, polyethylene fiber; tex, line density; 2a, mesh size. (b) Schematic diagram of the stow nets with cover attached.
Sustainability 15 06583 g002
Figure 3. Estimated average population from all hauls for (a) little yellow croaker (Larimichthys polyactis), (b) silver croaker (Pennahia argentata), and (c) flower croaker (Nibea albiflora) during the sea trials. The dashed curves represent the 95% confidence intervals, and the vertical lines indicate the minimum landing size (MLS) for three target species, respectively.
Sustainability 15 06583 g003
Figure 4. Size selectivity curves modelled for little yellow croaker (Larimichthys polyactis) in the six tested codends. Circles represent experimental catch proportion. Thick solid curves and dashed curves represent the mean and 95% confidence intervals for the fitted selectivity curves, respectively. Red curves and grey curves represent the size distribution of fish retained in the tested codend and the cover, respectively. Vertical dashed lines indicate the minimum landing size (MLS) of little yellow croaker.
Sustainability 15 06583 g004
Figure 5. Size selectivity curves modelled for silver croaker (Pennahia argentata) in the six tested codends. Circles represent experimental catch proportion. Thick solid curves and dashed curves represent the mean and 95% confidence intervals for the fitted selectivity curves, respectively. Red curves and grey curves represent the size distribution of fish retained in the tested codend and the cover, respectively. Vertical dashed lines indicate the minimum landing size (MLS) of silver croaker.
Sustainability 15 06583 g005
Figure 6. Size selectivity curves modelled for flower croaker (Nibea albiflora) in the six tested codends. Circles represent experimental catch proportion. Thick solid curves and dashed curves represent the mean and 95% confidence intervals for the fitted selectivity curves, respectively. Red curves and grey curves represent the size distribution of fish retained in the tested codend and the cover, respectively. Vertical dashed lines indicate the minimum landing size (MLS) of flower croaker.
Sustainability 15 06583 g006
Figure 7. Delta selectivity curves between six tested codends for little yellow croaker (Larimichthys polyactis). Thick solid curves represent the delta selectivity for each comparison, and dashed curves represent the 95% confidence intervals. Vertical dashed lines indicate the minimum landing size (MLS) of little yellow croaker.
Sustainability 15 06583 g007
Figure 8. Delta selectivity curves between six tested codends for silver croaker (Pennahia argentata). Thick solid curves represent the delta selectivity for each comparison, and dashed curves represent the 95% confidence intervals. Vertical dashed lines indicate the minimum landing size (MLS) of silver croaker.
Sustainability 15 06583 g008
Figure 9. Delta selectivity curves between six tested codends for flower croaker (Nibea albiflora). Thick solid curves represent the delta selectivity for each comparison, and dashed curves represent the 95% confidence intervals. Vertical dashed lines indicate the minimum landing size (MLS) of flower croaker.
Sustainability 15 06583 g009
Table 1. Specification of the tested codends and the cover. SD represents standard errors.
CodendMesh Size ± SD (mm)Twine Diameter ± SD (mm)Mesh Number in CircumferenceMesh Number in Length
D3535.72 ± 0.891.23 ± 0.17246137
D4544.60 ± 0.671.18 ± 0.09197110
D5555.18 ± 0.701.10 ± 0.1015989
S3535.09 ± 1.011.15 ± 0.14150266
S4544.30 ± 0.351.21 ± 0.09119211
S5554.61 ± 0.531.16 ± 0.2397171
cover14.58 ± 0.321.08 ± 0.11495831
Table 2. Overview of catch data in the sea trials. No. of individuals in codend and cover represents the number of measured individuals.
Data SpecificationCodends
D35D45D55S35S45S55
Depth (m)20–2221–2318–2119–2223–2522–25
Soak times (h)22–2423–2424–2522–2523–2523–26
Little yellow croaker
No. of hauls101099810
No. of individuals in codend270269196231194193
No. of individuals in cover68119152121160224
Sub-sampling factor in codend0.50–1.001.00–1.001.00–1.001.00–1.001.00–1.001.00–1.00
Sub-sampling factor in cover0.50–1.001.00–1.001.00–1.001.00–1.001.00–1.000.50–1.00
Length range (cm)7.3–25.77.2–25.97.1–25.57.2–25.67.6–25.87.5–25.4
Weight range (g)3.7–136.23.8–135.33.7–133.03.9–134.33.6–135.73.4–129.4
Silver croaker
No. of hauls898978
No. of individuals in codend16014212716312497
No. of individuals in cover5459716692129
Sub-sampling factor in codend1.00–1.001.00–1.001.00–1.001.00–1.001.00–1.001.00–1.00
Sub-sampling factor in cover1.00–1.001.00–1.001.00–1.001.00–1.001.00–1.001.00–1.00
Length range (cm)5.4–23.25.8–24.95.2–24.46.6–23.86.3–24.65.1–24.7
Weight range (g)1.2–138.91.7–178.11.1–176.02.4–170.31.8–165.31.0–179.1
Flower croaker
No. of hauls789778
No. of individuals in codend150137157139125110
No. of individuals in cover2955102459093
Sub-sampling factor in codend0.50–1.000.50–1.000.50–1.000.50–1.001.00–1.000.50–1.00
Sub-sampling factor in cover1.00–1.001.00–1.000.50–1.001.00–1.000.50–1.000.50–1.00
Length range (cm)7.5–26.66.2–26.46.6–26.96.1–26.26.5–25.76.8–25.8
Weight range (g)3.9–220.01.6–221.22.4–217.61.2–217.03.2–212.32.6–195.3
Table 3. Akaike’s information criterion (AIC) of each model for the tested codends. Selected model in bold.
SpeciesCodendsModels
LogitProbitGompertzRichards
Little yellow croakerD35204.63203.93207.08206.63
D45273.87271.87274.22275.75
D55234.43232.25234.98236.26
S35217.43215.97217.90219.13
S45264.82262.64264.22265.95
S55319.21317.29325.23320.88
Silver croakerD35112.64111.70113.29114.64
D45112.05111.04115.42110.79
D5587.4986.6387.8489.39
S3596.7496.3395.7597.75
S45147.77146.72151.25145.03
S55150.44149.63156.26146.38
Flower croakerD3589.0088.2489.2390.99
D45128.31127.30129.28130.02
D55204.20203.28210.46205.07
S35113.22112.36118.04109.01
S45190.15190.26196.98190.96
S55182.27182.56190.21182.91
Table 4. Estimated selectivity parameters and fit statistics obtained from the selected models for the tested codends.
SpeciesParametersCodends
D35D45D55S35S45S55
Little yellow croakerModelProbitProbitProbitProbitProbitProbit
L50 (cm)9.92
(9.43–10.35)
11.51
(11.02–11.96)
13.73
(13.33–14.09)
11.95
(11.48–12.38)
13.84
(13.41–14.28)
15.41
(14.98–15.82)
SR (cm)2.16
(1.62–2.84)
2.68
(2.20–3.22)
2.51
(2.00–3.00)
2.58
(1.98–3.16)
2.64
(2.08–3.14)
2.71
(2.19–3.22)
p-value>0.99990.99330.99830.99910.99670.9682
Deviance1.785.994.84.355.337.92
DOF171717171717
Silver croakerModelProbitRichardsProbitGompertzRichardsRichards
L50 (cm)8.54
(8.07–9.05)
10.38
(9.29–10.87)
11.96
(11.49–12.38)
10.24
(9.91–10.56)
12.60
(11.71–13.00)
14.47
(13.45–14.99)
SR (cm)2.11
(1.52–2.61)
2.62
(1.56–3.56)
1.80
(1.19–2.28)
1.80
(1.19–2.28)
2.30
(1.54–3.09)
2.78
(1.93–3.72)
δ 0.10
(0.10–100.00)
0.10
(0.10–100.00)
0.10
(0.10–1.91)
p-value>0.99990.9985>0.9999>0.99990.99530.9991
Deviance2.344.692.581.145.094.32
DOF171718161617
Flower croakerModelProbitProbitProbitRichardsLogitLogit
L50 (cm)8.76
(8.16–9.30)
10.12
(9.44–10.77)
12.45
(11.60–13.12)
10.28
(9.19–11.01)
12.66
(11.51–13.61)
14.23
(13.18–15.13)
SR (cm)1.80
(1.23–2.56)
2.67
(1.79–3.72)
2.94
(2.03–3.68)
4.10
(2.23–6.09)
3.54
(2.52–4.52)
3.54
(2.37–4.87)
δ 0.10
(0.10–0.73)
p-value>0.99990.99780.9977>0.99990.32570.6153
Deviance2.456.046.080.3220.1315.67
DOF181919181818
Table 5. Exploitation pattern indicators and 95% confidence intervals (in brackets) obtained for the tested codends.
SpeciesIndicatorsCodends
D35D45D55S35S45S55
Little yellow croakernP− (%)77.52
(72.84–81.95)
57.74
(51.56–63.86)
27.61
(22.38–33.67)
52.03
(45.85–58.51)
26.53
(20.41–32.85)
11.03
(7.48–15.25)
nP+ (%)100.00
(99.93–100.00)
99.44
(98.71–99.84)
95.22
(92.65–97.77)
99.20
(98.12–99.81)
94.20
(91.52–96.73)
83.28
(78.68–88.10)
nRatio1.39
(1.21–1.57)
1.04
(0.88–1.20)
0.52
(0.41–0.64)
0.94
(0.80–1.11)
0.51
(0.39–0.64)
0.24
(0.16–0.32)
ndRatio (%)58.20
(54.84–61.07)
51.05
(46.90–54.64)
34.25
(29.11–39.04)
48.51
(44.43–52.71)
33.59
(28.28–38.96)
19.22
(13.78–24.53)
wP− (%)88.88
(85.30–91.64)
71.05
(65.21–76.70)
37.72
(31.17–44.92)
65.60
(59.29–72.36)
36.14
(28.60–43.49)
15.74
(10.93–21.19)
wP+ (%)100.00
(99.96–100.00)
99.70
(99.28–99.92)
97.36
(95.80–98.83)
99.57
(98.95–99.90)
96.76
(95.06–98.24)
90.23
(86.94–93.33)
Silver croakernP− (%)76.02
(70.30–81.15)
60.54
(53.35–67.90)
34.89
(28.28–42.12)
55.99
(50.45–61.99)
33.01
(26.19–41.11)
16.72
(11.10–22.80)
nP+ (%)100.00
(100.00–100.00)
100.00
(99.74–100.00)
99.93
(99.60–100.00)
99.97
(99.82–100.00)
100.00
(98.44–100.00)
95.66
(92.00–98.91)
nRatio1.58
(1.33–1.90)
1.25
(1.03–1.53)
0.72
(0.55–0.93)
1.16
(0.95–1.41)
0.68
(0.52–0.91)
0.36
(0.23–0.51)
ndRatio (%)61.17
(57.16–65.46)
55.64
(50.62–60.46)
41.97
(35.61–48.10)
53.71
(48.79–58.43)
40.62
(34.10–47.64)
26.59
(18.80–33.92)
wP− (%)92.10
(88.78–94.69)
81.47
(76.34–86.31)
57.56
(49.55–66.17)
79.81
(74.84–84.31)
52.46
(45.02–61.04)
25.90
(18.52–35.05)
wP+ (%)100.00
(100.00–100.00)
100.00
(99.87–100.00)
99.97
(99.82–100.00)
99.98
(99.91–100.00)
100.00
(99.17–100.00)
98.07
(96.20–99.53)
Flower croakernP− (%)82.37
(77.14–87.09)
67.44
(59.87–74.21)
41.33
(33.32–51.51)
69.43
(61.63–76.71)
40.05
(30.93–51.56)
25.60
(18.33–36.21)
nP+ (%)100.00
(100.00–100.00)
100.00
(99.96–100.00)
99.83
(99.24–100.00)
100.00
(99.98–100.00)
98.80
(97.06–99.76)
96.96
(93.40–99.39)
nRatio1.90
(1.54–2.35)
1.56
(1.22–1.95)
0.95
(0.71–1.29)
1.60
(1.27–2.01)
0.93
(0.69–1.29)
0.61
(0.42–0.91)
ndRatio (%)65.51
(60.61–70.17)
60.86
(54.98–66.05)
48.84
(41.44–56.32)
61.56
(55.99–66.83)
48.31
(40.82–56.36)
37.85
(29.75–47.67)
wP− (%)94.99
(92.97–96.50)
85.48
(80.09–89.51)
62.47
(53.95–73.14)
86.21
(81.08–91.05)
58.87
(48.05–70.23)
41.65
(31.77–53.52)
wP+ (%)100.00
(100.00–100.00)
100.00
(99.98–100.00)
99.92
(99.61–100.00)
100.00
(99.99–100.00)
99.31
(98.16–99.87)
98.23
(95.79–99.68)
Disclaimer/Publisher’s Note: The statements, opinions and data contained in all publications are solely those of the individual author(s) and contributor(s) and not of MDPI and/or the editor(s). MDPI and/or the editor(s) disclaim responsibility for any injury to people or property resulting from any ideas, methods, instructions or products referred to in the content.