Article

Sustainable Road Pothole Detection: A Crowdsourcing Based Multi-Sensors Fusion Approach

1
ZJU-UIUC Institute, School of Civil Engineering, Zhejiang University, Haining 314400, China
2
College of Civil Engineering and Architecture, Zhejiang University, Hangzhou 310058, China
3
School of Software Technology, Zhejiang University, Hangzhou 310058, China
4
Department of Engineering, University of Cambridge, Trumpington Street, Cambridge CB2 1PZ, UK
5
School of Public Affairs, Zhejiang University, Hangzhou 310058, China
6
Alibaba-Zhejiang University Joint Research Institute of Frontier Technologies, Hangzhou 310058, China
*
Author to whom correspondence should be addressed.
Sustainability 2023, 15(8), 6610; https://doi.org/10.3390/su15086610
Submission received: 6 March 2023 / Revised: 6 April 2023 / Accepted: 10 April 2023 / Published: 13 April 2023
(This article belongs to the Section Sustainable Transportation)

Abstract

:
Real-time road quality monitoring, involves using technologies to collect data on the conditions of the road, including information on potholes, cracks, and other defects. This information can help to improve safety for drivers and reduce costs associated with road damage. Traditional methods are time-consuming and expensive, leading to limited spatial coverage and delayed responses to road conditions. With the widespread use of smartphones and ubiquitous computing technologies, data can be collected from built-in sensors of mobile phones and in-vehicle video, on a large scale. This has raised the question of how these data can be used for road pothole detection and has significant practical relevance. Current methods either use acceleration sequence classification techniques, or image recognition techniques based on deep learning. However, accelerometer-based detection has limited coverage and is sensitive to the driving speed, while image recognition-based detection is highly affected by ambient light. To address these issues, this study proposes a method that utilizes the fusion of accelerometer data and in-vehicle video data, which is uploaded by the participating users. The preprocessed accelerometer data and intercepted video frames, were then encoded into real-valued vectors, and projected into the public space. A deep learning-based training approach was used to learn from the public space and identify road anomalies. Spatial density-based clustering was implemented in a multi-vehicle scenario, to improve reliability and optimize detection results. The performance of the model is evaluated with confusion matrix-based classification metrics. Real-world vehicle experiments are carried out, and the results demonstrate that the proposed method can improve accuracy by 6% compared to the traditional method. Consequently, the proposed method provides a novel approach for large-scale pavement anomaly detection.

1. Introduction

Road pothole detection is essential in enhancing the transportation system’s resilience. Different types of road surface damage, such as bumps and potholes, not only affect the driving experience, but also increase the tear and wear of vehicle components, such as tires and suspension systems, thereby increasing the possibility of road accidents [1]. According to the American Society for Civil Engineers (ASCE) 2021 report card on America’s infrastructure, 43% of major roads in the United States are rated as poor. Driving on such roads, costs an additional USD 130 billion a year in vehicle maintenance. Hence, efficient and low-cost detection of road anomalies on a large scale, can improve fuel efficiency and driving safety, and reduce the costs of vehicle and road maintenance.
Many methods have been proposed for detecting road surface anomalies in the past. Existing road detection methods can be broadly divided into five categories: (i) manual detection based on subjective experience [2]; (ii) modeling road profiles using three-dimensional light amplification by stimulated emission of radiation (3D LASER) scanners [3,4,5]; (iii) specialized multifunctional road inspection vehicles [2]; (iv) detection methods based on vehicle vibration information [6,7]; and (v) computer vision-based detection methods [8,9,10,11]. The manual collection method is subjective, inefficient, and impractical, while detection vehicles and 3D scanners are expensive. Furthermore, pavement conditions are slowly changing, with potential cracks developing into potholes. Therefore, it is preferable to achieve real-time detection of road potholes. However, none of these methods is suitable for large-scale, real-time detection. To this end, it is essential to find a cost-effective and sustainable method to detect road anomalies [12].
To meet current pavement maintenance needs, detecting road anomalies with high spatial and temporal coverage has been widely researched. The vibration of the vehicle is the most obvious response to the potholes on the road, and it has been demonstrated that road anomalies can be detected by establishing a relationship between some vibration signatures and road surface characteristics [7,13,14,15]. For example, Andren [15] proposed that a road roughness spectrum could be derived from the vehicle vibration spectral density. Accelerometers are widely used for measuring vehicle vibrations, and can show variations when a vehicle passes over a pothole. The vibration-based method involves studying how to accurately identify abnormal acceleration data segments from a series of acceleration data. With the growing popularity of smartphones and the development of sensing technology, smartphone sensing is becoming increasingly widely used in research [16]. Early methods used various thresholds to filter out abnormal acceleration segments. However, they were susceptible to noise and drift. Machine learning methods have improved the accuracy of road pothole detection, but large-scale, high-frequency detection is still not feasible [17,18,19]. In general, road pothole detection based on acceleration data, may be confused between road potholes and other vertical discontinuities (such as road junctions). Some other studies utilize computer vision technology to detect anomalies, from road images recorded during driving [20,21,22,23,24]. However, the accuracy of this approach is greatly affected by the environment, e.g., brightness. If appropriate associations can be made between visual and acceleration data, the fused information from the two can be used, allowing the two to complement each other and increase the accuracy and scale of detection.
On the other hand, the widespread popularity of smartphones has made it possible for the public to contribute a wealth of perceptual resources regarding the surrounding environment. This has become a major research direction for large-scale pothole detection [25]. A significant number of studies have been carried out using public data, such as route planning and traffic density estimation [25,26,27,28]. With regard to road anomaly detection, it is not unrealistic to assume that drivers and passengers are traveling with their smartphones onboard. This makes it possible to collect vibration data through participating mobile devices. By combining smartphone-measured acceleration data with camera data, road detection can be improved in accuracy and scale. On this basis, crowdsourcing public sensing data through smartphones, allows data collection from many perceptual resources, and thus can improve effective sampling rates. This allows for real-time updates and early detection of road potholes, making it possible to inform road maintenance in time, thus preventing further damage. The low cost and comprehensive coverage of crowdsourced data, also make it a feasible solution to large-scale pavement pothole detection.
To facilitate large-scale and low-cost road pothole detection, this study proposes a road pothole detection system based on crowd-sensing data, which includes multiple mobile clients and data processing servers (see Figure 1). The system first uses the threshold method, to exclude data representing normal road segments. Then, two alternative detection modules can be employed, depending on whether the environment brightness is adequate. Specifically, when in good light conditions, video and acceleration data are fused (module 1). On the other hand, in poor light conditions, only acceleration data are used (module 2). In the first module, video frames and accelerations are encoded into real-valued vectors. The vectors are then projected into a common space. On this basis, pothole detection is carried out by learning from the common space. In the second module, pothole detection is performed using our proposed recognition model based on the long short-term memory (LSTM) algorithm. Finally, the system crowdsourced detection results are generated by different vehicles equipped with smartphones and onboard cameras, to optimize the detection results and realize real-time road detection.
The main contributions of the paper are as follows:
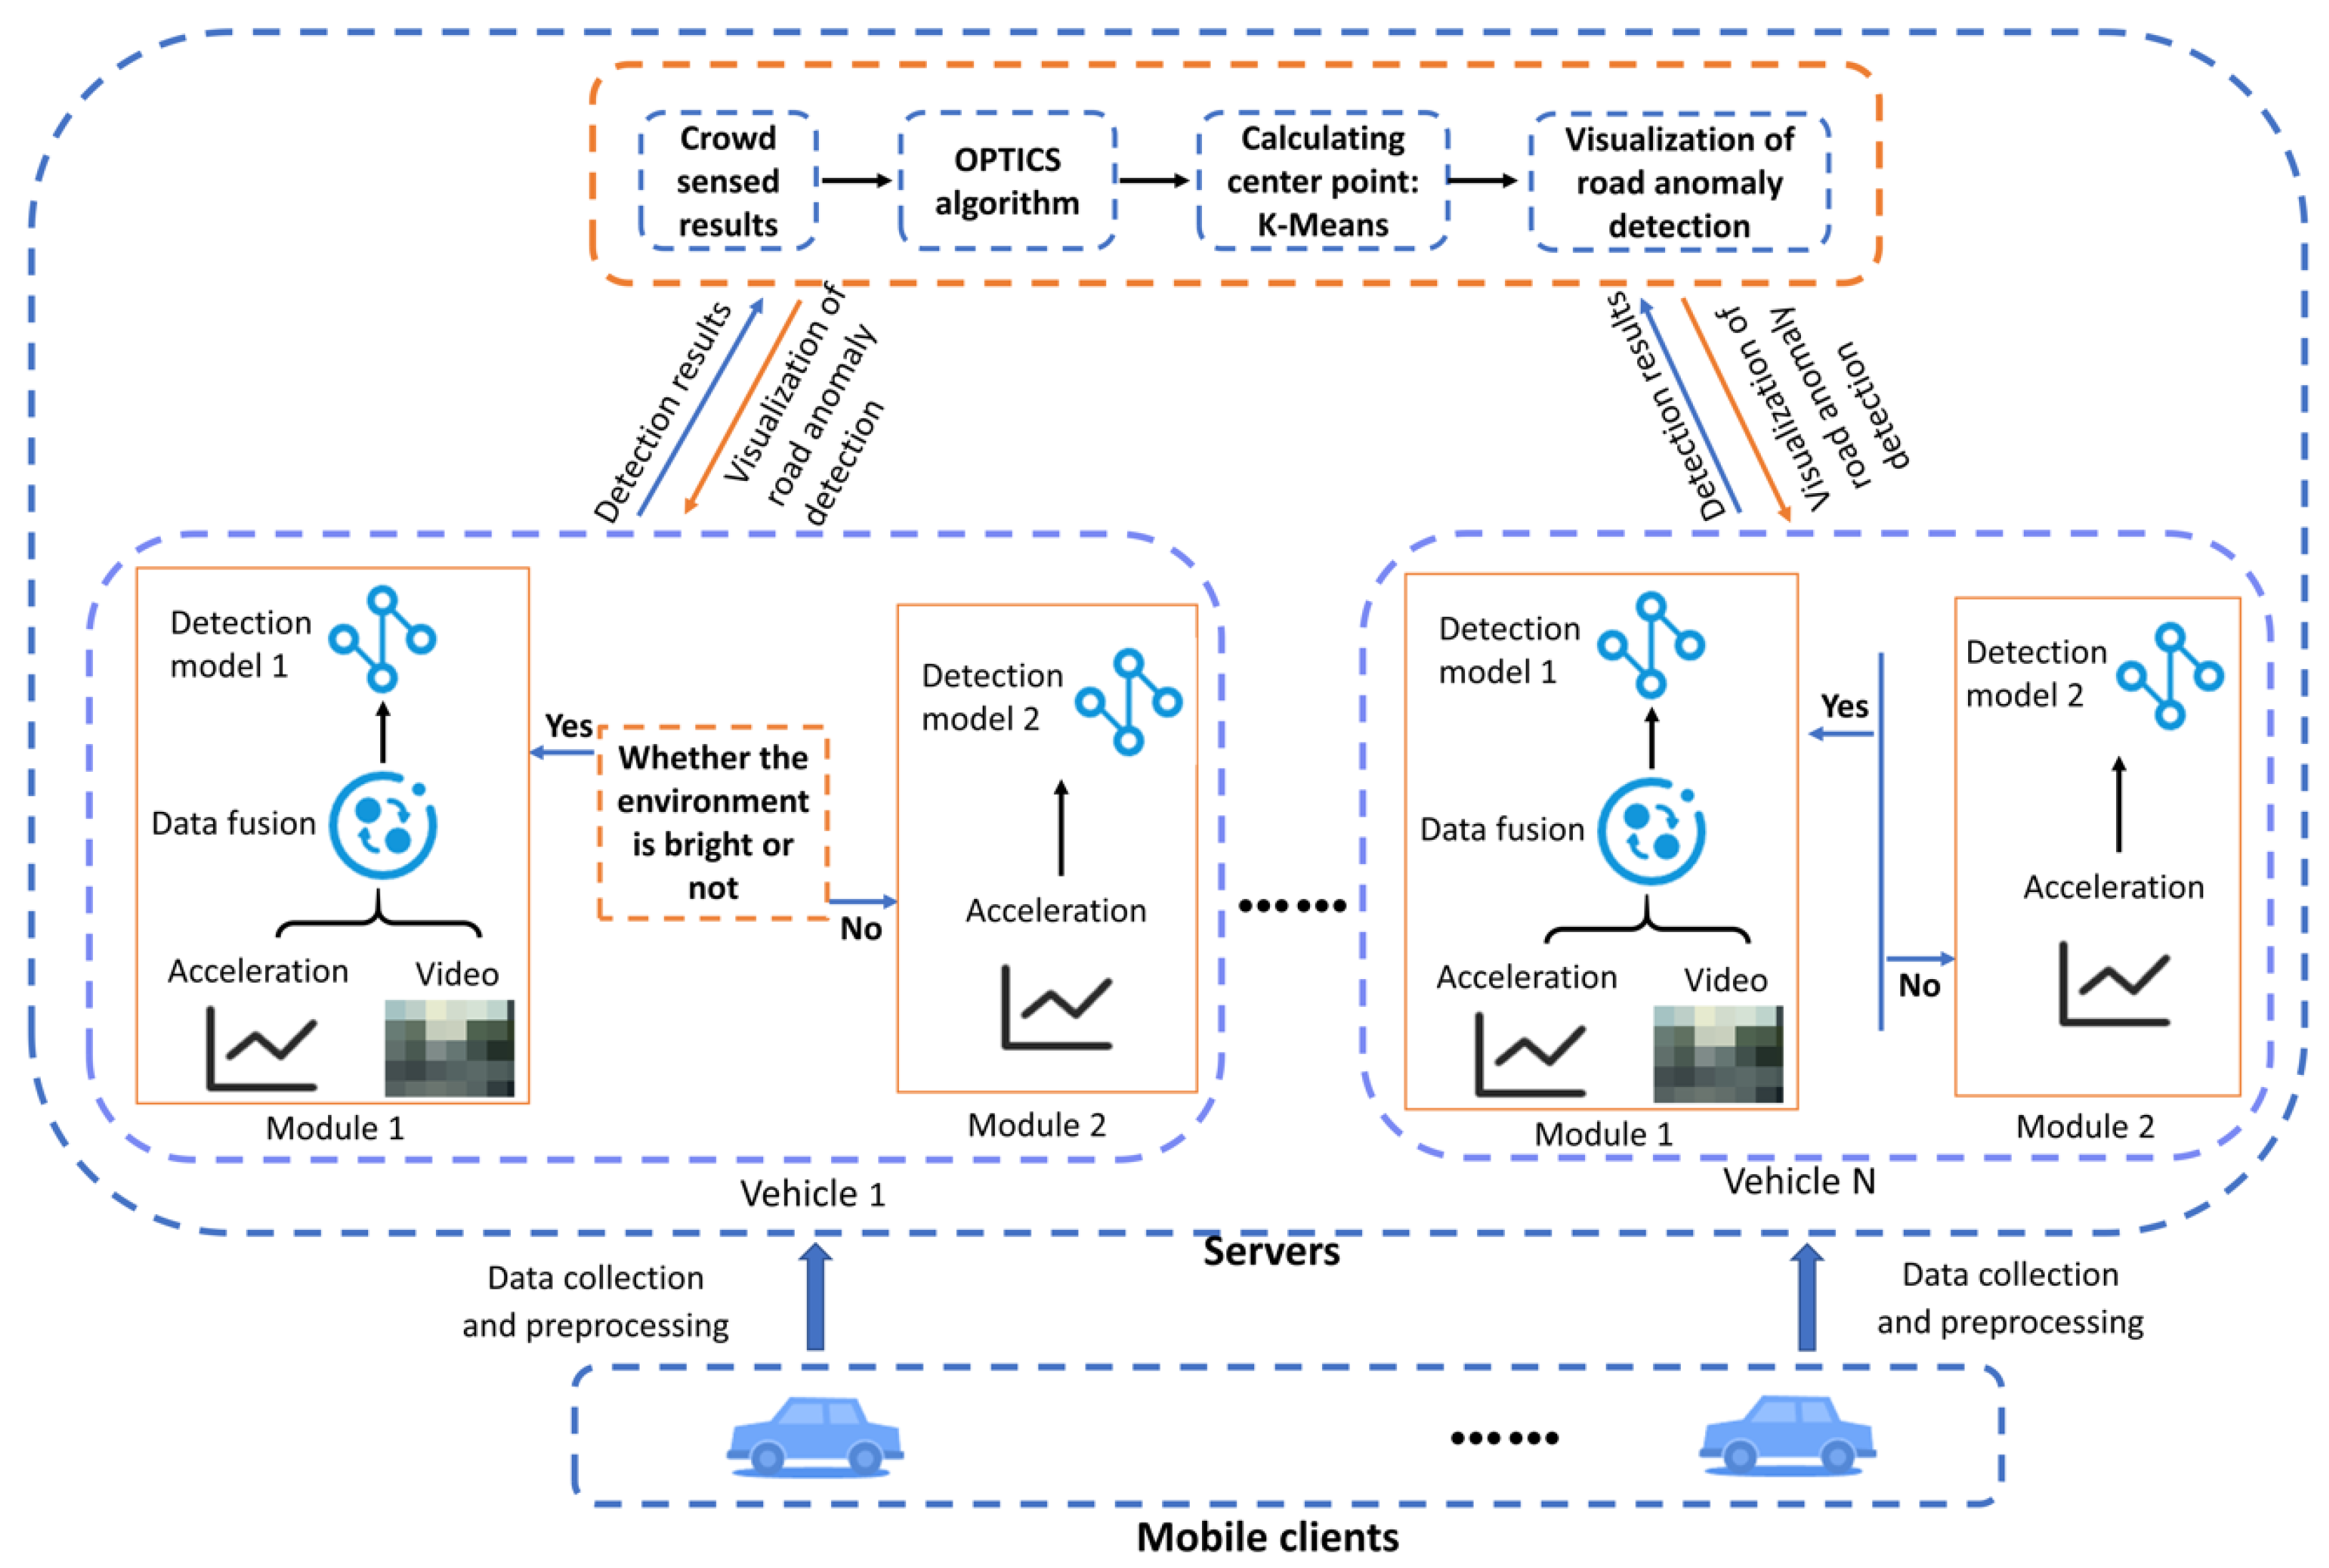
  • A data-driven automatic classification model, based on the LSTM network, is used to realize road pothole detection. The LSTM network is capable of creating a nonlinear relationship between the output of the previous signal and the input of the current signal, thus conveying the information in the time series without information loss.
  • The ordering points to identify the clustering structure (OPTICS) clustering method, is used to improve the accuracy of road anomaly detection. Compared to the well-established k-means algorithm, the OPTICS algorithm does not require a preset number of clusters, and can cluster data with an arbitrary shape of the sample distribution. Compared to the increasingly widely used density-based spatial clustering of applications with noise (DBSCAN) algorithm, OPTICS can accurately detect each cluster in the sample points with different densities, making it more suitable for integrating crowd-sensing results and further improving detection accuracy.
  • A road pothole detection system, involving data fusion between acceleration measurements and video frames, is developed. The data fusion features encoding video and acceleration data into real-valued vectors and then projecting them into a common space, to facilitate further adoption of learning-based approaches.
The organization of this study is as follows: Section 2 reviews the existing research for road pothole detection. A detailed description of the proposed road pothole detection system is given in Section 3. Section 4 describes the procedure of the experiment. Section 5 analyses the results of the experiment. Section 6 summarizes the work of this study.

2. Related Work

Manual detection, lidar detection, and detection based on special equipment vehicles, are inefficient and costly. Current research dedicated to finding large-scale and low-cost road pothole detection methods can be roughly divided into the following two categories: detecting potholes encountered in driving, based on vehicle vibration, and computer vision-based techniques, to identify potholes in images. At the same time, attempts to use crowdsourced public data to achieve large-scale detection, have emerged in research on both of the above-mentioned detection methods.
The detection method based on vehicle vibration, detects vehicle vibrations through sensors, establishes the relationship between vibrations and road surface potholes, and then measures the road surface potholes. The vibration-based road anomaly detection method, involves using an accelerometer to detect vehicle vibrations. When a vehicle passes over a pothole, the accelerometer data will show a significant change. The goal of this method is to identify any abnormal acceleration data from a sequence of acceleration data. With the rapid development of smartphones in recent years, the technology of road detection using the built-in sensors of smartphones has become an important supplement to road pothole detection. Many studies have demonstrated that the built-in accelerometers of mobile phones can be used to detect road anomalies [7,13,15]. Vaiana et al., investigated young drivers’ driving behavior on horizontal curves, by analyzing speed and acceleration data collected via smartphones. They created a centralized database containing the entire spatial information and vehicle GPS data. A behavioral model based on objective safety conditions and subjective safety perceptions, was used to explain the drivers’ adaptation to different road conditions. Gillespie et al. [29] were the first to develop methods for the indirect detection of road anomalies. Botshekan et al. [13] estimated road roughness from the power spectral density (PSD) of acceleration, based on stochastic vibration analysis of a semi-vehicle mechanical model of roughness-induced road-vehicle interaction, and demonstrated that the location of the mobile phone in the vehicle only slightly affects the detection of road roughness. On the basis of using the PSD of acceleration to reflect the road profiles, Daraghmi et al. [7] used blind source separation technology to separate the vehicle model from the measurement of acceleration, so as to reduce the influence of the vehicle model on the detection results. However, the road surface roughness reflects the vertical deviation of the road surface relative to the ideal plane, and the road surface roughness index reflects the overall fluctuation of a section of the road, rather than the specific location of potholes.
The methods of road anomaly detection based on acceleration data, can be divided into the following three methods: threshold-based methods, machine learning-based methods, and the method based on wavelet transform. Eriksson et al. [30] proposed a threshold-based pothole patrol system, in which each experimental vehicle was equipped with an external global positioning system (GPS) and accelerometer. Five thresholds: speed, high-pass, z-peak, xz-ratio, and speed vs. z-ratio, were then used to filter out the non-pothole data. Mednis et al. [18] found that the acceleration in all three axes converges to zero at the moment a vehicle passes over a pothole. Based on this finding, they proposed the G-ZERO algorithm and compared it with three other commonly used threshold-based algorithms, showing that their algorithm could achieve an accuracy rate of 85%. However, this accuracy only indicates that the majority of the potholes identified are correctly identified and does not indicate what proportion of the potholes can be identified from those that actually exist. Li et al. [31] used the root mean square of the z-axis acceleration for each segment of the road, to calculate a proxy for IRI, to measure the roughness of the road segment. Carlos et al. [32] developed a platform for creating road datasets, and contrasted six of the most popular threshold-based heuristics on datasets of road conditions assembled using the platform. The best-performing method was the STDEV (Z) method proposed by Mednis et al. [18], who detected potholes by calculating the standard deviation of accelerometer measurements along the z-axis. In that study, they incorporated the features used by these heuristics into feature extraction, to provide new feature vectors for SVM, and the results were better than STDEV (Z). Although the threshold-based approach is relatively simple to implement, it has the following two disadvantages: it is difficult to remove noise present in the data, from situations such as emergency braking, sharp turns, etc., which cause large fluctuations in the acceleration data; secondly, reliable thresholds have to be obtained based on a large number of experiments, but due to differences in road types, equipment sensor performance, and mechanical properties of vehicles, the thresholds generally need to be adjusted or even retested. The workload is large, and it is difficult to apply to large-scale road surface detection.
Besides finding thresholds directly in the time domain, machine learning is another commonly used approach. At the same time, in order to meet both accuracy and efficiency requirements, smartphones with built-in sensors, such as accelerometers and GPS, are widely used for road condition detection. Kalim et al. [33] extracted a series of statistical features, such as mean, maximum, minimum, etc., from in-vehicle smartphone data. Then, machine learning methods such as support vector machines (SVM), decision trees, and naive Bayes, were used to classify the segmented acceleration samples, to identify road anomalies. Vehicle acceleration is characterized by a stationary random signal, so its frequency-domain features are more stable than its time-domain features. For example, Perttunen et al. [17] used fast Fourier transforms to extract signal features from the frequency domain, and then used support vector machines to detect road anomalies. Basavaraju et al. [19] not only considered the features of the signal in the time and frequency domains, but also extracted the features after wavelet transformation. After that, the extracted feature matrices were input into SVM, a decision tree, and a neural network, respectively, for road anomaly recognition. The proliferation of smartphones has made vehicles for public use, potentially intelligent rovers, that can sense the condition of the entire road network by crowdsourcing onboard smartphone data. Some researchers have attempted to design a crowd-aware system, that can continuously and massively detect changes in road conditions [33,34,35,36]. After identifying road anomalies through machine learning, Kalim et al. [33] identified those potholes reported by more than five different users, as road anomalies. Lima et al. [34] achieved crowdsourcing by setting a series of thresholds to identify road quality, simply averaging the perception results. Li et al. [35] analyzed the acceleration data through continuous wavelet transform, to identify road anomalies and estimate their magnitudes. They then used spatial clustering to cluster multiple vehicle test results according to spatial density, to obtain optimized detection results. However, the crowdsourcing method they adopted is not suitable for the uneven density of the dataset, and because the number of road anomalies detected is inconsistent, the density of each class is also different, so this method is not suitable for crowdsourcing of multi-vehicle results. Vibration-based methods are more economical and convenient than manual and laser-based inspections. However, it is difficult to detect some cracks that are likely to develop into potholes and potholes at intersections. Because the former can hardly cause abnormal vibration of the vehicle, the latter is difficult to detect, because the speed is generally slow when passing by.
With the development of computer vision technology, many researchers have begun to explore methods that rely on image recognition technology, to detect road images taken during vehicle driving. Akagic et al. [22] proposed a vision-based unsupervised method for pothole detection. The method only targets asphalt pavements and extracts asphalt pavement information by analyzing the color space features of red, green, blue (RGB) images, then performs image segmentation, followed by image processing and spectral clustering, to detect potholes on the segmented asphalt pavements. Zhang et al. [23] trained a supervised deep convolutional neural network (CNN) to learn discriminative features directly from their images, enabling the classification of road surface images captured by mobile phones. Similarly, Fan et al. [37] used CNN to determine whether there were cracks in the pavement image, and then used an adaptive threshold method to extract cracks from the pavement image, smoothed by bilateral filtering for images with cracks. Liu et al. [20] proposed the YOLOv3-FDL model with four scale detection layers (FDL), achieving the detection of hidden pavement cracks from B-scan and C-scan views of ground penetrating radar images with different features. The model employs the efficient intersection over union loss function for bounding box regression, and the k-means++ clustering algorithm to create new anchor sizes assigned to the four scale detection layers, further enhancing the detection performance. Ruan et al. [21] proposed a method for the detection of negative obstacles on mining roads. The method used a Yolov4 network with a RepVGG backbone and a channel attention mechanism for feature extraction, and a non-maximum suppression algorithm for post-processing. The proposed method achieved a 96.35% detection rate for negative obstacles on mining roads, demonstrating its effectiveness in identifying road anomalies in the complex context of open pit mines. Salaudeen et al. [24] proposed a two-part system that used an enhanced super-resolution generative adversarial network to improve image quality, and two object detection networks, YOLOv5 and EfficientDet, to detect potholes in the images. Experiments show that the method proposed in this paper outperforms state-of-the-art methods for pothole detection on a variety of datasets. Wang et al. [10] improved the accuracy of measuring potholes on pavement surfaces using the YOLOv3 model. They used color adjustment and data augmentation to enhance images, and optimized the YOLOv3 model by using a residual network and complete IoU loss, and modified the anchor sizes using the k-means++ algorithm. The proposed model had an accuracy of 89.3% and an F1 score of 86.5%. Zhang et al. [11] described a multi-level attention mechanism, called multi-level attention block, to strengthen the utilization of essential features by the YOLOv3.
Computer vision-based detection methods are not sensitive to speed, and can identify cracks and potholes at intersections that are less likely to cause vehicle vibration. However, they are greatly affected by the environment and light. It is difficult to detect a pothole in the field of vision through pictures or videos in a dim environment. It can be observed that the vibration-based method and the computer vision-based method have complementary advantages. The vibration-based method is limited by the contact position between the tire and the road surface; driving through a road, intelligently detects a limited area of the road surface. At the same time, the detection results are greatly affected by the speed, and it is challenging to realize the detection in the low-speed position, such as intersections and turns. However, it has the advantage of not being affected by the light environment. However, the detection range based on computer vision is the entire visual field of the moving vehicle, and the detection results are also not affected by the speed of the vehicle. Chen et al. [14] proposed a reflectometry method, to realize real-time potholes observation, with vibration signals analysis and spatio-temporal trajectory fusion. Akshatha et al. [38] used a cloud-based collaborative approach, to fuse the results of acceleration-based detection and vision-data-based detection. So we propose a method to identify potholes by fusing acceleration data with video data, inspired by the work of Dong et al. [39].

3. Methodology

In this study, a multi-sensor information fusion system is proposed, to detect road potholes by using machine learning. In this system, data is collected from the built-in accelerometer and GPS of the smartphones, through a dedicated mobile app developed by us, and video recordings of road conditions are acquired through the camera. The whole system mainly includes two levels of data fusion. One level is the fusion of data from a single vehicle’s built-in sensors of smartphone and in-vehicle cameras. Another level is multi-vehicle data fusion. In environments with clear weather and good illumination, the single-vehicle road detection is completed by the module based on the acceleration sensor and video data fusion, while on cloudy and rainy days, and nights with low visibility, it is performed by the recognition module based on acceleration sensors. After that, the results are optimized by clustering the crowd-sensing data.

3.1. Data Collection

An Android app was developed, using React Native, to collect real-time acceleration, GPS, and timestamp data from smartphones. The smartphone could be placed in a position such as a phone stand or cup holder when collecting the data. The accelerometer was sampled at 100 Hz, and the GPS was sampled at 1 Hz. Onboard video was recorded by a dashcam or an onboard camera. Figure 2 shows the user interface of the application, containing a dynamic chart showing the triaxial acceleration and GPS at the corresponding position. The application organized the current three-axis acceleration, timestamp, longitude, and latitude into JSON format, and uploaded it to the remote database in real-time. A live database, provided by Firebase, was used, and the ID of each phone was used as the key, so that the data of different phones could be stored separately. In-car video was recorded by a phone or an onboard camera, and then stored with data from the phone in the same car.

3.2. Data Preprocessing

3.2.1. Resampling

Although the sampling frequency for the mobile phone accelerometer was set to 50 Hz, the actual sampling frequency fluctuated within the range of 40 to 50 Hz. This resulted in inconsistent time intervals between sample points, and one problem with this, was that it was impossible to perform fast Fourier transforms on such time series. Therefore, in order to extract features from the frequency domain using the fast Fourier transform, the acceleration data was resampled using interpolation at 50 Hz. The SciPy library in Python provides functions that can resample acceleration data. As shown in the left-plot in Figure 3, a one-dimensional B-spline curve was first fitted with the original discrete data points. This was then uniformly sampled from the fitted 1D curve at a frequency of 50 Hz, as shown in the right-hand plot in Figure 3.

3.2.2. Accelerometer Reorientation

The built-in accelerometer of the mobile phone, could measure the change in velocity, i.e., the value of acceleration, along the three axes. These axes were based on the coordinate system of the phone itself, with the center of the phone as the origin. However, road potholes directly caused the vibration of the vehicle, which in turn caused the vibration of the mobile phone. It was difficult to place the smartphones in such a way that the coordinate system of the smartphone coincided exactly with the coordinate system of the vehicle. In addition, this direction might change over time, as the phone moved. On the other hand, the vehicle has a change in acceleration in the horizontal direction due to regular acceleration and deceleration. To avoid this change being mistaken for a road anomaly, the smartphone axis should be aligned with the vehicle axis.
This coordinate transformation can be achieved by means of Euler angles [40]. Starting with a known standard orientation, any orientation can be achieved by combining three element rotations. The transformation equation for coordinating transformation is shown in Equations (1) and (2).
a x a y a z = Z ( γ ) Y ( β ) X ( α ) a x a y a z
a x a y a z = cos γ sin γ 0 sin γ cos γ 0 0 0 1 cos β 0 sin β 0 1 0 sin β 0 cos β 1 0 0 0 cos α sin α 0 sin α cos α a x a y a z

3.2.3. Data Smoothing

The accelerometer measured the acceleration force applied to the sensor built-in into the device, including the force of gravity, in m/s2. The signal generated by gravity is a low-frequency component, while the component caused by the vehicle passing road anomalies is a high-frequency component. In addition, certain driving conditions unrelated to road quality, such as regular acceleration, deceleration, turning, and lane changes, also produced low-frequency signals. The acceleration data could therefore be filtered using a high-pass filter to remove the low-frequency components that generated interference and retain the high-frequency components related to road anomalies.

3.2.4. Labeling

This study employed supervised machine learning models for road detection. To train the model, the data needed to be labeled first. Acceleration data was labeled according to road conditions recorded by onboard video, to obtain ground truth values for supervised machine learning algorithms. As illustrated in Figure 4, the acceleration segments marked in red were the anomaly signals generated when the vehicle passed through a road anomaly. The start time, end time, and anomaly type of the acceleration segment passing through the road anomaly, were recorded and used to generate a labeled dataset during data segmentation.

3.2.5. Dataset Construction

A sliding window was utilized, to segment the continuous acceleration sequence into data segments, and the window size was set to cover the acceleration data for a 10 m driving distance. The length of the sliding window could be calculated from the speed of the vehicle. For example, when the vehicle speed was 40 km/h, the approximate driving time was 1 s, after passing through a 10 m long road. The sampling frequency of the mobile phone accelerometer was 50 Hz, corresponding to 50 sample points. Fragments of acceleration data should correspond one-to-one with video frames, so the Python OpenCV module was used to extract video frames at one-second intervals. In the recognition module based on the fusion of acceleration data and video data, segments of acceleration data should correspond to video frames one-to-one. The Python OpenCV module was used to extract video frames at one-second intervals.
Most road surfaces passed during vehicle travel were intact, and uploading this data would not only waste client traffic but also be detrimental to the subsequent operation of the model. Therefore, in forming the dataset, a threshold was applied, to eliminate data segments that were almost certainly not potholes. When the vehicle passed through the road abnormally, the performance of the acceleration data was the violent fluctuation of the amplitude, so a sum of the root mean square of the three-axis acceleration was set as the threshold. When the root mean square (RMS) sum of the three-axis acceleration of a window was less than this threshold, the acceleration segment and the corresponding video frame were filtered out. After many attempts, a threshold of 3 m/s2 was finally set. After the above data processing, a dataset for subsequent model training was obtained. Each sample in this dataset contained a segment of acceleration data, the corresponding video frame, the corresponding road surface condition label, and the corresponding GPS coordinates. In the case of poor light conditions, such as at night and cloudy and rainy days, the resolution of photos was low, and the recognition based on the fusion of photos and acceleration data could not be carried out. At this time, the dataset did not need to contain the photo dataset, and such a dataset was input to the module for recognition based on the acceleration data only.

3.3. Detection Module Based on Acceleration Data

In this module, only the acceleration data, GPS, and timestamp data collected from the mobile phone were used for pothole detection. Two traditional machine learning models and an LSTM-based pothole recognition model, built via the PyTorch framework, were employed to implement road detection.

3.3.1. Feature Extraction

Feature extraction is the process of converting raw data into digital features that can be supported by machine learning algorithms, while preserving the information in the original dataset. Feature extraction can be performed manually or automatically. Manual feature extraction involves identifying the features relevant to a given problem and then extracting these features from the data. Automatic feature extraction typically utilizes deep learning, to automatically extract features from a signal or image. In this study, feature extraction methods were also employed, since both traditional machine learning and deep learning were utilized to implement road detection.
Acceleration data was collected and processed in the form of time series. Time domain features effectively reflected abnormal vibrations that occurred during vehicle travel. The time domain features mainly depended on the probability density function of the signal amplitude, to extract some statistical indicators. In this study, feature extraction in the time and frequency domains was implemented on separate windows after segmentation. The 12 commonly used statistical variables mentioned by Taspinar [41] in his study, were used as features extracted in the time domain of this study, including mean value, root mean squares, 95th-percentile value, standard deviation, entropy, etc.
The time domain diagram illustrates how the signal varies over time, while the frequency domain diagram demonstrates how many signals are in each given frequency band over a range of free models [42]. Additionally, the Fourier principle demonstrates that any continuously measured time series can be an infinite superposition of sinusoidal signals of different frequencies. Therefore, the signal spectrum information can be accurately characterized by analyzing the frequency domain characteristics of the vibration signal.
Therefore, the frequency domain characteristics of the vibration signal can be analyzed, to characterize the signal spectrum information [43] accurately. The fast Fourier transform (FFT) is a common method of converting a time domain waveform into an individual sine wave in the frequency domain. When the amplitude of acceleration is represented in the frequency domain, anomalies in high amplitudes at specific frequencies become visible. Since many vibration-related problems occur at specific frequencies, the location of a vibration can be identified based on variations in amplitude at a specific frequency. Fast Fourier transform is a common method for converting a time-domain waveform, into a series of discrete sine waves in the frequency domain. The power spectral density (PSD) can reveal the roughness of the pavement, so this method [15] was also adopted. With PSD, the vibration signal, reflecting the pavement quality, can be decomposed from the time domain into the frequency domain, to help identify the wavelength, amplitude, and phase of the spectrum. The autocorrelation function is an important concept in time series, describing the correlation between the values at one moment in the time series and the values at another. When a vehicle passes through a normal road surface, the autocorrelation function of acceleration decays rapidly and tends to zero, but often the vehicle will encounter more than one pothole during its journey, at which point the acceleration signal of the crowdsourcing will appear as a specific regular periodic anomalous pulse signal. The energy of these anomalous pulse signals is greater than the energy of the random signal, and through the analysis of the autocorrelation function, these anomalous signals are preserved.
The FFT, PSD, and autocorrelation functions were utilized, to convert the acceleration signal from the time domain to the frequency domain. For a detailed description of the implementation, reference is made to the work of Taspinar. As illustrated in Figure 5, the horizontal and vertical coordinates of the waveform peaks in the signal spectrum plot, represent the frequency and magnitude of the main components of the signal, respectively. In this study, the six highest peaks of each window after three separate transformations, were selected as features to be extracted.

3.3.2. Traditional Machine Learning

The road anomaly detection problem can be addressed by formulating it as a multi-classification problem, and applying traditional machine learning and deep learning methods to the time series. To evaluate the performance of the proposed method, support vector machine (SVM) and random forest (RF) classifiers were used separately [44]. The results of these classifiers were compared, to assess the effectiveness of the proposed method.
Support vector machine, is a supervised learning model used for classification and regression analysis. It constructs a hyperplane or set of hyperplanes, in a high or infinite dimensional space, to classify data points. If the data is not linearly separable, the original input vector is mapped to a high-dimensional space, to maximize the inter-class space, and then the SVM is used to classify the data in the feature space. In this study, an SVM classifier with a Gaussian radial basis function kernel was employed. The kernel was one of the most widely used kernels in applications and is suitable for a variety of signal classifications.
Random forest, is an integrated learning algorithm that is used in problems such as classification and regression, by constructing a large number of decision trees in the training period [45]. The algorithm randomly selects multiple new training sets from the original training set with replacement, and then trains a decision tree individually using random feature selection on each new training set. For classification problems, each decision tree will output a classification result, and each classification result will be voted to obtain the final result. This makes FR less prone to overfitting and provides good noise immunity.

3.3.3. Deep Learning Approach

Deep learning is an end-to-end learning approach, where the network is given raw data and a task to perform, such as classification. It automatically learns how to do this by starting directly from the raw data and automating the feature extraction and model learning process through the network. This eliminates the need for manual feature design and allows for more complex functions to be fitted and more complex models to be expressed, using fewer parameters. Long short-term memory (LSTM) is a recurrent neural network that provides a good way to model time series, by recursively applying a transition function to the input hidden state vector [46]. This method has been increasingly used in recent years for classification and estimation involving time-dependent sensor data. As road anomaly detection requires the identification of anomaly windows from a series of acceleration windows, and the data is time-dependent, the LSTM was considered suitable for identifying road surface quality conditions.
The following section will focus on the process of building the model. It consists of three input parameters and two outputs. The input parameters include preprocessed tri-axial acceleration. The network has two output indicators, label 1 for normal pavement, and label 2 for abnormal pavement. The Adam optimizer for cost minimization, and softmax as the activation function, were used in each LSTM cell, and a dropout regularization with a value of 0.5 was added, to prevent overfitting. As a result of the test experiments, the best results were provided when the learning rate was set to 0.001. The output of the LSTM layer is then transferred to the fully connected layer, which converts it into the identified types. As the pavement quality is divided into two categories, the fully connected layer has a size of 2.
Road anomaly detection is a highly unbalanced classification problem, where the number of normal pavement classes is still greater than the number of abnormal pavement classes, even when a large number of normal road windows have been removed using the threshold method. This class imbalance can lead to inaccurate predictions and reduce the performance of the classification model. To address this issue, the widely used synthetic minority over-sampling technique (SMOTE) is employed, to perform data augmentation on the training data, thus balancing the different number of examples for each class [47].

3.4. Fusion of Acceleration Data with Video Data on the Individual Vehicle

Both video and acceleration data are essentially a series of items, which can be frames or values. This property motivates the design of a dual-coding network to handle these two different modalities. Specifically, given a video, and acceleration data collected simultaneously with the video, the proposed method was used to encode them in parallel, and then the encoded results were concatenated. Deep learning was then applied to the merged results to achieve road anomaly detection. In what follows, we first describe the network on the video side. The corresponding method is then described on the acceleration data side. The overview of the model is illustrated in Figure 6.

3.4.1. Video Side

A sequence of n frames is extracted evenly for a given video, with a pre-specified interval of 1 s. For each frame, depth features are extracted using an Image-Net CNN, typically used for video content analysis. The image is taken from the windshield view of the vehicle, and it can be observed that the periphery of the image contains almost no road surface information. To prevent the performance of the model from being affected by regions with weak correlation, 0s were used for padding at the boundary position of the picture. Thus, for each time interval t, we have an image X t , stored as a tensor. The CNN takes X t as input and feeds it into k convolutional layers. The formula for calculating extracted depth features for each frame is as follows:
x t k = f t = 1 T x t k 1 w t j k + b j k
where the essence of the multiplication operation is to let the convolution kernel w t j perform the convolution operation on all the associated feature maps at the k − 1 layer, and add a bias parameter b j after summing. Through convolution, the features of the data points around the point are extracted for each data point, so as to obtain the implicit spatial features of the image. After that, the sigmoid function is taken as the activation function, which is
S ( x ) = 1 1 + e x .
To prevent overfitting, dropout regularization is employed, with a dropout rate of 0.25. After the convolutional layer, X k t is input to the pooling layer, which takes the maximum value of each local block on the convolution result to reduce the image size and increase the field of view of the convolution kernel. Finally, a fully connected layer is used, to reduce the dimensionality of the space. As a result, for each time interval t, we obtain f t as the representation of the road surface at time t. Then, the video is described by a series of feature vectors { f 1 , f 2 , , f t } , where f i represents the feature vector of the i-th frame.

3.4.2. Acceleration Side

As mentioned above, LSTM can stably learn serial correlation, by setting memory cells at each time interval, so an LSTM network was used in this section. As shown in Figure 6b, the representation obtained from the visual view will be acquired by the corresponding acceleration component at the same time, and it will be connected with the context features. For the corresponding acceleration and image at each time, we define the following:
g t = f t s t
where ⊕ denotes the concatenation operator.

3.4.3. Detection

Note that the output g t of the LSTM, contains both visual and acceleration effects. Then, we feed g t into the fully connected layer to get the final detection result, which is defined as follows:
y ^ t = g w f c · g t + b f c
where w f c and b f c are learnable parameters. The output of the model is in [0, 1], which indicates the probability of whether it is a pothole or not.

3.5. Fusion of Multi-Vehicle Detection Results

Detecting the entire road surface quality cannot be achieved using information from individual vehicles. On the one hand, the road detection results based on vehicle vibration information are related to the position of the vehicle tires in contact with the road surface during actual driving and the speed of the vehicle when passing over road anomalies. On the other hand, results based on image information can only cover a single lane. In addition, noise points may occur in either of the above detection methods. Crowdsourcing vehicle information can increase the sampling rate, improve detection coverage, remove the interference of noise, obtain more discriminative data, and improve detection accuracy [48]. Therefore, this study uses a cloud storage service to integrate contributions from the public and feed the results back to the users. We applied a spatial clustering algorithm to the detection results contributed by numerous individual vehicles, then calculated the average center of each cluster, thus synthesizing multiple contributions into one point, which represents the optimized position of a detected road pothole.
In this study, the ordering points to identify the clustering structure (OPTICS) algorithm was implemented, to achieve clustering of the crowd-sensing data by finding density-based clusters in the spatial data. In contrast to the k-means algorithm, the OPTICS algorithm does not require a predetermined number of clusters and can cluster data with an arbitrary shape of the distribution [49]. Moreover, the algorithm can discover noise points in the dataset while clustering, and the algorithm is insensitive to noise. Its basic idea is similar to density-based spatial clustering of applications with noise (DBSCAN) [49], but it solves one of the main weaknesses of DBSCAN: the problem of accurately detecting individual clusters in data with different densities. Due to vehicle and road heterogeneity, and the noise of the sensors and GPS devices themselves, there are inevitably noise points in the single-vehicle detection results. Secondly, for the same road anomaly, the results of multiple single-vehicle detections are spatially distributed in arbitrary shapes. As traffic volumes vary from road to road, the number of recognitions of each pothole is also different, which is reflected in the clustering as a different density for each cluster. Therefore, the OPTICS algorithm is more suitable for crowdsourcing multi-vehicle detection results.
OPTICS is an algorithm for finding density-based clusters in spatial data. OPTICS borrows the concept of core density reachability from DBSCAN. DBSCAN requires two parameters, ϵ and minPts: ϵ describes the critical distance to be considered, and minPts describes the number of points needed to form a cluster. A point x is a core point, N ϵ ( x ) , if at least minPts points are found within ϵ -neighborhood. On this basis, two more concepts need to be introduced in the description of the OPTICS algorithm: core distance and reachable distance. The following is the definition associated with OPTICS (assuming the sample set is X = { x 1 , x 2 , , x n } ) :
  • Core distance: Set xX. For a given ϵ and minPts, the minimum neighborhood radius that makes x a core point is called the core distance of x. The mathematical expression is
    c d ( x ) = undefined N ϵ ( x ) < minPts d x , N ϵ M i n P t s ( x ) N ϵ ( x ) > = minPts
    where N ϵ i ( x ) represents the nodes in the set N ϵ ( x ) , that is the i-th nearest neighbor to node x. For example, N ϵ 1 ( x ) denotes the nearest node to node x in the set N ϵ ( x ) .
  • Reachable distance: Set x 1 , x 2 ∈ X, for a given ϵ and minPts, the reachable distance of x 2 with respect to x 1 is defined as
    r d ( x 2 , x 1 ) = undefined N ϵ ( x ) < minPts max { c d ( x ) , d ( x 1 , x 2 ) } N ϵ ( x ) > = minPts
The steps of the OPTICS Algorithm 1 are as follows:
In this study, the OPTICS algorithm was applied to cluster the crowd-sensed vehicle detection results spatially. Each class was considered a separate road anomaly. Then, the center point of each cluster was calculated, and multiple contributing points were synthesized into a point, which represented the optimized location of the detected road anomaly. In this study, the center point was defined by finding a point in each cluster that had the closest distance to the other points in that cluster. The k-means algorithm was used to find the minimum distance point, and k-means was applied to each cluster formed by OPTICS, and the K value was set to 1.
Algorithm 1 The steps of the OPTICS.
Input: sample set X = { x 1 , x 2 , , x n } , neighborhood parameters ( ϵ = inf, minPts)
1.
Initialize the set of core points.
2.
Iterate over the elements of X. If the currently traversed element is a core point, add it to the set of core points.
3.
If all the elements in the core point set have been processed, the algorithm ends; otherwise, go to step 4.
4.
In the core point set, take any unprocessed core point x i , put x i into the ordered list p, then store the unvisited points in the ϵ -neighborhood of the seed set seeds in order, according to the size of the reachable distance, and at the same time, mark x i as processed.
5.
If the seed set seeds = ϕ , skip to 3; otherwise, pick the seed point seeded with the closest reachable distance from the seed set seeds, first mark it as visited, mark seeds as processed, and at the same time put seeds into the ordered list p, then determine whether seeds is a core object, if so add the unvisited neighbor points in seeds to the seed set and recalculate the reachable distance. (Calculate the reachable distance of the distance points in the seed set.) Jump to 5.

4. Experiments

To verify the feasibility of the proposed system, we conducted two groups of experiments: the experimental group and the verification group. The devices used in the experimental group were smartphones, while high-precision devices—the ETNA accelerograph and handheld GPS-UG908—were used in the verification group. The sampling rate of the smartphone accelerometer was 50 Hz, while the GPS sampling rate for both was 1 Hz. In an attempt to simulate a naturalistic driving scenario, three smartphones were simultaneously used for collecting data, which were placed at different locations as shown in Figure 7: the windshield, the copilot’s door, and the dashboard. The ETNA accelerograph and handheld GPS locator were attached to the floorboard, near the center axis of the vehicle. Some supervised learning models were used to identify the potholes, so we used a camera to record the road conditions, as the ground truth to label the acceleration data. The camera was attached to the windshield.
To enhance the range of application of the detection algorithm, we set up two-speed ranges, and chose the two most popular models as our experiment vehicles. Table 1 shows the specific experiment settings. We had four different driving scenarios. The experiment was performed on an urban road in Hangzhou city (China), with potholes and cracks. Figure 8 illustrates the driving trajectory and corresponding road quality conditions. The driving track mainly contained four roads: Yuhangtang Road, Jiangdun Road, Shixiang W Road, and Zijinhua N Road. There were many potholes, manhole covers, and cracks on Yuhangtang Road and Jiangdun Road, which represent the severely damaged road conditions. Shixiang W Road had a small number of potholes and folds, representing the condition of most road surfaces. There were almost no road anomalies on Zijinhua N Road, which represented good conditions. We drove along this trajectory 10 times in each scenario, separately, to simulate crowdsourced crowd data in real applications.
These road anomalies were located with high positioning accuracy (decimeter level accuracy) by handheld GPS-UG908. Many studies have proved that the positioning accuracy of smartphone GPS receivers is between 5 and 10 m. Therefore, the accuracy of the GPS-UG908 was sufficient to evaluate the performance of the built-in sensor in the smartphone used in this study. The continuous data in real-time, including the acceleration data and the GPS positions, were uploaded to a database provided by Firebase. The road surface information contributed by different crowdsourcers would then be downloaded for processing.

5. Result and Discussion

5.1. Comparison with State of the Art

To demonstrate the performance of the proposed system in this study, we compared the system with current machine learning methods and thresholding methods, widely used in road anomaly detection. A multi-classification model cannot use accuracy alone to assess the quality of the model, as accuracy does not reflect how accurately the model judges each classification, especially when the training data is unbalanced. Therefore, in this study, we used classification indicators based on the confusion matrix, including precision, recall, and F1 score, to evaluate the performance of our system. The confusion matrix is defined in Table 2, where true positive represents the number of correctly detected anomalies; false positives represent the number of detected errors in the detected anomalies; false negative indicates the number of road anomalies in the detected normal pavement; and true negatives represent the number of correct detections in the detected normal pavement. The classification index is calculated based on the statistics in the confusion matrix, and is given in Equation (9). The accuracy represents the proportion of all the correct results of the classification model in the total detection value. The recall represents the proportion of correctly detected anomalies, to the total detected anomalies. The sensitivity represents the ratio of the number of potholes correctly judged by the model, to the total number of natural potholes. The F1 score is the harmonic mean of precision and recall, and provides an overall measure of model precision. When training the model, the dataset was divided into a training set and a test set, in a ratio of 8:2. The training set was used to train the supervised model and tune the model parameters, and the test set was used to evaluate the effectiveness of the trained model. Also, as there is a random element in all machine learning algorithms, to avoid the final results being unstable, 100 iterations were performed and finally the average value is taken as the final result to measure the algorithm. Many current studies on machine learning-based road anomaly detection have used support vector machines and random forests. This study also compared these two methods, applied to the dataset with the proposed method. In addition to comparing with machine learning methods commonly used in road anomaly detection, we also compared with the widely used threshold-based approach proposed by Mednis et al. In their study, a Z-THRESH threshold was proposed, i.e., a road anomaly was considered here when the z-axis acceleration exceeded 0.4 g m/s2. Table 3 shows the evaluation results of the proposed method against existing methods. The results show that the detection accuracy of the proposed method based on the LSTM network, and the method based on acceleration and video data fusion, is far better than that of the traditional machine learning and threshold methods.
precision = T P T P + F P recall = T P T P + F N F 1 score = 2 × precision × recall precision + recall accuracy = T P + T N T P + F P + T N + F N

5.2. Optimized Detection Results by Mining Crowd-Sensing Data

The server processes newly submitted data files at intervals in this system, to optimize and update the crowd-sensed pavement conditions. Figure 9A illustrates the results of 10 driving tests obtained on the study route. The graph shows that most of the detected anomalies are concentrated near the ground truth points. However, there are still a certain number of anomalies that are distant from the ground truth. This also proves that the detection results of a single drive are unreliable, as we described earlier. The 10 detections were first clustered, to optimize the results using the OPTICS algorithm, which can classify sample points into clusters or noise based on their spatial density. Noisy points are considered low-quality contributing points and are removed from the detection results before calculating the centroids of each cluster. Figure 9B shows the result after clustering. For ease of observation, in the right-hand sections in Figure 9B, we use different colors to distinguish the different clusters separately. Circles of the same color are considered to be the same pothole detected. Then, for each cluster, we calculate the center of the points belonging to the same cluster, and use it to indicate the location of the final detected road pothole. As can be seen in Figure 9C, the optimized detection results largely match the true value points.

5.3. Comparison of Accelerations Measured at Different Phone Positions

In order to verify the performance of the proposed method, different detection scenarios were set during the experiments, as described in the previous section. The detection accuracy in each scenario was evaluated, to ensure that the proposed detection method and the developed mobile phone application performed consistently under various conditions, such as different car models, phone placement locations, and vehicle speeds.
It was first verified whether the performance of the proposed method was affected by the different positions of the mobile phone in the car where the data was collected. One phone was placed in the car door storage compartment, and the other was fixed to the holder, as shown in Figure 7. Figure 10 visually compares the preprocessed acceleration data from the two different positions. The amplitude of the acceleration measured by the two mobile phones is different, and the amplitude of the signal measured by the mobile phone fixed on the phone holder is larger. This is mainly due to the fact that the mount is a cantilever mount, which makes the smartphone on the holder more prone to shaking during abnormal vehicle vibrations than a smartphone placed directly in the door storage compartment. The orange part in the figure is drawn according to the actual time of passing the ground truth point, and it can be observed that both phones have a clear response to almost every pothole. The blue part is the acceleration of the vehicle when it passes through the normal road surface, but it can be seen from the figure that there are still abnormal acceleration segments in the blue part. This is because there is indeed an abnormal vehicle vibration at that moment in time, it is just that this abnormal segment is not caused by the vehicle passing over the pothole, but it can be observed that both phones respond almost identically to these other causes of abnormal vehicle vibration as well. This indicates that the acceleration data after preprocessing is not sensitive to the position of the phone, which also proves that the proposed method is suitable for performing crowdsourcing. As shown in Table 4, observing the two sets of experimental results, it can be found that good detection results are achieved no matter where the phone is placed. However, regardless of the detection method, the results of the second group are slightly better than those of the first group. This is because the amplitude of the second group is more prominent, and the gap between the abnormal and normal vibrations is more significant, making the data more discriminative. Therefore, in practical applications, better results can be obtained if the phone can be placed on the phone holder. Still, the results detected in other positions are also acceptable, especially since these detection results will be further crowdsourced. Similarly, we analyzed the effects of different car models and speeds, to validate the method. We found that when the speed is greater than 20 m/s, the detection results are almost unaffected by the vehicle type and speed.

6. Conclusions

This paper proposes a road anomaly detection system that leverages multi-source sensor fusion for detecting road potholes. Specifically, the system collects data from vehicles equipped with smartphones and onboard cameras, using crowdsourcing. The collected data is then transmitted to different detection modules, according to the vehicle testing environment. Corresponding to the two modules, we propose a road anomaly detection method based on the LSTM network, and a fusion of acceleration and video data, respectively, for anomaly detection. Through data preprocessing, the noise interference is effectively reduced, and most of the non-abnormal road samples are removed. The proposed network, based on acceleration data and video data fusion, encodes video and acceleration into real-valued vectors, integrating features from both the spatial and temporal perspectives. It compensates for the drawback that acceleration-based detection methods can only detect potholes when the wheels pass through road anomalies, as well as the disadvantage that pothole recognition in pictures is heavily influenced by the environment when only computer vision techniques are used.
The multi-vehicle detection results are then clustered using the OPTICS algorithm, and the member points of each cluster are eventually synthesized into a single road anomaly. The feasibility of the proposed system is demonstrated through experiments conducted on road surfaces with varying levels of damage, in Hangzhou. During the research process, the system was operated offline, but the designed pipeline can be migrated online for practical use. The performance of the proposed methods was compared with that of widely used machine learning methods. The results indicate that both the LSTM-based method and the fusion-based method outperform traditional machine learning algorithms in identifying road potholes. Moreover, the method based on data fusion outperforms the method based on single-modal data identification.
The proposed system demonstrates the potential of mobile group sensing to monitor road conditions continuously, at a low cost. This approach could provide significant cost savings for local governments with limited financial resources. Overall, the proposed system represents a valuable contribution to the field of road anomaly detection and has significant implications for transportation infrastructure maintenance and planning.

Author Contributions

Conceptualization, S.H. and H.X.; data curation, H.X. and Y.Y.; formal analysis, H.X.; funding acquisition, S.H.; investigation, C.W., X.N. and H.H.; methodology, H.X., S.H. and Y.Y.; software, H.X.; supervision, S.H., X.N. and H.H.; validation, H.H. and G.W; writing—original draft, H.X. and S.H.; writing—review and editing, S.H., X.N., H.H., C.W. and G.W. All authors have read and agreed to the published version of the manuscript.

Funding

This study was supported in part by the National Natural Science Foundation of China key program project (52131202), “Pioneer” and “Leading Goose” R&D Program of Zhejiang (2023C03155, 2021C01G6233854), the Smart Urban Future (SURF) Laboratory, Zhejiang Province, Zhejiang University Global Partnership Fund, the ZJU-UIUC Joint Research Centre Project of Zhejiang University (DREMES202001), Zhejiang University Sustainable Smart Livable Cities Alliance (SSLCA), Alibaba-Zhejiang University Joint Research Institute of Frontier Technologies, and CCF-DiDi GAIA Collaborative Research Funds for Young Scholars. It was led by Principal Supervisors Simon Hu, Huan Hu, and Gaoang Wang.

Institutional Review Board Statement

Not applicable.

Informed Consent Statement

Not applicable.

Data Availability Statement

The data for this study are not publicly available now due to privacy reasons.

Conflicts of Interest

The authors declare no conflict of interest.

References

  1. Vittorio, A.; Rosolino, V.; Teresa, I.; Vittoria, C.M.; Vincenzo, P.G.; Francesco, D.M. Automated Sensing System for Monitoring of Road Surface Quality by Mobile Devices. Procedia Soc. Behav. Sci. 2014, 111, 242–251. [Google Scholar] [CrossRef] [Green Version]
  2. Zhang, Y.; Ma, Z.; Song, X.; Wu, J.; Liu, S.; Chen, X.; Guo, X. Road Surface Defects Detection Based on IMU Sensor. IEEE Sens. J. 2022, 22, 2711–2721. [Google Scholar] [CrossRef]
  3. Chang, J.R.; Chang, K.T.; Chen, D.H. Application of 3D Laser Scanning on Measuring Pavement Roughness. J. Test. Eval. 2006, 34. [Google Scholar] [CrossRef]
  4. del Río-Barral, P.; Soilán, M.; González-Collazo, S.M.; Arias, P. Pavement Crack Detection and Clustering via Region-Growing Algorithm from 3D MLS Point Clouds. Remote Sens. 2022, 14, 5866. [Google Scholar] [CrossRef]
  5. Guan, H.; Li, J.; Yu, Y.; Chapman, M.; Wang, H.; Wang, C.; Zhai, R. Iterative Tensor Voting for Pavement Crack Extraction Using Mobile Laser Scanning Data. IEEE Trans. Geosci. Remote Sens. 2015, 53, 1527–1537. [Google Scholar] [CrossRef]
  6. Carlos, M.R.; González, L.C.; Wahlström, J.; Cornejo, R.; Martínez, F. Becoming Smarter at Characterizing Potholes and Speed Bumps from Smartphone Data—Introducing a Second-Generation Inference Problem. IEEE Trans. Mob. Comput. 2021, 20, 366–376. [Google Scholar] [CrossRef]
  7. Daraghmi, Y.A.; Wu, T.H.; Ik, T.U. Crowdsourcing-Based Road Surface Evaluation and Indexing. IEEE Trans. Intell. Transp. Syst. 2022, 23, 4164–4175. [Google Scholar] [CrossRef]
  8. Maeda, H.; Sekimoto, Y.; Seto, T.; Kashiyama, T.; Omata, H. Road Damage Detection and Classification Using Deep Neural Networks with Smartphone Images. Comput.-Aided Civ. Infrastruct. Eng. 2018, 33, 1127–1141. [Google Scholar] [CrossRef] [Green Version]
  9. Sun, T.; Pan, W.; Wang, Y.; Liu, Y. Region of Interest Constrained Negative Obstacle Detection and Tracking with a Stereo Camera. IEEE Sens. J. 2022, 22, 3616–3625. [Google Scholar] [CrossRef]
  10. Wang, D.; Liu, Z.; Gu, X.; Wu, W.; Chen, Y.; Wang, L. Automatic Detection of Pothole Distress in Asphalt Pavement Using Improved Convolutional Neural Networks. Remote Sens. 2022, 14, 3892. [Google Scholar] [CrossRef]
  11. Zhang, Y.; Zuo, Z.; Xu, X.; Wu, J.; Zhu, J.; Zhang, H.; Wang, J.; Tian, Y. Road damage detection using UAV images based on multi-level attention mechanism. Autom. Constr. 2022, 144, 104613. [Google Scholar] [CrossRef]
  12. Zhang, J.; Wang, F.Y.; Wang, K.; Lin, W.H.; Xu, X.; Chen, C. Data-Driven Intelligent Transportation Systems: A Survey. IEEE Trans. Intell. Transp. Syst. 2011, 12, 1624–1639. [Google Scholar] [CrossRef]
  13. Botshekan, M.; Roxon, J.; Wanichkul, A.; Chirananthavat, T.; Chamoun, J.; Ziq, M.; Anini, B.; Daher, N.; Awad, A.; Ghanem, W.; et al. Roughness-induced vehicle energy dissipation from crowdsourced smartphone measurements through random vibration theory. Data-Centric Eng. 2020, 1, e16. [Google Scholar] [CrossRef]
  14. Chen, D.; Chen, N.; Zhang, X.; Guan, Y. Real-Time Road Pothole Mapping Based on Vibration Analysis in Smart City. IEEE J. Sel. Top. Appl. Earth Obs. Remote Sens. 2022, 15, 6972–6984. [Google Scholar] [CrossRef]
  15. Andren, P. Power spectral density approximations of longitudinal road profiles. Int. J. Veh. Des. 2006, 40, 2–14. [Google Scholar] [CrossRef]
  16. Du, Y.; Chen, J.; Zhao, C.; Liu, C.; Liao, F.; Chan, C.Y. Comfortable and energy-efficient speed control of autonomous vehicles on rough pavements using deep reinforcement learning. Transp. Res. Part C Emerg. Technol. 2022, 134, 103489. [Google Scholar] [CrossRef]
  17. Perttunen, M.; Mazhelis, O.; Cong, F.; Kauppila, M.; Leppänen, T.; Kantola, J.; Collin, J.; Pirttikangas, S.; Haverinen, J.; Ristaniemi, T.; et al. Distributed Road Surface Condition Monitoring Using Mobile Phones. In Proceedings of the Ubiquitous Intelligence and Computing, Banff, AL, Canada, 2–4 September 2011; Hsu, C.H., Yang, L.T., Ma, J., Zhu, C., Eds.; Springer: Berlin/Heidelberg, Germany, 2011; pp. 64–78. [Google Scholar]
  18. Mednis, A.; Strazdins, G.; Zviedris, R.; Kanonirs, G.; Selavo, L. Real time pothole detection using Android smartphones with accelerometers. In Proceedings of the 2011 International Conference on Distributed Computing in Sensor Systems and Workshops (DCOSS), Barcelona, Spain, 27–29 June 2011; pp. 1–6. [Google Scholar] [CrossRef]
  19. Basavaraju, A.; Du, J.; Zhou, F.; Ji, J. A Machine Learning Approach to Road Surface Anomaly Assessment Using Smartphone Sensors. IEEE Sens. J. 2020, 20, 2635–2647. [Google Scholar] [CrossRef]
  20. Liu, Z.; Gu, X.; Chen, J.; Wang, D.; Chen, Y.; Wang, L. Automatic recognition of pavement cracks from combined GPR B-scan and C-scan images using multiscale feature fusion deep neural networks. Autom. Constr. 2023, 146, 104698. [Google Scholar] [CrossRef]
  21. Ruan, S.; Li, S.; Lu, C.; Gu, Q. A Real-Time Negative Obstacle Detection Method for Autonomous Trucks in Open-Pit Mines. Sustainability 2023, 15, 120. [Google Scholar] [CrossRef]
  22. Akagic, A.; Buza, E.; Omanovic, S. Pothole detection: An efficient vision based method using RGB color space image segmentation. In Proceedings of the 2017 40th International Convention on Information and Communication Technology, Electronics and Microelectronics (MIPRO), Opatija, Croatia, 22–26 May 2017; pp. 1104–1109. [Google Scholar] [CrossRef]
  23. Zhang, L.; Yang, F.; Daniel Zhang, Y.; Zhu, Y.J. Road crack detection using deep convolutional neural network. In Proceedings of the 2016 IEEE International Conference on Image Processing (ICIP), Phoenix, AZ, USA, 25–28 September 2016; pp. 3708–3712. [Google Scholar] [CrossRef]
  24. Salaudeen, H.; Çelebi, E. Pothole Detection Using Image Enhancement GAN and Object Detection Network. Electronics 2022, 11, 1882. [Google Scholar] [CrossRef]
  25. Wang, E.; Yang, Y.; Wu, J.; Liu, W.; Wang, X. An Efficient Prediction-Based User Recruitment for Mobile Crowdsensing. IEEE Trans. Mob. Comput. 2018, 17, 16–28. [Google Scholar] [CrossRef]
  26. Wang, X.; Zheng, X.; Zhang, Q.; Wang, T.; Shen, D. Crowdsourcing in ITS: The State of the Work and the Networking. IEEE Trans. Intell. Transp. Syst. 2016, 17, 1596–1605. [Google Scholar] [CrossRef]
  27. Wahlström, J.; Skog, I.; Händel, P. Smartphone-Based Vehicle Telematics: A Ten-Year Anniversary. IEEE Trans. Intell. Transp. Syst. 2017, 18, 2802–2825. [Google Scholar] [CrossRef] [Green Version]
  28. Miyajima, C.; Takeda, K. Driver-Behavior Modeling Using On-Road Driving Data: A new application for behavior signal processing. IEEE Signal Process. Mag. 2016, 33, 14–21. [Google Scholar] [CrossRef]
  29. Gillespie, T.D. Everything You Always Wanted to Know about the IRI, But Were Afraid to Ask! In Proceedings of the Road Profile Users Group Meeting, Lincoln, NE, USA, 22–24 September 1992; p. 14. [Google Scholar]
  30. Eriksson, J.; Girod, L.; Hull, B.; Newton, R.; Madden, S.; Balakrishnan, H. The pothole patrol: Using a mobile sensor network for road surface monitoring. In Proceedings of the 6th International Conference on Mobile Systems, Applications, and Services—MobiSys ’08, Breckenridge, CO, USA, 17–20 June 2008; p. 29. [Google Scholar] [CrossRef]
  31. Li, X.; Goldberg, D.W. Toward a mobile crowdsensing system for road surface assessment. Comput. Environ. Urban Syst. 2018, 69, 51–62. [Google Scholar] [CrossRef]
  32. Carlos, M.R.; Aragón, M.E.; González, L.C.; Escalante, H.J.; Martínez, F. Evaluation of Detection Approaches for Road Anomalies Based on Accelerometer Readings—Addressing Who’s Who. IEEE Trans. Intell. Transp. Syst. 2018, 19, 3334–3343. [Google Scholar] [CrossRef]
  33. Kalim, F.; Jeong, J.P.; Ilyas, M.U. CRATER: A Crowd Sensing Application to Estimate Road Conditions. IEEE Access 2016, 4, 8317–8326. [Google Scholar] [CrossRef]
  34. Lima, L.C.; Amorim, V.J.P.; Pereira, I.M.; Ribeiro, F.N.; Oliveira, R.A.R. Using Crowdsourcing Techniques and Mobile Devices for Asphaltic Pavement Quality Recognition. In Proceedings of the 2016 VI Brazilian Symposium on Computing Systems Engineering (SBESC), João Pessoa, Brazil, 1–4 November 2016; pp. 144–149. [Google Scholar] [CrossRef]
  35. Li, X.; Huo, D.; Goldberg, D.W.; Chu, T.; Yin, Z.; Hammond, T. Embracing Crowdsensing: An Enhanced Mobile Sensing Solution for Road Anomaly Detection. ISPRS Int. J. Geo-Inf. 2019, 8, 412. [Google Scholar] [CrossRef] [Green Version]
  36. Chen, K.; Lu, M.; Tan, G.; Wu, J. CRSM: Crowdsourcing Based Road Surface Monitoring. In Proceedings of the 2013 IEEE 10th International Conference on High Performance Computing and Communications & 2013 IEEE International Conference on Embedded and Ubiquitous Computing, Zhangjiajie, China, 13–15 November 2013; pp. 2151–2158. [Google Scholar] [CrossRef]
  37. Fan, R.; Bocus, M.J.; Zhu, Y.; Jiao, J.; Wang, L.; Ma, F.; Cheng, S.; Liu, M. Road Crack Detection Using Deep Convolutional Neural Network and Adaptive Thresholding. In Proceedings of the 2019 IEEE Intelligent Vehicles Symposium (IV), Paris, France, 9–12 June 2019; pp. 474–479. [Google Scholar] [CrossRef] [Green Version]
  38. Ramesh, A.; Nikam, D.; Balachandran, V.N.; Guo, L.; Wang, R.; Hu, L.; Comert, G.; Jia, Y. Cloud-Based Collaborative Road-Damage Monitoring with Deep Learning and Smartphones. Sustainability 2022, 14, 8682. [Google Scholar] [CrossRef]
  39. Dong, J.; Li, X.; Xu, C.; Yang, X.; Yang, G.; Wang, X.; Wang, M. Dual Encoding for Video Retrieval by Text. IEEE Trans. Pattern Anal. Mach. Intell. 2021, 44, 4065–4080. [Google Scholar] [CrossRef]
  40. Wu, C.; Wang, Z.; Hu, S.; Lepine, J.; Na, X.; Ainalis, D.; Stettler, M. An automated machine-learning approach for road pothole detection using smartphone sensor data. Sensors 2020, 20, 5564. [Google Scholar] [CrossRef] [PubMed]
  41. Taspinar. A Guide for Using the Wavelet Transform in Machine Learning. Available online: https://ataspinar.com/2018/04/04/machine-learning-with-signal-processing-techniques/ (accessed on 13 June 2022).
  42. Ren, L.; Cui, J.; Sun, Y.; Cheng, X. Multi-bearing remaining useful life collaborative prediction: A deep learning approach. J. Manuf. Syst. 2017, 43, 248–256. [Google Scholar] [CrossRef]
  43. Sayers, M.W.; Gillespie, T.D.; Queiroz, C.A.V. The International Road Roughness Experiment: Establishing Correlation and a Calibration Standard for Measurements; Number No. 45 in World Bank Technical Paper; World Bank: Washington, DC, USA, 1986. [Google Scholar]
  44. Cervantes, J.; Garcia-Lamont, F.; Rodríguez-Mazahua, L.; Lopez, A. A comprehensive survey on support vector machine classification: Applications, challenges and trends. Neurocomputing 2020, 408, 189–215. [Google Scholar] [CrossRef]
  45. Strobl, C.; Malley, J.; Tutz, G. An Introduction to Recursive Partitioning: Rationale, Application, and Characteristics of Classification and Regression Trees, Bagging, and Random Forests. Psychol. Methods 2009, 14, 323–348. [Google Scholar] [CrossRef] [Green Version]
  46. Vos, K.; Peng, Z.; Jenkins, C.; Shahriar, M.R.; Borghesani, P.; Wang, W. Vibration-based anomaly detection using LSTM/SVM approaches. Mech. Syst. Signal Process. 2022, 169, 108752. [Google Scholar] [CrossRef]
  47. Sáez, J.A.; Luengo, J.; Stefanowski, J.; Herrera, F. SMOTE–IPF: Addressing the noisy and borderline examples problem in imbalanced classification by a re-sampling method with filtering. Inf. Sci. 2015, 291, 184–203. [Google Scholar] [CrossRef]
  48. El-Wakeel, A.S.; Li, J.; Noureldin, A.; Hassanein, H.S.; Zorba, N. Towards a Practical Crowdsensing System for Road Surface Conditions Monitoring. IEEE Internet Things J. 2018, 5, 4672–4685. [Google Scholar] [CrossRef]
  49. Hahsler, M.; Piekenbrock, M.; Doran, D. dbscan: Fast Density-Based Clustering with R. J. Stat. Softw. 2019, 91, 1–30. [Google Scholar] [CrossRef] [Green Version]
Figure 1. The overview of the road pothole detection system framework.
Sustainability 15 06610 g001
Figure 2. Interface for smartphone applications, that collects acceleration and GPS information.
Sustainability 15 06610 g002
Figure 3. Demonstration of the data resampling process.
Sustainability 15 06610 g003
Figure 4. Labelled acceleration sequence.
Sustainability 15 06610 g004
Figure 5. Spectrogram of a pothole signal waveform and its FFT, PSD, and autocorrelation function transformed. * indicates spikes in the spectrum.
Sustainability 15 06610 g005
Figure 6. Detection model based on acceleration and video data fusion.
Sustainability 15 06610 g006
Figure 7. Devices’ locations in the vehicle.
Sustainability 15 06610 g007
Figure 8. The red line shows the experimental driving route and the corresponding road conditions.
Sustainability 15 06610 g008
Figure 9. The result of integrating crowd sensing data: (A) is the detection results of 10 driving tests; (B) shows the results of the clustering, where each color represents a cluster; (C) is the detection results after integrating the member points of each cluster.
Sustainability 15 06610 g009
Figure 10. Comparison of accelerations measured at different phone positions.
Sustainability 15 06610 g010
Table 1. Experiment scenarios.
ScenarioSpeed (m/s)Vehicle Type
130–45Passenger car
245–65Passenger car
330–45Sport utility vehicle
445–65Sport utility vehicle
Table 2. Confusion Matrix.
Predicted Value
PositiveNegative
True valuePositiveTrue positiveFalse negative
NegativeFalse positiveTrue negative
Table 3. Performance of different classifiers.
ClassifiersAccuracy for Training SetAccuracy for Training SetPrecisionRecallF1 Score
SVM0.8290.8180.8510.7340.788
RF0.8590.8380.8850.7500.812
LSTM0.9610.9570.8970.8130.853
Joint optimization model0.9990.9650.8930.8210.856
Table 4. Performance of different classifiers in case of different positions of the phone.
The Position of the SmartphoneDetection MethodAccuracy on Training SetAccuracy on Testing SetPrecisionRecallF1 Score
Smartphone placed in the holder of the phoneThreshold-based method0.7440.7340.4700.3060.371
SVM0.8100.7830.8300.7080.764
RF0.8820.8750.8750.7060.782
LSTM0.9990.8210.8330.7970.815
Joint optimization model0.9990.9270.8660.7990.831
Smartphone placed in the compartment of the car doorThreshold-based method0.7550.7380.4740.3360.394
SVM0.8120.7790.8240.7050.706
RF0.9990.8220.8370.7960.816
LSTM0.9990.8750.8630.8150.838
Joint optimization model0.9990.8860.8650.8080.836
Disclaimer/Publisher’s Note: The statements, opinions and data contained in all publications are solely those of the individual author(s) and contributor(s) and not of MDPI and/or the editor(s). MDPI and/or the editor(s) disclaim responsibility for any injury to people or property resulting from any ideas, methods, instructions or products referred to in the content.

