Article

The Spatio-Temporal Evolution Characteristics of the Vegetation NDVI in the Northern Slope of the Tianshan Mountains at Different Spatial Scales

1
School of Resources and Environmental, Xinjiang Agricultural University, Urumqi 830052, China
2
Xinjiang Key Laboratory of Soil and Plant Ecological Processes, Urumqi 830052, China
*
Authors to whom correspondence should be addressed.
Sustainability 2023, 15(8), 6642; https://doi.org/10.3390/su15086642
Submission received: 17 February 2023 / Revised: 11 April 2023 / Accepted: 12 April 2023 / Published: 14 April 2023

Abstract

:
The purposes of this study are to reveal the spatial pattern and dynamic changes of NDVI in the northern slope of the Tianshan Mountains for an extended period and to explore whether the spatial and temporal evolution of NDVI in different spatial scales is consistent so as to provide a reasonable theoretical basis for the selection of appropriate remote sensing spatial resolution in the study area. The GIMMS NDVI remote sensing data set was used to resample the NDVI data with three spatial resolutions of 0.5 km × 0.5 km, 1 km × 1 km, and 8 km × 8 km. The Mann-Kendall method was used to analyze the spatial-temporal evolution characteristics of vegetation NDVI on the NTSM from 1981 to 2015. The results showed that the interannual variation trend and spatial distribution of vegetation NDVI were consistent at different spatial scales. The change of NDVI displayed an increasing trend with changes concentrated in the middle of the NTSM. Five distinct trends were observed: no significant change (35% of the area), significant positive change (26%), significant single peak change (15%), a significant U-shaped change relationship (12%), and significant negative change (11%). Remote sensing NDVI data with a spatial resolution of 8 km could be used to analyze the long-term interannual variation trend of vegetation NDVI on the NTSM.

1. Introduction

Surface vegetation is an essential component of terrestrial ecosystems and provides a natural link between the material cycles and energy flow of the soil, hydrosphere, and atmosphere. It plays an important role in the terrestrial carbon balance and climate change regulation [1,2,3]. The impact of the intensification of global climate change due to human activities on terrestrial vegetation in recent years cannot be underestimated. Therefore, it is of great scientific value and practical significance to carry out long-term dynamic monitoring, quantitative assessments, and analysis of the normalized vegetation index (NDVI) to determine the factors influencing the changes in vegetation patterns. A long-term NDVI data set is a powerful tool that can be used to understand the past vegetation cover, monitor the status of vegetation, and meet future challenges [4,5].
Many studies have been conducted based on the spatio-temporal dynamic changes of vegetation NDVI, and it has been shown that NDVI has a certain scale dependence [6]. Bian et al. [7] studied the influence of spatial scale on the relationships between vegetation biomass and topographic factors. The results showed that the relationship between topographic factors and vegetation biomass varied significantly with spatial scale. Aman et al. [8] showed that the average NDVI value at a high spatial resolution had a linear relationship with the NDVI value at a low spatial resolution at the corresponding position. Piao [9], Fang [10], Liu [11], and Jin [12] used Global Inventory Modeling and Mapping Studies (GIMMS) NDVI data with 8 km spatial resolution to study and analyze the NDVI changes of vegetation on land using a linear regression, trend analysis, and multiple regression residual analysis in China from 1982 to 1999, 1982 to 2012, and 1982 to 2015, respectively. The results showed that the interannual NDVI of vegetation in China is increasing, indicating that vegetation growth in China has increased in recent years, but there were huge differences in space. Du [13] et al. studied the dynamic changes of monthly vegetation growth in Xinjiang from 1982 to 2012 at 8 km resolution by a least square regression analysis based on GIMMMS NDVI data expanded from a Moderate Resolution Imaging Spectroradiometer (MODIS) NDVI data set. The results showed that vegetation growth in Xinjiang from March to October displayed a significantly increasing trend over the past 30 years. Li et al. [14] used MODIS data with a spatial resolution of 1 km from 2000 to 2018 to analyze the vegetation ecological quality in the Tianshan Mountains based on Sen’s Mann-Kendall test, Hurst index, and standard deviation. A slow decreasing trend in vegetation ecological quality was identified in most areas, with the areas with the most significant increase being mainly concentrated in the northern Tianshan Mountains. MODIS NDVI data with a 0.5 km resolution was used by Zhang [15], while Chen [16] applied a trend analysis and partial correlation analysis to study the response of net primary productivity (NPP) of Xinjiang grassland to climate change and human activities in 2000–2014 and 2000–2018, respectively. The NPP of most grasslands in Xinjiang displayed an increasing trend over the past 20 years, and the grassland resources were generally improved.
However, due to the differences in data sources, research areas, and spatial and temporal scales, the conclusions obtained by the various studies have certain limitations. The spatial resolutions that have been previously used to study the characteristics of long-term vegetation index changes in the study area were 0.5, 1, and 8 km. The data sources selected were mainly GIMMMS NDVI data and MODIS NDVI data. Previous studies have not explored whether the changes in spatial resolution under the same data source have an impact on the interannual variation trend of vegetation NDVI in a specific study area. Therefore, it is of great practical significance to select an appropriate spatial resolution in research using vegetation NDVI.
The main spatial resolutions used to study the characteristics of long-term vegetation index changes in the study area in previous research were 0.5, 1, and 8 km. The selected data sources mainly included GIMMMS and MODIS NDVI data. Due to the differences in data sources, research areas, spatial scales, and time scales, the conclusions obtained have certain limitations. However, whether a change in spatial resolutions under the same data source has an impact on the interannual variation trend of vegetation NDVI in the study area, that is, the impact of downscaling [17,18,19,20] on the interannual variation of NDVI, has not been previously addressed. Therefore, it is of great practical significance to select the appropriate spatial resolution to study the interannual variation of regional vegetation.
The northern slope of the Tianshan Mountains (NSTM) is an important economic development area in the Xinjiang Uygur Autonomous Region of China. It is also an important agricultural and animal husbandry development base in Xinjiang. It has the most typical and complete mountain vertical zonation in the global temperate arid area. The changes in vegetation biodiversity and biological, ecological processes in temperate arid areas are affected by hydrothermal spatial changes in elevation, slope direction, and slope. The long-term drought and lack of rainfall at distances far from the ocean have led to the development of a fragile ecological environment in the region. Therefore, it is of great significance to study the long-term sequence of vegetation NDVI in the NSTM for the utilization and protection of biological resources in the region. Based on this research background, this study considered the vegetation in the NSTM in Xinjiang as the research object, adopted a long-term (1982–2015) GIMMS NDVI 3 g data set at the grid scale, and obtained data sets with spatial resolutions of 0.5, 1, and 8 km under the same data source by resampling. A Mann-Kendall trend test was used to analyze the spatio-temporal variation trend of the vegetation NDVI in the NSTM and to explore whether the variation trend of vegetation NDVI in the NSTM had an obvious spatial scale effect. The results of the study will provide theoretical support for ecological research in the NSTM and similar regions using a suitable spatial scale analysis.

2. Materials and Methods
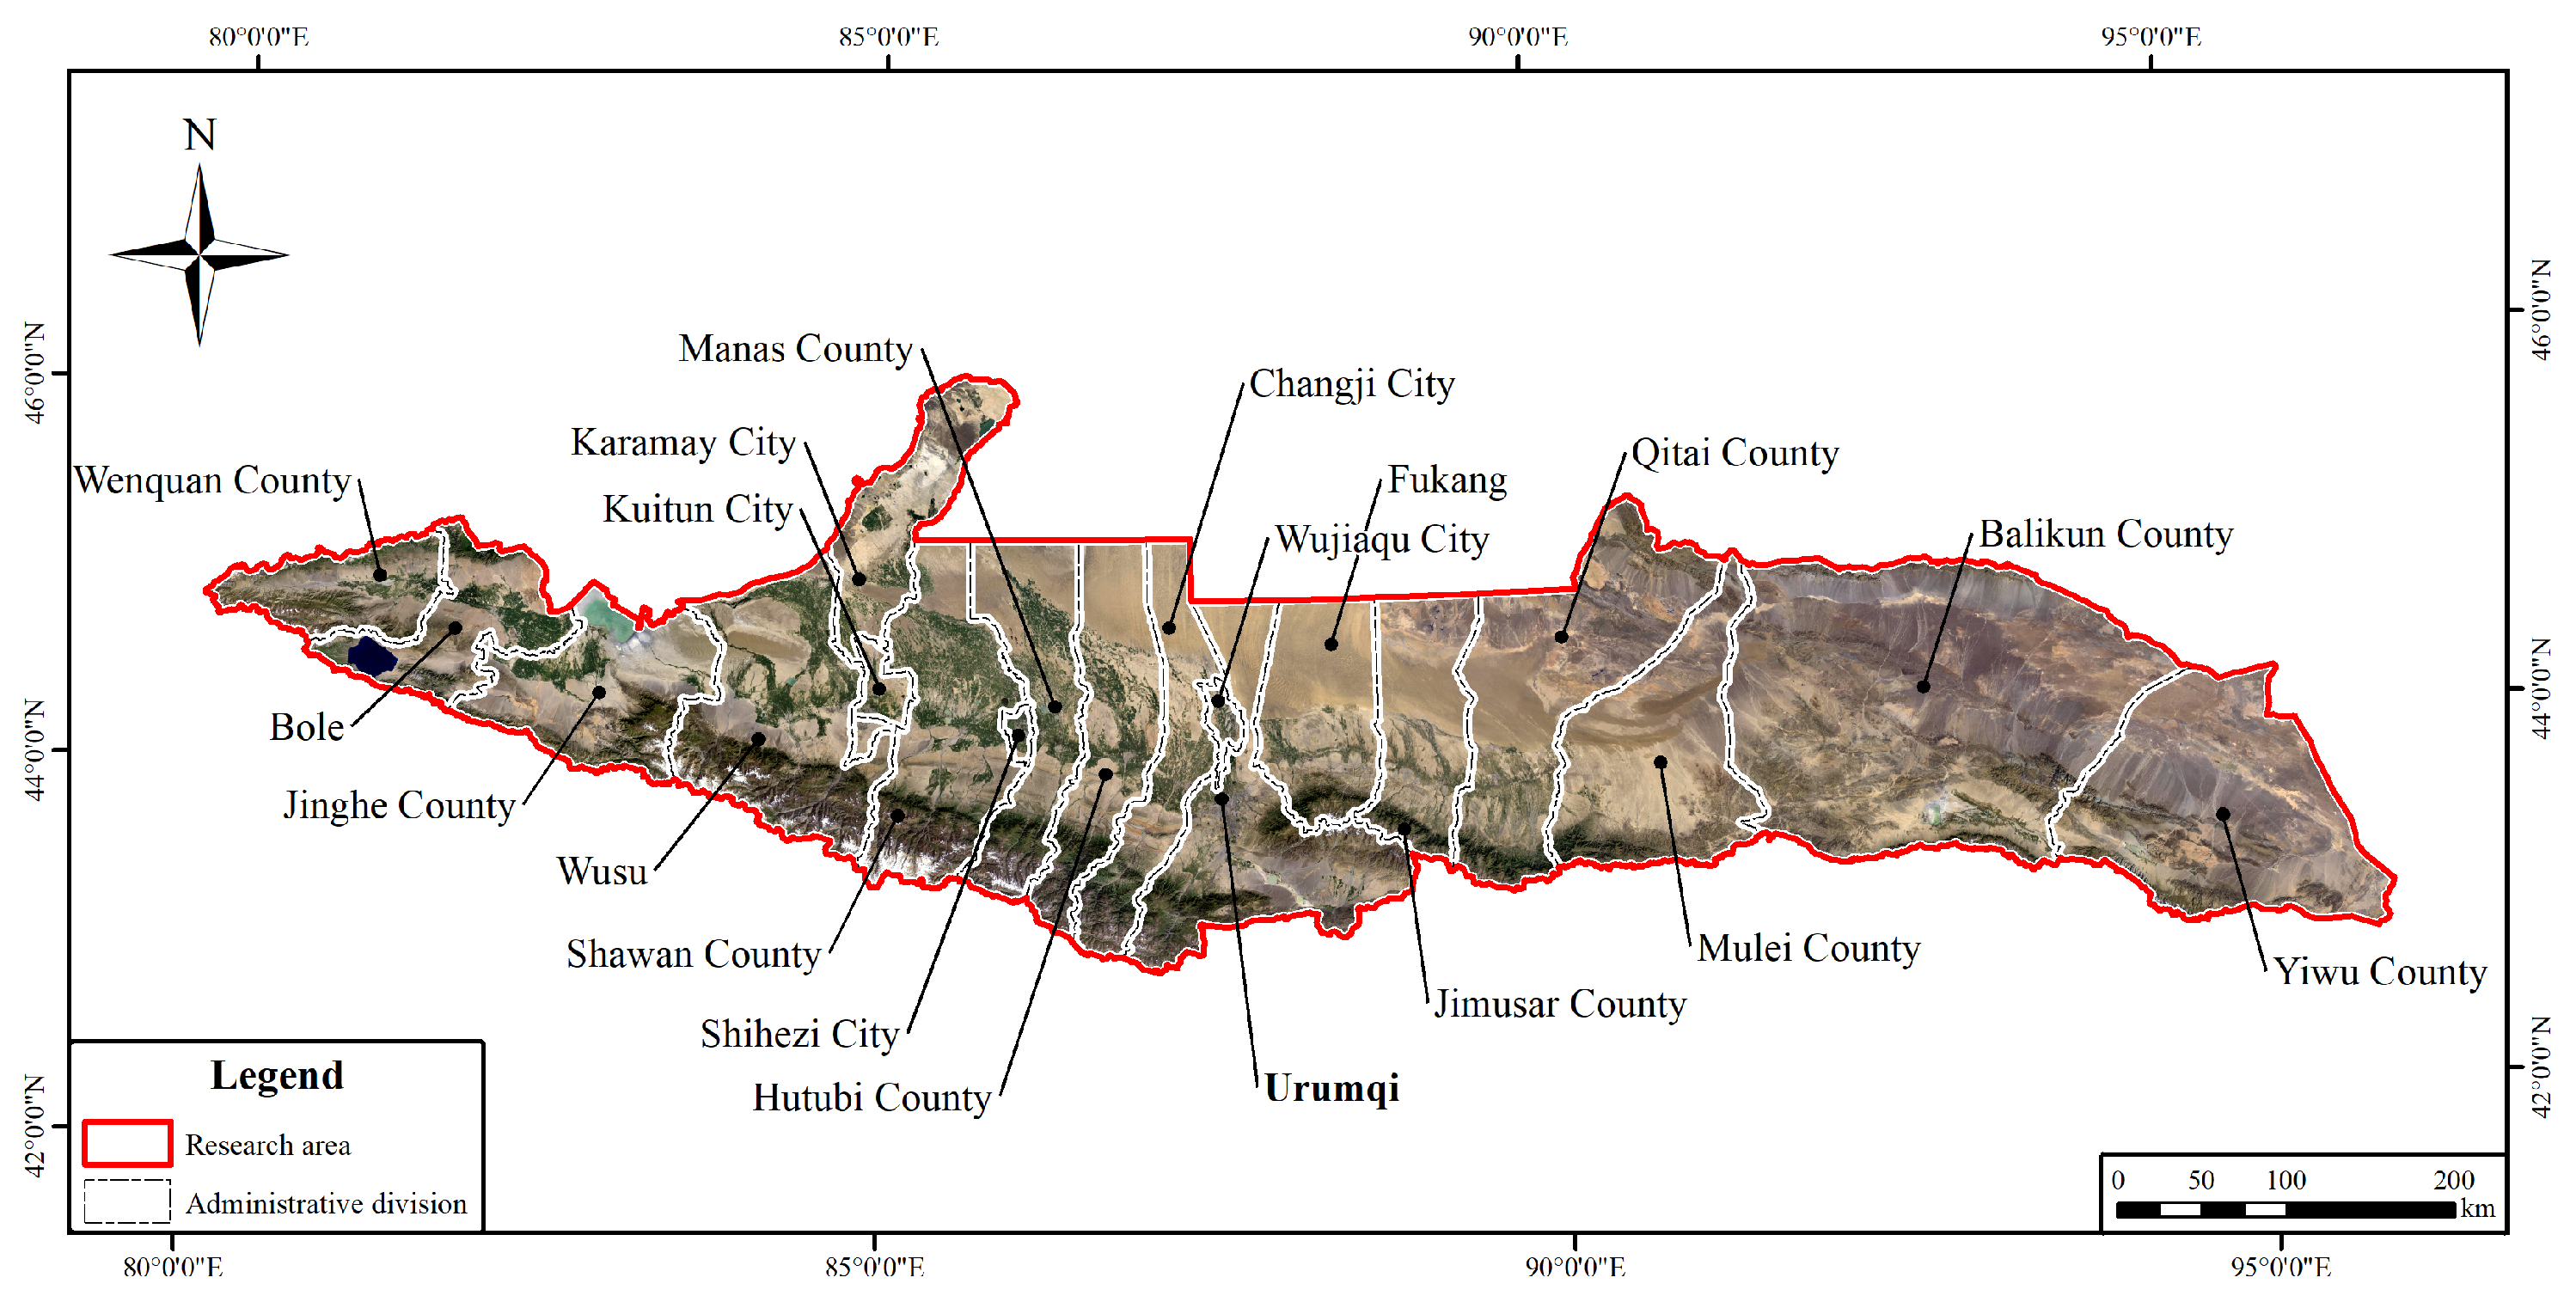
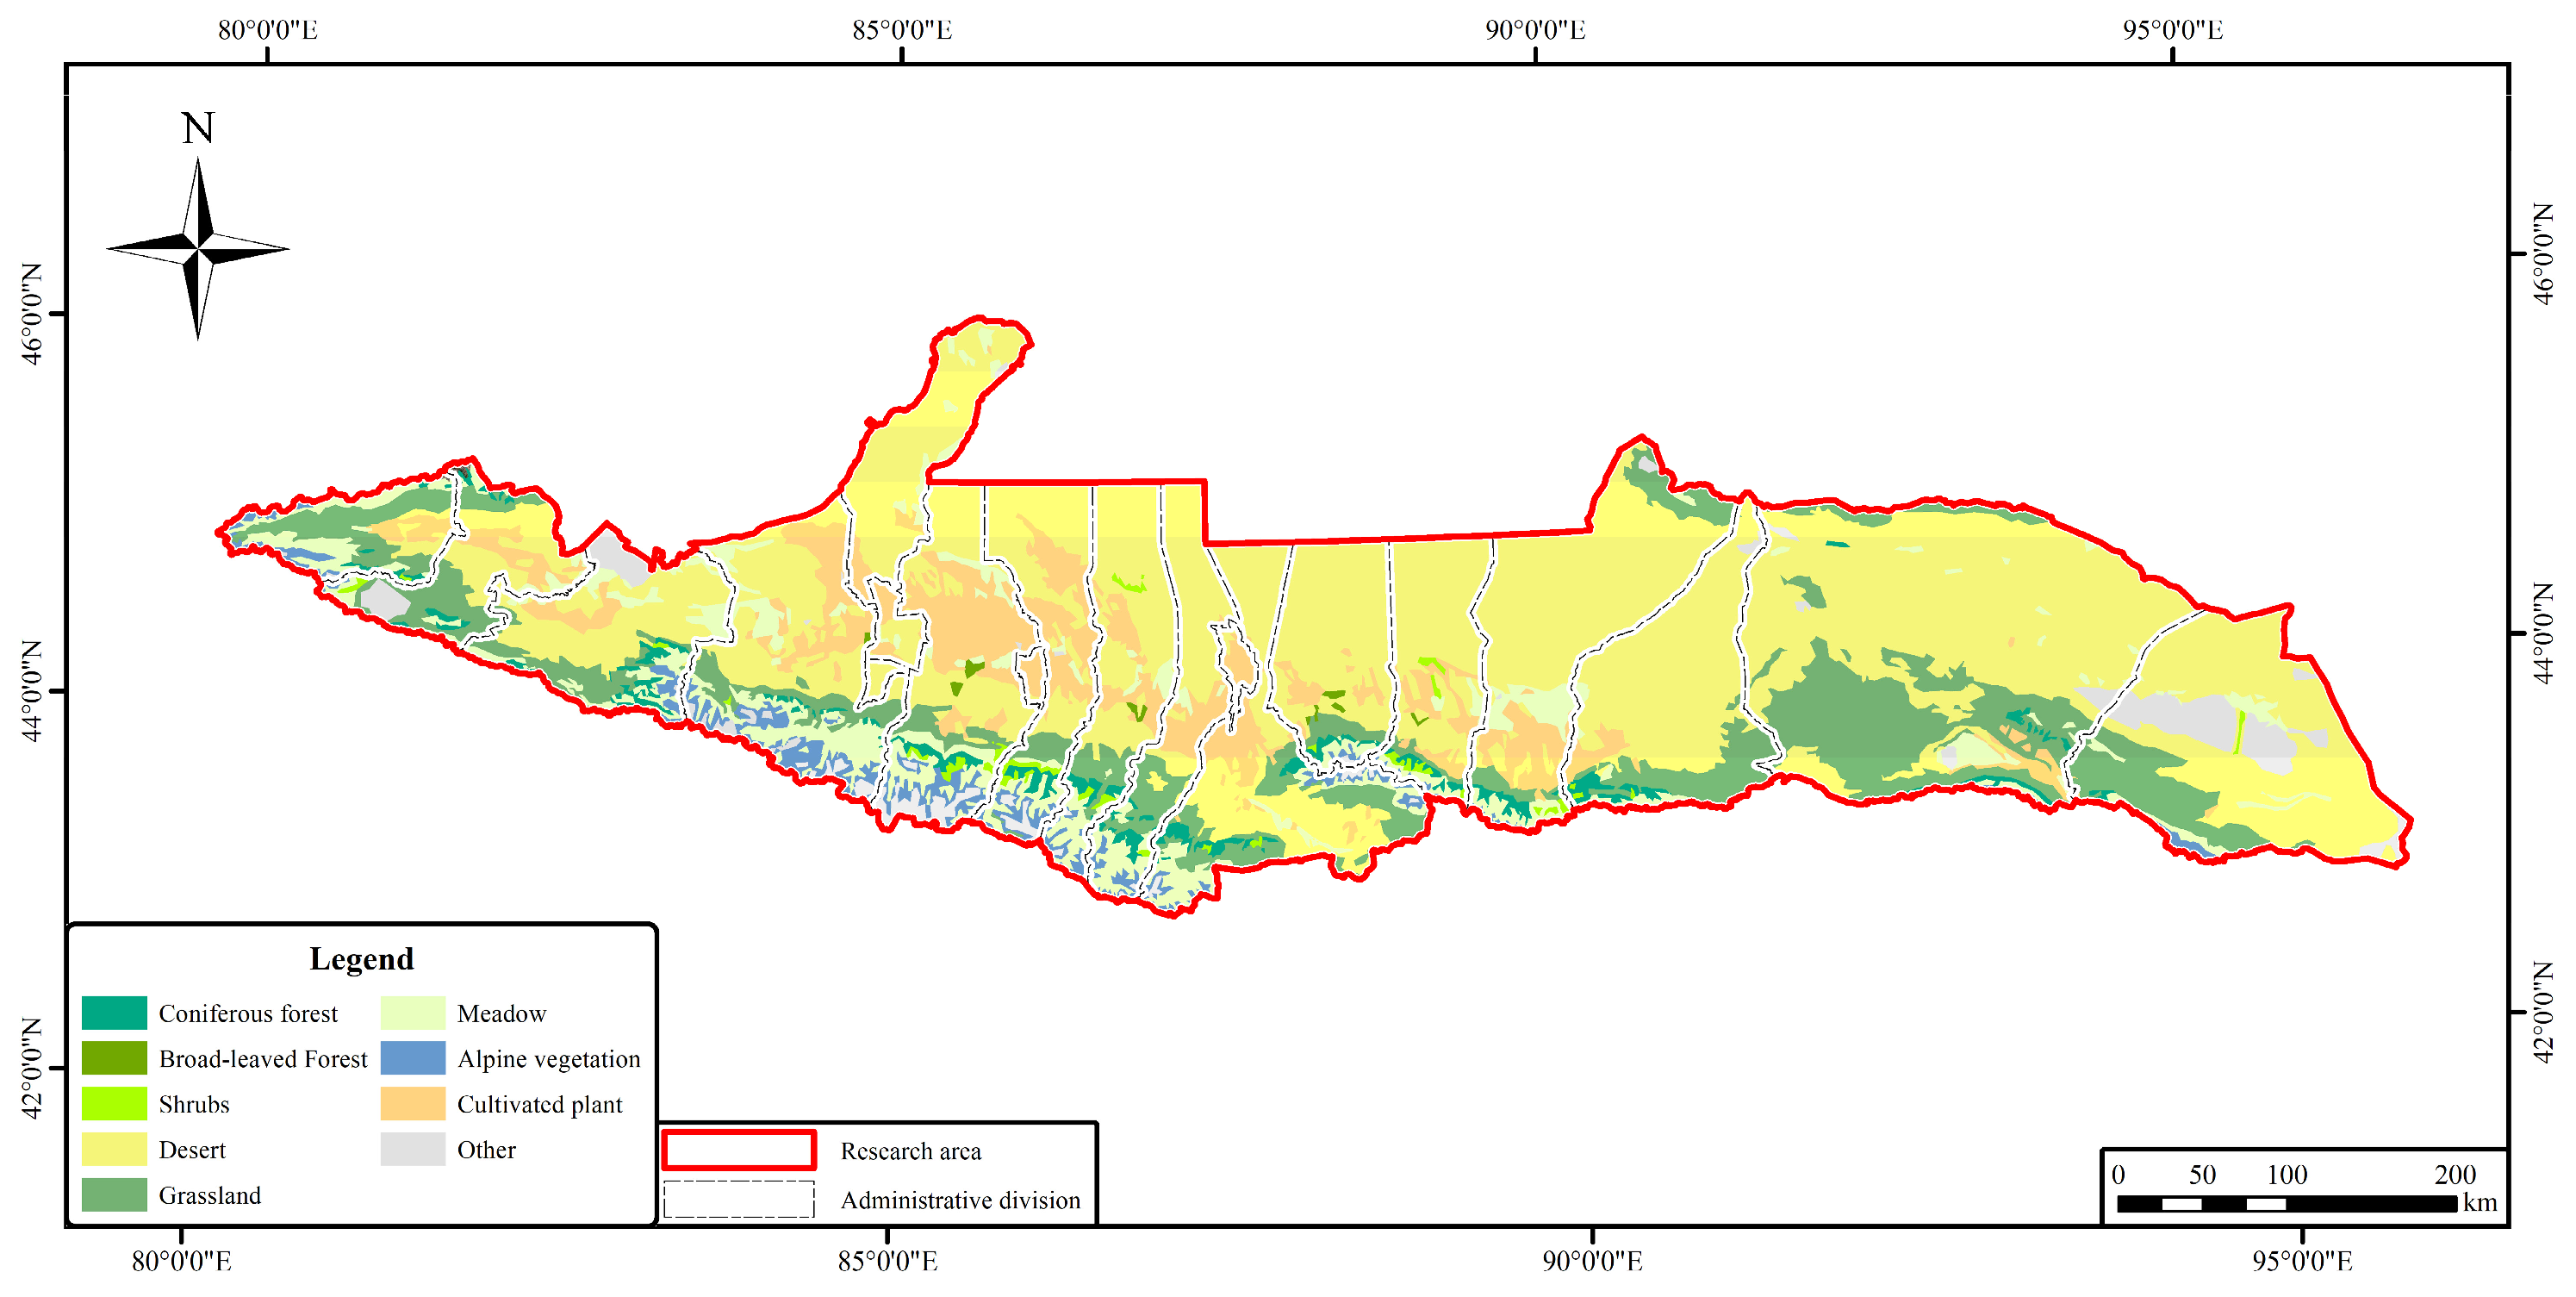
2.1. The Study Area

The NSTM is located at 79°53′–96°06′ E, 42°50′–46°12′ N (see Figure 1), stretching over 1300 km from east to west, with a width of 30–300 km from north to south and an altitude of 200–4500 m. The region has an area of 198,300 km2. It is distributed in Urumqi, Karamay City, Xinjiang Autonomous Region (Wujiaqu City, Shihezi City), Hami Region (Yiwu County, Barkol Kazak Autonomous County), Changji Hui Autonomous Prefecture (Mulei Kazak Autonomous County, Qitai County, Jimusar County, Fukang City, Changji City, Hutubi County, Manas County), Tacheng Region (Shawan City, Wusu City), Bortala Mongolian Autonomous Prefecture (Jinghe County, Bole City, Wenquan County), and Ili Kazak Autonomous Prefecture (Kuitun City) [21]. Located in the center of Eurasia, the Tianshan Mountains have a distinct, temperate, continental climate. The total annual sunshine in this area is about 2500 h, and the annual precipitation is about 750 mm. There are substantial changes in temperature due to the influence of altitude. The unique topography and natural environment have led to differences in hydrothermal spatial distribution and the development of rich and diverse types of vegetation (see Figure 2).

2.2. Data Sources and Preprocessing

The GIMMS NDVI 3 g data used in this study were derived from the NASA Goddard Space Center Global Monitoring and Simulation Research Group (http://ecocast.arc.nasa.gov/data/pub/ accessed on 1 January 2023), with a temporal resolution of 15 d, a spatial resolution of 8 × 8 km, and a time span of 1982–2015. The influence of volcanic eruptions, solar elevation angle, and sensor sensitivity changes over time was removed from the data set, and the data were considered appropriate for regional vegetation monitoring. The data set had the characteristics of good data quality, an extended time series, and good data consistency. It was therefore suitable for the monitoring of vegetation dynamic changes. In this study, the international maximum value composite (MVC) method was used to maximize the semi-monthly data of GIMMS NDVI, further eliminate the interference of clouds, atmosphere, solar elevation angle, and other factors, and obtain the maximum monthly NDVI [22]. On this basis, the MVC method was used to obtain a maximum annual NDVI data set, which represented the annual coverage. The vegetation type data were derived from the spatial distribution data set of China’s 1:1 million vegetation type map published by the Resource and Environmental Science and Data Center of the Chinese Academy of Sciences (https://www.resdc.cn/ accessed on 13 January 2023). The spatial resolution was 1 km. A spatial interpolation was performed to make the number of rows and columns, pixel size, and projection mode of the raster data consistent with the remote sensing data. The administrative data were derived from the spatial distribution data set of China’s 1:4 million administrative map published by the Resource and Environmental Science and Data Center of the Chinese Academy of Sciences (https://www.resdc.cn/ accessed on 13 January 2023).

2.3. Methodology

2.3.1. Data Processing

In this study, the cubic convolution method was used to resample the annual maximum NDVI data with a spatial resolution of 8 km to 1 km and 0.5 km, and the vegetation NDVI remote sensing data in the study area was obtained. The processing of raster data was completed in Excel, and R software was used to calculate the interannual variation trend of each pixel (significance level 0.05). According to the results, Arc GIS and Origin were used for mapping.

2.3.2. Maximum Value Composite (MVC) Method

Using the maximum value composites (MVC) method, the monthly maximum value of NDVI is obtained, which represents the NDVI value of the month. This method can effectively eliminate the influence of factors such as clouds, aerosols, cloud shadows, viewing angles, and solar elevation angles from the atmosphere and can more accurately reflect the overall change characteristics of the spatial vegetation index. In this study, the maximum value synthesis method was used to process the data to obtain the monthly maximum value, which was used to represent the best monthly growth status and trend of vegetation. Then the annual maximum value is further obtained to characterize the best growth condition of the year. The formula is:
M D N V I i = N D V I 1 , N D V I 2
M N D V I j = ( M N D V I i )
In the formula, i represents the number of months, and the value of this study is 1–12, representing 12 months of one year; MNDVIi is the maximum NDVI in month i; NDVI1 and NDVI2 are NDVI values in the first and second halves of the month. MNDVIj represents the annual maximum NDVI value.

2.3.3. Resampling—Cubic Convolution Interpolation Method

The resampling operation generally includes two independent algorithms: coordinate transformation and grayscale interpolation. The commonly used resampling methods include the nearest neighbor allocation method, the bilinear interpolation method, and the cubic convolution interpolation method. The nearest neighbor assignment method is mostly used for the resampling of discrete data. Because it does not change the value of the pixel, the operation speed is the fastest, but it will produce an error of half a pixel. Bilinear interpolation is mostly used for continuous data. The new value of the pixel is determined based on the weighted average distance of the four nearest input pixel centers, and the data are smoothed. The cubic convolution interpolation method is also suitable for continuous data. The new value of the pixel is determined by fitting the smooth curve passing through the center of the 16 nearest input pixels. The geometric deformation of the output grid is small, the calculation amount is large, and the processing time is long. Through the consideration of this data source, the cubic convolution interpolation method can better reflect the continuity of the data, can perfectly reconstruct the quadratic polynomial, increase the interpolated sampling data points, and also improve the accuracy of reconstructing the cubic polynomial.

2.3.4. Mann-Kendall Trend Test

The Mann-Kendall trend test is a non-parametric test method that is applied to test the trend and significance of long-time series data and can also reveal the trend changes in time series. It does not need a sample set to follow a certain distribution, allows for abnormal and missing values, and is almost unaffected by a few outliers. It is, therefore, commonly used in the fields of hydrology and meteorology [23]. In recent years, some researchers have applied the Mann-Kendall method to an NDVI time series trend analysis [24,25]. In this study, based on the annual maximum NDVI, the Mann-Kendall trend test was used to calculate the vegetation index change trend of each grid unit in the NTSM over a 35-year period. The calculation is as follows:
Set {NDVIi}, i = 1981,1982,1983, 1984, …, 2015, and define the Z statistic as:
Z = S 1 s S ( S > 0 ) 0 ( S = 0 ) S + 1 s S ( S < 0 )
S = j = 1 n 1 i = j + 1 n s g n ( N D V I j N D V I i )
s g n ( N D V I j N D V I i ) = 1 ( N D V I j N D V I i > 0 ) 0 ( N D V I j N D V I i = 0 ) 1 ( N D V I j N D V I i < 0 )
s ( S ) = n n 1 2 n + 5 18
In the formula, NDVIi and NDVIj represent the NDVI values of pixel i and j years respectively, and n represents the length of the time series; sgn is a symbol function; the value range of statistic Z is (−∞, +∞). At a given significance level α, when |Z| > μ1−α/2, the study sequence has significant changes at the α level. Generally, α = 0.05 is taken, and the significance of NDVI time series change trend at 0.05 confidence level is judged.

2.3.5. Optimal Fitting Model Selection

In this study, the change trend of the annual maximum NDVI value for 35 consecutive years was explored on the grid scale. According to the statistical requirements, when the sample size was greater than five, the general linear model was used to fit the relationship between NDVI value and year. If there is a significant linear and nonlinear relationship at the same time, the optimal fitting model is further selected by the Akaike Information Criterion (AIC) (the lower the AIC, the better the model fitting effect) [26]. If there is only one significant relationship (linear or nonlinear), the relationship is directly used as the optimal fitting model [27]. The five manifestations of the optimal fitting model are shown in Figure 3.

3. Results

3.1. Analysis of the NDVI Interannual Variation Trend at Different Spatial Scales

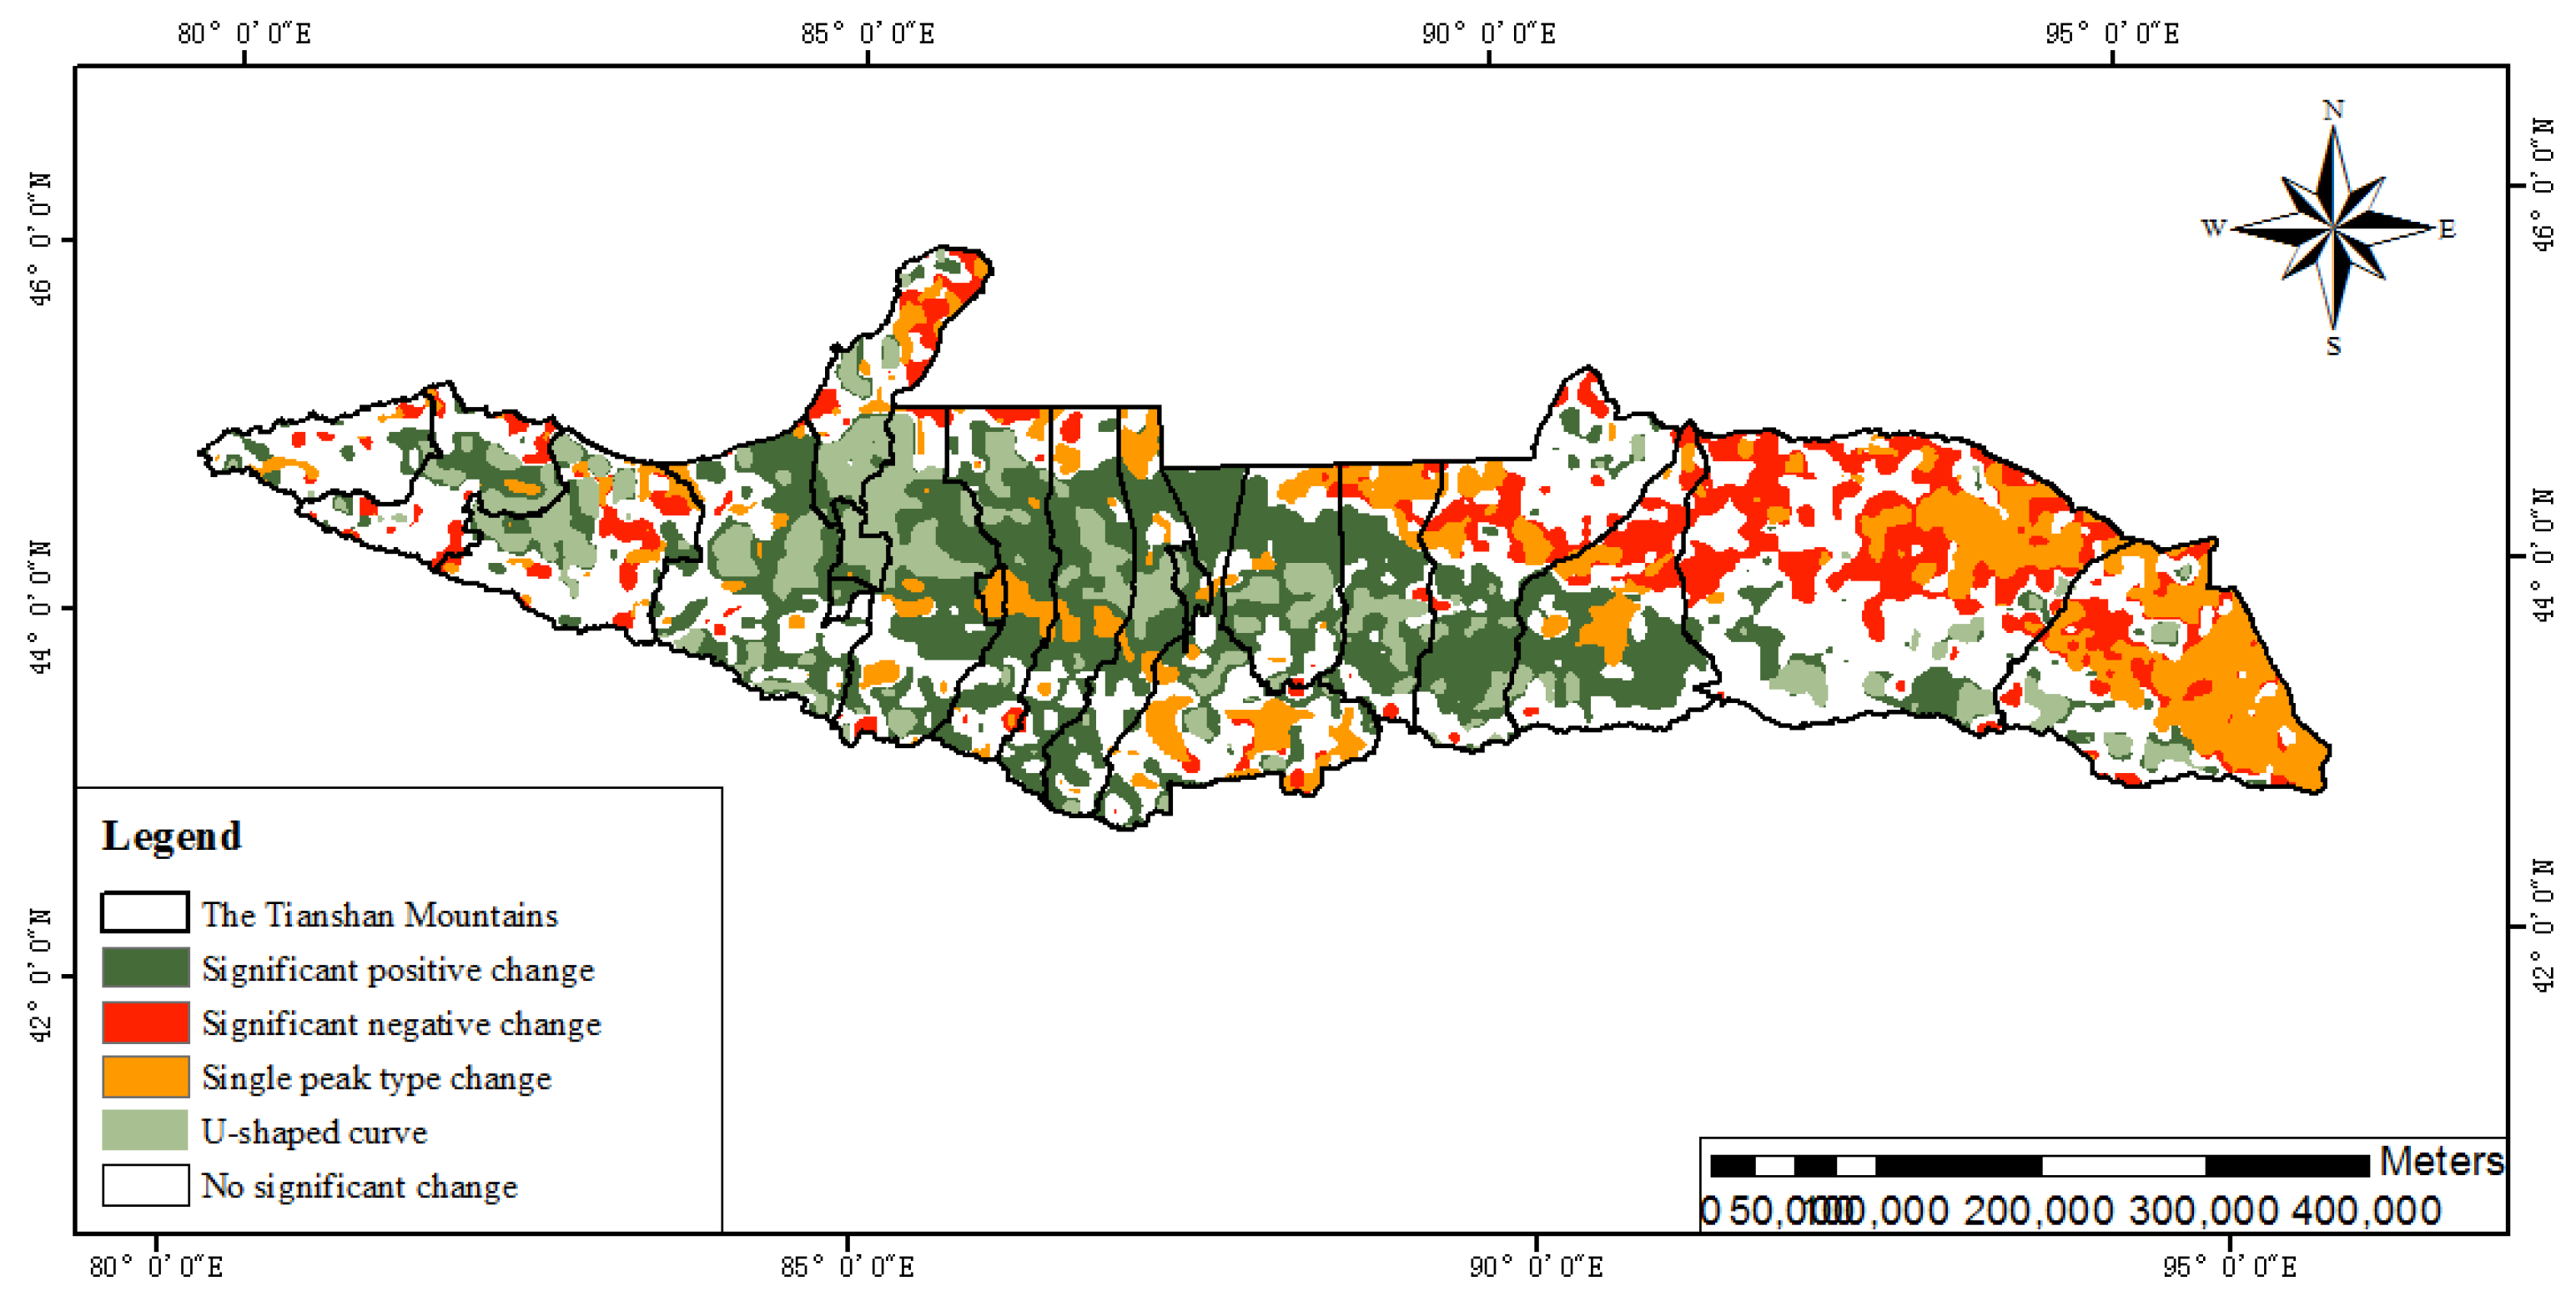
3.1.1. Spatial Analysis

Using the Mann-Kendall test trend analysis method, the NDVI in the NSTM was calculated pixel by pixel to obtain its change trend, and a spatial distribution map of the NDVI change trend was constructed (Figure 4, Figure 5 and Figure 6). From 1981 to 2015, the interannual variation trend of NDVI in the NTSM showed a significant positive change, which was observed mainly in the middle part of the NTSM. A significant negative change was observed mainly in the eastern part of the NTSM. A unimodal change, with a significant increase and then decreases, was observed mainly in the eastern part of the NTSM. A U-shaped change, with a significant decrease and then an increase, was observed mainly in the western and middle parts of the NTSM. In general, the interannual variation trend of vegetation NDVI in the NSTM in the past 35 years displayed an increasing trend that was observed mainly in the middle of the NSTM.

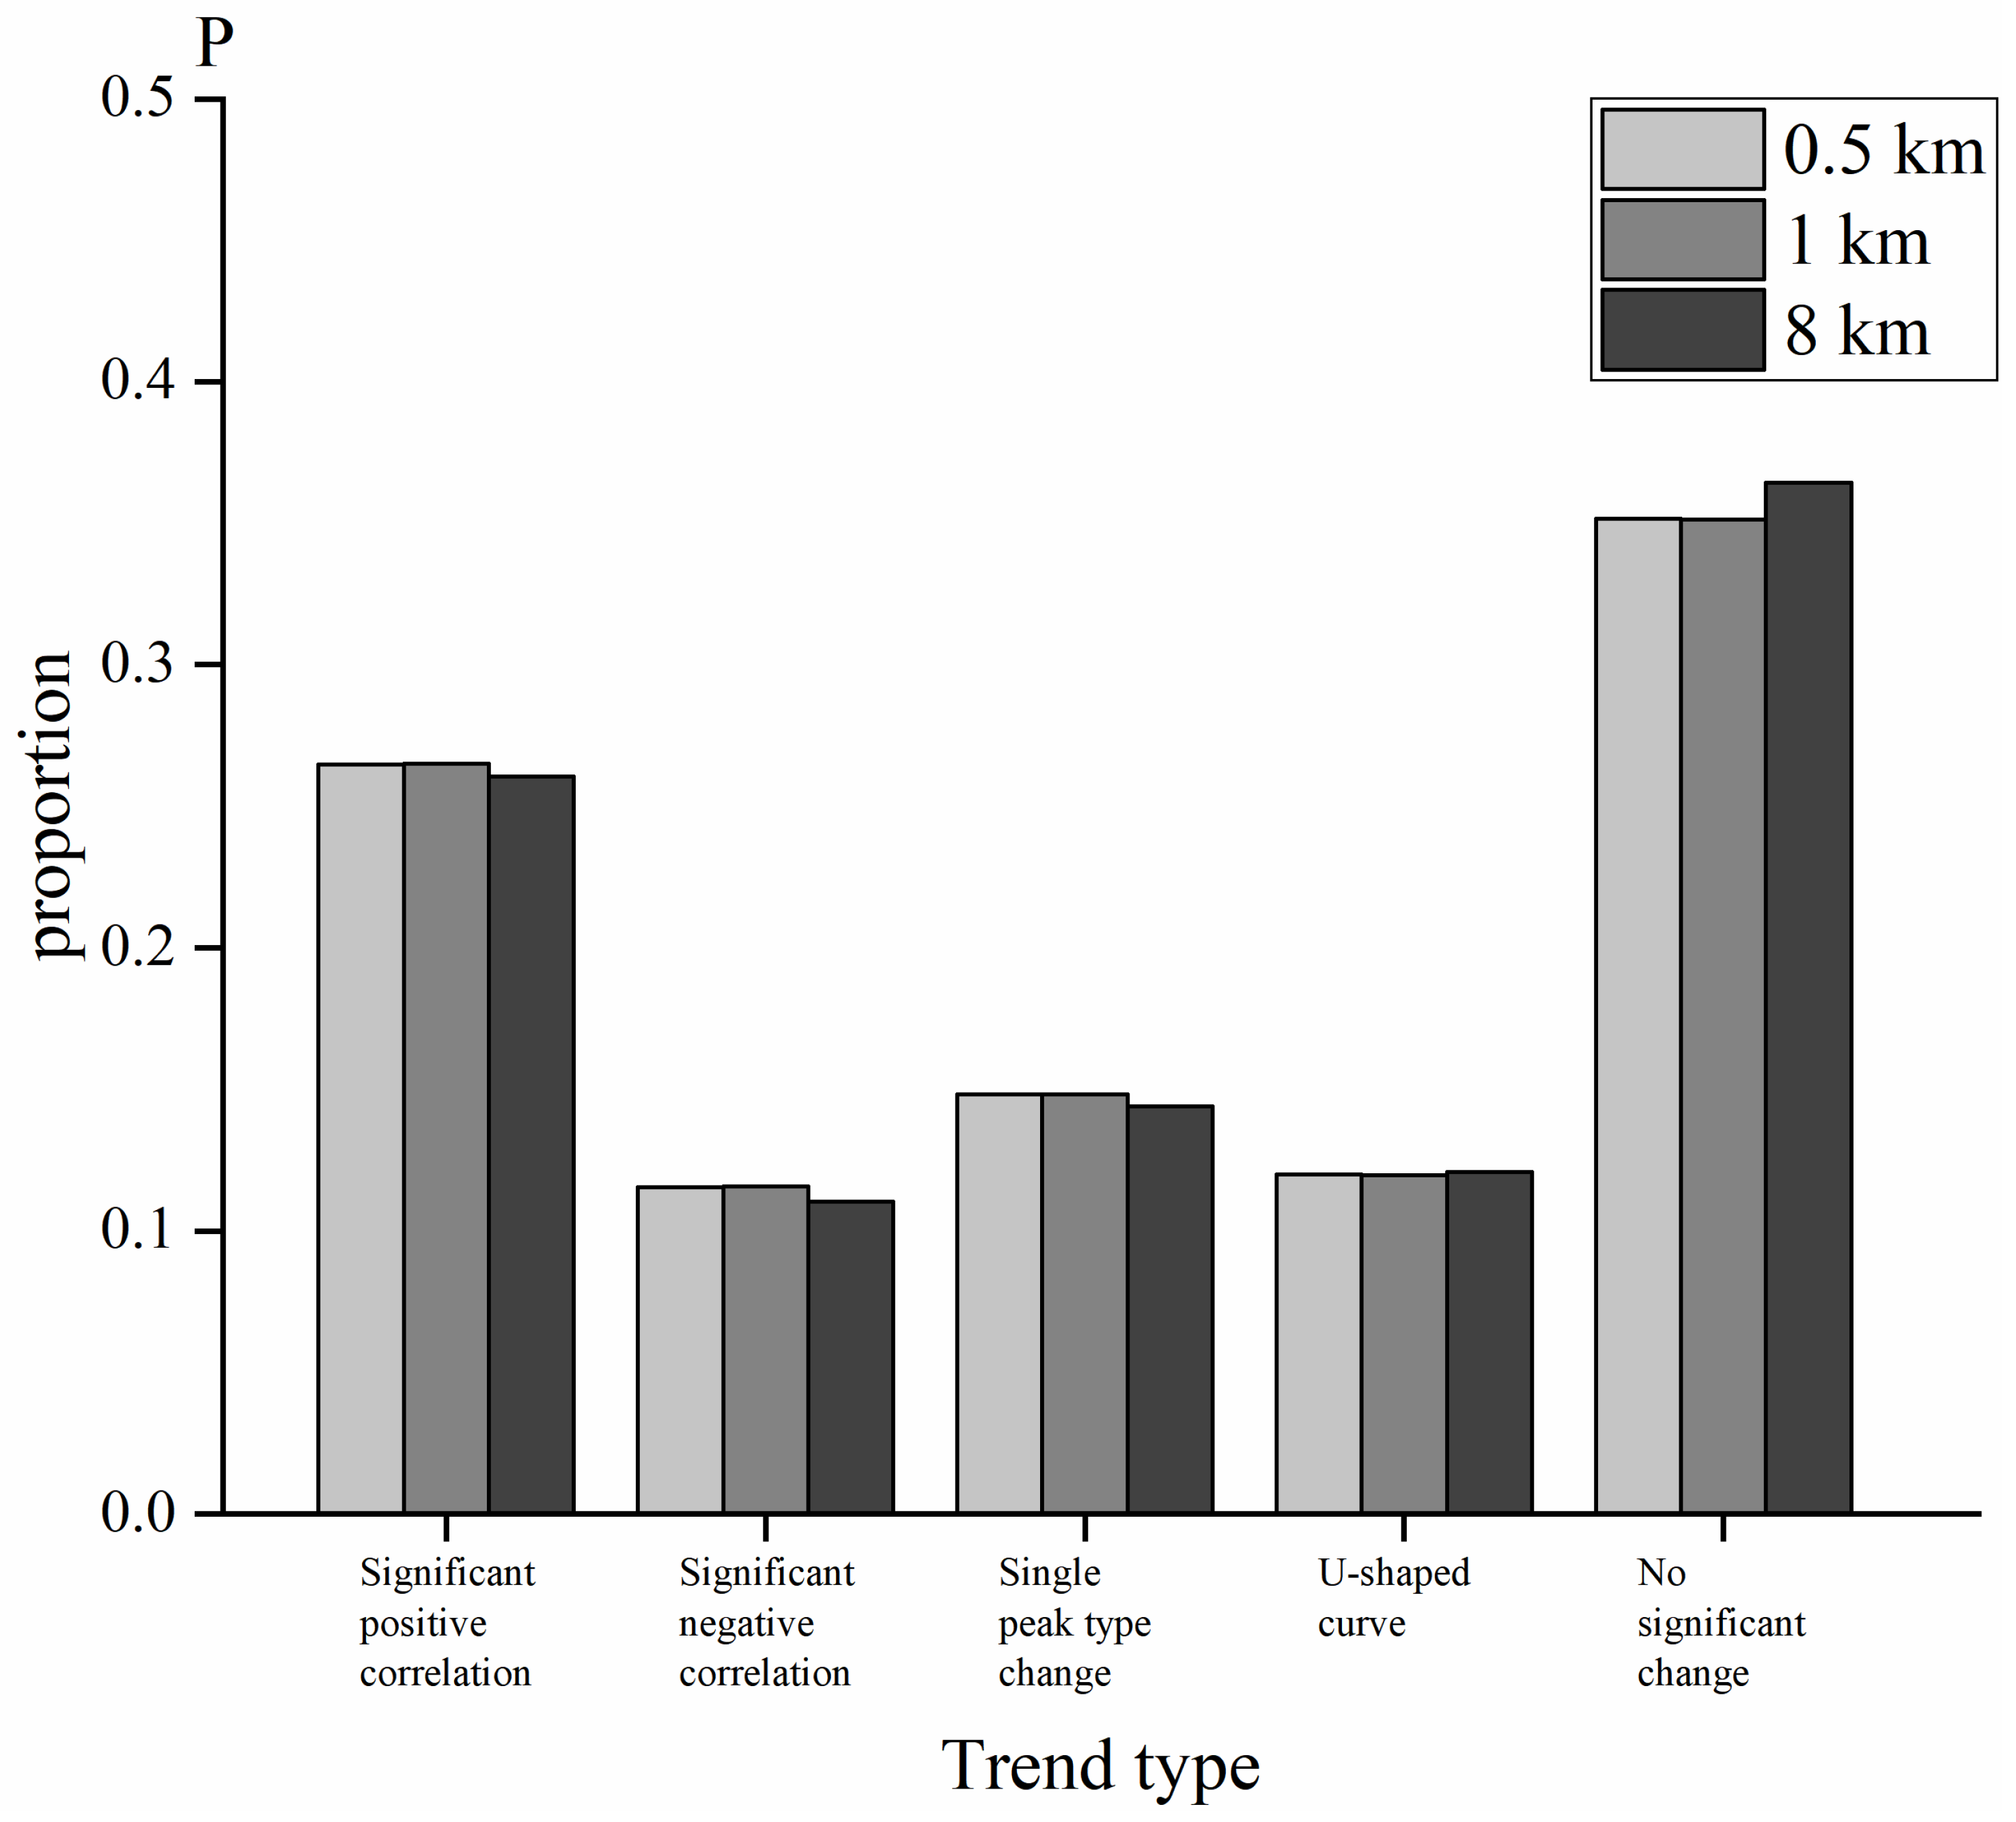
3.1.2. Proportion Analysis

Based on the Mann-Kendall test trend analysis method, the NDVI of the NSTM was calculated pixel by pixel to obtain its spatial distribution, enabling a spatial distribution map of the NDVI change trend to be constructed and the proportion of pixels displaying each trend to be calculated. In Figure 7, it can be seen that, for the interannual variation trend of the NDVI in the NSTM with a spatial resolution of 8 km, 26.06% of the total number of grids had a significant positive change; 11.02% had a significant negative change; 14.41% had a significant single-peak change that first increased and then decreased; 12.08% had a significant U-shaped change that first decreased and then increased; and 36.43% had no significant change. For the interannual variation trend of NDVI in the NSTM with a spatial resolution of 1 km, 26.52% of the total number of grids had a significant positive change; 11.56% had a significant negative change; 14.82% had a single peak change; 11.96% had a U-shaped change; and 35.13% had a non-significant change. For the interannual variation trend of NDVI in the NSTM at a spatial resolution of 0.5 km, 26.48% of the total number of grids had a significant positive change; 11.54% had a significant negative change; 14.83% had a single peak change; 11.99% had a U-shaped change; and the non-significant relationship accounted for 35.17% of all grids.
Overall, there was little difference in the proportion of grids with different NDVI interannual variation trends in the NTSM at different spatial scales. For most grids, there was no significant change, followed by a significant positive change, single peak change, and U-shaped change, with a significant negative change accounting for the fewest grids. In general, the change of vegetation NDVI in the NTSM in the past 35 years displayed an increasing trend.

3.2. Comparative Analysis of the Similarities and Differences in the Interannual Trends of NDVI at Different Spatial Scales

3.2.1. Comparative Analysis of the Interannual Trends in NDVI between Regions at Different Spatial Scales

Table 1 shows that the interannual variation of NDVI was consistent at different spatial scales in different prefectures. For example, the analysis of pixels with a specific NDVI interannual variation relationship at different spatial scales in Urumqi showed that for most pixels there was no significant change (36.62%). Pixels with a significant positive change (33.61%) accounted for the second highest proportion, followed by a single peak change (19.85%), and U-shaped change (6.31%), with a significant negative change (3.61%) accounting for the fewest pixels. In general, the vegetation coverage and growth status of Urumqi in the past 35 years displayed an increasing trend. The analysis of pixels with a specific NDVI interannual variation relationship at the different spatial scales in Ili Kazak Autonomous Prefecture showed that for most pixels the U-shaped change (71.62%) accounted for the highest proportion, followed by the significant positive change (28.15%), while the single-peak change (23%) accounted for the fewest pixels. The vegetation coverage and growth status of Ili Kazak Autonomous Prefecture displayed an increasing trend in the past 35 years.
The interannual variation trend of the NDVI at the same spatial scale had similarities and differences in the different regions, such as Urumqi City and Ili Kazak Autonomous Prefecture. There was a significant positive change in the two regions, as well as pixels with the single peak change and U-shaped change. There was a significant positive change in the interannual variation relationship of the NDVI in the different regions. Changji Hui Autonomous Prefecture accounted for the largest proportion of pixels with a significant positive change, followed by Tacheng District, Urumqi City, Bortala Mongolian Autonomous Prefecture, Hami District, Karamay City, Autonomous Region, and Ili Kazak Autonomous Prefecture. The proportion of pixels with single-peak changes was highest in Hami, while Ili Kazak Autonomous Prefecture had the lowest proportion.

3.2.2. Comparison of the Differences in Interannual NDVI Trends among Vegetation Types at Different Spatial Scales

Table 2 shows that the interannual variation relationship of the NDVI was consistent for different vegetation types and at different spatial scales. For example, an analysis of the interannual variation relationship of the grassland NDVI at different spatial scales showed that for most pixels (64.19%) there was no significant change. This finding was followed by a significant positive change (17.45%), significant negative change (7.46%), and U-shaped change (6.83%). The single peak change accounted for the fewest pixels (4.06%). In general, grassland coverage and growth status increased over the 35-year study period. There were differences in the interannual variation trend of the NDVI among the different vegetation types at the same spatial scale. In the areas of significant positive correlation, desert vegetation accounts for the greatest proportion, and broad-leaved forest accounts for the least. (Desert vegetation refers to the sparse vegetation type composed of xerophytic or ultra-xerophytic semi-trees, shrubs, semi-shrubs, and succulent plants. Similar xerophytic shrublands are found in some special hot and dry habitats in China. The Northern Slope of Tianshan Mountain overlaps with Gurbantunggut Desert, and desert vegetation grows).

4. Discussion

The response of vegetation to topography, climate change, and human activities is a complex dynamic process. Different topographic conditions will lead to differences in the spatial distribution of heat and water resources, which will lead to significant spatial differences in the NDVI in different regions and under different vegetation types, especially in ecologically sensitive arid and semi-arid areas [28,29,30,31,32,33,34,35,36]. The non-linearity of the vegetation change trend and its possible hysteresis to climate change are critically important factors in the study of the vegetation interannual change trend. Previous studies have shown that vegetation change has a certain hysteresis to temperature and precipitation, and the NDVI of vegetation on the NSTM displayed an increasing trend with global warming [35]. The influence of human activities on vegetation gradually changed from negative to positive. In previous studies, due to the use of different sources of research data, there was a spatial heterogeneity at the spatial and temporal scales, resulting in differences in the results obtained. Additionally, the scale effect of surface information in time and space has a certain range; therefore, the spatial distribution of geographical entities or phenomena shows a certain scale dependence [37].
Previous studies in global arid areas [38], Eurasia [2,39,40], and other regions [23,24,25,41,42,43,44] have shown a greening trend in vegetation NDVI. Zhao [24,41] and Du et al. [13] also proved that the NDVI in Xinjiang largely displayed an increasing trend. Ren et al. [45] studied the NDVI changes in the NSTM from 1982 to 2000 and found that the vegetation NDVI displayed an increasing trend, which proved that the results of this study were consistent with those of previous studies. Through further analyses of the NDVI changes, it was found that the vegetation cover on the NSTM has generally tended to improve over time, with the spatial distribution mainly concentrated in the center of the NSTM. This tendency may be due to the large total solar radiation received in this part of the region and the “cold wave effect” caused by the topography of the middle and low mountain warm zone [46], with the NSTM being the windward slope. There is high rainfall in the area, and various factors create an environment suitable for vegetation growth [47]. However, the prediction of the future NDVI change trend may be affected by natural and human factors that influence vegetation production, resulting in different change directions. Therefore, it is necessary to continually assess whether or not vegetation in the region is degrading and make rational use of the results.
The magnitude of the spatial scale influences the level of spatial detail and the ability to separate information from the background. The influence of the spatial scale of remote sensing images on image classification accuracy is two-sided. Due to the influence of topography and other factors, the geospatial unit size of a specific grid is different at different spatial scales, and the degree of geographic information provided is also inconsistent. Chen [48] and Zhang [49] studied the spatial scale conversion characteristics of NDVI, and identified a scale effect, which was more significant when a pixel contained water. Tian et al. [50] conducted a multi-scale analysis and verification of MODIS leaf area index (LAI) products in Scotland and discovered that, as the scale increased when a vegetation type was mixed with many other vegetation types, a large inversion error was generated. Therefore, selecting the appropriate spatial resolution when studying the vegetation NDVI is also a key issue to consider when exploring trends in vegetation changes.
The purpose of this study was to explore whether different spatial scales have an impact on the interannual variation trend of vegetation NDVI on the NTSM under the same data source. Several preliminary findings were obtained, i.e., the interannual variation characteristics of NDVI at different spatial scales are consistent, which enabled a theoretical basis for selecting suitable spatial scales. However, there were still some limitations to this study. The data source was composed of single measurements, and the conclusion cannot be generalized to form a general conclusion. Therefore, follow-up studies will continue to investigate whether the interannual variation characteristics of vegetation NDVI under other data sources or fusion data sources have the same scale invariant characteristics. In addition, we will add MODIS data sources or use a fusion of MODIS and GIMMS data sources in follow-up studies. If the interannual variation of vegetation NDVI at different spatial scales is similar to those determined in the present study, it will provide a theoretical basis for spatial scale selection in the utilization of vegetation on the NTSM.

5. Conclusions

Based on a GIMMS NDVI 3 g data set, this study used the MVC method and resampling, supplemented by Mann-Kendall trend analysis, to study the interannual variation trend of vegetation NDVI in the NTSM over the last 35 years at the grid scale. The results showed that at different spatial scales for the same data source, the general trend of the interannual variation of vegetation NDVI in the NTSM was consistent, generally showing an increasing trend that was mainly distributed in the middle of the area. Through further analysis, the interannual variation trend of the NDVI in different regions and vegetation types had similar results. The interannual trend changes at different spatial resolutions were consistent, and the interannual variation trend differed between states and vegetation types. Therefore, without considering the influence of natural factors such as topography, vegetation types, and human activities, an NDVI remote sensing map with a spatial resolution of 8 km was produced for studying the long-term interannual variation trend of vegetation NDVI on the NTSM. The results of this study provide a theoretical basis for the selection of an appropriate spatial resolution for studying the vegetation NDVI interannual variation trend in similar areas.

Author Contributions

Conceptualization, J.F., J.C. and Y.F.; methodology, J.F.; software, J.F., J.C., Y.Y., K.Z. and M.S.; formal analysis, J.F.; data curation, J.F.; writing—original draft preparation, J.F.; writing—review and editing, J.F., J.C., H.W. and Y.F.; visualization, J.F. and Q.Y.; funding acquisition, Y.F. and J.C. All authors have read and agreed to the published version of the manuscript.

Funding

This research was funded by the National Natural Science Foundation of China (32260280).

Institutional Review Board Statement

Not applicable.

Informed Consent Statement

Not applicable.

Data Availability Statement

The data presented in this study are publicly available.

Acknowledgments

We thank the anonymous reviewers for their valuable comments. We gratefully acknowledge the design of Y.F. and the contribution of co-authors.

Conflicts of Interest

The authors declare no conflict of interest.

References

  1. Peng, J.; Liu, Z.; Liu, Y.; Wu, J.; Han, Y. Trend analysis of vegetation dynamics in Qinghai–Tibet plateau using hurst exponent. Ecol. Indic. 2012, 14, 28–39. [Google Scholar] [CrossRef]
  2. Piao, S.; Wang, X.; Ciais, P.; Zhu, B.; Wang, T.; Liu, J. Changes in satellite-derived vegetation growth trend in temperate and boreal Eurasia from 1982 to 2006. Glob. Chang. Biol. 2011, 17, 3228–3239. [Google Scholar] [CrossRef]
  3. Chen, T.; Xia, J.; Zou, L.; Hong, S. Quantifying the Influences of Natural Factors and Human Activities on NDVI Changes in the Hanjiang River Basin, China. Remote. Sens. 2020, 12, 3780. [Google Scholar] [CrossRef]
  4. Shen, M.; Zhang, G.; Cong, N.; Wang, S.; Kong, W.; Piao, S. Increasing altitudinal gradient of spring vegetation phenology during the last decade on the Qinghai-Tibetan Plateau. Agric. For. Meteorol. 2014, 189–190, 71–80. [Google Scholar] [CrossRef]
  5. Van Leeuwen, W.J.D.; Orr, B.J.; Marsh, S.E.; Herrmann, S.M. Multi-sensor NDVI data continuity: Uncertainties and implications for vegetation monitoring applications. Remote Sens. Environ. 2006, 100, 67–81. [Google Scholar] [CrossRef]
  6. Du, J.; Shu, J.; Wang, Y.; Li, Y.; Zhang, L.; Guo, Y. Comparison of GIMMS and MODIS normalized vegetation index composite data for Qinghai-Tibet Plateau. J. Appl. Ecol. 2014, 25, 533–544. [Google Scholar]
  7. Bian, L.; Walsh, S.J. Scale Dependencies of Vegetation and Topography in a Mountainous Environment of Montana. Prof. Geogr. 1993, 45, 1–11. [Google Scholar] [CrossRef]
  8. Aman, A.; Randriamanantena, H.P. Upscale Integration of Normalized Difference Vegetation Index: The Problem of Spatial Heterogeneity. IEEE Trans. Geosci. Remote Sens. 1992, 30, 326–338. [Google Scholar] [CrossRef]
  9. Piao, S.; Fang, J.; Zhou, L.; Guo, Q.; Henderson, M.; Ji, W.; Li, Y.; Tao, S. Interannual variations of monthly and seasonal normalized difference vegetation index (NDVI) in China from 1982 to 1999. J. Geophys. Res. Atmos. 2003, 108. [Google Scholar] [CrossRef]
  10. Fang, J.; Piao, S.; He, J.; Ma, W. Increasing Terrestrial Vegetation Activity in China, 1982–1999. Sci. China Ser. C Life Sci. 2004, 47, 229–240. [Google Scholar]
  11. Liu, Y.; Liu, X.; Hu, Y.; Li, S.; Peng, J.; Wang, Y. Analyzing nonlinear variations in terrestrial vegetation in China during 1982–2012. Environ. Monit. Assess. 2015, 187, 1–14. [Google Scholar] [CrossRef] [PubMed]
  12. Kai, J.; Wang, F.; Han, J.; Shi, S.; Ding, W. Effects of climate change and human activities on vegetation ndvi changes in China from 1982 to 2015. Acta Geogr. Sin. 2020, 75, 961–974. [Google Scholar]
  13. Du, J.; Shu, J.; Zhao, C.; Fang, S.; Yin, J.; He, P. Dynamic changes and driving factors of monthly NDVI in Xinjiang in recent 30 years. Agric. Eng. 2016, 32, 172–181. [Google Scholar]
  14. Li, C.; Luo, D.; Li, X.; Liu, L.; Chen, F. Comprehensive Evaluation of Vegetation Ecological Quality in Tianshan Mountains from 2000 to 2018. J. Lanzhou Univ. 2021, 57, 528–536. [Google Scholar]
  15. Zhang, R.; Liang, T.; Guo, J.; Xie, H.; Feng, Q.; Aimaiti, Y. Grassland Dynamics in Response to Climate Change and Human Activities in Xinjiang from 2000 to 2014. Sci. Rep. 2018, 8, 2888. [Google Scholar] [CrossRef] [Green Version]
  16. Chen, C.; Li, Y.; Peng, J. Spatio-temporal analysis of NPP in Xinjiang natural grassland in recent 20 years. Geogr. Arid. Area 2022, 45, 522–534. [Google Scholar]
  17. Gu, Y.; Wylie, B.K. Downscaling 250-m MODIS Growing Season NDVI Based on Multiple-Date Landsat Images and Data Mining Approaches. Remote Sens. 2015, 7, 3489–3506. [Google Scholar] [CrossRef] [Green Version]
  18. Ma, Z.; Dong, C.; Lin, K.; Yan, Y.; Luo, J.; Jiang, D.; Chen, X. A Global 250-m Downscaled NDVI Product from 1982 to 2018. Remote Sens. 2022, 14, 3639. [Google Scholar] [CrossRef]
  19. Nomura, R.; Oki, K. Downscaling of MODIS NDVI by Using a Convolutional Neural Network-Based Model with Higher Resolution SAR Data. Remote Sens. 2021, 13, 732. [Google Scholar] [CrossRef]
  20. Yang, J.; Zhou, X.; Xiong, J.; Zhikai, Z.; Wei, X. NDVI downscaling adaptability evaluation of Wujiang River Basin in Guizhou. Remote Sens. Inf. 2020, 35, 129–137. [Google Scholar]
  21. Yin, X.; Zhu, H.; Gerry, G.; Gao, J.; Guo, L.; Wang, J. The Impact of Climate Change and Human Activities on Net Primary Productivity Change on the Northern Slope of Tianshan Mountains. Agric. Eng. 2020, 36, 195–202. [Google Scholar]
  22. Meng, M.; Niu, Z.; Ma, C.; Tian, H.; Pei, J. The variation trend of NDVI in the Tibetan Plateau and its response to climate. Soil Water Conserv. Res. 2018, 25, 360–365, 372. [Google Scholar]
  23. Peng, S.S.; Chen, A.P.; Xu, L.; Cao, C.X.; Fang, J.Y.; Myneni, R.B.; Pinzon, J.E.; Tucker, C.J.; Piao, S.L. Recent change of vegetation growth trend in China. Environ. Res. Lett. 2011, 6, 044027. [Google Scholar] [CrossRef]
  24. Zhao, X.; Tan, K.; Fang, J.-Y. NDVI-based Interannual and Seasonal Variations of Vegetation Activity in Xinjiang during the Period of 1982-2006. Arid. Zone Res. 2011, 28, 10–16. [Google Scholar] [CrossRef]
  25. Dai, S.; Zhang, B.; Wang, H.; Wang, Y.; Guo, L.; Wang, X.; Li, D. Vegetation Cover Change and the Driving Factors over Northwest China. J. Arid. Land 2011, 3, 25–33. [Google Scholar]
  26. Burnham, K.P.; Anderson, D.R. Model Selection and Multimodel Inference: A Practical Information-Theoretic Approach. J. Wildl. Manag. 2003, 67, 655. [Google Scholar]
  27. Su, R.; Cheng, J.; Chen, D.; Bai, Y.; Jin, H.; Chao, L.; Wang, Z.; Li, J. Effects of grazing on spatiotemporal variations in community structure and ecosystem function on the grasslands of Inner Mongolia, China. Sci. Rep. 2017, 7, 40. [Google Scholar] [CrossRef] [Green Version]
  28. Qin, G.; Lu, Q.; Meng, Z.; Li, Z.; Chen, H.; Kong, J.; Li, Z.; Qin, A. 1982–2015 Spatiotemporal Dynamics of ndvi and Its Response to Climate Change in Grassland of Northern China. Soil Water Conserv. Res. 2021, 28, 101–108 + 17. [Google Scholar]
  29. Zhao, H.; Zhao, Y.; Zhou, Y.; Pei, T.; Xie, B.; Wang, X. Temporal and spatial variation of NDVI and its response to climatic factors in the growing season of vegetation in central and eastern Gansu. Geogr. Arid. Area 2019, 42, 1427–1435. [Google Scholar]
  30. Xiu, L.; Yan, C.; Qian, D.; Xing, Z. Spatio-temporal characteristics and driving forces of vegetation change in the Loess Plateau under the background of ecological engineering. Soil Water Conserv. Bull. 2019, 39, 214–221, 228. [Google Scholar]
  31. Rong, A.; Bi, Q.; Dong, Z. Vegetation change and its attribution in Xilinguole grassland based on MODIS/ NDVI. Resour. Sci. 2019, 41, 1374–1386. [Google Scholar]
  32. Gian-Reto, W.; Eric, P.; Peter, C.; Annette, M.; Camille, P.; Trevor, J.B.; Jean-Marc, F.; Ove, H.-G.; Franz, B. Ecological Responses to Recent Climate Change. Nature 2002, 416, 389–395. [Google Scholar]
  33. Zoungrana, B.J.-B.; Conrad, C.; Thiel, M.; Amekudzi, L.K.; Da, E.D. MODIS NDVI trends and fractional land cover change for improved assessments of vegetation degradation in Burkina Faso, West Africa. J. Arid. Environ. 2018, 153, 66–75. [Google Scholar] [CrossRef]
  34. Liang, S.; Peng, S.; Lin, X.; Cong, N. Spatio-temporal changes of grassland growth in China from 1982 to 2010. J. Peking Univ. 2013, 49, 311–320. [Google Scholar]
  35. Imir, N.; Shabitti, M.; Maimatti, Y. Temporal and spatial variation of vegetation NDVI on the northern slope of Tianshan Mountains and its relationship with climatic factors. Arid. Zone Study 2019, 36, 1250–1260. [Google Scholar]
  36. Dai, S.; Zhang, B.; Wang, H. Spatiotemporal Changes of Vegetation NDVI in Northwest China and Its Influencing Factors. Acta Geosci. Sin. 2010, 12, 315–321. [Google Scholar]
  37. Ming, D.; Wang, Q.; Yang, J. Spatial scale characteristics and optimal spatial resolution selection of remote sensing images. J. Remote Sens. 2008, 12, 529–537. [Google Scholar]
  38. Pinzon, J.; Tucker, C. A Non-Stationary 1981–2012 AVHRR NDVI 3g Time Series. Remote Sens. 2014, 6, 6929–6960. [Google Scholar] [CrossRef] [Green Version]
  39. Tucker, C.J.; Slayback, D.A.; Pinzon, J.E.; Los, S.O.; Myneni, R.B.; Taylor, M.G. Higher Northern Latitude Normalized Difference Vegetation Index Andgrowing Season Trends from 1982 to 1999. Int. J. Biometeorol. J. Int. Soc. Biometeorol. 2001, 45, 184–190. [Google Scholar] [CrossRef]
  40. Deng, X.; Yao, J.; Liu, Z. Spatio-temporal changes of vegetation coverage in arid Central Asia based on GIMMS NDVI. Arid. Zone Study 2017, 34, 10–19. [Google Scholar]
  41. Zhao, X.; Tan, K.; Zhao, S.; Fang, J. Changing climate affects vegetation growth in the arid region of the northwestern China. J. Arid. Environ. 2011, 75, 946–952. [Google Scholar] [CrossRef]
  42. Chen, C.; Park, T.; Wang, X.; Piao, S.; Xu, B.; Chaturvedi, R.K.; Fuchs, R.; Brovkin, V.; Ciais, P.; Fensholt, R.; et al. China and India lead in greening of the world through land-use management. Nat. Sustain. 2019, 2, 122–129. [Google Scholar] [CrossRef] [PubMed]
  43. Parida, B.; Pandey, A.; Patel, N. Greening and Browning Trends of Vegetation in India and Their Responses to Climatic and Non-Climatic Drivers. Climate 2020, 8, 92. [Google Scholar] [CrossRef]
  44. Sarmah, S.; Jia, G.; Zhang, A. Satellite view of seasonal greenness trends and controls in South Asia. Environ. Res. Lett. 2018, 13, 034026. [Google Scholar] [CrossRef]
  45. Ren, J.; Liu, H.; Yin, Y.; He, S. Drivers of greening trend across vertically distributed biomes in temperate arid Asia. Geophys. Res. Lett. 2007, 34, L07707. [Google Scholar] [CrossRef]
  46. Zhou, X. Study on the vertical differentiation of climate in the middle section of the northern slope of Tianshan Mountains. Geogr. Arid. Area 1995, 2, 52–60. [Google Scholar]
  47. Chen, C.; Jing, C.; Xing, W.; Deng, X.; Fu, H.; Guo, W. Dynamic changes of desert grassland in Xinjiang in recent 20 years and its response to climate change. J. Prataculture 2021, 30, 1–14. [Google Scholar]
  48. Chen, J.M. Spatial Scaling of a Remotely Sensed Surface Parameter by Contexture. Remote Sens. Environ. 1999, 69, 30–42. [Google Scholar] [CrossRef]
  49. Zhang, X.; Yan, G.; Li, Q.; Li, Z.-L.; Wan, H.; Guo, Z. Evaluating the Fraction of Vegetation Cover Based on NDVI Spatial Scale Correction Model. Int. J. Remote Sens. 2007, 27, 5359–5372. [Google Scholar] [CrossRef]
  50. Tian, F.; Fensholt, R.; Verbesselt, J.; Grogan, K.; Horion, S.; Wang, Y.J. Evaluating temporal consistency of long-term global NDVI datasets for trend analysis. Remote Sens. Environ. 2015, 163, 326–340. [Google Scholar] [CrossRef]
Figure 1. Location of the study area.
Sustainability 15 06642 g001
Figure 2. Vegetation types in the study area.
Sustainability 15 06642 g002
Figure 3. Five types of trends. (Note: The letter (AE) in the figure represents significant positive change, significant negative change, single peak type change, U-shaped curve, and no significant change).
Sustainability 15 06642 g003
Figure 4. The 8 km resolution NDVI change trend spatial distribution.
Sustainability 15 06642 g004
Figure 5. The 1 km resolution NDVI change trend spatial distribution.
Sustainability 15 06642 g005
Figure 6. The 0.5 km resolution NDVI change trend spatial distribution.
Sustainability 15 06642 g006
Figure 7. The proportion of grids with different NDVI change trends at three different spatial scales.
Sustainability 15 06642 g007
Table 1. Comparison of the variation in trends (%) between regions at different spatial scales.
TrendsUrumqiKaramayAutonomous RegionHami PrefectureChangji Hui Autonomous PrefectureTarbagatay PrefectureBortala Mongol Autonomous PrefectureYili Kazakh Autonomous Prefecture
Significant positive change0.5 km33.4914.1347.055.7440.6640.8015.2126.15
1 km33.5314.1147.755.7240.7140.9015.2926.71
8 km33.8112.3050.007.1040.5936.3413.8531.58
Significant negative change0.5 km3.3316.920.0023.297.611.9610.720.00
1 km3.2117.040.0023.317.631.9710.800.00
8 km4.2918.850.0021.317.372.859.490.00
Single peak type change0.5 km20.1812.6034.6726.2311.455.556.470.34
1 km20.3212.5634.1926.2011.445.496.550.34
8 km19.0511.4827.7825.4812.145.234.360.00
U-shaped curve0.5 km6.4127.7314.975.5010.1922.3016.0273.51
1 km6.3227.7514.645.4810.1822.2316.0072.95
8 km6.1925.4116.675.4110.2321.6218.4668.42
No significant change0.5 km36.5828.633.3139.2530.1029.3951.580.00
1 km36.6228.553.4139.2830.0429.4151.370.00
8 km36.6731.975.5640.7029.6633.9753.850.00
Table 2. Comparison of the variation in trends (%) between vegetation types at different spatial scales.
TrendsConiferous ForestBroadleaf ForestScrubDesertGrasslandMeadowAlpine VegetationCultivated VegetationOther
Significant positive change0.5 km21.6967.9531.1622.9917.8532.2936.3456.3512.49
1 km21.7468.1031.1023.0417.8132.4636.263.2612.64
8 km17.4671.4329.4122.9416.7029.4340.9656.1314.63
Significant negative change0.5 km6.710.001.5615.887.265.023.560.4821.48
1 km6.620.001.4615.907.255.093.760.4721.57
8 km6.350.000.0014.977.876.014.820.3117.89
Single peak type change0.5 km4.7516.775.9620.573.886.124.589.2326.19
1 km4.9016.675.7720.583.906.054.419.1926.33
8 km3.1728.5717.6520.034.415.703.619.5123.58
U-shaped curve0.5 km3.225.767.2110.386.7614.819.7927.8015.95
1 km3.096.327.1610.316.8214.779.8127.8115.99
8 km4.760.005.889.566.9116.4612.0527.6123.58
No significant change0.5 km63.638.8154.1130.1764.2441.7545.736.1423.88
1 km63.648.9154.5030.1764.2341.6345.756.1323.46
8 km68.250.0047.0632.5064.1142.4138.556.4420.33
Disclaimer/Publisher’s Note: The statements, opinions and data contained in all publications are solely those of the individual author(s) and contributor(s) and not of MDPI and/or the editor(s). MDPI and/or the editor(s) disclaim responsibility for any injury to people or property resulting from any ideas, methods, instructions or products referred to in the content.

