Abstract
The changing climate in recent decades has caused rapid, widespread frozen ground degradation of the cryosphere, and changes in frozen ground may largely affect the ecosystem function. This study presents the long-term shrinkage of frozen ground, driven forces and resultant ecological impacts at three high-latitude sites (namely Nenjiang, Jiagedaqi, and Tahe, from low to high latitude) in Northeast China, an area that has received less attention in previous permafrost studies. As the key indicators of frozen ground, the ground surface and subsurface soil temperature (down to 40 cm) were found to increase in the period from the 1970s to the 2000s. The annual mean air temperatures at observation sites have increased significantly at rates of 0.24~0.40 °C/decade from 1971 to 2019, and were found to be negatively correlated to the change in soil freeze depth at the Jiagedaqi and Tahe sites. The annual snow depth at Jiagedaqi was found to decrease at a rate of 1.8 cm/decade, and positively correlate to the soil freezing index. The vegetation status of the three watersheds improved, as indicated by the increased normalized difference vegetation index (NDVI) from 2000 to 2017. Our results can make a valuable contribution to knowledge of climate–frozen ground interactions, and can highlight the importance of examining such interaction for permafrost protection in similar high-latitude permafrost-dominated basins.
1. Introduction
Frozen ground is the product of energy and water exchanges between the lithosphere and atmosphere, and widespread frozen ground degradation has been reported over the cryosphere, which could affect the functioning of vegetation–hydrology–carbon cycle [1]. It is composed of permafrost and seasonally frozen ground [2]. In Northeast China, the Xing’an extent of permafrost was reported to have declined by 40.6% from the 1960s to the 2010s [3], and the southern limit of permafrost has moved northward by 0.1°–1.1° between the 1950s and 2010s [4].
Researchers have broadly agreed that the warming climate is the primary cause of ground surface warming [5,6]; while in many studies, the roles of snow cover, soil properties and overlying vegetation in frozen ground degradation were also emphasized [7,8]. Permafrost degradation in the Qinghai-Tibet Plateau has been primarily attributed to the air temperature warming [9], and changes in precipitation, relative humidity, wind speed and solar radiation were also found to exert certain impacts [10]. Other than natural factors, human activities such as overgrazing and engineering projects were also found to disrupt the original ground surface stability and cause irreversible disturbances in permafrost regions [11].
Changes of frozen ground will affect local hydrological cycles [12] as the soil pores filled with ice have low hydraulic conductivity and act as a barrier that affects the movement, storage, and exchange of the surface and subsurface water [13]. Studies have reported an increase in baseflow in northern Eurasia [14] and over the Aldan subbasin in Siberia [15]. In addition, the change in permafrost can alter the soil nutrients’ availability and soil water content [16], thus affecting the vegetative species’ composition, productivity and biomass [17]. In the source region of Yellow River, the decreased normalized difference vegetation index (NDVI) was found to be associated with the decreased seasonally frozen depth due to the enhanced evapotranspiration and reduced soil moisture [18].
The frozen ground in Northeastern China lies in the southernmost edge of the Northern Hemisphere permafrost regions, and is projected to see an increase in temperature on the hottest days of about 1.5 to 2 times the rate of global warming [19]. In addition, the Northeast China region is of great ecological and social-economical significance as it holds a dense distribution of wetlands and lakes; meanwhile, it plays an important role in the north line of the belt and road initiative and the economic corridor of China–Mongolia–Russia. The degradation of frozen ground may possibly affect the formation, growth and succession of wetland and forest [20], as well as the stability of bedrock and unconsolidated sediments [21].
In comparison with pan-arctic and high-altitude regions, the permafrost in Northeast China at high latitudes is more vulnerable to degradation, as the permafrost here is thinner and more susceptible to anthropogenic perturbations. Located in the southernmost edge of the Eurasian permafrost region, this area may offer a glimpse into the possible developments of frozen ground and the resultant impacts on high-latitude regions. For this, three observation sites, namely Nenjiang, Jiagedaqi, and Tahe, were selected to characterize the changes in frozen ground in the high-latitude areas of Northeast China. These three sites have a latitude gradient and belong to different geocryological zones (i.e., sporadic and discontinuous permafrost zones). The main objectives were (1) to characterize the changes in frozen ground based on various data from the 1970s to the 2000s, and (2) to identify the major driven forces of the frozen ground changes, and explore the vegetation (NDVI) responses to its degradation. This study may make a valuable contribution to understanding worldwide changes in frozen ground, which can then provide a novel perspective regarding frozen ground preservation in high-latitude regions of the world.
2. Study Area
This study focused on three observation sites in the mid-to-high-latitude permafrost region in Northeast China (Figure 1); they are the Tahe site (TH) in the Huma River watershed, the Jiagedaqi site (JGDQ) in the Gan River watershed, and the Nenjiang (NJ) site upstream of the Nen River watershed. The latitudes of the selected sites varied from 49°10′ N to 52°21′ N, spanning from the Northeast Plain to the Inner Mongolia Plateau.
The three sites are all located in cold-temperature continental monsoon climate zones. Winter (November to March of the next year) is long and dry due to the frequent invasions of cold air masses from the Siberia and Mongolia plateaus, while summer (July to August) is short and rainy. According to meteorological records (1971–2019), approximately 85% of the annual total precipitation occurs from May to September. Snow generally begins to fall from late September to early October, and the accumulated ice/snow starts to melt from late April to early May in the following year.
The three study sites are distributed along a latitude gradient and in different geocryological zones, i.e., from the sporadic to the discontinuous (Figure 1). The geographic distribution allows for a comprehensive examination of the frozen ground changes in different permafrost zones and their responses to climatic factors along a latitude gradient. TH and JGDQ are located at a medium-to-high altitude and in large undulating mountains, with a strata profile of cultivated soil, clay, gravel soil and igneous rock; NJ is located in low- and medium-altitude alluvial plains with a strata profile of cultivated soil, clay, sandy soil, gravel sand, and conglomerate [22]. According to the engineering classifications of ground ice [23], the study area was dominated by ice-poor frozen soil (with an ice content of 0–10%) and ice soil (ice content 10–25%). The basic information of the three studied sites is given in Table 1.

Table 1.
Basic information of the three monitoring stations.
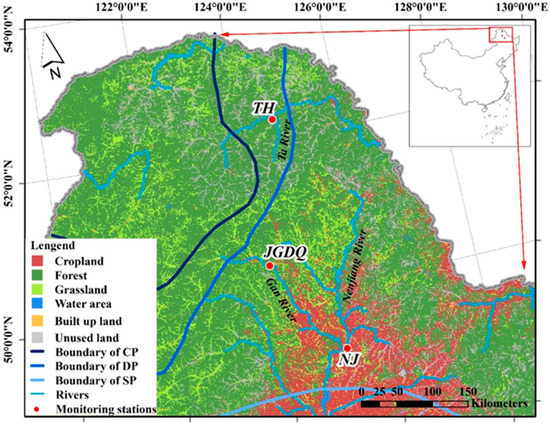
Figure 1.
Map of study region and monitoring stations in Northeast China. Note that the monitoring station stands for the meteorological and borehole stations that have close proximities. CP: Continuous permafrost; DP: Discontinuous permafrost; SP: Sporadic permafrost. The geocryological classification was adapted from Zhou et al. [24].
3. Materials and Methodology
3.1. Data
Three categories of data were used in this study to characterize the frozen ground change, driven forces and impacts, including the ground temperature and frozen depth data, meteorological data, and land use data. Data were recorded at sites TH, JGDQ and NJ, as shown in Figure 1, and the available years for each data category at different sites were not consistently the same. Details of data availability can be found in Appendix A (Table A1).
Ground temperature is an important indicator of active layer change and frozen ground status. The ground temperature data include the ground surface (0 cm) temperature from 1971/1972 to 2019, and subsurface 5.0, 10.0, 15.0, 20.0, and 40.0 cm ground temperature data (40 cm was only available for JGDQ) from the 1970s to the 2000s. The soil freeze depth (hereafter SFD), which denotes the lower limit of the frozen zone, was measured in boreholes using frozen soil apparatus [25]. Data were recorded on a daily basis, and the maximum SFD value throughout one year was used to represent the frozen ground status. The beginning date of thawing (BTD) and the beginning date of freezing (BFD) of the surface soil were used to examine the changes in the active layer that is subject to seasonally thawing and freezing; data were available from the 1970s to the 2000s. The ground surface (0 cm) temperature data were derived from the National Meteorological Information Center (http://data.cma.cn/, accessed on 1 September 2022), and other data were measured in the boreholes and were obtained from the Statistical Review of Ground Temperature and Permafrost of Heilongjiang Province.
Meteorological data that may affect frozen ground status include daily air temperature, precipitation, and snow depth. The daily air temperature and precipitation were recorded at the national ground stations of TH, JGDQ and NJ. Data were downloaded from the National Meteorological Information Center (http://data.cma.cn/ accessed on, 1 September 2022). The daily snow depth at 25 km × 25 km resolutions in longitude and latitude was obtained from the National Tibetan Plateau Scientific Data Center. The annual mean snow depths were computed during the winter season from 1 November to 31 March in the next year for grids where observational sites were located.
Land use data of the years 1980, 1990, 1995, 2000, 2005 and 2010 with a spatial resolution of 1 km were obtained from the Center of Resources and Environment Science, Chinese Academy of Sciences (http://www.resdc.cn, accessed on 1 September 2022). The data divided the underlying surface into six categories, i.e., arable land, forest, grassland, water area, construction land and unused land. To understand the potential relationship between frozen ground shrinkage and vegetation status, the normalized difference vegetation index (NDVI), which can adequately represent the vegetation growth status and distribution density [26], was extracted from the MODIS Vegetation Indices 16-Day L3 Global 500M SIN Grid (MOD13A1). The MOD13A1 source images from 2000 to 2017 were obtained from the NASA global MODIS-Terra data (https://lpdaac.usgs.gov, accessed on 1 September 2022). The NDVI of three watersheds wherein the observation sites are located were computed to represent the vegetation status of each watershed.
3.2. Soil Freezing/Thawing Index (FIS/TIS)
The freezing index (FI) and thawing index (TI) of the air and/or soil surface are widely used indicators depicting the changes in the active layer [27]. FIS/TIS is the sum of the absolute values of daily mean ground surface temperature below/above 0 °C during the freezing/thawing period, respectively.
FIS is calculated as
where T is the ground temperature, and t0 and t1 refer to the starting day and the ending day of the freezing period, respectively. In this study, t0 is 1 July and t1 is 30 June in the next year [28], and T is integrated only when T is below 0 °C.
Similarly, TIS is calculated as
where TIs is an integral of the ground temperature from the beginning day (t2), i.e., 1 January, to the end day (t3), i.e., 31 December, and T is counted only when T is above 0 °C.
Referring to the frost index number of Nelson and Outcalt [29], this study defined the soil freezing capacity (SFC), expressed as the ratio of FIS and TIS, to evaluate the ground surface freezing potential:
when SFC > 1.0, the near-surface is more likely to freeze than thaw, and vice versa when SFC < 1.0.
4. Results and Discussion
4.1. Changes of Meteorological Variables
Figure 2a shows that the mean annual air temperature (hereafter MAAT) at three meteorological stations all had significant increasing trends (p < 0.01) from 1971 to 2019. The increasing rate was the slowest at TH (0.24 °C/decade), while JGDQ and NJ exhibited more rapid warming trends with an overall increasing rate at 0.38 °C/decade and 0.40 °C/decade, respectively; this is probably due to their more southern locations. The MAAT was found to be lower than 0 °C over the entire period for TH, above 0 °C for most of the years for NJ, and less than 0 °C before 2000 and great than 0 °C after 2000 for JGDQ. Figure 2b,c further show that the number of days when the air temperature exceeded 0 °C and the annual cumulative air temperature was above 0 °C at all sites underwent a significant increase from 1971 to 2019.
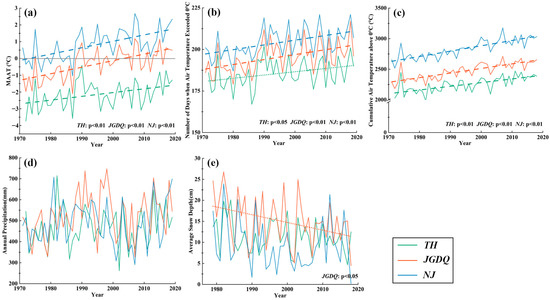
Figure 2.
(a) Mean annual air temperature (MAAT), (b) number of days when air temperature exceeded °C, (c) the cumulative air temperature was above 0 °C, (d) annual precipitation at TH, JGDQ and NJ stations; and (e) annual average snow depth based on the 25 km resolution remote sensing data for grids at which the observation sites are located. The dashed lines show the linear trends when p < 0.01, and the dotted lines show the linear trends when p < 0.05.
The annual precipitation at three sites (Figure 2c) all showed no significant increasing or decreasing trends. As shown in Figure 2d, the annual snow depths showed no significant increasing or decreasing trends at TH and NJ, while there was a significant decreasing trend at JGDQ (−1.8 cm/decade, p < 0.05).
4.2. Changes in Ground Surface Variables
Figure 3 shows the mean annual ground surface (0 cm) temperature (MAGST) from 1971 to 2019. All sites displayed an increasing MAGST trend, with changing rates of 0.41 °C/decade at TH, 0.47 °C/decade at JGDQ and 0.53 °C/decade at NJ (p < 0.01). TH has the slowest increasing rate, followed by JGDQ and NJ, which is consistent with the changing trends of MAAT. Such warming trends of the ground surface may contribute to the frozen ground degradation, as the ground temperatures were found to vary coincidently with MAGST [30].
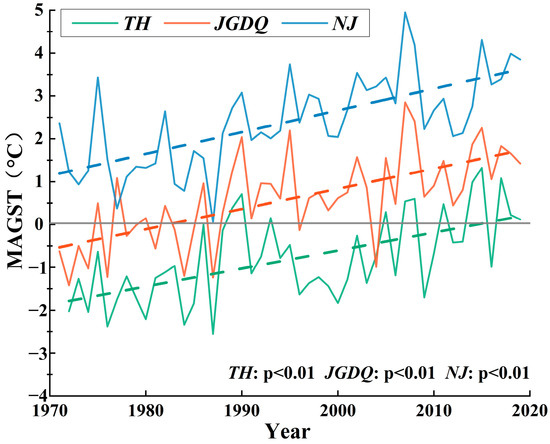
Figure 3.
Mean annual ground surface temperature (MAGST) at the three observation sites. The dashed line shows the linear trends when p < 0.01.
The SFC was calculated based on the ground surface temperature (Figure 3) to explore the near-surface freezing potential. All three sites exhibited a significant decreasing trend (p < 0.01) of SFC from 1971 to 2018, while the change patterns differed among the three sites in terms of FIS and TIS trends (Figure 4a–c) and the SFC magnitude (Figure 4d–f). The interannual variation of FIS showed a decreasing trend (p < 0.01) in JGDQ, while the other two sites had no significant changes. On the contrary, TIS showed significant increasing trends at all sites. The SFC of TH was generally greater than 1.0, which meant that the freezing capacity of the surface soil was greater than the thawing capacity throughout the year; meanwhile, after 2000, the SFC fluctuated around 1.0, which indicated a balance between the soil’s freezing and thawing capabilities. In JGDQ, the SFC varied around 1.0 before 1990, and after that completely dropped below 1.0, indicating that the ground surface of JGDQ has changed from easy-to-freeze to the more recent easy-to-thaw. The SFC of NJ remained lower than 1.0, indicating its strong soil-thawing tendency over the years.
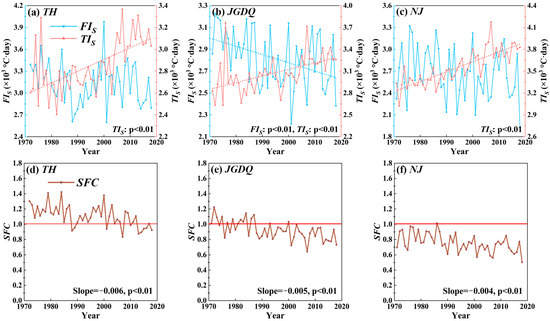
Figure 4.
The soil freezing index (FIS) and soil thawing index (TIS) in (a–c). The soil freezing capacity (SFC) of ground surface in (d–f). SFC = 1 means FIS =TIS.
4.3. Changes in Subsurface Soil Temperature and Soil Freeze Depth (SFD)
There is an active layer that is subject to seasonally thawing and freezing, wherein the frozen soil starts to thaw when the soil temperature is above 0 °C, normally in early May, and will freeze when the soil temperature drops below 0 °C, normally in late September. The subsurface soil temperatures at depths 5 cm, 10 cm, 15 cm, 20 cm, and 40 cm (40 cm for JGDQ only) during the thawing period are shown in Figure 5; data were averaged from May to September every 5 years. It is obvious that the subsurface soil temperature profiles moved right continuously in TH and NJ, while that in JGDQ fluctuated from 1971 to 2005. Though the 20 cm depth is too shallow to determine the freezing depth, the heat in the soils may be accumulated and transferred to the deeper ground, which may further cause a shallowed SFD and a thickened active layer.
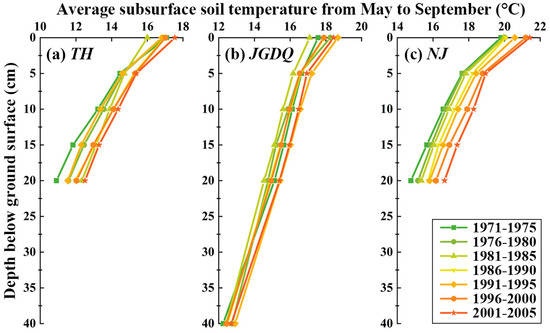
Figure 5.
Subsurface soil temperature at 5 cm, 10 cm, 15 cm and 20 cm (40 cm at JGDQ) depths below the ground surface for (a–c); each plot represents the soil temperature averaged from May to September every 5 years.
The SFD refers to the bottom table of the frozen soil, and is an important indicator of both permafrost and seasonally frozen ground. Figure 6 displays the annual maximum SFD during 1971–2008 for the three sites. Over the observation period, the SFD of JGDQ ranged from 1.7 m to 2.9 m, and that of NJ ranged from 1.5 m to 2.5 m. Both the two sites showed overall decreasing SFD trends, with −8 cm/decade (p < 0.05) for JGDQ and −13 cm/decade (p < 0.01) for NJ. In contrast, TH showed no obvious changing trends and the SFD values were scattered between 1.6 m and 2.6 m during the study period. Overall, the maximum SFD values varied from 1.5–2.9 m at the three studied sites, which have a similar range to that reported by Lu et al. [31] in northeastern China.
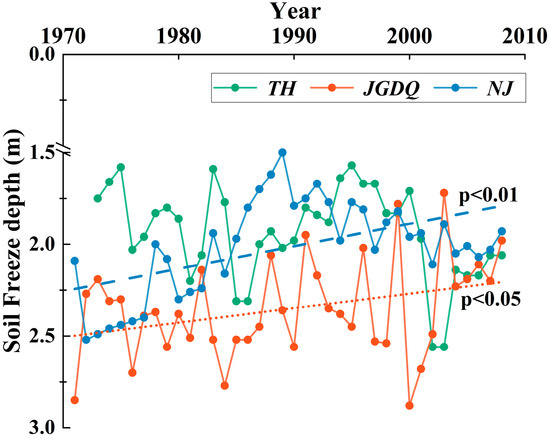
Figure 6.
Soil freeze depth (SFD) measured in boreholes at TH, JGDQ and NJ. The orange dashed line shows a linear trend when p < 0.01, and the blue dotted line shows the linear trend when p < 0.05.
4.4. Changes in Soil Thawing Days
Figure 7 shows the annual changes of BTD, BFD and soil thawing duration (i.e., days from BTD to BFD) in three watersheds from 1970s to 2009. For ease of illustration, all dates were counted as the sequence number of days, e.g., 1 January 1971 is day 1 of year 1971. In TH, both BTD and BFD showed notable shifts toward an earlier occurrence throughout the years, with the overall rates of 6 days/decade (p < 0.01) and 9 days/decade (p < 0.01), respectively, and the soil thawing duration had a significant declining trend (p < 0.05) with 3 days/decade. In JGDQ, the BTD showed no significant shifts, while the BFD tended to delay with a rate of 4 days/decade (p < 0.01); these together led to a longer duration of soil thawing at rate of 7 days/decade (p < 0.01). Unlike TH and JGDQ, NJ showed no significant change trends for BTD, BFD or soil thawing days.

Figure 7.
Beginning date of thawing (BTD) and beginning date of freezing (BFD) at the ground surface, and soil thawing duration (TD) for (a–c). The dashed lines show the linear trends when p < 0.01, and the dotted lines show the linear trends when p < 0.05.
4.5. Relationships between Frozen Ground and Other Variables
To identify the major driving factors of frozen ground degradation (characterized by decreased SFD), this study explored the correlations between the SFD with MAAT and total annual precipitation. In TH, the SFD showed no significant correlations with any of the driven factors. In JGDQ and NJ, the SFD showed negative correlations to MAAT with R value at −0.53 (p < 0.01) and −0.27 (p < 0.05), respectively. Among the studied sites, JGDQ and NJ exhibited noticeable decreasing trends of SFD, and the major driving force was identified to be MAAT. The correlations between precipitation and frozen soil change at three sites were found to be weak; meanwhile, in some other permafrost regions such as Yakutia, East Siberia [32] and the Qinghai-Tibet Plateau [33], precipitation was also a critical factor regulating the thermal regimes of the ground, apart from climatic warming. When permafrost degradation occurs, topsoil water infiltrates into deeper soil layers due to the thickening of the active layer of the permafrost. This transfer of water occurs because the thawed soil loses the ability to block the infiltration of water and becomes strongly hydraulically conductive. The extra water accumulating at the base of the active layer in summer will serve to warm the permafrost body during the subsequent freezing period, as freezing taking place at the thawing soils and the permafrost interface will release massive latent heat [34].
In addition to SFD, SFC and FIS are widely used indicators for evaluating the ground surface freezing potential, which were found to be positively correlated with the average snow depth at the three observation sites (Figure 8); the deeper the snow depth, the more likely the soil is to freeze. The presence of snow cover can affect the surface soil from two opposite aspects. On one hand, the snow can help insulate soil from being heated by solar radiation due to its high albedo and absorptivity to solar radiation; on the other hand, the low thermal conductivity of snow cover could largely block the internal heat emission from the soil and warm the soil temperature [35]. Zhou et al. [36] demonstrated that the former impact dominated when the snow cover was less than 20 cm in depth. This could better explain the change trends shown in Figure 8, as the snow depths were generally less than 20 cm at the studied sites. As the snow cover thickened (less than 20 cm), the soil became more insulated from the heating effect of solar radiation, making it more prone to freeze. It is noted that there are a lot of scatters in the graphs, as there may be other factors influencing the ground temperatures, such as the thickness of the active layer, the thermal properties of the underlying materials and any latent heat effects. In addition, there may be a certain degree of uncertainty in snow depth impacts, as the complex terrain and the penetration depth of microwave signal will affect the inversion accuracy of the snow depth [37]. Direct snow depth measurements are needed to further interpret its impacts on frozen ground status in the study region.
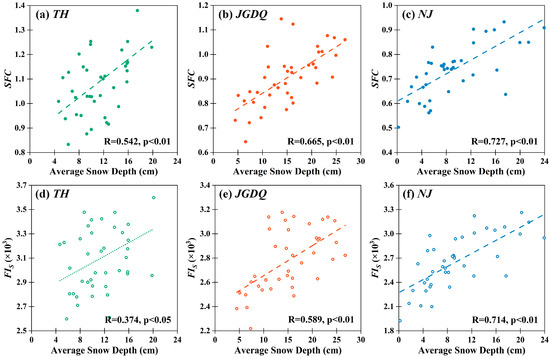
Figure 8.
(a–c) Relationships between the average snow depth and soil freezing capacity (SFC), and (d–f) between the average snow depth and soil freezing index (FIS) for TH, JGDQ, and NJ. The dashed lines show the linear trends when p < 0.01, and the dotted lines show the linear trends when p < 0.05.
Human-induced land use change may also affect the frozen ground status as it alters the hydrothermal conditions of the underlying surface. The land use conditions of three watersheds at which the observation sites were located are presented in Figure 9. There was a continuous increase in both construction and non-irrigated land in all watersheds, suggesting that human activities such as building construction and soil cultivation may have altered the thermal stability and water movement of the underlying soil, which further contributes to frozen ground shrinkage [38].
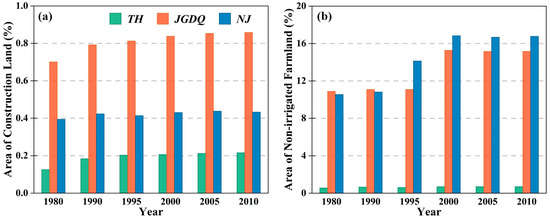
Figure 9.
Percentage change in the area of (a) construction land and (b) non-irrigated farmland for the three watersheds.
Frozen soil degradation can affect the soil’s hydraulic conductivity, soil water content and soil nutrients, which may further alter the local vegetation productivity and biomass. The NDVI changes from 2000 to 2017 for the three watersheds are shown in Figure 10. For all watersheds, the NDVI showed obvious increasing trends over the years (p < 0.01), which may be associated with changes in the SFD and subsurface soil temperature. Decreased SFD and increased soil temperature could mitigate low-temperature stress, promoting the rates of organic matter decomposition and the nutrient cycle [39,40]. Besides, the Naturel Forest Conservation Program (NFCP) and the Grain to Green Program (GTGP) have been carried out since 1998 and 1999 in China, and have contributed to enhancing the vegetation coverage and density through logging bans, afforestation initiatives, and converting cropland on steep slopes to forest and grassland [41].

Figure 10.
Annual average normalized difference vegetation index (NDVI) for the three watersheds at which observation sites are located.
Existing studies have proved that shallow thaw depths may boost soil moisture and increase vegetation greenness of aquatic plants or hygrophytes [42]. However, the persistent permafrost degradation and progressively deepening active layer will dry the surface soil and further reduce the number of aquatic plants and hygrophytes [43]. In Qinghai-Tibet Plateau, the continuous soil warming and active layer thickening have increased the evapotranspiration and soil water loss, which has resulted in a shift in vegetation types from alpine meadow to alpine desert steppes [44]. In Northeast China, the dominant species are larch forests, which prefer well-drained and moist soil conditions. To clarify the influencing mechanisms, further efforts need to strengthen the coupling analysis of the hydrological and ecological processes through physically based models.
5. Conclusions
This study revealed the changes in frozen ground from the 1970s to the 2000s at three high-latitude sites in Northeast China. The driving forces of the frozen ground change and their resultant impacts on vegetation status were analyzed.
Among the three studied sites, TH experienced an inconspicuous SFD change during the 40-year period, which corresponded to the slowest air warming trend at 0.24 °C/decade and an increased soil frozen duration at 3 days/decade. However, the annual maximum SFD decreased in JGDQ and NJ at a rate of 8 cm/decade and 13 cm/decade, respectively, in response to the rapid air warming (0.38 °C/decade in JGDQ and 0.40 °C/decade in NJ). During the thawing period, the soil temperature profiles at various depths tended to shift to a higher temperature range, especially for TH and NJ, which may lead to a shallower SFD and a thicker active layer.
Correlation analysis suggested that air warming was the main climate driving force of frozen ground shrinkage in Northeast China. Moreover, the annual snow depth showed positive correlations with the FIS and SFC, because the snow cover can help insulate the soil from solar radiation. In addition to the climate factors, the expansion of construction land and non-irrigated farmland may also contribute to frozen ground shrinkage. A growing NDVI was detected in all three watersheds, which may possibly be due to the increased infiltration and subsurface water storage. Overall, this study contributed to a better understanding of frozen ground change and its driving forces in the region of Northeast China, which provides a novel perspective regarding permafrost protection and ecological conservation in high-latitude regions.
Author Contributions
Methodology, M.F.; formal analysis, M.F. and Z.X.; resources, L.Y. and Y.G.; data curation, L.Y. and Y.G.; writing—original draft preparation, M.F.; writing—review and editing, Z.X., C.S. and Y.W.; funding acquisition, Z.X. and C.S. All authors have read and agreed to the published version of the manuscript.
Funding
This research was funded by the National Natural Science Foundation of China (Grant No. 52279007), and the Strategic Priority Research Program of the Chinese Academy of Sciences (Grant No. XDA28020502).
Institutional Review Board Statement
Not applicable.
Informed Consent Statement
Not applicable.
Data Availability Statement
The data that support the findings of this study are openly available at websites stated at Section 3.1. The soil data are available through the Heilongjiang Meteorological Bureau at link http://hl.cma.gov.cn/ (accessed on 1 September 2022).
Conflicts of Interest
The authors declare no conflict of interest.
Appendix A

Table A1.
The available years for each data category in each monitoring stations.
Table A1.
The available years for each data category in each monitoring stations.
| Date Category | TH | JGDQ | NJ | |
|---|---|---|---|---|
| Meteorological data (daily) | air temperature | 1972–2019 | 1971–2019 | 1971–2019 |
| precipitation | 1972–2019 | 1971–2019 | 1971–2019 | |
| snow depth | 1979–2019 | 1979–2019 | 1979–2019 | |
| ground surface temperature | 1972–2019 | 1971–2019 | 1971–2019 | |
| Soil data (yearly/daily) | subsurface soil temperature | 1972–2007 | 1971–2007 | 1971–2007 |
| soil freeze depth | 1971–2008 | 1971–2008 | 1971–2008 | |
| beginning date of freezing | 1974–1980 1989–1993 1995–2009 | 1972–1983 1989 1991–1994 1996–2009 | 1971–1983 1989–2009 | |
| Beginning date of thawing | 1973–1980 1982–1985 1987–1990 1992–2009 | 1971 1973–1978 1980–1982 1985–1994 1996–2009 | 1971–1974 1976–2009 | |
| Land use/cover | 1980, 1990, 1995, 2000, 2005, 2010 | |||
| Normalized difference vegetation index | 2000–2017 | |||
References
- Hugelius, G.; Strauss, J.; Zubrzycki, S.; Harden, J.W.; Schuur, E.A.G.; Ping, C.-L.; Schirrmeister, L.; Grosse, G.; Michaelson, G.J.; Koven, C.D.; et al. Estimated Stocks of Circumpolar Permafrost Carbon with Quantified Uncertainty Ranges and Identified Data Gaps. Biogeosciences 2014, 11, 6573–6593. [Google Scholar] [CrossRef]
- Liu, L.; Luo, D.; Wang, L.; Huang, Y.; Chen, F. Variability of Soil Freeze Depth in Association with Climate Change from 1901 to 2016 in the Upper Brahmaputra River Basin, Tibetan Plateau. Theor. Appl. Climatol. 2020, 142, 19–28. [Google Scholar] [CrossRef]
- Li, X.; Jin, H.; Sun, L.; Wang, H.; He, R.; Huang, Y.; Chang, X. Climate Warming over 1961–2019 and Impacts on Permafrost Zonation in Northeast China. J. For. Res. 2022, 33, 767–788. [Google Scholar] [CrossRef]
- Zhang, Z.-Q.; Wu, Q.-B.; Hou, M.-T.; Tai, B.-W.; An, Y.-K. Permafrost Change in Northeast China in the 1950s–2010s. Adv. Clim. Chang. Res. 2021, 12, 18–28. [Google Scholar] [CrossRef]
- Biskaborn, B.K.; Smith, S.L.; Noetzli, J.; Matthes, H.; Vieira, G.; Streletskiy, D.A.; Schoeneich, P.; Romanovsky, V.E.; Lewkowicz, A.G.; Abramov, A.; et al. Permafrost Is Warming at a Global Scale. Nat. Commun. 2019, 10, 264. [Google Scholar] [CrossRef]
- Romanovsky, V.E.; Smith, S.L.; Christiansen, H.H. Permafrost Thermal State in the Polar Northern Hemisphere during the International Polar Year 2007–2009: A Synthesis. Permafrost Periglac. Process. 2010, 21, 106–116. [Google Scholar] [CrossRef]
- Jan, A.; Painter, S.L. Permafrost Thermal Conditions Are Sensitive to Shifts in Snow Timing. Environ. Res. Lett. 2020, 15, 084026. [Google Scholar] [CrossRef]
- Liu, Z.; Chen, B.; Wang, S.; Wang, Q.; Chen, J.; Shi, W.; Wang, X.; Liu, Y.; Tu, Y.; Huang, M.; et al. The Impacts of Vegetation on the Soil Surface Freezing-Thawing Processes at Permafrost Southern Edge Simulated by an Improved Process-Based Ecosystem Model. Ecol. Model. 2021, 456, 109663. [Google Scholar] [CrossRef]
- Chen, D.L.; Xu, B.Q.; Yao, T.D.; Guo, Z.T.; Cui, P.; Chen, F.H.; Zhang, R.H.; Zhang, X.Z.; Zhang, Y.L.; Fan, J.; et al. Assessment of Past, Present and Future Environmental Changes on the Tibetan Plateau. Chin. Sci. Bull. 2015, 32, 3025–3035. [Google Scholar] [CrossRef]
- Bibi, S.; Wang, L.; Li, X.; Zhou, J.; Chen, D.; Yao, T. Climatic and Associated Cryospheric, Biospheric, and Hydrological Changes on the Tibetan Plateau: A Review: Review on Climate Change and Its Effects on Spheres on Tibetan Plateau. Int. J. Climatol. 2018, 38, e1–e17. [Google Scholar] [CrossRef]
- Jin, H.; Yu, Q.; Wang, S.; Lü, L. Changes in Permafrost Environments along the Qinghai–Tibet Engineering Corridor Induced by Anthropogenic Activities and Climate Warming. Cold Reg. Sci. Technol. 2008, 53, 317–333. [Google Scholar] [CrossRef]
- Ma, Q.; Jin, H.-J.; Bense, V.F.; Luo, D.-L.; Marchenko, S.S.; Harris, S.A.; Lan, Y.-C. Impacts of Degrading Permafrost on Streamflow in the Source Area of Yellow River on the Qinghai-Tibet Plateau, China. Adv. Clim. Chang. Res. 2019, 10, 225–239. [Google Scholar] [CrossRef]
- Walvoord, M.A.; Kurylyk, B.L. Hydrologic Impacts of Thawing Permafrost—A Review. Vadose Zone J. 2016, 15, 01–20. [Google Scholar] [CrossRef]
- Evans, S.G.; Yokeley, B.; Stephens, C.; Brewer, B. Potential Mechanistic Causes of Increased Baseflow across Northern Eurasia Catchments Underlain by Permafrost. Hydrol. Process. 2020, 34, 2676–2690. [Google Scholar] [CrossRef]
- Ye, B.; Yang, D.; Zhang, Z.; Kane, D.L. Variation of Hydrological Regime with Permafrost Coverage over Lena Basin in Siberia. J. Geophys. Res. 2009, 114, D07102. [Google Scholar] [CrossRef]
- Jin, X.-Y.; Jin, H.-J.; Iwahana, G.; Marchenko, S.S.; Luo, D.-L.; Li, X.-Y.; Liang, S.-H. Impacts of Climate-Induced Permafrost Degradation on Vegetation: A Review. Adv. Clim. Chang. Res. 2021, 12, 29–47. [Google Scholar] [CrossRef]
- Pastick, N.J.; Jorgenson, M.T.; Goetz, S.J.; Jones, B.M.; Wylie, B.K.; Minsley, B.J.; Genet, H.; Knight, J.F.; Swanson, D.K.; Jorgenson, J.C. Spatiotemporal Remote Sensing of Ecosystem Change and Causation across Alaska. Glob. Chang. Biol. 2019, 25, 1171–1189. [Google Scholar] [CrossRef]
- Wang, R.; Dong, Z.; Zhou, Z. Effect of Decreasing Soil Frozen Depth on Vegetation Growth in the Source Region of the Yellow River for 1982–2015. Theor. Appl. Climatol. 2020, 140, 1185–1197. [Google Scholar] [CrossRef]
- The Intergovernmental Panel on Climate Change (IPCC). Climate Change 2021: The Physical Science Basis. Contribution of Working Group I to the Sixth Assessment Report of the Intergovernmental Panel on Climate Change; Cambridge University Press: Cambridge, UK; New York, NY, USA, 2021; p. 15. [Google Scholar]
- He, R.-X.; Jin, H.-J.; Luo, D.-L.; Li, X.-Y.; Zhou, C.-F.; Jia, N.; Jin, X.-Y.; Li, X.-Y.; Che, T.; Yang, X.; et al. Permafrost Changes in the Nanwenghe Wetlands Reserve on the Southern Slope of the Da Xing’anling–Yile’huli Mountains, Northeast China. Adv. Clim. Chang. Res. 2021, 12, 696–709. [Google Scholar] [CrossRef]
- Hjort, J.; Karjalainen, O.; Aalto, J.; Westermann, S.; Romanovsky, V.E.; Nelson, F.E.; Etzelmüller, B.; Luoto, M. Degrading Permafrost Puts Arctic Infrastructure at Risk by Mid-Century. Nat. Commun. 2018, 9, 5147. [Google Scholar] [CrossRef]
- Zhang, Z.; Li, M.; Wang, J.; Yin, Z.; Yang, Y.; Xun, X.; Wu, Q. A Calculation Model for the Spatial Distribution and Reserves of Ground Ice—A Case Study of the Northeast China Permafrost Area. Eng. Geol. 2023, 315, 107022. [Google Scholar] [CrossRef]
- French, H.; Shur, Y. The Principles of Cryostratigraphy. Earth-Sci. Rev. 2010, 101, 190–206. [Google Scholar] [CrossRef]
- Zhou, Y.W.; Guo, D.X.; Qiu, G.Q.; Cheng, G.D.; Li, S.D. Geocryology in China; Science Press: Beijing, China, 2000; pp. 173–178. (In Chinese) [Google Scholar]
- GB/T 35234-2017; General Administration of Quality Supervision; Inspection and Quarantine of the People’s Republic of China. Specifications for Surface Meteorological Observation-Frozen Soil. Available online: https://www.cma.gov.cn (accessed on 1 September 2022).
- Anaya, J.A.; Chuvieco, E.; Palacios-Orueta, A. Aboveground Biomass Assessment in Colombia: A Remote Sensing Approach. For. Ecol. Manag. 2009, 257, 1237–1246. [Google Scholar] [CrossRef]
- Ferreira, A.; Vieira, G.; Ramos, M.; Nieuwendam, A. Ground Temperature and Permafrost Distribution in Hurd Peninsula (Livingston Island, Maritime Antarctic): An Assessment Using Freezing Indexes and TTOP Modelling. CATENA 2017, 149, 560–571. [Google Scholar] [CrossRef]
- Frauenfeld, O.W.; Zhang, T.; Mccreight, J.L. Northern Hemisphere Freezing/Thawing Index Variations over the Twentieth Century. Int. J. Climatol. 2007, 27, 47–63. [Google Scholar] [CrossRef]
- Nelson, F.E.; Outcalt, S.I. A Computational Method for Prediction and Regionalization of Permafrost. Arct. Alp. Res. 1987, 19, 279. [Google Scholar] [CrossRef]
- Wu, T.; Zhao, L.; Li, R.; Wang, Q.; Xie, C.; Pang, Q. Recent Ground Surface Warming and Its Effects on Permafrost on the Central Qinghai-Tibet Plateau: Recent Ground Surface Warming and Its Effects on Permafrost. Int. J. Climatol. 2013, 33, 920–930. [Google Scholar] [CrossRef]
- Lu, Y.H.; Ye, B.S.; Li, C. Degradation of frozen ground in Hailaer River Basin and its impact on hydrologic processes. Adv. Water Sci. 2013, 24, 319–325. [Google Scholar] [CrossRef]
- Czerniawska, J.; Chlachula, J. Climate-Change Induced Permafrost Degradation in Yakutia, East Siberia. Arctic 2020, 73, 509–528. [Google Scholar] [CrossRef]
- Luo, S.; Fang, X.; Lyu, S.; Ma, D.; Chang, Y.; Song, M.; Chen, H. Frozen Ground Temperature Trends Associated with Climate Change in the Tibetan Plateau Three River Source Region from 1980 to 2014. Clim. Res. 2016, 67, 241–255. [Google Scholar] [CrossRef]
- Zhang, G.; Nan, Z.; Zhao, L.; Liang, Y.; Cheng, G. Qinghai-Tibet Plateau Wetting Reduces Permafrost Thermal Responses to Climate Warming. Earth Planet. Sci. Lett. 2021, 562, 116858. [Google Scholar] [CrossRef]
- Zhang, T. Influence of the Seasonal Snow Cover on the Ground Thermal Regime: An Overview: Snow Cover and Ground Thermal RegimE. Rev. Geophys. 2005, 43, RG4002. [Google Scholar] [CrossRef]
- Zhou, J.; Kinzelbach, W.; Cheng, G.; Zhang, W.; He, X.; Ye, B. Monitoring and Modeling the Influence of Snow Pack and Organic Soil on a Permafrost Active Layer, Qinghai–Tibetan Plateau of China. Cold Reg. Sci. Technol. 2013, 90–91, 38–52. [Google Scholar] [CrossRef]
- Xiao, X.X.; Zhang, T.J. Passive Microwave Remote Sensing of Snow Depth and Snow Water Equivalent: Overview. Adv. Earth Sci. 2018, 33, 590–605. [Google Scholar] [CrossRef]
- Streletskiy, D.A.; Shiklomanov, N.I.; Nelson, F.E. Permafrost, Infrastructure, and Climate Change: A GIS-Based Landscape Approach to Geotechnical Modeling. Arct. Antarct. Alp. Res. 2012, 44, 368–380. [Google Scholar] [CrossRef]
- Aerts, R.; Cornelissen, J.H.C.; Dorrepaal, E. Plant Performance in a Warmer World: General Responses of Plants from Cold, Northern Biomes and the Importance of Winter and Spring Events. Plant Ecol. 2006, 182, 65–77. [Google Scholar] [CrossRef]
- Natali, S.M.; Schuur, E.A.G.; Rubin, R.L. Increased Plant Productivity in Alaskan Tundra as a Result of Experimental Warming of Soil and Permafrost: Increased Plant Productivity in Alaskan Tundra. J. Ecol. 2012, 100, 488–498. [Google Scholar] [CrossRef]
- Liu, J.; Li, S.; Ouyang, Z.; Tam, C.; Chen, X. Ecological and Socioeconomic Effects of China’s Policies for Ecosystem Services. Proc. Natl. Acad. Sci. USA 2008, 105, 9477–9482. [Google Scholar] [CrossRef]
- Jorgenson, M.T.; Racine, C.H.; Walters, J.C.; Osterkamp, T.E. Permafrost degradation and ecological changes associated with a warming climate in central Alaska. Clim. Chang. 2001, 48, 551–579. [Google Scholar] [CrossRef]
- Tang, L.; Dong, S.; Sherman, R.; Liu, S.; Liu, Q.; Wang, X.; Su, X.; Zhang, Y.; Li, Y.; Wu, Y.; et al. Changes in Vegetation Composition and Plant Diversity with Rangeland Degradation in the Alpine Region of Qinghai-Tibet Plateau. Rangel. J. 2015, 37, 107. [Google Scholar] [CrossRef]
- Yang, Z.; Gao, J.; Zhao, L.; Xu, X.; Ouyang, H. Linking Thaw Depth with Soil Moisture and Plant Community Composition: Effects of Permafrost Degradation on Alpine Ecosystems on the Qinghai-Tibet Plateau. Plant Soil 2013, 367, 687–700. [Google Scholar] [CrossRef]
Disclaimer/Publisher’s Note: The statements, opinions and data contained in all publications are solely those of the individual author(s) and contributor(s) and not of MDPI and/or the editor(s). MDPI and/or the editor(s) disclaim responsibility for any injury to people or property resulting from any ideas, methods, instructions or products referred to in the content. |
© 2023 by the authors. Licensee MDPI, Basel, Switzerland. This article is an open access article distributed under the terms and conditions of the Creative Commons Attribution (CC BY) license (https://creativecommons.org/licenses/by/4.0/).