Abstract
The middle class has become an important force in enhancing social cohesion and alleviating the polarisation between the rich and the poor. However, the extent of vulnerability in the middle class is not yet known, especially in developing countries, where a large proportion of middle-income households are still vulnerable and severely vulnerable. This study provides important insights into the middle class and the extent of their vulnerability in developing countries. Specifically, this study utilizes the Vulnerability as Expected Poverty (VEP) methodology to measure the vulnerability of middle-income class in China and analyses the relative importance of different determinants based on data from the China Family Tracking Survey (CFPS) in 2018. The main finding is that in China, only 34.5% of the population belongs to the middle-income class, with 62.3% of the middle-income population still exhibiting vulnerability. Notably, at the top of the pyramid within middle-income class, nearly half of the population is at risk for slipping into the low-income class in the future (44.3%). In addition, rural areas are particularly vulnerable (70.5%). We also found that education and household properties are decisive factors in reducing the vulnerability of the middle-income class, especially the latter, which remains a key impact on reducing household vulnerability. In addition, we further estimate heterogeneity in terms of income and household size, and the results remain robust, with a greater mitigating effect of education and household properties as household income and size increase.
1. Introduction
In recent decades, China has achieved remarkable success in reducing poverty and inequality, transitioning to a middle-income country. This progress is largely attributed to rapid economic development since 2000 and a surge in people’s incomes. This has resulted in a six-fold increase in the size of the middle-income class in just 15 years (Li, 2021) [1], with a growing number of affluent citizens. Despite these positive trends, there are still a large number of vulnerable classes in China, particularly those middle-income households just above the middle-income threshold, with approximately three-quarters of them still at the bottom of the middle-income pyramid and at risk of vulnerability (Li 2021; Lu and Fan 2021) [1,2].
The middle-income class has become increasingly recognized for its impact on society, politics, and economy in the region, contributing to regional economic growth through investment in education, consumption, and savings, while also helping to promote social cohesion and alleviate the polarization between the rich and the poor (Easterly 2001; Banerjee and Duflo 2008; Birdsall 2010) [3,4,5]. López-Calva and Ortiz-Juarez (2014) [6] found that although the middle class has grown significantly in Chile, Mexico, and Peru, a large portion of it is still at risk of falling back into poverty. Similarly, Stampini et al. (2016) [7] found that economic vulnerability is still prevalent in Latin America, even among the middle-income class, with 65% of the disadvantaged and 14% of the middle-income class experiencing poverty at least once in the next 10 years. These findings suggest that the vulnerability of middle-income class is a growing concern worldwide and should be further supported to ensure sustainable development in the region.
Indeed, in the absence of information on household income dynamics, they tend to expect that the low-income class is at risk of falling into vulnerability, while the middle-income class is safe and no longer needs social measures. However, the middle-income group is increasingly facing difficulty in maintaining a middle-class existence due to the rising cost of living, stagnant wages, and limited financial security in China. More importantly, unlike the poor, this lack of access to resources and social security further increases the vulnerability of middle-income groups. In other words, the poor of the future, including the vulnerable, include even those who initially belong to the middle-income and high-income classes. Additionally, it is important to consider the resilience of the middle-income group to risk and the potential for a “low-income–middle-income” cycle to be created due to exogenous shocks and force majeure. Thus, further research is needed to understand the vulnerability of middle class and the potential implications for social stability in China.
This study will explore the causes and characteristics of vulnerability of middle-income class in China and discuss potential solutions to this growing problem. It contributes in three aspects: first, we use VEP (Vulnerability as Expected Poverty) as an approach of estimating vulnerability to accurately identify groups at middle-income who are vulnerable to shocks and economically insecure, and measure the probability of middle-income class falling in income or even falling into poverty in the future; second, we use various criteria to measure the size of China’s middle-income class, and systematically analyse the urban–rural, regional, and income distribution characteristics of the vulnerable middle-income class. Third, considering the individual, household, and regional dimensions, this study further reveals the internal causes of middle-income groups’ vulnerability, income decline, and even poverty.
The rest of this paper is organized as follows. Section 2 presents a literature review; Section 3 discusses the model setting and descriptive statistics; Section 4 compares the proportion and vulnerability of middle-income class results by using different middle-income thresholds and VEP approaches; the empirical results and discussion are described in Section 5; finally, Section 6 details conclusions and implications.
2. Literature Review
2.1. Overview of Middle-Income Class
The middle-income class has become the key to China’s economic growth, expanding consumption, stabilizing society, and promoting economic and social transformation. Since the 16th National Congress of the CPC first mentioned the middle-income class in 2002, the concept has been a recurring theme in successive national congresses and government work reports. The 13th Conference of Leading Group for Financial and Economic Affairs, which was held in 2016, highlighted the importance of expanding the middle-income class through income distribution and the expansion of domestic demand. This was further reinforced in the 14th Five-Year Plan in March 2021, which stated that by 2035, the per capita GDP will reach the level of a moderately developed country, and the middle-income group will expand significantly. These documents demonstrate the importance of expanding middle-income class for social development.
Current research on the middle-income class focuses on the definition and criteria of the middle class, as well as its economic and social characteristics (i.e., income levels, educational attainment, employment opportunities, and health) (Atkinson and Brandolini 2011; Tsang 2014; Rocca 2017; Schettino et al. 2021) [8,9,10,11]. Generally, the concept and connotation of the middle class is divided into sociological and economic dimensions, and encompassing income levels, consumption patterns, occupational status, and self-identity (Wright 1979; López-Calva and Ortiz-Juarez 2014; Belbag et al., 2019; Clément et al., 2022) [6,12,13,14]. In addition, the impact of government taxation, social security, and other welfare policies on the middle class was also considered. However, the dilemmas and threats to the growth process of middle-income groups remain largely unexplored, especially in the absence of adequate discussion at the micro level, which is essential to understanding how developing countries can successfully overcome the “middle-income trap”.
2.2. Vulnerability of Middle-Income Class
Vulnerability, originally derived from the Latin words “vulnerable” and “vulvabilis”, is a concept that has been widely used to describe the susceptibility of a certain population to losses caused by natural or man-made disasters, and has economic, political, physical, and social dimensions (Issa et al., 2014) [15]. It is closely related to “risk” and “hazard” and has been studied in various fields, such as ecology, engineering, economics, sociology, climate change, and food security (Moser, 1998; Lampis, 2009; Notenbaert et al. 2013; Wroński,2021; Biswas and Nautiyal, 2021) [16,17,18,19,20]. In general, system vulnerability can be divided into two aspects: external vulnerability and internal vulnerability. The former refers to the exposure of individuals or groups to risks and shocks, while the latter includes the ability of individuals or groups to cope with risks and the potential to recover from shocks (Watts and Bohle 1993) [21]. In the case of vulnerable groups, a vulnerability assessment should be conducted to address the “risk element” and minimize the damage caused by disasters.
Income class is strongly associated with vulnerability. Goldthorpe and McKnight (2004) [22] pointed out that the class positions of an individual or household affect their risk and opportunities. López-Calva and Ortiz-Juarez (2014) [6] argued that class is a central element of economic vulnerability. A large number of studies have focused on the vulnerability of the low-income class or poor people, particularly poverty vulnerability (Naudé et al. 2009; Klasen et al. 2015) [23,24]. In this context, vulnerability is defined as the degree of risk to which an individual or household is exposed due to a decline in wealth or living standards (Cao et al., 2016) [25], and is therefore also seen as the ability of an individual or household to cope with risks and shocks (Poh and Sabri) [26]. In this sense, quantifying the vulnerability arising from potential poverty risks has become a major research focus (Klasen et al., 2015; Povel 2015; Gang et al., 2017) [24,27,28]. However, it is important to note that the measurement of poverty levels remains a key prerequisite for assessing vulnerability (Aiyemo, 2020) [29].
The vulnerability of the middle-income class is a growing concern in today’s world with the increase in middle-income countries. Recent empirical evidence from Latin America and North America has conclusively demonstrated that there are also large numbers of vulnerable people within the middle-income class, who are particularly vulnerable to economic insecurity, inadequate social safety nets, lack of access to resources, and even poverty (López-Calva and Ortiz-Juarez 2014; Stampini et al., 2016; Bilan et al., 2020; Rougier et al., 2021) [6,7,30,31]. Indeed, middle-income countries are vulnerable to a range of economic, social, and environmental risks, such as natural disasters, economic downturns, political instability, and inequality shocks, which are highly likely to have serious consequences for people’s well-being and the world economic landscape. From this perspective, the vulnerability of the middle-income class should rightly be a core component of government public services, especially in middle-income countries, yet the middle-income class has been neglected due to their “worse off than some, better off than many” status.
3. Data and Methodology
3.1. A Vulnerability Approach to Middle-Income Class
3.1.1. Measurement of Middle-Income Class
Generally speaking, the middle class is measured for a stratum of the income distribution. Contrary relative approach, an absolute approach thus becomes more advantageous due to the varying income distributions across countries and the ability to track population size up to a certain threshold. As such, the selection of an appropriate absolute standard is essential for successful implementation. To this end, scholars have conducted extensive research to identify the criteria that are most suitable for this purpose.
Bussolo et al. (2010) [32] defined the middle class as individuals with a per capita income of USD 10–20 a day. Chen and Ravallion (2010) [33] have defined the middle class as having a per capita income of USD 10–100 per day in purchasing power parity (2010 USD), while Milanovic and Yitzhaki (2002) [34] have used a per capita income range of USD 12–50 per day. Some scholars have also chosen criteria from the perspective of developing countries, Banerjee & Duflo (2008) [4] proposed to define a population with per capita expenditure between USD 2 and USD 10 per day as middle class, while Ravallion (2010) [35] suggested a range of USD 2–13 per capita expenditure per day by referring to poverty lines in 70 developing countries and the US. Chen & Qin (2014) [36] raised this threshold, and Kharas and Gertz (2010) [37] identified a range of USD 10-100 per capita per day by investigating the distribution of national accounts.
As mentioned above, as with the measurement of poverty vulnerability, the location of the middle-income threshold is crucial for assessing vulnerability. In turn, the threshold of the middle-income class is equally crucial in determining the proportion of the middle class. As there is no consensus among academics and international institutions on the definition of the middle class, this study selects the most widely used current measures to accurately measure the proportion of China’s middle-income class.
3.1.2. Methodology for Vulnerability as Expected Poverty (VEP)
Based on the research of Suryahadi et al. (2003) [38], Christiaensen and Subbarao (2005) [39], and Bourguignon et al., (2006) [40], the vulnerability level of household i in province j at time t is defined by:
where is the per capita income (or consumption) of household i in province j at time t + 1, and Z is the per capita income (or expenditure) requirement defined as the middle-income threshold.
Given limited data, we make the standard assumption that income (consumption) is log-normally distributed, as in Chaudhuri et al. (2002) [41]. The three-step Feasible Generalized Least Squares (FGLS) technique is employed to obtain the expected log income and its variance. In addition to the inclusion of individual and household characteristic variables, the estimation process also considered regional effects. It can be divided into three steps.
We start our estimation of vulnerability to middle-income group with a reduced-form of the income (or consumption) function and estimate the expected income for the next period using the residual square as the income (or consumption) fluctuation:
where is the logarithm of current income (or consumption) of the middle-income household, and represents a bundle of observed household characteristics, such as the number of household members, years of education, age, and labor force proportion. is a fixed effect of province j.
Secondly, the fitted values obtained in the first step are used to determine the weights for FGLS estimation, and the expected fluctuation of the income of the middle-income group in the next period is obtained:
Finally, assuming that the income logarithms follow a normal distribution, the middle-income vulnerability line is determined, and the vulnerability level of the middle-income group is calculated. In this paper, we follow Chaudhuri et al. (2002) [41] and use a vulnerability threshold of 0.5, indicating that a household whose vulnerability level exceeds 50% is more likely be considered to be vulnerable.
Once these estimates are obtained, it is possible to estimate the probability of households with characteristics being poor in the future. In other words, we can estimate a household’s vulnerability level as follows:
where is the cumulative log-normal distribution function, and Z represents the actual middle-income threshold. In terms of the reference line, Dutta et al. (2011) [42] argue that it reflects the minimum living standard than the poverty line. Then, vulnerability is defined as the shortfall from the reference line. Thus, we replace the poverty line Z in the Equation (5) with the middle-income threshold (per capita income of USD 10 a day).
3.2. Empirical Model
3.2.1. Model Setting
The vast majority of studies have tended to focus on objective measurements and factors in their analysis of household vulnerability. Such literature interprets household vulnerability in terms of objective household characteristics, for example, education, employment status, number of dependents, age, and property. (Dercon 2005; Naudé et al. 2009; Jha et al. 2010; Faulkner et al. 2019; Ali et al. 2020; Sun et al.2020; Nchor, 2023) [23,43,44,45,46,47,48]. Based on the above literature, we used the vulnerability of middle-income households as the dependent variable to analyse the determinants of middle-income household vulnerability at three levels: demographic, household, and regional. The model settings are as follows:
where denotes the vulnerability of middle-income household i in province j at time t; represents a bundle of variables related to household vulnerability, such as human capital, physical capital, social capital, security, and regional characteristics.
3.2.2. Variable Definitions
Table 1 summarises the main variables in this study.

Table 1.
Definition and statistical analysis of each variable.
Dependent variable: We followed Chaudhuri (2003) [49], Chaudhuri et al. (2002) [41], and Jha et al. (2010) [44] to calculate the vulnerability of middle-income households as the dependent variable in the model, using the approach of vulnerability as expected poverty (VEP). The calculation process is described in Section 3.1.2.
Independent variable: (1) Human capital. Education attainment and employment status are important factors affecting the income level of the labour force (Dercon, 2005; Ali et al., 2020) [43,46]. In this paper, years of education is selected as a variable to measure educational attainment (Edu). The proportion of labour force (Labour) and employment in government agencies (Employer) are used as variables reflecting employer nature. In addition, the model also incorporates demographic factors such as the number of household members (Size), the average age of labour force (Age), marital status of the head of household (Mar), and household registration (Regist).
(2) Physical capital: In this paper, the value of durable goods (Dur), savings (Sav), and the status of cars (Car) and houses (House) of the household are selected to reflect the level of physical capital.
(3) Social capital: As a reflection of the household’s social network, social capital also helps households to cope with risk. Considering the availability of data, we select social donations (Dona) and loans (Loan) received by households. (4) Social security. Social security is an important safeguard for households to resist risks and shocks, especially when facing risks such as major diseases and unemployment. We indicate the level of social security for households based on their participation in health insurance (Med) and job security pension (Security). (5) Regional types. In order to account for regional heterogeneity, we also include the provincial GDP and region type of the middle-income household. Generally speaking, regions with a higher level of economic development have access to better public services, which can help to reduce household vulnerability.
3.3. Data
The China Family Tracking Survey (CFPS) database is utilized in the paper to measure the vulnerability of middle-income households. CFPS is a nationally representative household survey conducted by the Institute of Social Science Survey of the Peking University. It tracks and surveys multi-dimensional data on individuals, households, and social relationships, facilitating cross-time and continuous individual-level observations. The database covers a two-year period, and the currently available data are for 2012, 2014, 2016, and 2018. However, data for 2020 are not yet available for the time being. Although panel data are more suitable for estimating household vulnerability due to essential information on the same households over time, detailed panel data are difficult to obtain in China. Therefore, cross-sectional data provided by the 2018 CFPS will be used in this study to evaluate the vulnerability of the middle-income class.
The CFPS database contains individual- and household-level information, including marital status, age, years of education, employment status, medical insurance, and job security for all household members, as well as economic information such as the value of durable goods, savings, car and house properties, and the status of social donations loans in the household-level. Regional-level variables are derived from the National Bureau of Statistics (provincial GDP).
To serve the research theme of the article, the household and individual databases of the CFPS were merged, retaining information on household-level variables such as income, housing, wealth, and social relationships, as well as individual-level information such as age, educational attainment, employment status, medical insurance and job security of individual household members, and marital status of the head of household. A 6-digit unique code at the household level and a 9-digit unique code at the individual level were used to precisely match household- and individual-level variables. Area-level variables were matched one-to-one based on the province at the household level. The final sample consisted of 9719 households after excluding households with missing information on some key variables.
4. Static Analysis: The Vulnerability of Middle-Income Class
4.1. Results for the Size of Middle-Income Class
In China, a “pyramid structure” of income distribution is observed, in terms of average level, with the middle-income class accounting for 34.5%, the low-income class for 58.3%, and the high-income class for 7.2%. Our research has revealed that both upward and downward adjustments to the standard of per capita income or per capita expenditure can significantly affect the share of the middle-income class. Considered from the perspective of a developing country, it is clear that per capita daily expenditure criteria of USD 2–10 and USD 2–13 yields a higher proportion of middle-income class than other expenditure criteria and the per capita daily income criteria (see Table 2). This suggests a large disparity in the current income distribution and consumption expenditure structure in China, with the population with lower levels of income and expenditure still accounting for the majority. The purpose of the study in this paper requires us to set a lower bound that is not too low and not too high, as this will result in capturing individuals classified as ‘poor’ as well as excluding vulnerable groups within the middle class. Combining the results in Table 2, we define the middle class in this paper on the basis of a per capita income of USD 10–50 per day.
Table 2.
The results for low, middle, and high-income classes of each measurement method.
The regional disparities in the proportion of middle-income class are significant. To understand the different trends in the vulnerability of the urban and rural middle-income population is crucial due to the existence of the urban–rural dichotomy. In this context, cities and countryside remain two worlds apart (see Figure 1). Specifically, in rural areas, the reduction in poverty is often accompanied by an expansion of vulnerable groups, with only 24.6% of the population distributed to the middle-income class. In contrast, the middle-income class in urban areas is approximately three times higher than that of rural areas. The same situation is also true in the eastern and western regions, where the population in the western region is dominated by low-income class, with only 16.9% of the middle-income population. Although more than half of the middle-income population belongs to the eastern region, the majority are in the lower middle-income class and only very few enter into the upper middle-income class. Further, it is noteworthy that in super big cities, with high house prices, cost of living, and educational resources, it is difficult for the lower-income population within the middle-income class to maintain a so-called middle-class life. In this sense, much of the middle-income population may not be considered truly middle class.
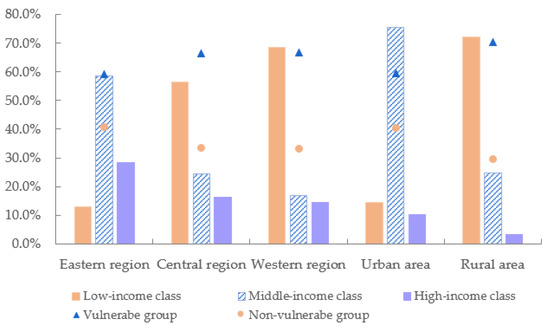
Figure 1.
Regional and rural–urban disparities in each income class and vulnerable groups.
4.2. Results for the Extent of Vulnerability in Middle-Income Class
We estimate the extent of vulnerability of middle-income class in China using the Vulnerability as Expected Poverty (VEP) methodology. Surprisingly, half of the middle-income population (62.3%) also exhibited vulnerability in 2018, and the size of vulnerable group remains large (Figure 2). This indicates that a large proportion of the middle-income population is still at risk of falling back into low income, suggesting that long-term interventions are not only needed to prevent the low-income class from falling into poverty, but also to protect the middle-income class from economic insecurity.
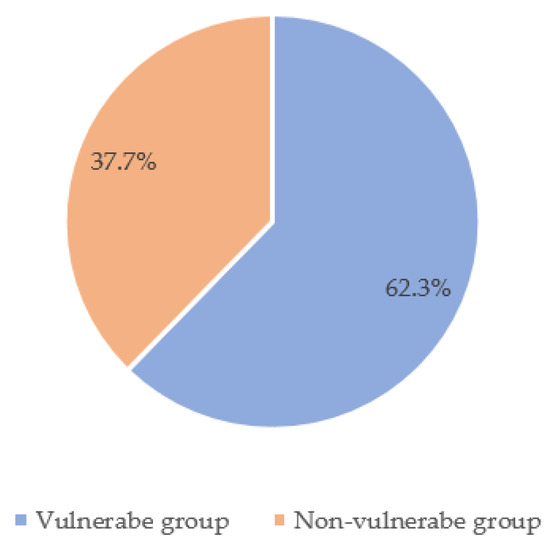
Figure 2.
The proportion of vulnerable and non-vulnerable groups.
As is shown in Figure 1, in terms of regional dynamics, the vulnerable group within the middle-income class are the majority, both in the eastern, central, and western regions, as well as in urban and rural areas. Rural areas are particularly vulnerable. Although there are a few differences between these regions, most patterns are common and similarities are striking. For instance, while the share of the middle-income class is relatively low in rural areas, it has a higher share of the vulnerable group (24.6% vs. 70.5%) and more than two-thirds of the middle-income population remains exposed to risk. This pattern is also seen in the central and western regions, where the ratio of the share of the middle-income population to the share of the vulnerable group is 24.4% vs. 66.6% and 16.9% vs. 66.9%, respectively. This highlights the need for sustainable solutions to address the vulnerability of the middle-income class in these regions.
In order to further investigate the distribution of vulnerable middle-income class, the middle-income class was divided into four income brackets by selecting 0.25, 0.50, and 0.75 of income, respectively. The results are shown in Figure 3. It is evident that the number and share of vulnerable households within the middle-income class decreases as income quantile value is adjusted upwards. However, it is worth noting that the income bracket with quantiles between 0.75 and 1.00, close to half of the population within the middle-income class, is still at risk of falling into the low-income class in the future. In other words, a higher income bracket does not necessarily guarantee the stability of the middle-income class. Even at the upper middle-income bracket, 44.3% of the population could be vulnerable in the future, and this group cannot be considered truly middle class. Thus, it is essential to consider the implications of income distribution and income inequality when discussing the vulnerability of the middle-income class.
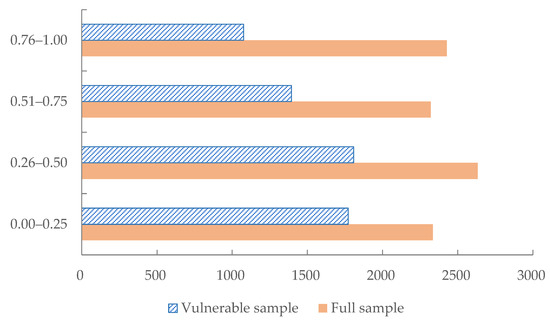
Figure 3.
Results of middle-income class and vulnerable samples for four income brackets.
5. Empirical Results
5.1. Determinants of Vulnerability in Middle-Income Class
We have analysed the relative importance of different determinants of the vulnerability in the middle-income class through the Probit method. We consider demographic-related statistical variables as explanatory variables under column (1) in Table 3. In column (2), we add indicators related to household labour force (i.e., educational attainment, labour force, and employer nature). Subsequently, in the third and fourth models, we further include physical capital (i.e., savings, car and house property, etc.) and social capital (social donations and loans) of households, and the results are presented in columns (3) and (4) (Table 3). To control for provincial effects, under column (5) in Table 3 we also include the provincial variable (GDP), medical insurance and job security participation, and region types.
Table 3.
Results of determinants of vulnerability in middle-income class.
In terms of human capital, the estimated coefficients for household size and average age of labour force are highly significant at 1% level in columns (1)–(5) of Table 3. The results indicate that household size and average age of the labour force are significantly associated with an increase in the proportion of vulnerable middle-income households. The household size variable, in particular, is the main factor that contributes to the worsening of household vulnerability. In fact, mobilising members of the household as workforce increases social and, particularly, gender-related vulnerability due to young women who leave school and enter the informal labour market in search of additional income opportunities. That is why the estimated coefficient for labour is not significant. Most of the estimated coefficient of educational attainment and household registration in columns (2)–(5) in Table 3 are significant at 1%, level with the negative sign which shows the existence of a negative relationship between education, household registration, and middle-income household vulnerability. Additionally, in absolute terms, the estimated coefficient on employment in the government agencies more than doubles as explanatory variables increase, suggesting that stable employment and income have a strong influence on reducing the vulnerability of middle-income households. These findings suggest that households and governments should use measures to increase education levels and urbanization as policy instruments to stabilize household income status.
In terms of physical and social capital, the results show that all estimated coefficients for durable goods, savings, car and house property in columns (3)–(5) (Table 3) are negative and significant at the 1% level, indicating a negative correlation between physical capital and household vulnerability. This suggests that households with greater resource endowments are more resilient to risks and shocks. However, when social capital is included, the estimated coefficients for social donations and loans are not significant. Receiving social donations appears to increase the vulnerability of middle-income households, while social loans are associated with reduced vulnerability. It is important to note, however, that there is a possibility of reverse causality in this finding: households with abundant material resources may not need to receive social donations, and those with sufficient resources may be more likely to receive loans due to their creditworthiness.
In terms of regional characteristics, the estimated coefficient of provincial GDP is significantly negative at the level of 1%, indicating that higher-level economic development and better government public services in a household’s region can improve vulnerability. Surprisingly, albeit having desirable negative sign, the coefficients for medical insurance participation and job security participation under column (5) are not all significant. In addition, the coefficient on region types in column (5) is significantly positive, suggesting that middle-income households in eastern regions are more vulnerable than those in central and western regions. This result may seem contrary to expectations, but it is not. Although the eastern region has the majority of middle-income households (58.7%), as analysed above, not only the high cost of housing, education, and health care in the eastern region, but also the higher cost of living, which makes it difficult for middle-income households to maintain a normal middle-class life. This result confirms the suspicion that many middle-income households in China cannot be regarded as truly middle class. Thus, economic growth can significantly reduce the vulnerability of middle-income households, and regional characteristics play an important role in determining household vulnerability.
5.2. Heterogeneous Effects
5.2.1. Heterogeneity of Household Income
According to the 0.25, 0.50, and 0.75 quantiles of annual per capita income of middle-income households, the study sample was divided into four income brackets: Income-I (below 35,000 yuan), Income-II (35,000–45,000 yuan), Income-III (45,001–60,667 yuan), and Income-IV (above 606,667 yuan). Specifically, households with incomes at Income-I belong to the bottom of the middle-income class, and incomes at Income-IV belong to the highest level within the middle-income class. Given that individual variables may all have 0 values, the heterogeneity estimate excludes the variable of social donations.
This section examines the determinants of vulnerability of middle-income households across income bracket (Table 4). The estimated coefficients for household size are all significant at the 1% level and this negative impact decreases as household income increases, suggesting that the decline in number of members is an important element in reducing household vulnerability. Despite the desirable positive signs, employment in the government agencies and educational attainment are not all significant in the lower-income bracket (i.e., columns (1) and (2)), but become significantly negative at the upper-income bracket (i.e., columns (3) and (4)). This suggests that households at the upper-income bracket place more emphasis on investment in human capital, and it should be noted that there are likely different returns to education at different income levels: the poor are less capable to exploit in the labour market the achievements in education. In addition, physical capital (car and house property) also has a negative and highly significant effect on household vulnerability, in absolute terms, with a greater mitigating effect for upper-income households (Income-III and Income-IV). In addition, the estimated coefficient on region types becomes significantly negative at Income-I and Income-II, again indicating that middle-income households at lower-income bracket (i.e., columns (1) and (2)) are more vulnerable in the eastern region, which is consistent with the findings above, indicating that the conclusion is robust. Similarly, marital status and provincial GDP also significantly reduce the vulnerability of middle-income households, and the extent of this impact is positively correlated with household income. These findings further suggest that adequate material resources can substantially mitigate the shocks faced by middle-income households.
Table 4.
Results of heterogeneity in vulnerability of middle-income class by household income.
5.2.2. Heterogeneity of Household Size
According to the results in Table 3 and Table 4, there is a significant heterogeneous effect of household size. In this section, we use subsample regression to investigate the impact of household size on the vulnerability of middle-income households (see Table 5).
Table 5.
Results of heterogeneity in vulnerability of middle-income class by household size.
The study sample is categorized based on the number of household members into three or fewer (small-scale households), four to five persons (medium-scale households), and six or more persons (large-scale households).
As shown in the Table 5, the estimated coefficient of average age is significant at the 5% level, indicating a positive relationship between age and household vulnerability. The negative effect of age on household vulnerability increases as the population increases (columns (1)–(3)). This reflects the old-age pressure on middle-income households and highlights the critical social issues of an ageing population and high cost of education in China today, while large-scale households often imply a serious dependency burden. Therefore, in order to ensure a balanced demographic structure and promote stable economic development in the long-term, the government should optimize policy measures related to fertility, education, and social security. In line with the results in the Table 3 and Table 4, the estimated coefficient for physical capital (car and house property) remains significantly negative. When household size doubles, the coefficient for house property under columns (1)–(3) increases by approximately three times (−0.23 vs. −0.64). This again reflects the fact that material resources are still a key factor in reducing the vulnerability of middle-income households, especially those with large-scale populations. In addition, similar conclusions are drawn about marital status, educational attainment, and provincial GDP.
6. Conclusions and Policy Implication
This study highlights the importance of the middle class and the extent of their vulnerability in developing countries. Specifically, we measure the extent of vulnerability for each middle-income household based on the definition of the middle class and the approach of Vulnerability as Expected Poverty. At the same time, we systematically compare urban–rural, regional, and income distribution characteristics of vulnerable middle-income groups, and examined the relative importance of its different determinants. The analysis was based on cross-sectional data of 9719 households, for 2018.
In terms of the size of middle class, in China, the income structure is typically characterized by a “pyramid shape”, with 58.3%, 34.5%, and 7.2% in the low-income, middle-income, and high-income classes, respectively. When considering the criteria of developing countries (per capita expenditure per day: USD 2–10 and USD 2–13), the scale of the middle-income group is significantly higher (63.7% vs. 23.9%). Moreover, the regional disparities in the proportion of middle-income groups are significant due to the existence of the urban–rural dichotomy.
Our VEP estimated results show that although only 36.9% of the population belong to the middle-income class, 62.3% of this population are still vulnerable, and the scale of vulnerable groups remains large. More surprisingly, nearly half of the population in the upper-income bracket is likely to slip into the low-income class in the future (44.3%). Rural areas are particularly vulnerable. This may indicate that government should protect the middle-income class from economic insecurity.
We also found that educational qualifications and household properties are still a determinant of the vulnerability of the middle-income class. Specifically, educational attainment, employment in the government agencies, the physical capital owned by households (savings, car and house property), and provincial GDP can all significantly reduce the vulnerability of the middle-income class. Conversely, age and household size will increase the proportion of vulnerable households. Heterogeneity in terms of income and household size was also estimated, and the main findings were consistent. Moreover, the mitigating effect of variables on vulnerability increases significantly with increasing household income and size, particularly household properties, which is consistently a key factor in reducing the vulnerability of the middle-income class.
Indeed, middle income growth in developing economies over the past decades has generally been associated with low productive service-related jobs and a structural shift into informal self-employment. From this perspective, it becomes evident that the reality of middle-class expansion could well be limited in many developing countries solely to the aggregation of microeconomic behavioural patterns rather than constituting a genuine social class that has reached a minimum degree of internal consistency. This fundamental reason makes it increasingly challenging for this group to maintain its status as a true middle class.
Based on the above findings, this study proposes following policy recommendations. Firstly, the Chinese government should increase fiscal expenditure on education while narrowing the gap between urban and rural residents’ educational attainment; rural children, especially, should be allowed to access a fair educational environment. Meanwhile, it is necessary to include pre-school and high school education in the scope of compulsory education to stop the inter-generational transmission of poverty in China. Second, it is important to increase factor market reform and smooth the flow channels of person, land, capital, and technology between urban and rural areas. It should also promote the transfer of rural residential bases and enhance the property income of rural residents. Thirdly, the Chinese government should further expand urban social insurance coverage and participation rates, especially old-age insurance and medical insurance, and improve the level of the public services of local governments.
Author Contributions
Conceptualization, X.C. and G.L.; investigation, X.C.; methodology, X.C. and G.L.; software, X.C.; validation, X.C.; formal analysis, X.C. and G.L.; data curation, X.C.; writing—review and editing, X.C. and G.L.; visualization, X.C. The authors contributed significantly to the completion of this manuscript, conceiving and designing the research, writing and improving the paper. All authors have read and agreed to the published version of the manuscript.
Funding
This research received no external funding.
Institutional Review Board Statement
Not applicable.
Informed Consent Statement
Not applicable.
Data Availability Statement
Not applicable.
Acknowledgments
The authors thank the Institute of Social Science Survey of the Peking for supplying the data.
Conflicts of Interest
The author declares no conflict of interest.
References
- Li, C. Chronological Changes of Middle-Income Group in China. In The Middle-Income Group in China and Russia; Li, P., Gorshkov, M.K., Eds.; Springer: Singapore, 2021; pp. 1–15. [Google Scholar]
- Lu, P.; Fan, X. Variations in the Income and Education of the Middle-Income Group in China. In The Middle-Income Group in China and Russia; Springer: Singapore, 2021; pp. 69–85. [Google Scholar]
- Easterly, W. Middle class consensus and economic development. Econ. Growth 2001, 6, 317–336. [Google Scholar] [CrossRef]
- Banerjee, A.V.; Duflo, E. What is middle class about the middle classes around the world? Econ. Perspect. 2008, 22, 3–28. [Google Scholar] [CrossRef]
- Birdsall, N. The (indispensable) middle class in developing countries. In Equity and Growth in a Globalizing World; World Bank: Washington, DC, USA, 2010; pp. 157–188. [Google Scholar]
- López-Calva, L.F.; Ortiz-Juarez, E. A vulnerability approach to the definition of the middle class. Econ. Inequal. 2014, 12, 23–47. [Google Scholar] [CrossRef]
- Stampini, M.; Robles, M.; Sáenz, M.; Ibarrarán, P.; Medellín, N. Poverty, vulnerability, and the middle class in Latin America. Lat. Am. Econ. Rev. 2016, 25, 4. [Google Scholar] [CrossRef]
- Atkinson, A.B.; Brandolini, A. On the identification of the ‘middle class’. In Inequality and the Status of the Middle Class; Stanford University Press: Stanford, CA, USA, 2011. [Google Scholar]
- Tsang, E. The New Middle Class in China: Consumption. In Politics and the Market Economy; Springer: Berlin/Heidelberg, Germany, 2014. [Google Scholar]
- Rocca, J.L. The Making of the Chinese Middle Class: Small Comfort and Great Expectations; Springer: Berlin/Heidelberg, Germany, 2016. [Google Scholar]
- Schettino, F.; Gabriele, A.; Khan, H.A. Polarization and the middle class in China: A non-parametric evaluation using CHNS and CHIP data. Struct. Chang. Econ. Dyn. 2021, 57, 251–264. [Google Scholar] [CrossRef]
- Wright, E.O. Class Structure and Income Determination; Academic Press: New York, NY, USA, 1979. [Google Scholar]
- Belbag, A.G.; Uner, M.M.; Cavusgil, E.; Cavusgil, S.T. The new middle class in emerging markets: How values and demographics influence discretionary consumption. Int. Bus. Theory Appl. 2019, 61, 325–337. [Google Scholar] [CrossRef]
- Clément, M.; Rougier, E.; Berrou, J.P.; Combarnous, F.; Darbon, D. “What’s in the middle”: Scratching beneath the surface of the middle class (es) in Brazil, Côte d’Ivoire, Turkey and Vietnam. World Dev. 2022, 158, 105988. [Google Scholar] [CrossRef]
- Issa, S.T.; van derMolen, I.; Nadar, M.R.; Loveth, J.C. Spatial variation of vulnerability in geographic areas of North Lebanon. Eur. Sci. 2014, 2, 261–273. [Google Scholar]
- Moser, C.O. The asset vulnerability framework: Reassessing urban poverty reduction strategies. World Dev. 1998, 26, 1–19. [Google Scholar] [CrossRef]
- Lampis, A. Vulnerability and Poverty: An Assets, Resources and Capabilities Impact Study of Low-Income Groups in Bogota; London School of Economics and Political Science: London, UK, 2009. [Google Scholar]
- Notenbaert, A.; Karanja, S.N.; Herrero, M.; Felisberto, M.; Moyo, S. Derivation of a household-level vulnerability index for empirically testing measures of adaptive capacity and vulnerability. Reg. Environ. Chang. 2013, 13, 459–470. [Google Scholar] [CrossRef]
- Wroński, M. Multidimensional inequality in the European Union. The joint distribution of household income, wealth and consumption. Econ. Sociol. 2021, 14, 205–219. [Google Scholar] [CrossRef]
- Biswas, S.; Nautiyal, S. An assessment of socio-economic vulnerability at the household level: A study on villages of the Indian Sundarbans. Environ. Dev. Sustain. 2021, 23, 11120–11137. [Google Scholar] [CrossRef]
- Watts, M.J.; Bohle, H.G. The space of vulnerability: The causal structure of hunger and famine. J. Prog. Hum. Geogr. 1993, 17, 43–67. [Google Scholar] [CrossRef]
- Goldthorpe, J.H.; McKnight, A. The Economic Basis of Social Class. CASE Paper 80; London School of Economics: London, UK, 2004. [Google Scholar]
- Naudé, W.; McGillivray, M.; Rossouw, S. Measuring the vulnerability of subnational regions in South Africa. Oxf. Dev. Stud. 2009, 37, 249–276. [Google Scholar] [CrossRef]
- Klasen, S.; Lechtenfeld, T.; Povel, F. A feminization of vulnerability? Female headship, poverty, and vulnerability in Thailand and Vietnam. World Dev. 2015, 71, 36–53. [Google Scholar] [CrossRef]
- Cao, M.; Xu, D.; Xie, F.; Liu, E.; Liu, S. The influence factors analysis of households’ poverty vulnerability in southwest ethnic areas of China based on the hierarchical linear model: A case study of Liangshan Yi autonomous prefecture. Appl. Geogr. 2016, 66, 144–152. [Google Scholar] [CrossRef]
- Poh, L.M.; Sabri, M.F. Review of financial vulnerability studies. Arch. Bus. Res. 2017, 5, 127–133. [Google Scholar]
- Povel, F. Measuring exposure to downside risk with an application to Thailand and Vietnam. World Dev. 2015, 71, 4–24. [Google Scholar] [CrossRef]
- Gang, I.N.; Gatskova, K.; Landon-Lane, J.; Yun, M.-S. Vulnerability to poverty: Tajikistan during and after the global financial crisis. Soc. Indic. Res. 2017, 138, 925–951. [Google Scholar] [CrossRef]
- Aiyemo, B. Recessions and the vulnerable. World Dev. 2020, 132, 104977. [Google Scholar] [CrossRef]
- Bilan, Y.; Mishchuk, H.; Samoliuk, N.; Yurchyk, H. Impact of Income Distribution on Social and Economic Well-Being of the State. Sustainability 2020, 12, 429. [Google Scholar] [CrossRef]
- Rougier, E.; Berrou, J.P.; Clément, M.; Combarnous, F.; Darbon, D. Should we call it a (middle) class? A socio-economic exploration of the Vietnamese middle-income group. J. Int. Dev. 2021, 33, 1321–1345. [Google Scholar] [CrossRef]
- Bussolo, M.; De Hoyos, R.E.; Medvedev, D.; Van Der Mensbrugghe, D. Global growth and distribution: Are China and India reshaping the world? South. Engines Glob. Growth 2010, 77–113. [Google Scholar]
- Chen, S.; Ravallion, M. The developing world Is Poorer than we thought, but no less successful in the fight against poverty. In Policy Research Working Paper (No. 4703); The World Bank: Washington, DC, USA, 2010. [Google Scholar]
- Milanovic, B.; Yitzhaki, S. Does decomposing world income distribution: Does the world have a middle class? Rev. Income Wealth 2002, 48, 155–178. [Google Scholar] [CrossRef]
- Ravallion, M. The developing world’s bulging (but vulnerable) middle class. World Dev. 2010, 38, 445–454. [Google Scholar] [CrossRef]
- Chen, C.; Qin, B. The emergence of China’s middle class: Social mobility in a rapidly urbanizing economy. Habitat Int. 2014, 44, 528–535. [Google Scholar] [CrossRef]
- Kharas, H.; Gertz, G. The new global middle class: A cross-over from west to east. In China’s Emerging Middle Class: Beyond Economic Transformation; Brookings Institution Press: Washington, DC, USA, 2010; pp. 32–51. [Google Scholar]
- Suryahadi, A.; Sumarto, S.; Pritchett, L. Quantifying Vulnerability to Poverty—A Proposed Measure, Applied to Indonesia; Research rep. 2000; The World Bank: Washington, DC, USA, 2000. [Google Scholar]
- Christiaensen, L.J.; Subbarao, K. Towards an understanding of household vulnerability in Rural Kenya. Afr. Econ. 2005, 14, 520–558. [Google Scholar] [CrossRef]
- Bourguignon, F.; Goh, C.; Kim, D.I.; Morgan, S.L.; Grusky, D.B.; Fields, G.S. Estimating individual vulnerability to poverty with pseudo-panel data. J. Mobil. Inequal. 2006, 349–369. [Google Scholar]
- Chaudhuri, S.; Jyotsna, J.; Asep, S. Assessing Household Vulnerability to Poverty from Cross-Sectional Data: A Methodology and Estimates from Indonesia; Research rep. 0102-52; Columbia University: New York, NY, USA, 2002; p. 36. [Google Scholar]
- Dutta, I.; Foster, J.; Mishra, A. On measuring vulnerability to poverty. Soc. Choice Welf. 2011, 37, 743–761. [Google Scholar] [CrossRef]
- Dercon, S. Risk, poverty and vulnerability in Africa. J. Afr. Econ. 2005, 14, 483–488. [Google Scholar] [CrossRef]
- Jha, R.; Dang, T.; Tashrifov, Y. Economic vulnerability and poverty in Tajikistan. Econ. Chang. Restruct. 2010, 43, 95–112. [Google Scholar] [CrossRef]
- Faulkner, J.P.; Murphy, E.; Scott, M. Rural household vulnerability a decade after the great financial crisis. J. Rural Stud. 2019, 72, 240–251. [Google Scholar] [CrossRef]
- Ali, L.; Khan, M.K.N.; Ahmad, H. Education of the Head and Financial Vulnerability of Households: Evidence from a Household’s Survey Data in Pakistan. Soc. Indic. Res. 2020, 147, 439–463. [Google Scholar] [CrossRef]
- Sun, H.; Li, X.; Li, W. The nexus between credit channels and farm household vulnerability to poverty: Evidence from rural China. Sustainability 2020, 12, 3019. [Google Scholar] [CrossRef]
- Nchor, J.U. Livelihood Strategies and Their Determinants among Informal Households in Calabar, Nigeria. Sustainability 2023, 15, 2855. [Google Scholar] [CrossRef]
- Chaudhuri, S. Assessing Vulnerability to Poverty: Concepts, Empirical Methods and Illustrative Examples, Mimeo; Columbia University: New York, NY, USA, 2003. [Google Scholar]


Disclaimer/Publisher’s Note: The statements, opinions and data contained in all publications are solely those of the individual author(s) and contributor(s) and not of MDPI and/or the editor(s). MDPI and/or the editor(s) disclaim responsibility for any injury to people or property resulting from any ideas, methods, instructions or products referred to in the content. |
© 2023 by the authors. Licensee MDPI, Basel, Switzerland. This article is an open access article distributed under the terms and conditions of the Creative Commons Attribution (CC BY) license (https://creativecommons.org/licenses/by/4.0/).