Dynamic Equilibrium of Sustainable Ecosystem Variables: An Experiment
Abstract
1. Introduction
2. Ecosystems Concept and Techniques for Benchmarking
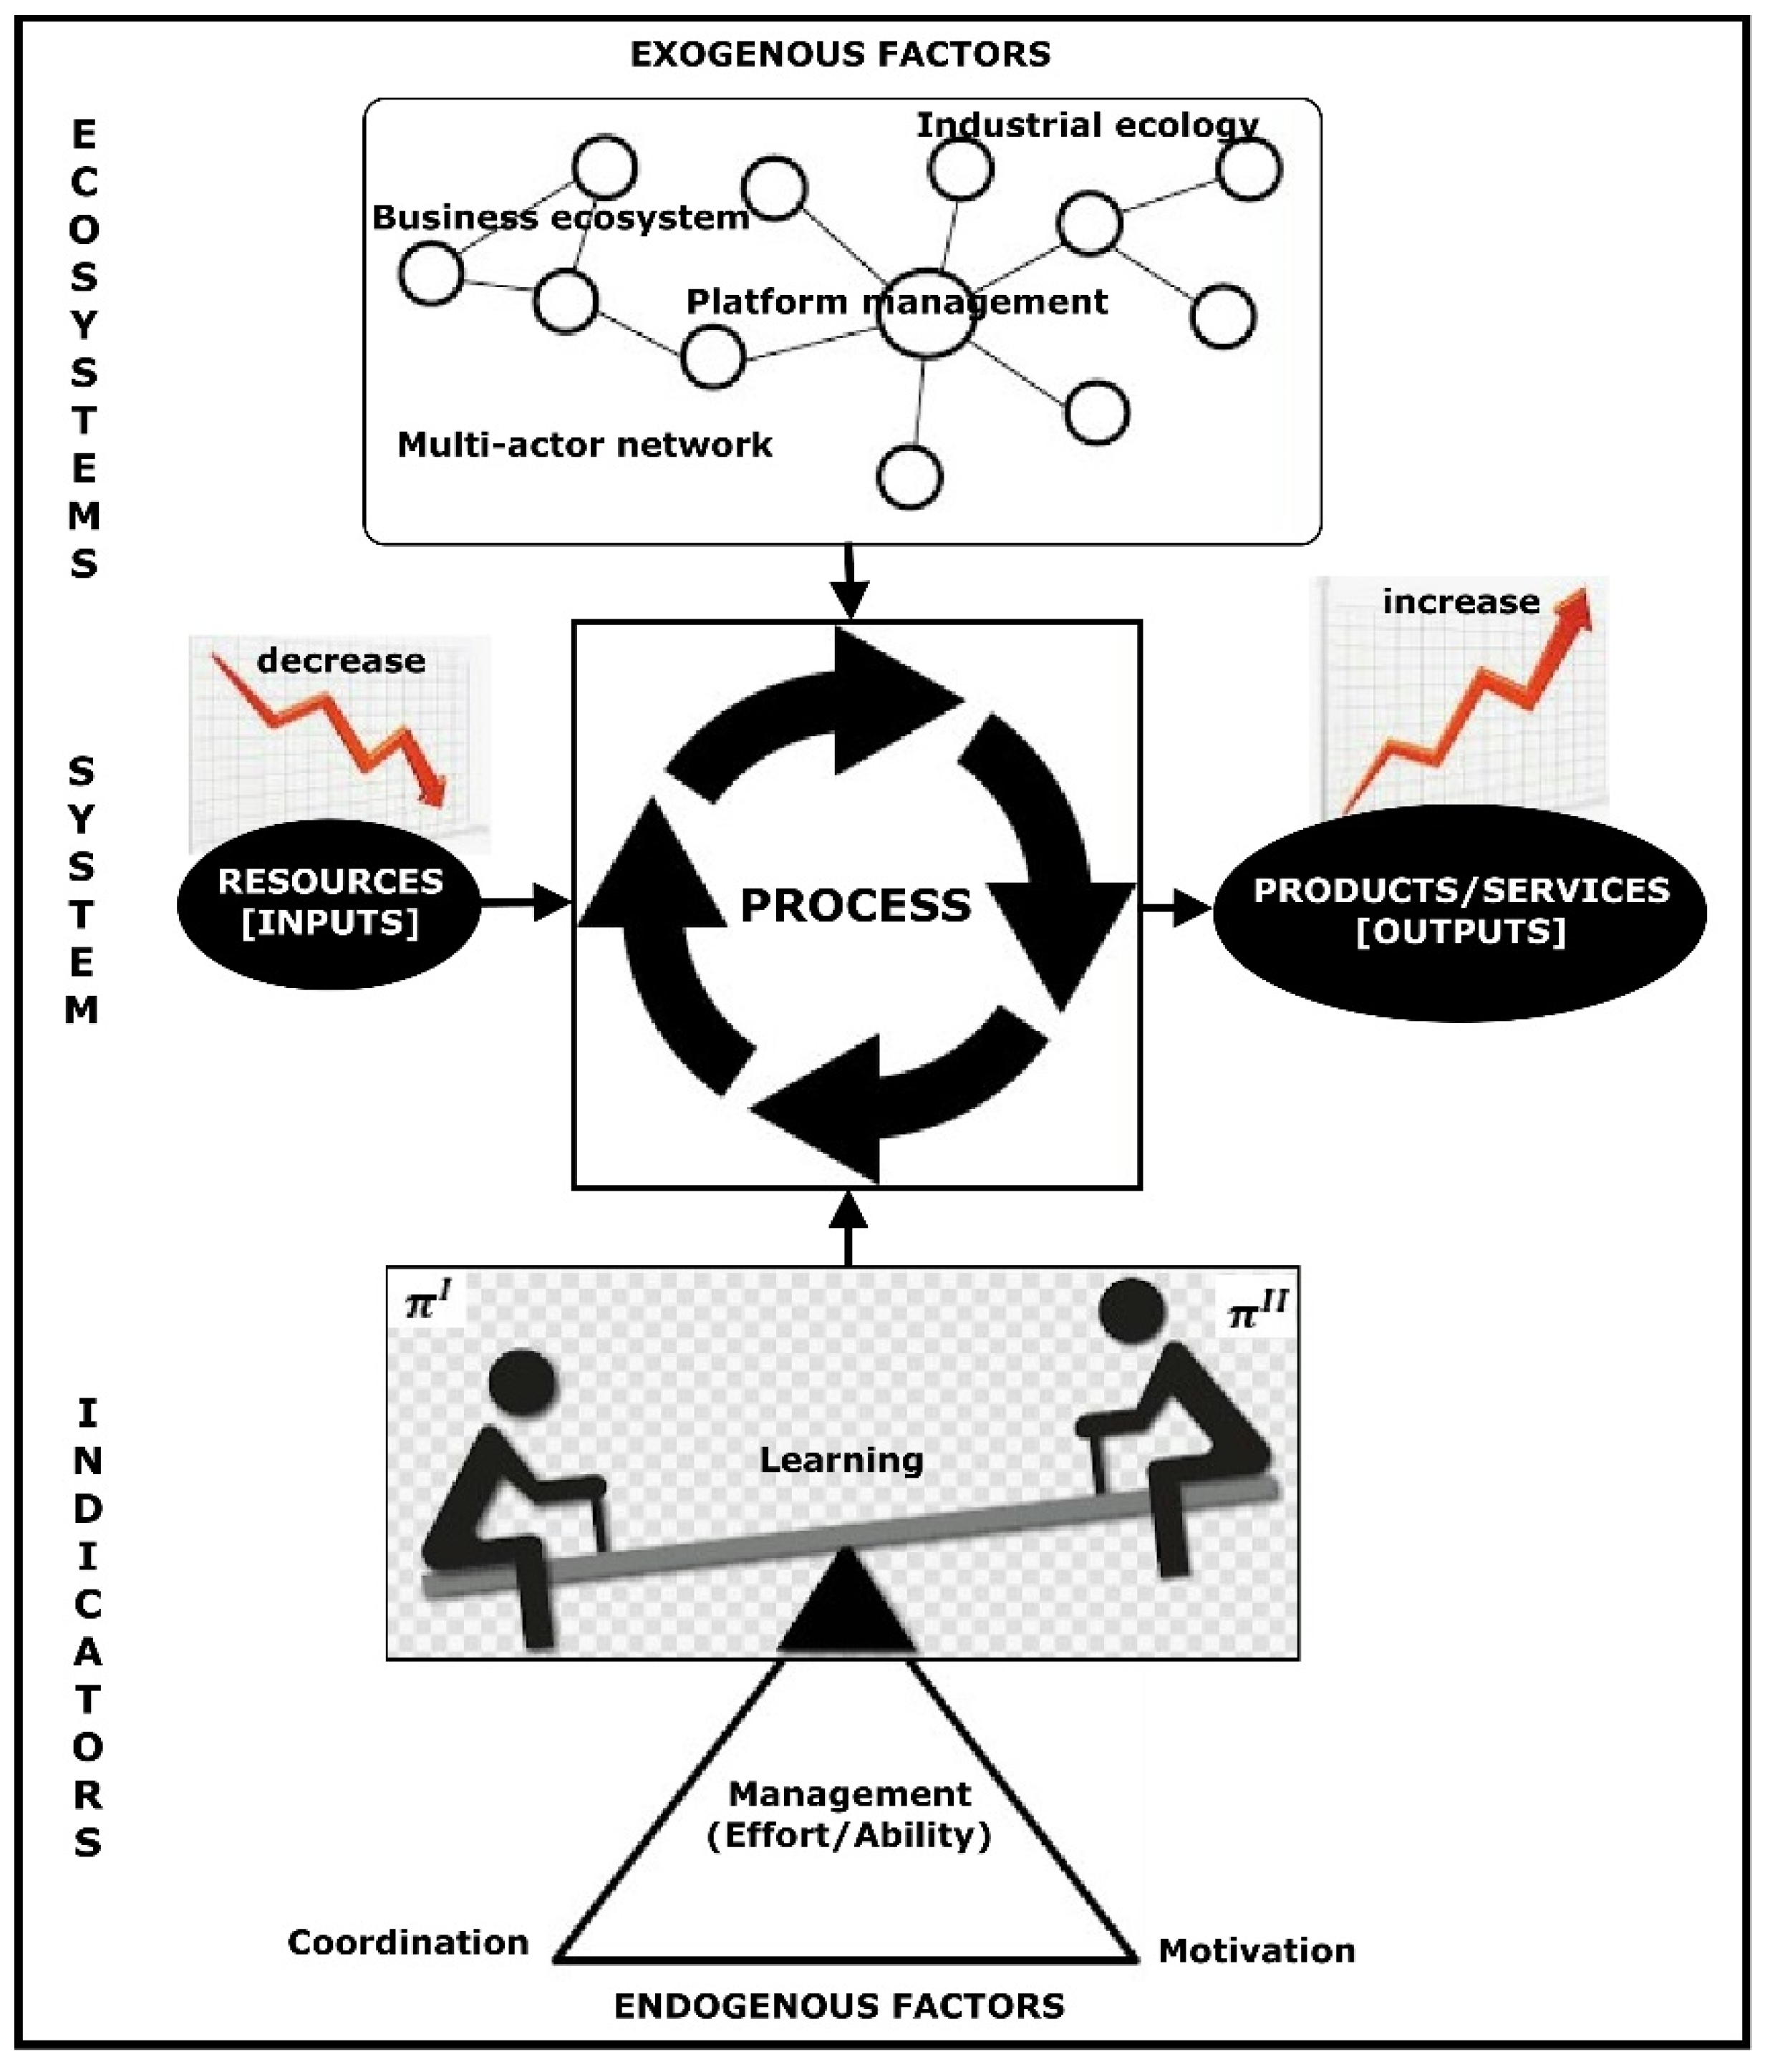
2.1. Ecosystem and Indicators
2.2. Techniques for Benchmarking
3. Materials and Methods
Experiment Design
4. Results of the Systematic Experiments
4.1. Experiment—Toy Example
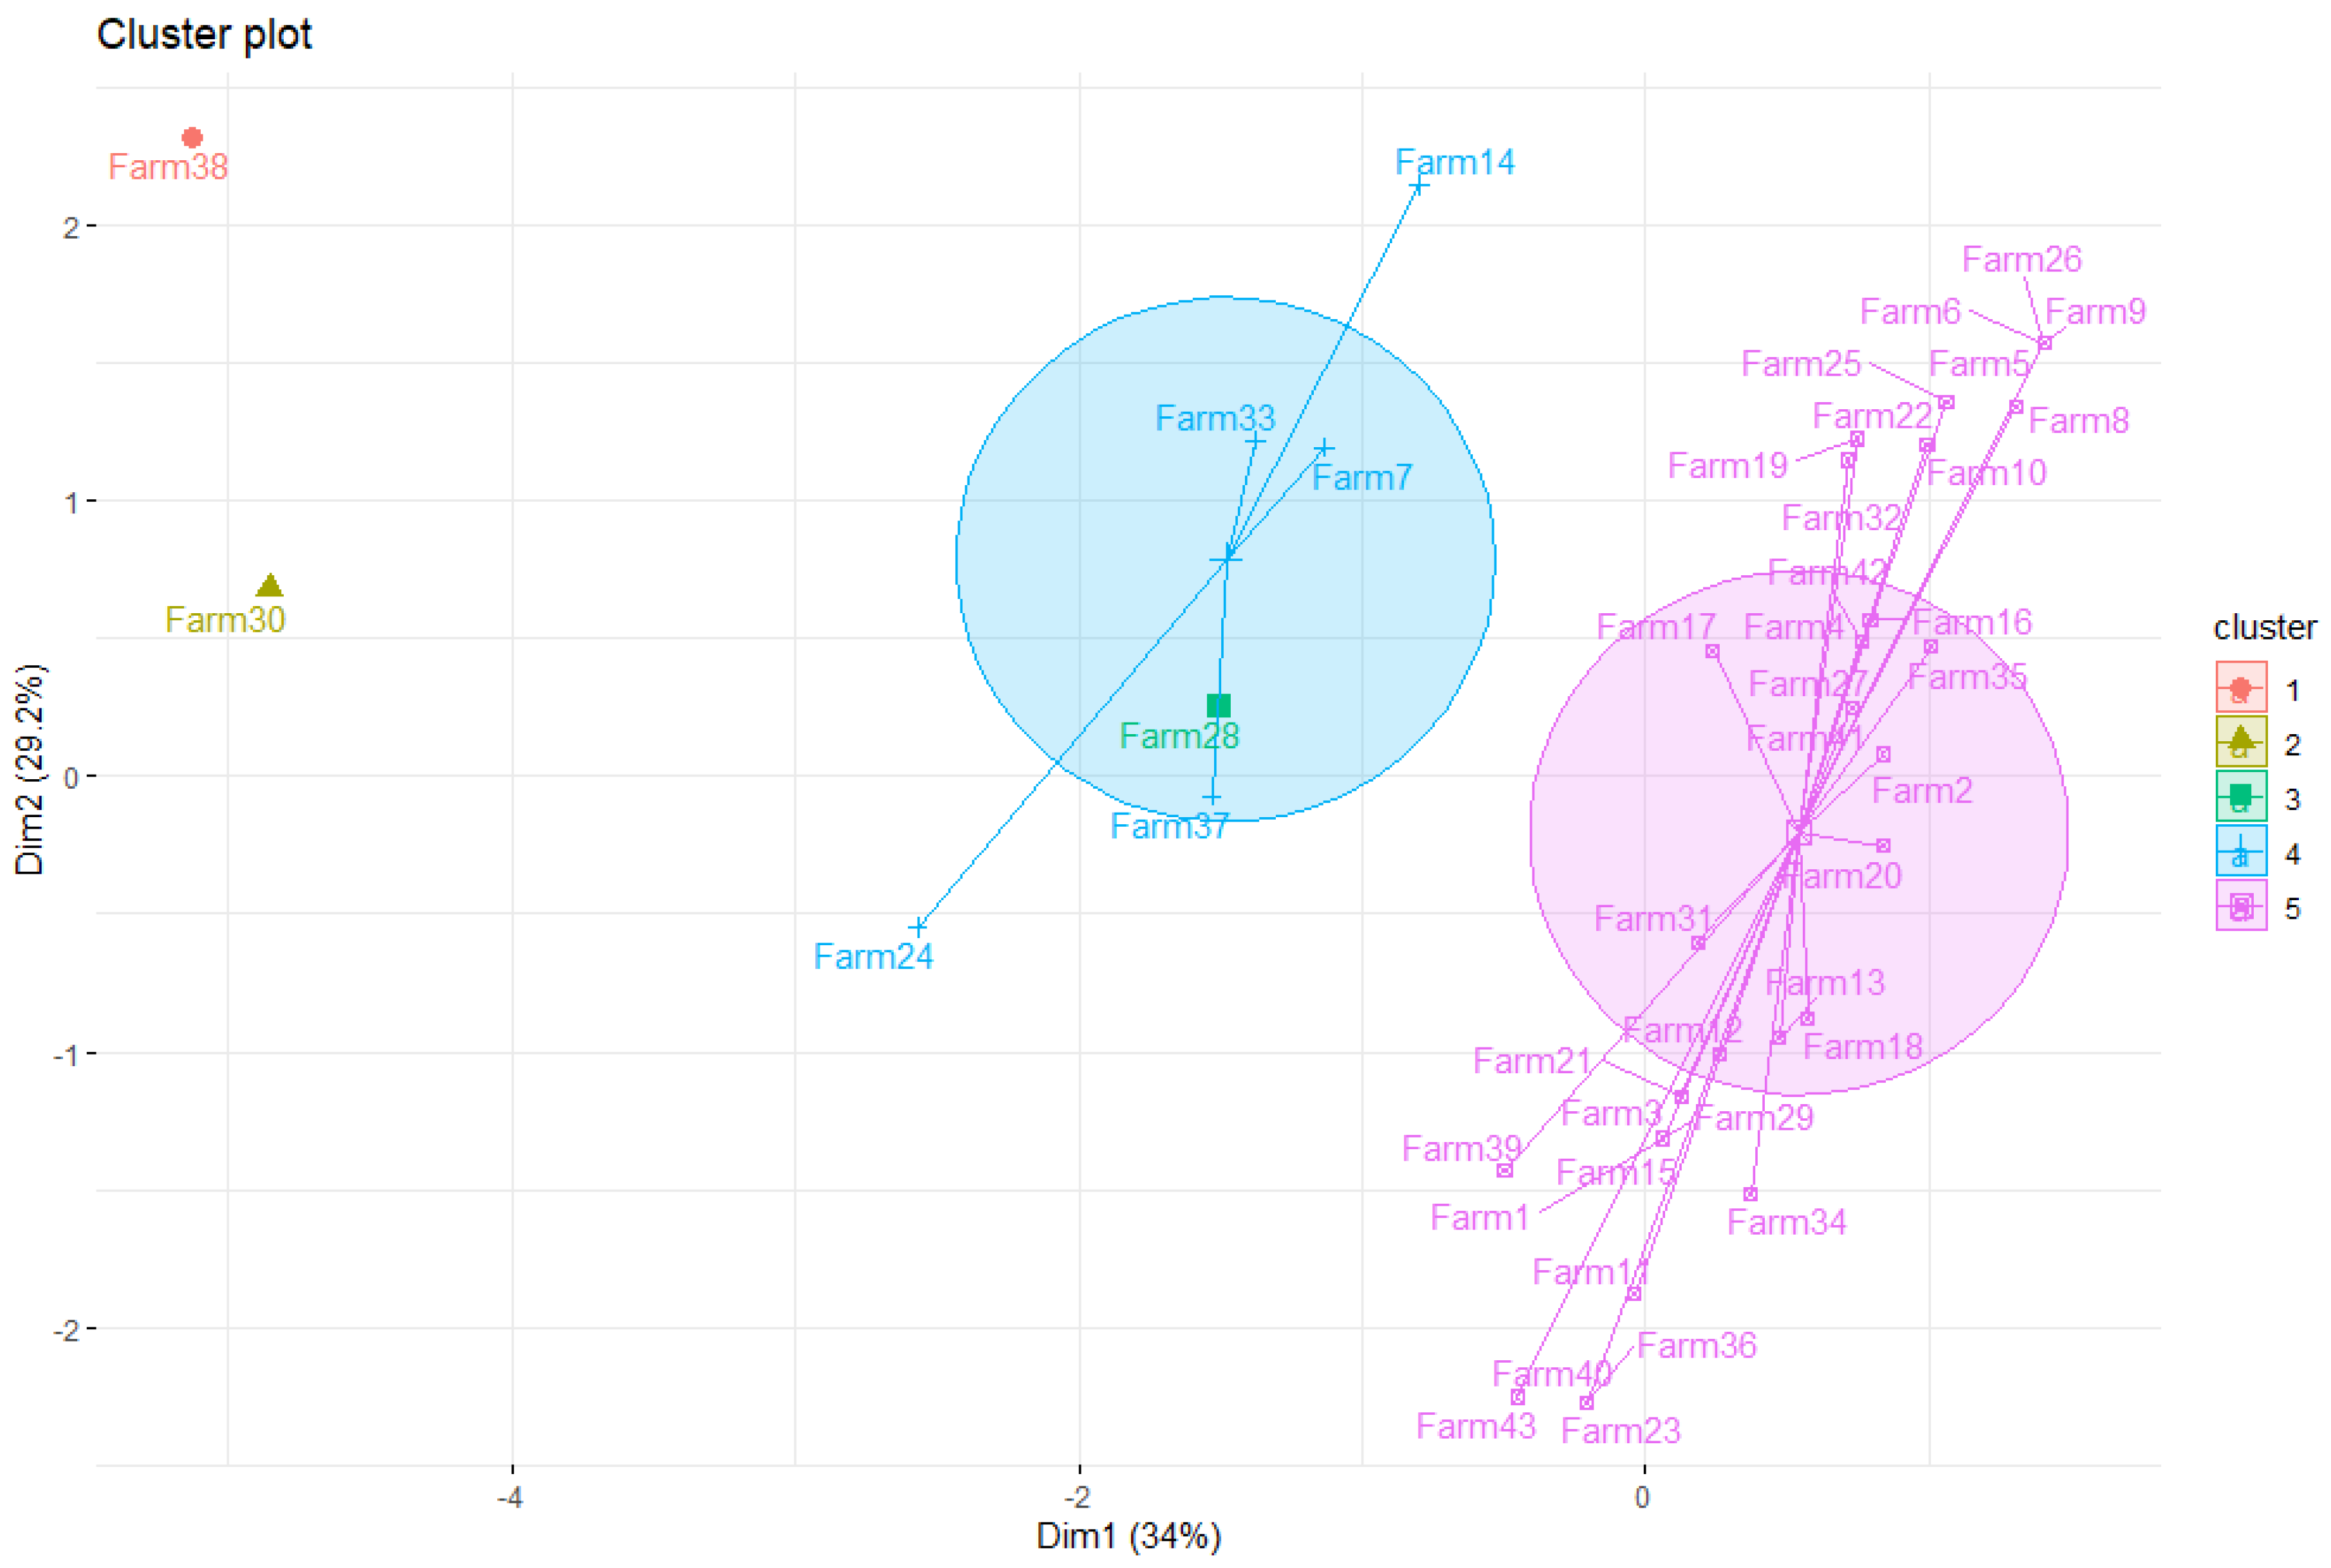
4.2. Real Example for MDA Model in Excel
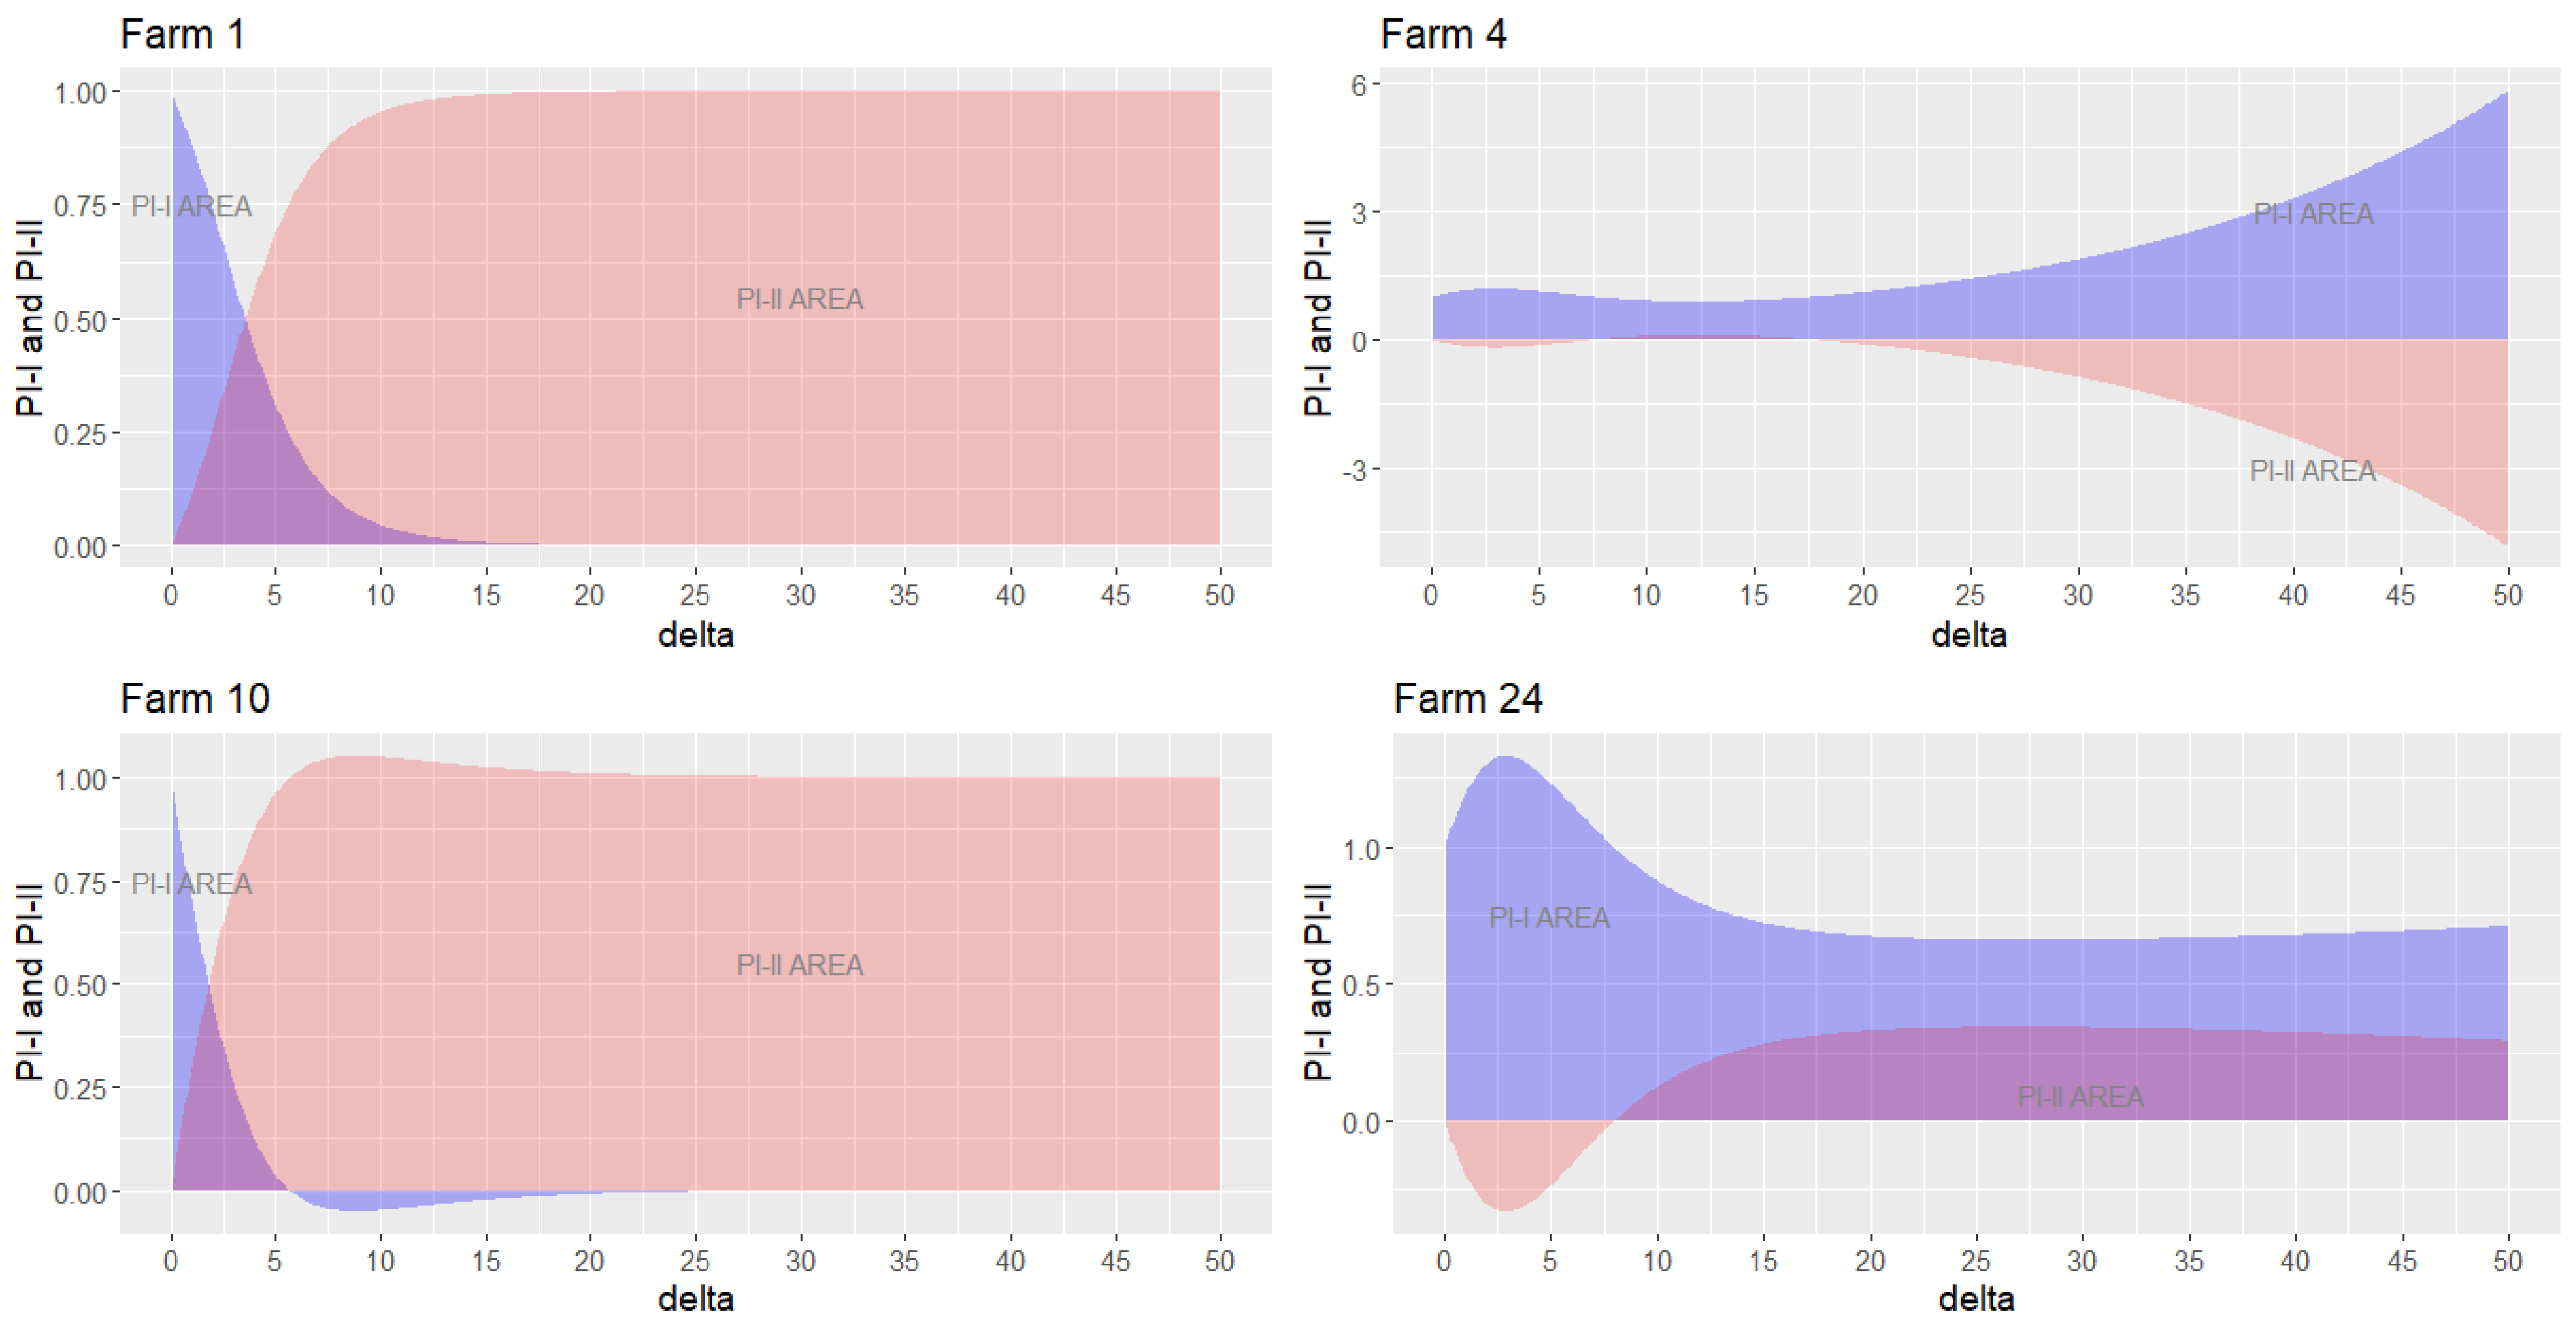
4.3. Marginal Exponentiation Experiment
5. Discussion
6. Conclusions
Supplementary Materials
Author Contributions
Funding
Institutional Review Board Statement
Informed Consent Statement
Data Availability Statement
Acknowledgments
Conflicts of Interest
References
- Fang, K. Moving away from sustainability. Nat. Sustain. 2022, 5, 5–6. [Google Scholar] [CrossRef]
- EC-European Commission. EU Biodiversity Strategy for 2030: Bringing Nature back into our Lives, Brussels, 20.5.2020. Available online: https://eur-lex.europa.eu/legal-content/EN/TXT/?uri=CELEX:52020DC0380 (accessed on 20 November 2022).
- EC-European Commission. The European Green Deal–Brussels, 11 December 2019. Available online: https://commission.europa.eu/strategy-and-policy/priorities-2019-2024/european-green-deal_en (accessed on 20 November 2022).
- Warhurst, A. Sustainability Indicators and Sustainability Performance Management, WBCSD, Report; University of Warwick: Coventry, UK, 2002. [Google Scholar]
- Joung, C.B.; Carrell, J.; Sarkar, P.; Feng, S.C. Categorization of indicators for sustainable manufacturing. Ecol. Indic. 2012, 24, 148–157. [Google Scholar] [CrossRef]
- Hassini, E.; Surti, C.; Searcy, C. A literature review and a case study of sustainable supply chains with a focus on metrics. Int. J. Prod. Econ. 2012, 140, 69–82. [Google Scholar] [CrossRef]
- Hák, T.; Janoušková, S.; Moldan, B. Sustainable development goals: A need for relevant indicators. Ecol. Indic. 2016, 60, 565–573. [Google Scholar] [CrossRef]
- Machado, C.G.; Pinheiro de Lima, E.; Gouvea da Costa, S.E.; Angelis, J.J.; Mattioda, R.A. Framing maturity based on sustainable operations management principles. Int. J. Prod. Econ. 2017, 190, 3–21. [Google Scholar] [CrossRef]
- Schmidt-Traub, G.; Kroll, C.; Teksoz, K.; Durand-Delacre, D.; Sachs, J.D. National baselines for the Sustainable Development Goals assessed in the SDG Index and Dashboards. Nat. Geosci. 2017, 10, 547–555. [Google Scholar] [CrossRef]
- Perroni, M.G.; Tortato, U.; Vieira da Silva, W.; Pereira da Veiga, C.; Senff, C.O. Analytical method for sustainability science benchmarking: An indicator decomposition approach. Ecol. Indic. 2020, 116, 106470. [Google Scholar] [CrossRef]
- Qiu, J.; Zipper, S.C.; Motew, M.; Booth, E.G.; Kucharik, C.J.; Loheide, S.P. Nonlinear groundwater influence on biophysical indicators of ecosystem services. Nat. Sustain. 2019, 2, 475–483. [Google Scholar] [CrossRef]
- Marshall, A. Principles of Economics (1890)–Founder of Modern (Neo-Classical) Economics; Digireads.com Publishing: Overland Park, KS, USA, 2012; 534p. [Google Scholar]
- Leontief, W.W. Input-Output Economics; Oxford University Press: Oxford, UK, 1966; p. 257. [Google Scholar]
- Aigner, D.; Lovell, C.K.; Schmidt, P. Formulation and estimation of stochastic frontier production function models. J. Econom. 1977, 6, 21–37. [Google Scholar] [CrossRef]
- Charnes, A.; Cooper, W.W.; Rhodes, E. Measuring the efficiency of decision making units. Eur. J. Oper. Res. 1978, 2, 429–444. [Google Scholar] [CrossRef]
- Andor, M.A.; Parmeter, C.; Sommer, S. Combining uncertainty with uncertainty to get certainty? Efficiency analysis for regulation purposes. Eur. J. Oper. Res. 2019, 274, 240–252. [Google Scholar] [CrossRef]
- Coelli, T.J.; Rao, D.S.P.; O’Donnell, C.J.; Battese, G.E. An Introduction to Efficiency and Productivity Analysis; Springer: Berlin/Heidelberg, Germany, 2005. [Google Scholar]
- O’Donnell, C.J. Productivity and Efficiency Analysis: An Economic Approach to Measuring and Explaining Managerial Performance; Springer: Brisbane, QLD, Australia, 2018; 418p. [Google Scholar]
- Henningsen, A. Introduction to Econometric Production Analysis with R (Fourth Draft Version); Department of Food and Resource Economics, University of Copenhagen: Copenhagen, Denmark, 2019. [Google Scholar]
- Rho, S.; Schmidt, P. Are all firms inefficient? J. Product. Anal. 2015, 43, 327–349. [Google Scholar] [CrossRef]
- Shehabuddeen, N.; Probert, D.; Phaal, R.; Platts, K. Representing and Approaching Complex Management Issues: Part 1—Role and Definition; Working Paper Series; University of Cambridge Institute for Manufacturing: Cambridge, UK, 1999. [Google Scholar]
- Brandt, P.; Ernst, A.; Gralla, F.; Luederitz, C.; Lang, D.J.; Newig, J.; Reinert, F.; Abson, D.J.; Von Wehrden, H. A review of transdisciplinary research in sustainability science. Ecol. Econ. 2013, 92, 1–15. [Google Scholar] [CrossRef]
- Tsujimoto, M.; Kajikawa, Y.; Tomita, J.; Matsumoto, Y. A review of the ecosystem concept—Towards coherent ecosystem design. Technol. Forecast. Soc. Change 2018, 136, 49–58. [Google Scholar] [CrossRef]
- McAfee, A.; Brynjolfsson, E. Big Data: The Management revolution. Harv. Bus. Rev. 2012, 90, 58–68. [Google Scholar]
- Assis, F.G.L.F.; Ferreira, K.R.; Vinhas, L.; Maurano, L.; Almeida, C.; Carvalho, A.; Rodrigues, J.; Maciel, A.; Camargo, C. TerraBrasilis: A Spatial Data Analytics Infrastructure for Large-Scale Thematic Mapping. Int. J. Geo-Inf. 2019, 8, 513. [Google Scholar] [CrossRef]
- Leontief, W.W. Quantitative input and output relations in the economic system of the United States. Rev. Econ. Stat. 1936, 18, 105–125. [Google Scholar] [CrossRef]
- Lin, X.; Polenske, K.R. Input-output modeling production processes for business management. Struct. Change Econ. Dyn. 1998, 9, 205–226. [Google Scholar] [CrossRef]
- Albino, V.; Kühtz, S. Enterprise input–output model for local sustainable development—The case of a tiles manufacturer in Italy. Resour. Conserv. Recycl. 2004, 41, 165–176. [Google Scholar] [CrossRef]
- Albino, V.; Kühtz, S.; Petruzzelli, A.M. Analysing logistics flows in industrial clusters using an enterprise input-output model. Interdiscip. Inf. Sci. 2003, 14, 25–41. [Google Scholar] [CrossRef]
- Albino, V.; Dietzenbacher, E.; Kühtz, S. Analysing materials and energy flows in an industrial district using an enterprise input-output model. Econ. Syst. Res. 2003, 15, 457–480. [Google Scholar] [CrossRef]
- Albino, V.; Izzo, C.; Kühtz, S. Input–output models for the analysis of a local/global supply chain. Int. J. Prod. Econ. 2002, 78, 119–131. [Google Scholar] [CrossRef]
- Miller, R.E.; Blair, P.D. Input-Output Analysis: Foundations and Extensions, 2nd ed.; Cambridge University Press: Cambridge, UK, 2009; pp. 1–750. [Google Scholar]
- Kuhtz, S.; Zhou, C.; Albino, V.; Yazan, D.M. Energy use in two Italian and Chinese tile manufacturers: A comparison using an enterprise input-output model. Energy 2010, 35, 364–374. [Google Scholar] [CrossRef]
- Perroni, M.G.; Gouvea da Costa, S.E.; Pinheiro de Lima, E.; Vieira da Silva, W.; Tortato, U. Measuring energy performance: A process based approach. Appl. Energy 2018, 222, 540–553. [Google Scholar] [CrossRef]
- Coelli, T. Estimators and Hypothesis Tests for a Stochastic Frontier Function: A Monte Carlo Analysis. J. Product. Anal. 1995, 6, 247–268. [Google Scholar] [CrossRef]
- Fried, H.O.; Lovell, C.A.K.; Schmidt, S.S.; Yaisawarng, S. Accounting for Environmental Effects and Statistical Noise in Data Envelopment Analysis. J. Product. Anal. 2002, 17, 157–174. [Google Scholar] [CrossRef]
- Daraio, C.; Kerstens, K.; Nepomuceno, T.; Sickles, R.C. Empirical surveys of frontier applications: A meta-review. Int. Trans. Oper. Res. 2019, 27, 709–738. [Google Scholar] [CrossRef]
- Meeusen, W.; van Den Broeck, J. Efficiency estimation from Cobb–Douglas production functions with composed error. Int. Econ. Rev. 1977, 18, 435–444. [Google Scholar] [CrossRef]
- Fethi, D.M.; Pasiouras, F. Assessing bank efficiency and performance with operational research and artificial intelligence techniques: A survey. Eur. J. Oper. Res. 2010, 204, 189–198. [Google Scholar] [CrossRef]
- Cullinane, K.; Wang, T.-F.; Song, D.-W.; Ji, P. The technical efficiency of container ports: Comparing data envelopment analysis and stochastic frontier analysis. Transp. Res. Part A 2006, 40, 354–374. [Google Scholar] [CrossRef]
- Krüger, J.J. A Monte Carlo study of old and new frontier methods for efficiency measurement. Eur. J. Oper. Res. 2012, 222, 137–148. [Google Scholar] [CrossRef]
- Kuosmanen, T.; Saastamoinen, A.; Sipiläinen, T. What is the best practice for benchmark regulation of electricity distribution? Comparison of DEA, SFA and StoNED methods. Energy Policy 2013, 61, 740–750. [Google Scholar]
- Reinhard, S.; Lovell, C.A.K.; Thijssen, G.J. Environmental efficiency with multiple environmentally detrimental variables; estimated with SFA and DEA. Eur. J. Oper. Res. 2000, 121, 287–303. [Google Scholar] [CrossRef]
- Odeck, J. Measuring technical efficiency and productivity growth: A comparison of SFA and DEA on Norwegian grain production data. Appl. Econ. 2007, 39, 2617–2630. [Google Scholar] [CrossRef]
- Iglesias, G.; Castellanos, P.; Seijas, A. Measurement of productive efficiency with frontier methods: A case study for wind farms. Energy Econ. 2012, 32, 1199–1208. [Google Scholar] [CrossRef]
- Zhou, P.; Ang, B.W.; Zhou, D.Q. Measuring economy-wide energy efficiency performance: A parametric frontier approach. Appl. Energy 2012, 90, 196–200. [Google Scholar] [CrossRef]
- Honma, S.; Hu, J.-L. A panel data parametric frontier technique for measuring total-factor energy efficiency: An application to Japanese regions. Energy 2014, 78, 732–739. [Google Scholar] [CrossRef]
- Grolemund, G.; Wickham, H. A Cognitive Interpretation of Data Analysis. Int. Stat. Rev. 2014, 2, 184–204. [Google Scholar] [CrossRef]
- Field, A.; Miles, J.; Field, Z. Discovering Statistics Using R; Sage Publications: Newbury Park, CA, USA, 2012; p. 1470. [Google Scholar]
- Dong, Y.; Hamilton, R.; Tippett, M. Cost efficiency of the Chinese banking sector: A comparison of stochastic frontier analysis and data envelopment analysis. Econ. Model. 2014, 36, 298–308. [Google Scholar] [CrossRef]
- Oh, S.-C.; Shin, J. The impact of mismeasurement in performance benchmarking: A Monte Carlo comparison of SFA and DEA with different multi-period budgeting strategies. Eur. J. Oper. Res. 2015, 240, 518–527. [Google Scholar] [CrossRef]
- Wickham, H. ggplot2. WIREs Comput. Stat. 2011, 3, 180–185. [Google Scholar] [CrossRef]
- Yang, Z.; Roth, J.; Jain, R.K. DUE-B: Data-driven urban energy benchmarking of buildings using recursive partitioning and stochastic frontier analysis. Energy Build. 2018, 163, 58–69. [Google Scholar] [CrossRef]
- Grolemund, G.; Wickham, H. Visualizing Complex Data with Embedded Plots. J. Comput. Graph. Stat. 2015, 24, 26–43. [Google Scholar] [CrossRef]
- Zhu, J. Quantitative Models for Performance Evaluation and Benchmarking, Data Envelopment Analysis with Spreadsheets, 3rd ed.; Springer: New York, NY, USA, 2014. [Google Scholar]
- Jaccard, P. The distribution of the flora in the alpine zone1. New Phytol. 1912, 11, 37–50. [Google Scholar] [CrossRef]
- Stojanov, D. Phylogenicity of B. 1.1. 7 surface glycoprotein, novel distance function and first report of V90T missense mutation in SARS-CoV-2 surface glycoprotein. Meta Gene 2021, 30, 100967. [Google Scholar] [CrossRef] [PubMed]
- Sorensen, T.A. A method of establishing groups of equal amplitude in plant sociology based on similarity of species content and its application to analyses of the vegetation on Danish commons. Biol. Skr. 1948, 5, 1–34. [Google Scholar]
- Stojanov, D.; Lazarova Veljkova, E.; Rubartelli, P.; Giacomini, M. Predicting the outcome of heart failure against chronic-ischemic heart disease in elderly population–Machine learning approach based on logistic regression, case to Villa Scassi hospital Genoa, Italy. J. King Saud Univ.–Sci. 2023, 35, 102573. [Google Scholar] [CrossRef]
- Ward, A.; Sarraju, A.; Chung, S.; Li, J.; Harrington, R.; Heidenreich, P.; Palaniappan, L.; Scheinker, D.; Rodriguez, F. Machine learning and atherosclerotic cardiovascular disease risk prediction in a multi-ethnic population. NPJ Digit. Med. 2020, 3, 125. [Google Scholar] [CrossRef]
- Wannamethee, S.G.; Shaper, A.G.; Perry, I.J. Serum Creatinine Concentration and Risk of Cardiovascular Disease. Stroke 1997, 28, 557–563. [Google Scholar] [CrossRef] [PubMed]
- Tharwat, A.; Gaber, T.; Ibrahim, A.; Hassanien, E.A. Linear discriminant analysis: A detailed tutorial. AI Commun. 2017, 30, 169–190. [Google Scholar] [CrossRef]
- Likas, A.; Vlassis, N.; Verbeek, J.J. The global k-means clustering algorithm. Pattern Recognit. 2003, 36, 451–461. [Google Scholar] [CrossRef]
- Kassambara, A.; Mundt, F. Factoextra: Extract and Visualize the Results of Multivariate Data Analyses. R Package Version 1.0.7. 2020. Available online: https://CRAN.R-project.org/package=factoextra (accessed on 23 November 2022).
- Kuhn, M. Caret: Classification and Regression Training. R Package Version 6.0-86. 2020. Available online: https://CRAN.R-project.org/package=caret (accessed on 23 November 2022).






| OUTPUT | INPUT1 | INPUT2 | INPUT3 | ||
|---|---|---|---|---|---|
| A | 1,2,3,4,5,6,7,8 | 1,4,9,16,25,36,49,64 | 1,8,27,64,125,216,343,512 | 1,16,81,256,625,1296,2401,4096 | |
| πI | 0.70 | 0.79 | 0.85 | ||
| πII | 0.30 | 0.21 | 0.15 | ||
| B | 1,2,3,4,5,6,7,8 | 1,2,3,4,5,6,7,8 | 2,4,6,8,10,12,14,16, | 3,6,9,12,15,18,21,24 | |
| πI | 0.50 | 0.50 | 0.50 | ||
| πII | 0.50 | 0.50 | 0.50 | ||
| C | 8,7,6,5,4,3,2,1 | 8,7,6,5,4,3,2,1 | 16,14,12,10,8,6,4,2 | 24,21,18,15,12,9,6,3 | |
| πI | 5.00 | 5.00 | 5.00 | ||
| πII | −4.00 | −4.00 | −4.00 | ||
| D | 8,7,6,5,4,3,2,1 | 64,49,36,25,16,9,4,1 | 512,343,216,125,64,27,8,1 | 4096,2401,1296,625,81,16,1 | |
| πI | 7.00 | 8.80 | 10.54 | ||
| πII | −6.00 | −7.80 | −9.54 | ||
| E | 1,2,3,4,5,6,7,8 | 1,1,1,1,1,1,1,1 | 2,2,2,2,2,2,2,2 | 3,3,3,3,3,3,3,3 | |
| πI | 0.00 | 0.00 | 0.00 | ||
| πII | 1.00 | 1.00 | 1.00 | ||
| F | 10,10,10,10,10,10,10,10 | 1,2,3,4,5,6,7,8 | 1,4,9,16,25,36,49,64 | 1,8,27,64,125,216,343,512 | |
| πI | 1.00 | 1.00 | 1.00 | ||
| πII | 0.00 | 0.00 | 0.00 |
| Indicators | SFA-TRANSLOG | SFA-LOG | DEA-OUT | DEA-IN | πI | πII |
|---|---|---|---|---|---|---|
| SFA-TRANSLOG | 33.50 | 4.23 | 0.50 | 1.53 | 0.00 | 0.23 |
| SFA-LOG | 4.03 | 33.47 | 0.27 | 2.10 | 0.00 | 0.13 |
| DEA-OUT | 0.73 | 0.87 | 36.67 | 1.50 | 0.00 | 0.23 |
| DEA-IN | 0.43 | 0.17 | 0.03 | 39.20 | 0.00 | 0.17 |
| πI | 0.00 | 0.00 | 0.00 | 0.00 | 40.00 | 0.00 |
| πII | 1.33 | 0.63 | 0.07 | 2.77 | 0.00 | 35.20 |
Disclaimer/Publisher’s Note: The statements, opinions and data contained in all publications are solely those of the individual author(s) and contributor(s) and not of MDPI and/or the editor(s). MDPI and/or the editor(s) disclaim responsibility for any injury to people or property resulting from any ideas, methods, instructions or products referred to in the content. |
© 2023 by the authors. Licensee MDPI, Basel, Switzerland. This article is an open access article distributed under the terms and conditions of the Creative Commons Attribution (CC BY) license (https://creativecommons.org/licenses/by/4.0/).
Share and Cite
Perroni, M.G.; da Veiga, C.P.; Su, Z.; Ramos, F.M.; da Silva, W.V. Dynamic Equilibrium of Sustainable Ecosystem Variables: An Experiment. Sustainability 2023, 15, 6744. https://doi.org/10.3390/su15086744
Perroni MG, da Veiga CP, Su Z, Ramos FM, da Silva WV. Dynamic Equilibrium of Sustainable Ecosystem Variables: An Experiment. Sustainability. 2023; 15(8):6744. https://doi.org/10.3390/su15086744
Chicago/Turabian StylePerroni, Marcos Gonçalves, Claudimar Pereira da Veiga, Zhaohui Su, Fernando Maciel Ramos, and Wesley Vieira da Silva. 2023. "Dynamic Equilibrium of Sustainable Ecosystem Variables: An Experiment" Sustainability 15, no. 8: 6744. https://doi.org/10.3390/su15086744
APA StylePerroni, M. G., da Veiga, C. P., Su, Z., Ramos, F. M., & da Silva, W. V. (2023). Dynamic Equilibrium of Sustainable Ecosystem Variables: An Experiment. Sustainability, 15(8), 6744. https://doi.org/10.3390/su15086744


