Abstract
The transportation of highly viscous oil surrounded by water annulus has been recognized as a feasible option in terms of low-energy consumption and high efficiency. During the process of heavy oil delivery, the problem of pipe fittings is inevitably encountered, and the most common one is elbow assembly. In this present study, simulations for oil-water core annular flow (CAF) through a 90° elbow pipe were performed by computational fluid dynamics (CFD) based on VOF, standard k-ε, and CSF models. Simulation results were consistent with experimental data, which verifies the validity and practicability of the proposed model. The effects of inlet water fraction, superficial velocities of oil and water, oil properties (density and viscosity), and pipe geometry-related parameters (diameter ratio, wall roughness, and surface wettability) on the hydrodynamic performance and stability characteristics were explored. It is revealed that inlet water fraction, superficial velocities of oil and water, oil properties, and pipe geometric parameters do influence the volume fraction of oil and the stability of the water ring. Furthermore, the oil core may adhere to the downstream of the 90° elbow pipe under certain operational conditions. The results could provide a reference for the design of 90° elbow pipe structures and the optimization of operation parameters.
1. Introduction
The increasing demand for oil resources and the lack of light oil resources motivate researchers to find appropriate solutions to transact viscous and heavy crude oil [1]. Among the existing methods, water-lubricated transportation is proved to be a high-efficient and energy-saving solution because it straightforwardly delivers the central oil core carpeted with a thin water film through a pipe, and such a framework is referred to as core-annular flow, significantly reducing the pumping power by reducing the frictional resistance between the fluid and the pipe wall.
Numerous studies concerning core-annular flow have been conducted during the past few decades. The source of experiments in this field could be traced back to Russell and Charles [2], and henceforward, related experimental studies were successively performed by Arney et al. [3], Asiegubu and Asakura [4], Charles et al. [5], and Ingen Housz et al. [6] for horizontal core annular flow; by Bai et al. [7], Bannwart et al. [8], and Cavicchio et al. [9] for vertical upflow; and by Ahmad et al. [10], Grassi et al. [11], and Strazza et al. [12] for inclined flow. These works have mainly focused on flow pattern identification and pressure drop analysis. Some researchers have also put forward different analytical models to evaluate the entire value range of core flow and decompression parameters [3,11,13,14]. In addition, multifarious theories have been proposed to interpret the physical performance of oil-water core-annular flow. Based on the analysis of tension, gravity, and capillary forces, Bentwich [15] propounded different forms of the interface. On the basis of the hydrodynamic lubrication theory, Ooms et al. [16] explored the core-annular flow of high-viscous oil and water to illustrate how to measure the equilibrium of all forces in horizontal pipes. Huang et al. [17] discovered the influences of eccentricity on the friction factor and holdup under laminar and turbulent conditions, finding the concurrent increase in friction factor and eccentricity in turbulent annular flow.
During the past few years, numerous commercial computational fluid dynamics (CFD) software have been advanced to study the flow characteristics of core annular flow. Ghosh et al. [18] simulated the core annular downflow through a vertical pipe in FLUENT software and suggested the concurrent increase in the frictional pressure gradient with the superficial velocities of oil and water and vice versa. Jiang et al. [19] applied the Eulerian model to simulate core annular flow in a U-shaped bend and asserted the suitability of the proposed method. Jiang et al. [20] also performed simulations for core-annular flow through a П bend and discussed the effects of fluid properties, flow parameters, and geometric structures of the pipe regarding hydrodynamic performance and fouling characteristics. Simulation results provided practical values for the design of П bends and the optimization of operational conditions. Subsequently, several numerical simulations have been conducted for core-annular flow through a 90° elbow pipe. Ooms et al. [21] and Park et al. [22] explored the impacts of interfacial tension and secondary flow on the performance of core-annular flow. Wu et al. [23] focused on the impacts of flow parameters and pipe geometry-related parameters on hydrodynamic performance, eccentricity, and pressure drop characteristics.
However, so far, no stability characteristics study on core annular flow in a 90° elbow pipe has been reported. In this present work, a detailed study has been performed to investigate the flow behavior of oil-water core-annular flow as it passes through a 90° elbow pipe, and the impacts of inlet water fraction, superficial velocities of oil and water, oil properties (density and viscosity), and pipe geometric parameters (diameter ratio, wall roughness, and surface wettability) on the hydrodynamic performance and stability characteristics.
2. Simulation Method
2.1. Governing Equations
In the present work, oil-water simulations for the two-phase annular flow were performed by employing the volume of fluid (VOF) approach because it can capture the details of the fluid interface [6,24,25]. In this method, all phases share a set of conservation equations given by Equations (1) and (2).
Mass equation:
where ρ, U, and t signify density, velocity, and time, respectively.
Momentum equation:
where P, g, µ, and F are the pressure in the field, the acceleration of gravity, the viscosity of the fluid, and the force acting on the system, respectively.
Both the density and viscosity of the oil-water compound in each cell can be defined by Equations (3) and (4), and the constraint condition in Equation (5) decides the volume fractions of the water phase (primary phase) and the oil phase (secondary phase).
From the perspective of single-phase pipe flow, the flow in the oil core was in a laminar state, whereas the water flow in the annular film was in a turbulent state. As a result, the standard k-ε model was adopted to simulate different flow conditions and compute the turbulent kinetic energy and the viscous dissipation rate of turbulent viscosity in the flow field [26,27,28].
where k, ε, and µt indicate the turbulent kinetic energy, the dissipation rate, and the eddy viscosity, respectively, and Cµ = 0.09, σk = 1, σε = 1.3, C1ε = 1.44, C2ε = 1.92 are empirical constants.
2.2. Surface Tension and Wall Adhesion
The VOF model considers the impacts of surface tension on the interface between two phases [29,30]. The continuum surface force (CSF) model developed by Brackbill et al. [31] is applied in the present section.
The surface tension of the VOF model can be computed by the following equation.
where σow denotes surface tension, and κ, as an indicator of interface curvature, refers to the divergence of the unit normal, .
where n denotes surface normal defined according to the volume fraction gradient of the oil phase αo.
2.3. Evaluation Parameters
2.3.1. Area-Weighted Average of Oil Volume Fraction
In order to compare and analyze the variation in the oil-phase distribution in the upstream and downstream sections of the 90° elbow pipe, the area-weighted average of the oil volume fraction (αo) in corresponding pipelines was studied.
where Ai and A are the oil-phase area and cross-sectional area of the pipe, respectively.
αo can also be estimated by the empirical formula put forward by Arney et al. [3].
where β is the inlet volume fraction of the water phase.
where Qw and Qo are the volume flow rates of water and oil, respectively.
2.3.2. Length Ratio of the Downstream Pipe at the Starting Point of Instability
The instability of core-annular flow poses a series of problems, such as high pumping energy consumption and low transportation efficiency during the transportation of viscous oil. The main objective of the present research was to find suitable operational conditions and geometrical parameters to improve water ring stability. The length ratio of the horizontal elbow pipe at the initiation point of instability (li) can be defined as
where Li is the length between the instability initiation point and section C, and Lt is the total length of the straight pipe (Figure 1).
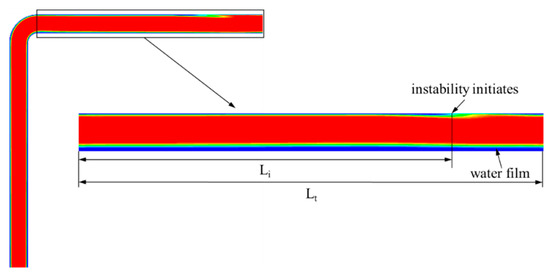
Figure 1.
Instability in the elbow pipe.
3. Numerical Solution
3.1. Geometry Model
The three-dimensional model of a horizontal pipe with a 90° elbow is displayed in Figure 2. The model consisted of two straight pipes with an internal diameter of 0.025 m, a length of 0.3 m, and a 90° elbow with a 0.025 m curvature radius, and the curvature ratio (2R/D) was 2. In order to make a comparative study on the variation in flow parameters, nine cross-sections (A–I) in the calculation domain were selected: two of them were in the upstream at a distance of 0.15 m and 0.3 m away from the inlet plane, and the rest sections were equally spaced (0.05 m) in the downstream, i.e., the distance between each section is 0.05 m. In order to build the core annular flow, coaxial entry of both fluids with white oil at the center and water at the annular area has been considered, as shown in Figure 2.
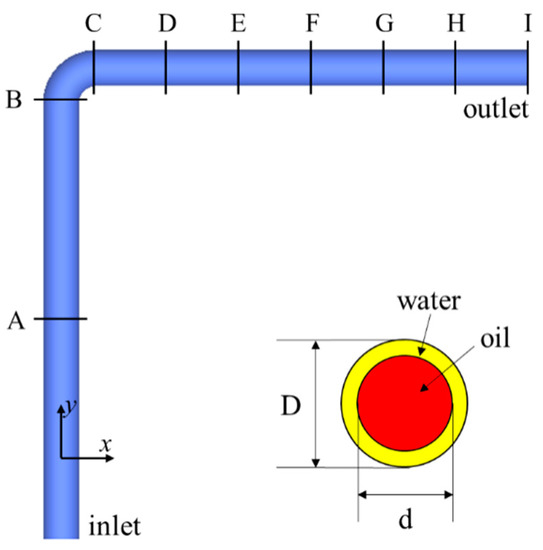
Figure 2.
Model geometry.
3.2. Meshing of the Model
The meshing of the computational domain was accomplished in ANSYS Workbench software. Figure 3 displays the meshed geometry and the mesh in the cross-sectional plane. The mesh consisted of 327,964 hexahedral elements and 343,830 nodes. Table 1 presents the results of the mesh independence analysis. No significant change in the depressurization of the oil-water two-phase horizontal pipe flow was noticed as the number of cells increased from 110,808 to 504,560. Hence, in order to guarantee high accuracy and low computational cost, the mesh with a cell number of 327,964 was selected.
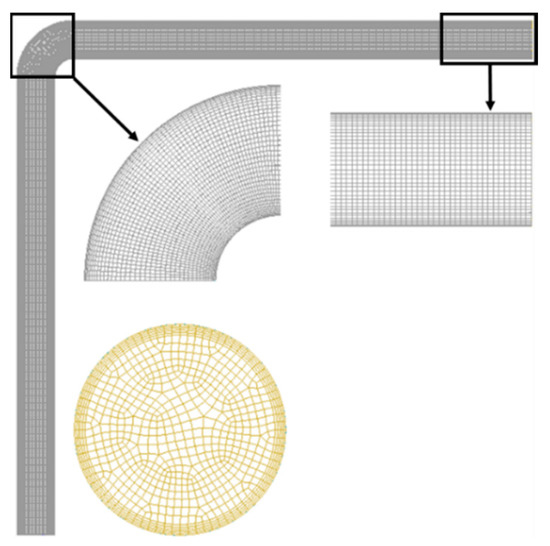
Figure 3.
Meshed geometry.

Table 1.
Mesh independence analysis.
3.3. Boundary Conditions
3.3.1. Inlet Boundary Conditions
Suppose that the velocity profile is uniform at the inlet plane where the oil rests in the center region while the water at the outer annular area. Thus, ux = uo for 0 ≤ r ≤ 0.0105 m, and ux = uw for 0.0105 ≤ r ≤ 0.0125 m. The turbulence intensity (I) and the hydraulic diameter (Dh = 0.025 m) were selected as turbulence specification parameters.
where Re is Reynolds number.
3.3.2. Wall Boundary Conditions
The inner surface of the pipe was covered by a stationary wall with no-slip and no-penetration attributes. Moreover, the configuration of the contact angle between the water and the pipe wall conformed to specific rules and regulations [20].
3.3.3. Outlet Boundary Conditions
The pressure outlet serving as the outlet boundary condition had a turbulence intensity of 5% and a hydraulic diameter of 0.025 m.
3.4. Solution Strategy and Convergence Criterion
Influenced by the dynamic properties of the oil-water two-phase flow, a transient simulation was performed based on the pressure-based segregated algorithm with a time step of 0.0001 s. The governing equations were discretized by different methods. The PRESTO! scheme was adopted to discretize the continuity equation, whereas the equations for momentum, turbulent kinetic energy, and dissipation rate executed the second-order upwind scheme. The PISO scheme was applied for the pressure–velocity coupling treatment. In all cases, the calculation domain was initialized based on water inlet flow conditions.
The numerical computation convergence was accomplished when the residuals of all involved variables (mass, velocity components, turbulence parameters, and volume fraction) decreased by four levels of magnitude.
4. Validation
To confirm the obtained simulation results, an experiment was carried out inside a PVC pipe with an inner diameter of 0.025 m (mineral oil (ρo = 902 kg/m3, µo = 1.0553 Pa·s) and tap water were selected as test fluids). The superficial velocity ranges of oil and water were 0.36–0.96 m/s and 0.13–0.48 m/s, respectively. A high-speed camera Revealer2F04C was employed to record flow images, and a differential pressure transmitter CYQ-3051DP was used to measure frictional pressure gradients under different combinations of superficial velocities of oil and water.
Figure 4 displays the results of a few representative simulations and experiments of flow distributions, and a rational matching of flow pattern between simulation and experimental results was observed. Furthermore, Figure 5a,b compares the obtained simulation and experimental data for the upstream and downstream pressure gradients at the 90° elbow. Both upstream and downstream pressure gradient statistics predicted by the model were within ±20%.
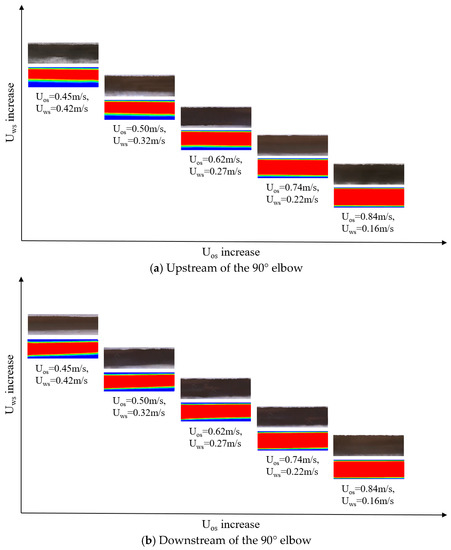
Figure 4.
Comparison of simulation and test results for flow patterns.
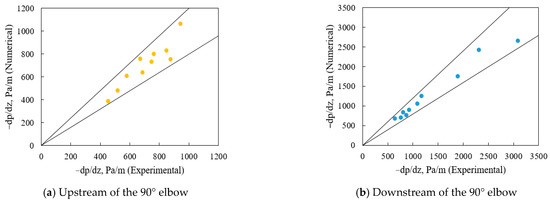
Figure 5.
Comparison of tested and predicted friction pressure gradients.
5. Results and Discussion
The current section introduces the evolution of the oil-water core annular flow from the interface contour in the horizontal elbow pipe. The impacts of inlet water fraction, superficial velocities of oil and water, oil properties (density and viscosity), and geometric parameters of the pipe (diameter ratio, wall roughness, and surface wettability) on internal flow hydrodynamics are discussed in detail. The stability of the core-annular flow and the tendency of fouling at the horizontal elbow are also studied.
5.1. Development of the Oil-Water Core-Annular Flow
Figure 6 demonstrates the cross-sectional contours of the oil-phase volume distribution at six different sections (A, B, C, E, G, and I) shown in Figure 2 during different time frames of the core-annular flow evolution in the horizontal elbow pipe for Uos = 0.36 m/s and Uws = 0.13 m/s (red indicates the oil phase (αo = 1); blue denotes the water phase (αo = 0); and the remaining colors denote the cells containing the interface where αo varies in the range of 0 to 1). Evidently, water formed a film around the wall of the pipe, and oil passed through the central core. In the upstream part of the 90° elbow (sections A and B), the oil core moved upward through the pipe as a result of buoyancy generated by the density difference between oil and water. In the downstream pipe (sections C, E, G, and I), the oil core was attached to the exterior of the pipe due to the centrifugal force.
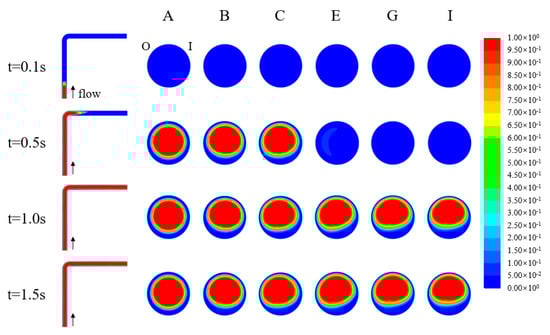
Figure 6.
Evolution of the core flow during different time frames: Uos = 0.5 m/s and Uws = 0.27 m/s (O: outer curve and I: inner curve).
5.2. Hydrodynamic Study
Figure 7 displays the velocity contour and vector of the core-annular flow inside the horizontal elbow pipe at Uos = 0.5 m/s and Uws = 0.27 m/s. Clearly, Figure 7a shows that the central region had a much higher velocity that progressively declined to zero at the wall. Further, the velocity distribution was uniform and symmetrical in section A of the upstream pipe. However, the velocity of the exterior pipe increased when the core-annular flow passed through the elbow because of the sudden change in the flow direction and the action of the centrifugal force. Figure 7b presents the distribution of the velocity vector inside the horizontal elbow pipe and it is noticeable that no secondary flow was formed near the elbow. Simulation results show good consistency with the findings of Jiang et al. [20] for oil-water downflow through a П bend with filleted elbows.
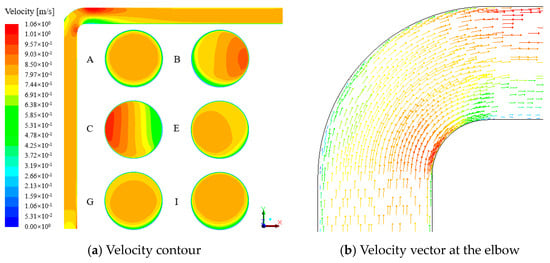
Figure 7.
Velocity contour and vector of the core-annular flow through the elbow pipe: Uos = 0.5 m/s and Uws = 0.27 m/s.
The pressure contour of the oil-water core-annular flow is presented in Figure 8. The gross pressure progressively decreased as the flow approached the elbow pipe on the way to the outlet. Moreover, similarly to the distribution of the velocity, the pressure distribution is axisymmetric in the upstream pipe and tends to become asymmetric after the flow goes through the elbow.
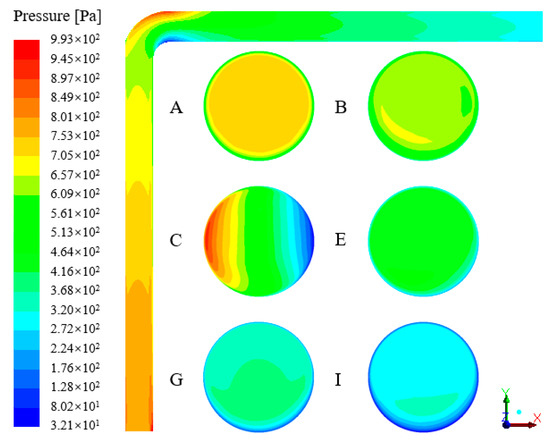
Figure 8.
Gross pressure contour of the core-annular flow through the elbow pipe: Uos = 0.5 m/s and Uws = 0.27 m/s.
5.2.1. Effect of Inlet Water Fraction
Figure 9 reveals the impact of the inlet water fraction on the oil volume fraction in the elbow pipe for Uos = 0.28–0.96 m/s and Uws = 0.11–0.48 m/s. It is noticeable that αo decreased almost linearly with the increasing β. Therefore, it is better to control the inlet water fraction below 0.3 to preserve a high oil transportation efficiency during the core-annular flow through the elbow pipe.
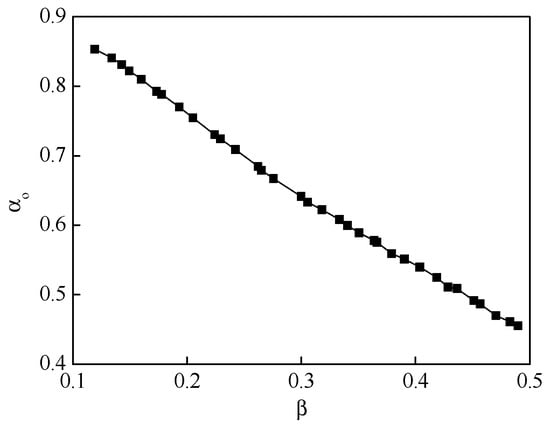
Figure 9.
Effect of inlet water fraction on the oil volume fraction.
5.2.2. Effect of Superficial Velocities of Oil and Water
Figure 10 uncovers the impacts of the superficial velocities of oil and water on the oil volume fraction. It was achieved by holding the velocity of one fluid phase constant and gradually varying the velocity of the other phase. Figure 10a plots the variation in αo with Uos = 0.28–0.96 m/s for Uws = 0.22 m/s. It is noticeable that αo increased with the increase in Uos, and it can be ascribed to the shrinkage of the water film thickness and the acceleration of the oil’s superficial velocity. To investigate the variation in αo with Uws, Uws was varied from 0.11 m/s to 0.48 m/s and Uos was kept constant at 0.74 m/s. This variation is depicted in Figure 10b, and it is clear that αo decreased sharply with the increasing Uws.
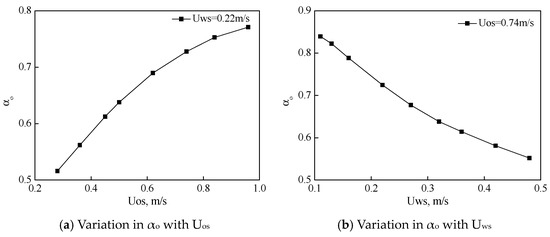
Figure 10.
Variation in the oil volume fraction with the superficial velocities of oil and water.
5.2.3. Effect of Oil Properties
The impact of oil properties (density and viscosity) on the oil volume fraction for Uos = 0.5 m/s and Uws = 0.22–0.32 m/s was investigated. It is clear from Figure 11a,b that the density and viscosity of oil had no significant effect on αo.
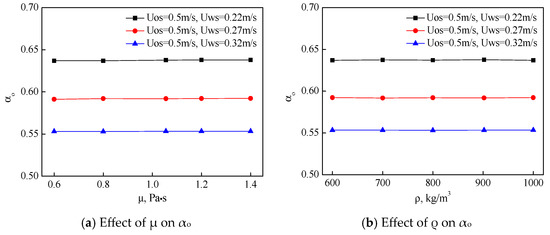
Figure 11.
Effects of oil properties on the oil volume fraction.
5.2.4. Effect of the Geometric Parameters of the Pipe
The impact of geometric parameters of the pipe (diameter ratio d/D, wall roughness e, and surface wettability) on the oil volume fraction were explored. Surface wettability was expressed by the static contact angle (θ) between the water and the interior pipe surface.
Figure 12a presents the relationship between the diameter ratio and oil volume fraction. The αo increased with the increase in d/D; it happened because the growth of d expanded the area of the oil inlet, leading to the amplification of αo.
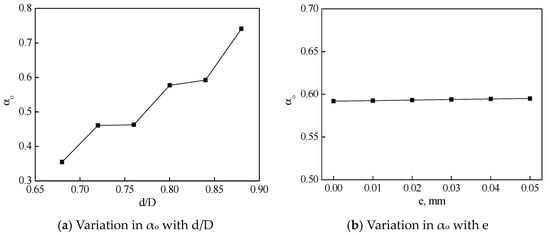
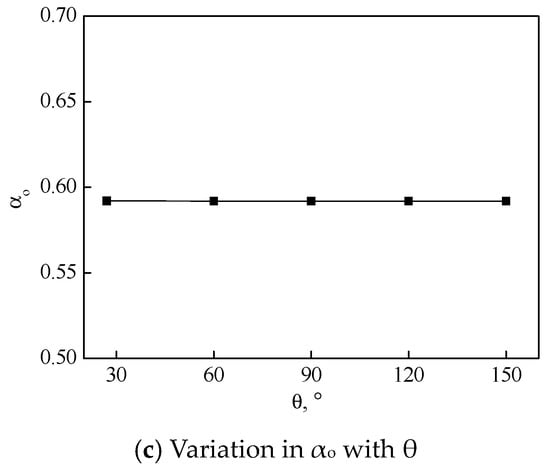
Figure 12.
Variation in the oil volume fraction with different pipe geometric parameters.
To observe the impact of wall roughness on the oil volume fraction, different roughness heights were taken into account during the simulation. Figure 12b expresses that αo had a slight increase with the increase in e.
To further understand the variation in the oil volume fraction with the wetting behavior of the inner pipe surface, the static contact angle was set to 27° (water-wet surface), 90° (neutral surface), and 150° (oil-wet surface) [32]. Figure 12c illustrates the result of the influence of θ on αo. It is observable that αo had almost no change with the increasing θ.
Therefore, it can be inferred that for d/D = 0.80–0.88, e = 0.03–0.05 mm, and θ = 27–150°, αo was at a relatively high level, which is favorable for heavy oil transportation.
5.3. Stability Study
In the present analysis, obviously, the disruption of the water annulus occurred in the downstream pipe in some cases, whereas the water annulus remained stable in the upstream pipe. Hence, in the following section, the flow in the downstream pipe is only considered. The impacts of inlet water fraction, superficial velocities of oil and water, oil properties, and geometric parameters of the pipe on the water ring stability were investigated. Moreover, the variation trends of the pressure drop ΔP, and the volume fractions of oil and water in different cross-sections along the flowline were analyzed, and the position of the starting instability point was determined by the length ratio li (Equation (17)).
5.3.1. Effect of Inlet Water Fraction
In order to explore the impact of inlet water fraction on stability, the range of β was set to 0.13–0.39. Figure 13 records the variation in characterization parameters. Figure 13a displays the phase configurations at different cross-sections (C–I, the corresponding x-axis coordinate values are 25 mm, 75 mm, 125 mm, 175 mm, 225 mm, 275 mm, and 325 mm, respectively) of the downstream pipe. It is observable that for the water fraction below or equal to 0.18, the mixing phenomenon of oil and water occurred at the oil-water interface. Hence, the boundary interface became blurred; consequently, an unsteady flow structure was developed. However, for the water fraction above 0.18, the eccentric annular flow remained in a stable state, where the oil core was completely wrapped in the water layer and had no chance to foul the pipe wall.
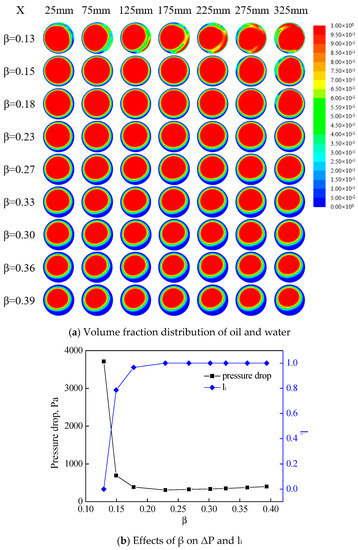
Figure 13.
Effect of inlet water fraction on stability.
The pressure drops and length ratios for different inlet water fractions are presented in Figure 13b. It is evident that the pressure drop first declined rapidly to the minimum value of 308.8 Pa at β = 0.23 and then grew smoothly with the increasing β. On the contrary, the length ratio increased abruptly initially and then became constant. When the β value was very low, the water film in the annulus was discontinuous and could not prevent contact between the viscous oil and the pipe wall, causing a large pressure drop. With the increase in β, the stability of the water ring was improved to a great extent, and the pipe wall was only wetted by the water phase; thus, a smaller pressure drop was achieved. However, the further increase in β could not significantly improve the stability of the water ring but increase the total flow rate of oil and water, resulting in a minor increase in the pressure drop.
In summary, the increase in the inlet water fraction can ameliorate the stability of the water ring but the excessively high water fraction will not only reduce the volume fraction of oil (see Section 5.2.1) but also increase the pressure drop. Therefore, there is a critical value or an optimal range of inlet water fraction, which ensures the volume fraction of oil is maintained at a high value and the pressure drop maintained at a low value.
5.3.2. Effect of Superficial Velocities of Oil and Water
Subsequently, we conducted some tests to know how water ring stability varies under different circumstances accompanied by the superficial velocities of oil and water. In view of the above analysis on the relationship of stability and inlet water fraction, carried out through maintaining Uos at 0.74 m/s and increasing Uws from 0.11 m/s to 0.48 m/s, the change law of stability with water fraction can be regarded as the variation law of stability with water superficial velocity. For this reason, only the influence of oil superficial velocity on stability is studied in this part.
It is noticeable from Figure 14a that the mixing phenomenon of oil and water was intensive at Uos = 0.28 m/s and progressively weakened with Uos until it disappeared after 0.5 m/s. It happened because the flow pattern in the pipe mainly depended on the ratio of gravity to viscous force (G/V = ΔρgD2/(µU)). When the ratio was small (the viscous force was predominant between these two), it generated the core-annular flow regime. G/V significantly declined with the increasing Uos. Consequently, the increasing oil superficial velocity improved the stability of the water ring to some extent, and it was also true for water velocity (Section 5.3.1).
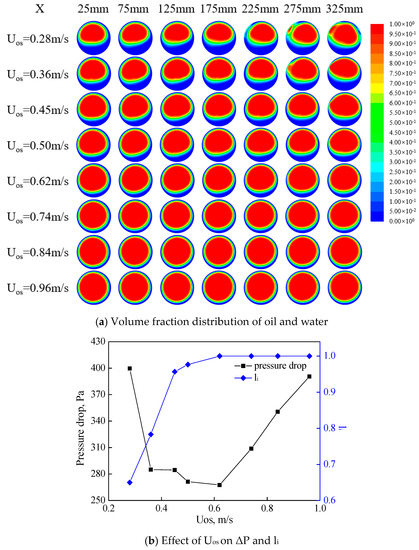
Figure 14.
Effect of oil superficial velocity on stability.
Figure 14b illustrates the impacts of Uos on pressure drop and length ratio in the downstream pipe. Clearly, the pressure drop declined with the increase in Uos. When Uos reached 0.62 m/s, the pressure drop presented a tendency of linear increase. The length ratio increased with the increase in Uos. When Uos reached 0.62 m/s, the length ratio remained unchanged. At the same time, when Uos was greater than 0.62 m/s, the oil volume fraction was at a high value (Section 5.2.2). Considering the parameters such as pressure drop, length ratio, and volume fraction of oil, the oil’s superficial velocity is preferably taken as 0.62 m/s when heavy oil is shipped through a water ring.
5.3.3. Effect of Oil Properties
The impacts of oil properties on stability are in Figure 15 and Figure 16. It is clear that both the density and viscosity of oil were indispensable influencing factors for the evaluation of stability. Oil with higher density and viscosity remained at a clearer oil-water interface, resulting in smaller eccentricity, a lower pressure drop, a higher length ratio, and better stability. The increase in ρo (decrease in Δρ) and µo caused a decline in gravity and an increase in the viscous force; thus, the decrease in the ratio between gravity and viscosity force promoted the transformation of the flow configuration from gravity force-leading to viscous force-leading. Moreover, as the oil volume fraction hardly changed with oil properties (Section 5.2.3), the density and viscosity of oil should be larger to ensure a stable flow with low energy consumption.
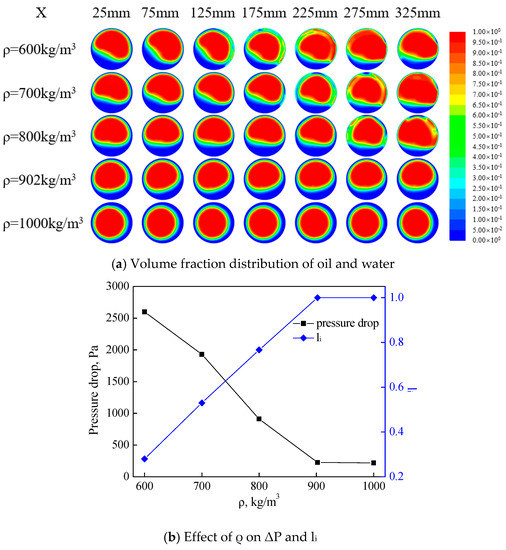
Figure 15.
Effect of oil density on stability.
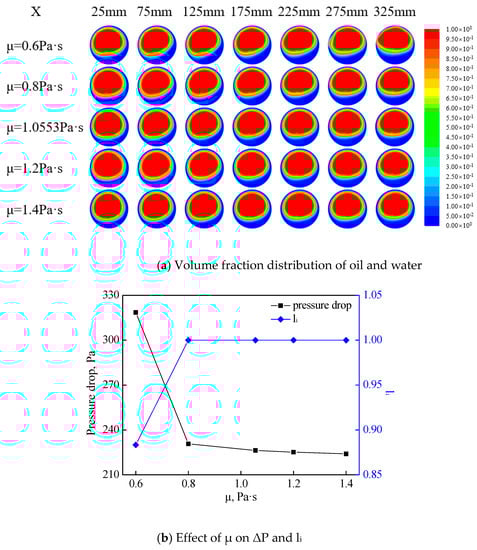
Figure 16.
Effect of oil viscosity on stability.
5.3.4. Effect of Geometric Parameters of the Pipe
Figure 17, Figure 18 and Figure 19 reveal the impacts of diameter ratio (d/D), wall roughness (e), and contact angle (θ) on stability.
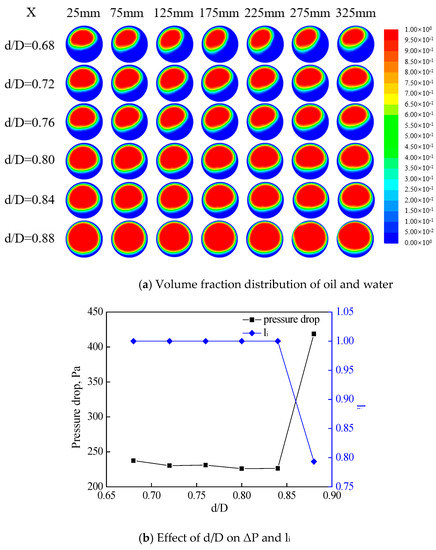
Figure 17.
Effect of diameter ratio on stability.
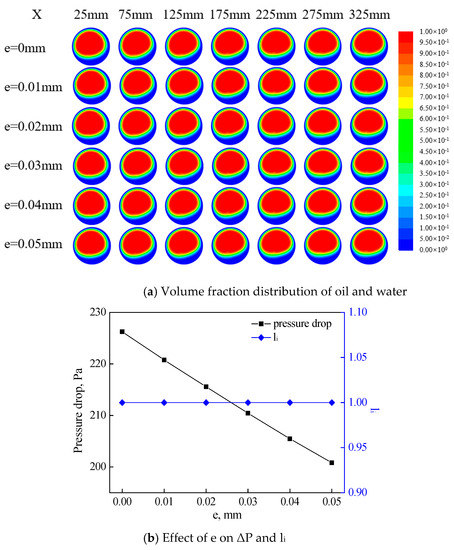
Figure 18.
Effect of wall roughness on stability.
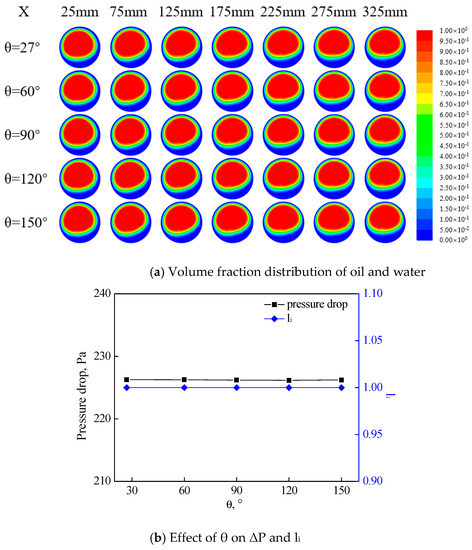
Figure 19.
Effect of contact angle on stability.
The range of the diameter ratio was set to 0.68–0.88. Figure 17 uncovers the variation in characteristic parameters in the downstream straight pipe with d/D for Uos = 0.5 m/s and Uws = 0.27 m/s. The core oil surrounded by the water ring flowed forward, and the flow was stable in the entire flow domain, except for the case of d/D = 0.88 (Figure 17a). Figure 17b expresses that the increase in d/D failed to generate prominent impacts on water stability. With the increase in d/D (beyond 0.84), the stability of the water ring underwent a sharp reduction. This happened because the increase in d/D was accompanied by the decrease in the water film thickness; hence, the core oil easily ruptured the annular water film and attached to the inner pipe wall.
It is observable from Figure 18a that no mixing phenomenon occurred at the oil-water interface, and the boundary between oil and water was clearly demarcated; hence, the core-annular flow was stable in the entire pipeline regardless of the wall roughness. The same conclusion can be drawn from the change rule of length ratio with wall roughness shown in Figure 18b, where li did not vary with e. Unlike the length ratio, pressure drop exhibited a continuous downward trend with the increasing roughness of the inner pipe wall surface, and it can be attributed to the growing area on the surface of the rougher pipe wall. Due to the expansion of the superficial area, pits and grooves were prone to be appropriated by the water phase, thus enhancing the adsorption efficiency and the water ring stability. However, the increase in the wall roughness also increased the frictional resistance between the solid wall and the fluid medium. Therefore, during the design of the transportation scheme for heavy oil, the influences of frictional resistance, and water ring stability should be considered comprehensively.
Figure 19 illustrates the effect of contact angle on stability. No considerable discrepancy in phase distribution under different contact angles was observed, and both the pressure drop and length ratio curves were horizontal straight lines; therefore, it can be inferred that θ had little impact on the stability of the aqueous film. It probably happened because a stable core-annular flow was maintained under the conditions of Uos = 0.5 m/s and Uws = 0.27 m/s. Furthermore, the variation in pipe wall wettability caused no beneficial or detrimental impacts on water ring stability.
Therefore, it can be inferred that for d/D = 0.72–0.84, e = 0.03–0.05 mm, and θ = 27–150°, an appropriate stability situation of the water ring was maintained.
6. Conclusions
In the current study, the performance of high viscous oil-water core-annular flow through a 90° horizontal elbow pipe was analyzed by CFD. Simulation results complied well with experimental data. The impacts of inlet water fraction, superficial velocities of oil and water, oil properties, and geometric parameters of the pipe on the oil volume fraction and the stability of the water ring were discussed. The main observations are depicted below.
From the simulations, it can be inferred that inlet water fraction, superficial velocities of oil and water, oil properties, and geometric parameters do influence the volume fraction of oil and the stability of core annular flow in the downstream of a 90° elbow pipe. The increasing inlet water fraction enhanced the stability of the water ring, and high superficial velocities of oil and water were preferable. Heavy oil with large density and high viscosity also improved the stability of the water film, the eccentricity of the oil core after the core annular flow passes through the 90° elbow was low, and it was not easy to pollute the pipe wall surface. Therefore, the density and viscosity of heavy oil should be maintained at a low value in actual transportation. Furthermore, the suitable elbow pipe geometric parameters were d/D = 0.72–0.84, e = 0.03–0.05 mm, and θ = 27–150°. These results could provide a basis for the design of 90° elbow pipe structures and the optimization of operation parameters, considering the volume fraction of oil and the stability of the water ring comprehensively.
Author Contributions
All authors made substantial contributions to the manuscript. The manuscript to be submitted was approved by all the authors. The authors did the following work: methodology, investigation, data curation, and original draft preparation, X.Y. (Xiaoyun Yin); investigation, methodology, and supervision, J.L.; investigation, validation, and review and editing, M.W.; review and editing, X.D. and X.Y. (Xiangyang You); formal analysis and resources, M.S. and P.Z.; formal analysis and validation, J.J. and J.S. All authors have read and agreed to the published version of the manuscript.
Funding
This program was sponsored by the National Natural Science Foundation of China (nos. U19B2012, 52106208) and the Natural Science Foundation of Sichuan Province (no. 2023NSFSC0924).
Institutional Review Board Statement
Not applicable.
Informed Consent Statement
Not applicable.
Data Availability Statement
Not applicable.
Conflicts of Interest
The authors declare no conflict of interest.
Nomenclature
| C1ε | Constant |
| C2ε | Constant |
| Cµ | Constant |
| d | Diameter of oil inlet, m |
| D | Pipe diameter, m |
| e | Wall roughness |
| F | Body force, kg/m3 |
| g | Gravitational constant, m/s2 |
| I | Turbulence intensity |
| k | Turbulent kinetic energy, m2/s2 |
| li | Length ratio of the elbow pipe at point of instability |
| Li | Length of instability point, m |
| Lt | Total length of the straight pipe, m |
| P | Pressure in the flow field, Pa |
| Qo | Oil flow rates, m3/s |
| Qw | Water flow rates, m3/s |
| t | Time, s |
| U | Velocity, m/s |
| Uos | Oil superficial velocity, m/s |
| Uow | Water superficial velocity, m/s |
| Greek letters | |
| α | Phase volume fraction |
| β | Inlet volume fraction of water phase |
| ε | Dissipation rate, m2/s3 |
| θ | Static contact angle, ° |
| µ | Viscosity, Pa·s |
| µt | Eddy viscosity, Pa·s |
| ρ | Density, kg/m3 |
| σow | Surface tension coefficient, N/m |
| σk | Constant |
| σε | Constant |
| Subscripts | |
| o | Oil phase |
| w | Water phase |
References
- Jing, J.Q.; Yin, X.Y.; Mastobaev, B.N.; Vavar, A.R.; Sun, J.; Wang, S.H.; Liu, H.P.; Zhuang, L.Q. Experimental study on highly viscous oil-water annular flow in a horizontal pipe with 90° elbow. Int. J. Multiph. Flow 2021, 135, 103499. [Google Scholar] [CrossRef]
- Russell, T.W.F.; Charles, M.E. The effect of less viscous liquid in the laminar flow of two immiscible liquids. Can. J. Chem. Eng. 1959, 37, 18–24. [Google Scholar] [CrossRef]
- Arney, M.S.; Bai, R.; Guevara, E.; Joseph, D.D.; Liu, K. Friction factor and holdup studies for lubricated pipelining—I Experiments and correlations. Int. J. Multiph. Flow 1993, 19, 1061–1076. [Google Scholar] [CrossRef]
- Asiegubu, P.C.; Asakura, K. Experimental study on pressure loss of horizontal core-annular flow. J. Solid Mech. Mater. Eng. 2008, 2, 831–841. [Google Scholar] [CrossRef]
- Charles, M.E.; Govier, G.W.; Hodgson, G.W. The horizontal pipeline flow of equal density of oil-water mixtures. Can. J. Chem. Eng. 1961, 39, 17–36. [Google Scholar] [CrossRef]
- Ingen Housz, E.M.R.M.; Ooms, G.; Henkes, R.A.W.M.; Pourquie, M.J.B.M.; Kidess, A.; Radhakrishnan, R. A comparison between numerical predictions and experimental results for horizontal core-annular flow with a turbulent annulus. AICHE J. 2014, 60, 3046–3056. [Google Scholar] [CrossRef]
- Bai, R.; Chen, K.; Joseph, D.D. Lubricated pipelining: Stability of core-annular flow: Part 5. Experiments and comparison with theory. J. Fluid Mech. 1992, 240, 97–132. [Google Scholar] [CrossRef]
- Bannwart, A.C.; Rodriguez, O.M.H.; Biazussi, J.L.; Martins, F.N.; Selli, M.F.; de Carvalho, C.H.M. Water-assisted flow of heavy oil in a vertical pipe: Pilot-scale experiments. Int. J. Chem. React. Eng. 2012, 10, 1–16. [Google Scholar] [CrossRef]
- Cavicchio, C.A.M.; Biazussi, J.L.; de Castro, M.S.; Bannwart, A.C.; Rodriguez, O.M.H.; de Carvalho, C.H.M. Experimental study of viscosity effects on heavy crude oil-water core-annular flow pattern. Exp. Therm. Fluid Sci. 2017, 92, 270–285. [Google Scholar] [CrossRef]
- Ahmad, A.; Nsom, B.; Decruppe, J.P. Slope effect on core-annular flow. Rheol. Acta 2011, 50, 945–954. [Google Scholar] [CrossRef]
- Grassi, B.; Strazza, D.; Poesio, P. Experimental validation of theoretical models in two-phase high-viscosity ratio liquid-liquid flows in horizontal and slightly inclined pipes. Int. J. Multiph. Flow 2008, 34, 950–965. [Google Scholar] [CrossRef]
- Strazza, D.; Grass, B.; Demori, M.; Ferrari, V.; Poesio, P. Core-annular flow in horizontal and slightly inclined pipes: Existence, pressure drops, and hold-up. Chem. Eng. Sci. 2011, 66, 2853–2863. [Google Scholar] [CrossRef]
- Rodriguez, O.M.H.; Bannwart, A.C.; de Carvalho, C.H.M. Pressure loss in core-annular flow: Modeling, experimental investigation and full-scale experiments. J. Pet. Sci. Eng. 2009, 65, 67–75. [Google Scholar] [CrossRef]
- Vanegas Parda, J.W.; Bannwart, A.C. Modeling of vertical core-annular flows and application to heavy oil production. J. Energy Resour. Technol. 2001, 123, 194–199. [Google Scholar] [CrossRef]
- Bentwich, M. Two-phase axial laminar flow in a pipe with naturally curved surface. Chem. Eng. Sci. 1971, 31, 71–76. [Google Scholar] [CrossRef]
- Ooms, G.; Seoal, A.; Vanderwees, A.J.; Meerhoff, R.; Oliemans, R.V.A. A theoretical model for core-annular flow of a very viscous oil core and a water annulus through a horizontal pipe. Int. J. Multiph. Flow 1984, 10, 41–60. [Google Scholar] [CrossRef]
- Huang, A.; Christodoulou, C.; Joseph, D.D. Friction factor and hold up studies for lubricated pipelining—II Laminar and k-ε models of eccentric core flow. Int. J. Multiph. Flow 1994, 20, 481–491. [Google Scholar] [CrossRef]
- Ghosh, S.; Das, G.; Das, P.K. Simulation of core annular downflow through CFD—A comprehensive study. Chem. Eng. Process. 2010, 49, 1222–1228. [Google Scholar] [CrossRef]
- Jiang, F.; Wang, Y.J.; Ou, J.J.; Chen, C.G. Numerical simulation of oil-water core annular flow in a U-bend based on the Eulerian model. Chem. Eng. Technol. 2014, 37, 659–666. [Google Scholar] [CrossRef]
- Jiang, F.; Wang, Y.J.; Ou, J.J.; Xiao, Z.M. Numerical simulation on oil-water annular flow through the П bend. Ind. Eng. Chem. Res. 2014, 53, 8235–8244. [Google Scholar] [CrossRef]
- Ooms, G.; Pourquie, M.J.B.M.; Westerweel, J. Numerical study of laminar core-annular flow in a torus and in a 90° pipe elbow. AIChE J. 2015, 61, 2319–2328. [Google Scholar] [CrossRef]
- Park, S.M.; Ooms, G.; Pourquie, M.J.B.M. Numerical simulation of laminar core-annular flow in a 90° elbow. WIT Trans. Eng. Sci. 2015, 89, 261–271. [Google Scholar] [CrossRef]
- Wu, J.Q.; Jiang, W.M.; Liu, Y.; He, Y.; Chen, J.N.; Qiao, L.; Wang, T.Y. Study on hydrodynamic characteristics of oil-water annular flow in 90° elbow. Chem. Eng. Res. Des. 2020, 153, 443–451. [Google Scholar] [CrossRef]
- Kaushik, V.V.R.; Ghosh, S.; Das, G.; Das, P.K. CFD simulation of core annular flow through sudden contraction and expansion. J. Pet. Sci. Eng. 2012, 86–87, 153–164. [Google Scholar] [CrossRef]
- Shi, J.; Gourma, M.; Yeung, H. CFD simulation of horizontal oil-water flow with matched density and medium viscosity ratio in different flow regimes. J. Pet. Sci. Eng. 2017, 151, 373–383. [Google Scholar] [CrossRef]
- Duran, J.E.; Taghipour, F.; Mohseni, M. CFD modeling of mass transfer in annular reactors. Int. J. Heat Mass Transf. 2009, 52, 5390–5401. [Google Scholar] [CrossRef]
- Dehkordi, P.B.; Colombo, L.P.M.; Guilizzoni, M.; Sotgia, G. CFD simulation with experimental validation of oil-water core-annular flows through venturi and nozzle flow meters. J. Pet. Sci. Eng. 2017, 149, 540–552. [Google Scholar] [CrossRef]
- Tripathi, S.; Bhattacharya, A.; Singh, R.; Tabor, R.F. Lubricated transport of highly viscous non-Newtonian fluid as core-annular flow: A CFD study. Procedia IUTAM 2015, 15, 278–285. [Google Scholar] [CrossRef]
- Beerens, J.C.; Ooms, G.; Pourquie, M.J.B.M.; Westerweel, J. A comparison between numerical predictions and theoretical and experimental results for laminar core-annular flow. AIChE J. 2014, 60, 3046–3056. [Google Scholar] [CrossRef]
- Gupta, R.; Turangan, C.K.; Manica, R. Oil-water core-annular flow in vertical pipes: A CFD study. Can. J. Chem. Eng. 2016, 94, 980–987. [Google Scholar] [CrossRef]
- Brackbill, J.; Kothe, D.B.; Zemach, C. A continuum method for modeling surface tension. J. Comput. Phys. 1992, 100, 335–354. [Google Scholar] [CrossRef]
- Dos Santos, R.G.; Mohamed, R.S.; Bannwart, A.C.; Loh, W. Contact angle measurements and wetting behavior of inner surfaces of pipelines exposed to heavy crude oil and water. J. Pet. Sci. Eng. 2006, 51, 9–16. [Google Scholar] [CrossRef]


Disclaimer/Publisher’s Note: The statements, opinions and data contained in all publications are solely those of the individual author(s) and contributor(s) and not of MDPI and/or the editor(s). MDPI and/or the editor(s) disclaim responsibility for any injury to people or property resulting from any ideas, methods, instructions or products referred to in the content. |
© 2023 by the authors. Licensee MDPI, Basel, Switzerland. This article is an open access article distributed under the terms and conditions of the Creative Commons Attribution (CC BY) license (https://creativecommons.org/licenses/by/4.0/).