Abstract
This paper aims to enhance the speed of rigid overhead systems by investigating the impact of important parameters of the overhead system and pantograph on the interaction performance, specifically the contact force between the panhead of the pantograph and the contact wire of the overhead system. To accomplish this, this paper first builds a rigid overhead system model based on the finite element method. The pantograph–contact wire interaction simulation is achieved by including a three-stage lumped mass pantograph model. The Sobol sensitivity analysis method is utilised to determine the contribution of different parameters to the contact force standard deviation. Subsequently, an optimisation approach is used to minimise the contact standard deviation at various speeds by adopting five crucial parameters. The sensitivity analysis of 13 variables indicates that the span length, bending stiffness, and linear density of the conductor rail, and the masses of the pantograph head and upper frame are the most relevant variables for the contact force standard deviation. The quantification of each parameter’s contribution reveals that the increase in bending stiffness generally has a positive effect in reducing the contact force fluctuation, while the decreases in other variables are preferred. The optimisation analysis shows that the optimised contact force standard deviation decreases by 39.18%, 66.77%, and 61.02% at speeds of 90 km/h, 120 km/h, and 150 km/h, respectively, compared to the original values.
1. Introduction
In the context of global carbon neutrality, electrified railways are favoured by a number of countries as a sustainable transportation mode [1,2]. In electrified railways, the electric current is usually transmitted to trains through overhead systems. In open-air railway lines, the traditional flexible overhead system is generally composed of a contact wire, a messenger wire, and several droppers. The overhead system is constructed along the track and transmits electrical energy through interaction between the contact wire and the pantograph installed on the car body’s roof. However, in tunnels, a rigid overhead system (also known as a rigid catenary or rigid contact line system) is generally used, which mainly includes a contact wire, a conductor rail, and supports, among other components, as shown in Figure 1. Compared with the flexible overhead system, the structure of the rigid overhead system is simpler and eliminates the need for poles in the tunnel. It can be directly installed at the top of the tunnel and is easy to maintain. Currently, the rigid system has been widely used in urban rail transit, and its operating speed is constantly increasing, but most of them are operating at speeds of lower than 120 km/h. Effective interaction between the pantograph and overhead system is crucial for reducing traffic disruptions and maintenance costs, while also enhancing the sustainability of rail transportation [3]. The speed upgrade of the rigid overhead system requires fundamental research on the dynamic interaction behaviours with pantographs.
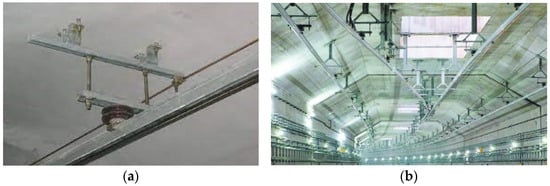
Figure 1.
Rigid overhead system: (a) local view; (b) global view.
The expansion of electric railway networks around the world brings a number of technical challenges to academia and industry [4,5,6]. The interaction of the pantograph–contact wire is one of the urgent issues in railway dynamics [7,8], as it directly affects the current collection quality of the train. In recent times, several scholars have directed their focus and efforts towards researching the performance of pantograph–contact wire interactions. However, most studies have primarily concentrated on a traditional flexible overhead system, as it serves as the primary source of power in open-air lines. The numerical modelling technique of a flexible overhead system has been extensively advanced [9]. Among various modelling methods, the finite element approach has emerged as the most widely used method for modelling the mechanical behaviour of overhead systems [10]. The results of 10 kinds of mainstream software are compared and summarised in [11], which serves as the world benchmark for the validation of numerical accuracy. On the basis of the benchmark, the numerical validation standard for the pantograph–contact wire interaction was updated in 2018 [12]. Two types of simulation results are proposed based on a desktop model and a realistic field test for validating the numerical accuracy with sufficient detail. The complex sections of the overhead system, including the curve [13] and overlap sections [14,15], have been included in the numerical model, and their dynamics have been extensively analysed. Typically, the pantograph is modelled as a lumped mass [16,17] or a multibody model [18]. The interaction of the panhead and the contact wire is normally achieved by a penalty function method [19] or Lagrange multiplier method [20]. To accurately replicate the pantograph–contact wire behaviour, hardware-in-the-loop tests have been created, consisting of a realistic pantograph and a mimic overhead system [21]. To ensure numerical accuracy, apart from using the reference models in the validation standard, measured responses from pantograph–contact wire field tests are the direct way to validate the acceptance of numerical models. The measured contact forces obtained from long-term operation [22,23] and the measured contact wire uplift [24] are used to validate the numerical accuracy from multiple aspects. Additionally, numerical simulations of the pantograph–contact wire interaction include properly modelled contact wire irregularities [25], wave disturbances [26], vehicle–track perturbations [27], and wind load [28,29] in challenging working environments to assess their effects on contact quality.
Research on rigid overhead systems has been relatively limited. In [30], a finite element model of a rigid overhead system considering the large inertia moment of the conductor rail is proposed, and the pantograph–catenary dynamic performance is analysed with different inertia moments of the conductor rail. In [31], a finite element model of rigid overhead systems using Ansys is developed, and the authors highlight that the moment of inertia of the cross-sectional area of the rigid overhead contact line has a certain contribution to the fluctuation of contact force. In [32], a rigid overhead system model based on elastic beam elements is developed, and the pantograph–contact wire dynamic interaction simulation is achieved by including a multibody pantograph model. In [33], the mechanism of wave-induced wear of the contact line under a T-shaped conductor rail is revealed, and the results indicated that the unevenness of the contact line caused by construction errors has a significant impact on wear.
Even though the previous studies have acknowledged the importance of the rigid overhead system and pantograph dynamics in the speed upgrade, the effect of the crucial parameters of this system has not been revealed in detail. Another shortcoming in previous research is that most research is focused on the performance at speeds of no more than 120 km/h, which seems to be sufficient to satisfy the demand of metro lines. However, the development of city railways in mountainous areas poses new challenges to the dynamic performance of the rigid overhead system and pantograph. The crucial parameters’ effect on the interaction performance should be further investigated at a higher speed. Motivated by this purpose, this paper further investigates the sensitivity of the main parameters of the pantograph–rigid overhead contact system to the current collection quality through the Sobol sensitivity analysis method, and proposes the optimisation strategy based on the neural network-based optimisation algorithm. Firstly, a finite element model of the rigid overhead contact system is constructed to realise dynamic interaction simulation with a pantograph at a higher speed. Secondly, using the Sobol global sensitivity analysis method, the sensitivity of the main parameters of the overhead contact system to the current collection performance is analysed. Then, the impact of parameter changes on the contact force of the overhead contact system is studied with a focus on highly sensitive parameters. Finally, the optimisation approach is applied to obtain the optimal parameters’ settings at different speed levels.
2. Numerical Model of Pantograph and Rigid Overhead System
This section mainly introduces the modelling method of the dynamic model of the pantograph–rigid overhead system. Drawing on the modelling ideas of flexible catenary, the rigid catenary model is considered as a flexible beam with elastic supports, as illustrated in Figure 2a. The dynamic behaviour of the pantograph is represented by a three-stage lumped mass model, and the pantograph–contact wire coupling is implemented by the penalty method.
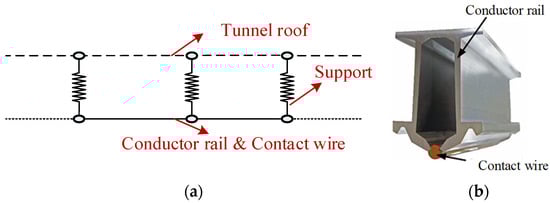
Figure 2.
Schematics of a rigid overhead system model: (a) the overview of the rigid overhead system; (b) cross-section of conductor rail and contact wire.
2.1. Rigid Overhead System Model
The π-type conductor rail model is adopted as the analysis object, as shown in Figure 2b. The conductor rail has a distinctive π-shape and is made of 6101B-T6 aluminium alloy. Figure 2b illustrates the presence of a clamp located at the bottom, which has the ability to elastically open and secure the contact wire via pressure generated from its own elasticity. According to the assumption in [34], the conductor rail and the contact wire can be seen as a whole body when analysing the interaction performance with a pantograph. Thus, the finite element method, which has shown excellent performance in various industrial backgrounds [35,36,37] is adopted here to model the rigid overhead system. To model the conductor rail and contact wire, the Timoshenko beam is employed in this study. The element stiffness matrix is represented by the following Equation (1):
where is the equivalent elastic modulus of the conductor rail and contact wire, is the corresponding cross-sectional area, is y-moment of inertia, is z-moment of inertia, is the element length, G is the shear modulus, and can be expressed by ( is the shear area in the y direction), and ( is the shear area in the z-direction).
For the suspension structure, both the spring-damper element and the lumped mass element are employed. The former provides longitudinal or torsional capabilities in 1D, 2D, or 3D applications, while the latter has six degrees of freedom. Equations (2) and (3) can be used to represent the element matrix. Equation (2) is as follows:
where k is the equivalent stiffness of the suspension structure in the vertical direction, and is the equivalent damping coefficient calculated by the summation of the constant damping coefficient and the linear damping coefficient. The element mass matrix can be seen as a lumped mass one, in which the mass is assumed to be described by the triangle elements .
Assembling all the element matrices by FEM, the equation of motion for the rigid overhead system is expressed by Equation (4):
where and are the global mass and stiffness matrices of the rigid overhead system, respectively. and are the gravity and external contact force vectors, respectively. is the displacement vector of all the degrees of freedom in the rigid overhead system. The structural damping matrix is adopted as a Rayleigh form. Equation (5) is as follows:
where and are the constant coefficients based on the Rayleigh assumption. Currently, we do not have accurate test results for these two coefficients. The coefficients from the traditional overhead system specified in En 50318 are adopted in the subsequent analysis.
2.2. Modelling of Pantograph
Figure 3 illustrates a three-degrees-of-freedom model of a pantograph, which consists of three lumped masses interconnected by springs and dampers. These parameters, including mass, stiffness, and damping, are obtained from laboratory tests of a real pantograph, as reported in [38]. The lumped mass model is widely recognized for its ability to accurately represent the physical properties of a pantograph. To describe the contact between the pantograph collector and contact wire, the penalty function method is employed, as shown in the following Equation (6):
where the contact force between the pantograph collector and contact wire is denoted as fc, while zp and zc represent the vertical displacement of the pantograph collector and contact point, respectively. The contact stiffness is expressed as kc. In [34], field test data was used to validate the numerical accuracy of the model presented in this study.
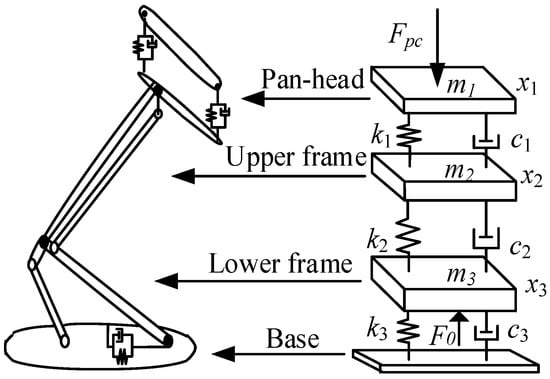
Figure 3.
Three-stage lumped mass model of pantograph.
2.3. Interaction Performance Analysis at Different Speeds
Using the rigid overhead system parameters and the pantograph from a typical metro line, as shown in Table 1, the simulation is performed at different speeds of 90 km/h, 120 km/h, and 150 km/h. The contact forces, which are crucial to describe the current collection quality of an electric train as specified in En 50367 [39], are presented in Figure 4. Note that the contact forces are filtered within the frequency range of interest, 0–20 Hz, which is sufficient to represent the interaction behaviours as specified in the standard. It is obvious that the contact force fluctuation experiences a significant increase as the train speed increases, indicating a deterioration in the contact quality. The contact force statistics, including the standard deviation, maximum contact force, and minimum contact force at these three speed levels, are shown in Figure 5. The contact force standard deviation, which is the most important index to evaluate the contact force fluctuation, increases from 7.65 N at 90 km/h to 15.59 N at 120 km/h, and to 32.45 N at 150 km/h, representing a degradation in the reliability of the pantograph–contact wire interaction. The maximum contact force increases from 129.7 N at 90 km/h to 144.2 N at 120 km/h, and to 186.7 N at 150 km/h, which will accelerate the mechanical wear on the pantograph strip and the contact wire. The minimum contact force decreases from 85.22 N at 90 km/h to 62.98 N at 120 km/h, and to 14.14 N at 150 km/h, which will increase the possibility of contact loss occurrence and the electric arcing between the panhead and the contact wire. In particular, the minimum contact force, i.e., 14.14 N observed at 150 km/h, is smaller than the safety threshold in some rail network standards [39], which deserves to be increased to reduce the electric shock to the contact surface.

Table 1.
Parameters of the rigid overhead system and pantograph.
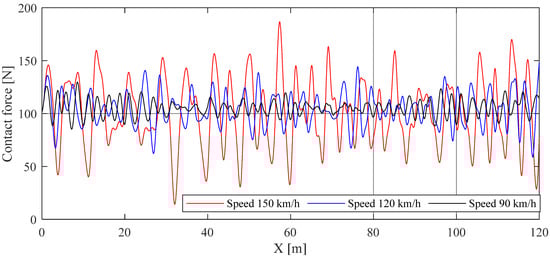
Figure 4.
Resulting contact forces at 90 km/h, 120 km/h, and 150 km/h.

Figure 5.
Contact force statistics, including maximum value, minimum value, and standard deviation at 90 km/h, 120 km/h, and 150 km/h.
3. Sobol Sensitivity Analysis Method
Sobol sensitivity analysis is a popular method for estimating the importance of input variables in a model or simulation. It was developed by Ilya Sobol in the 1990s [40] and is commonly used in certain fields, such as engineering, environmental science, and finance. The method works by analysing the output of a model or simulation under different combinations of input variables. Specifically, it decomposes the variance of the model output into components that are attributable to individual input variables, as well as interactions between input variables.
Consider a model or simulation with n input variables, x1, x2, …, xn, and a single output variable, y. The goal of Sobol analysis is to estimate the importance of each input variable in contributing to the output variance. The variance of the output can be decomposed as follows:
where E denotes the expected value. The expected value of the output as a function of the input variables can be expressed by the following:
where f is the model or simulation function. To estimate the importance of the input variables, the Sobol indices can be used, which measure the relative contribution of each input variable and interaction to the output variance. The Sobol indices are defined as follows:
where Si is the first-order Sobol index for the ith input variable, and E[y|xi] is the expected value of the output when fixing xi. Intuitively, the first-order Sobol index measures the contribution of the ith input variable in isolation relative to the total output variance. To estimate the importance of interactions between input variables, compute higher-order Sobol indices. To estimate the Sobol indices, a common sampling method, the quasi-random Sobol sequence, is used here to generate well-spaced input combinations and efficiently cover the input space.
4. Sensitivity Analysis Results
Before implementing the Sobol sensitivity analysis, the variables and their variation ranges should be prescribed. In this paper, 13 variables (including Lsp, EA, EI, ρA, m1, m2, m3, c1, c2, c3, k1, k2, and k3) are defined. Their corresponding range is assumed to be ±20% with respect to their original values in Table 1. They are averagely distributed in the prescribed range. The objective of the sensitivity analysis is the standard deviation of the contact force filtered within 0–20 Hz, which is the most important index to describe the contact force fluctuation in the current standard [39], and has been adopted as a common objective of optimisation approaches [41] and control strategies [42,43]. Assuming the total sampling number is 2000, integrating the numerical model into the Sobol method, the first-order sensitivity of each variable is calculated at three speed levels, 90 km/h, 120 km/h and 150 km/h. The resulting sensitivity of each variable can be seen in Figure 6. The numbers 1–13 on the x-axis denote Lsp, EA, EI, ρA, m1, m2, m3, c1, c2, c3, k1, k2, and k3, respectively. It is seen that the first variable, the span length, has the dominant effect on the interaction performance. Apart from the speed level of 90 km/h, the span length is the most influential factor affecting the contact force standard deviation. Generally, variables 1, 3, 4, 5, and 6 make significant contributions to the contact force standard deviation compared with other variables, which corresponds to the span length (Lsp), bending stiffness (EI), and linear density (ρA) of the conductor rail, as well as the masses of the panhead (m1) and upper frame (m3). It is also seen that the contribution of each variable changes at different speeds. The contribution of Lsp peaks at 120 km/h, and the contribution of EI peaks at 150 km/h. The contribution of ρA peaks at 90 km/h. The other three variables’ contribution decreases with the speed upgrade. The analysis results demonstrate the complex mechanism of the pantograph and overhead system’s parameters’ effect on the dynamic performance.
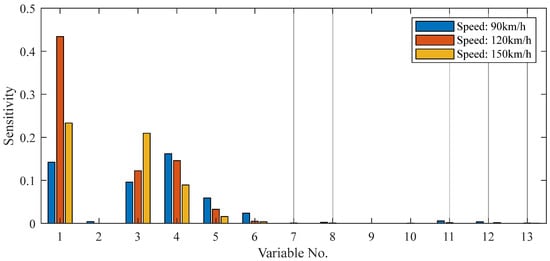
Figure 6.
Sensitivity of 13 variables at 90 km/h, 120 km/h, and 150 km/h.
The finding in [34] has acknowledged the complexity of structural parameters’ effect on the interaction performance. To further analyse how these variables affect the interaction performance, each of them is changed within the range of −20% to 20% with respect to the original value to perform the numerical simulation at different speed levels. The resulting contact force standard deviations are plotted in Figure 7a–c at 90 km/h, 120 km/h, and 150 km/h, respectively. Generally, the changes in bending stiffness and the span length have the greatest contribution to the contact force standard deviation, which is consistent with the sensitivity analysis results in Figure 6. The increase in bending stiffness positively reduces the contact force fluctuation, while the decreases in other variables are desired. The effects of each variable exhibit a certain variation among different speed levels. For instance, the worst case is observed with −5% of the original span length at 90 km/h, while for the other two speeds, the worst cases are obtained with 20% of the original span length. Generally, the best performance can be achieved with the minimum span length. Note that the present analysis in this section is only based on the change in a single variable. The next section uses the optimisation algorithm to find the optimal parameter settings for achieving the best performance at three speed levels.
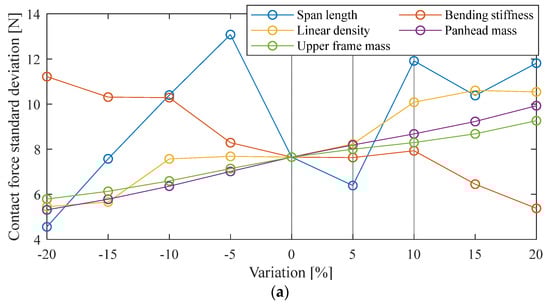
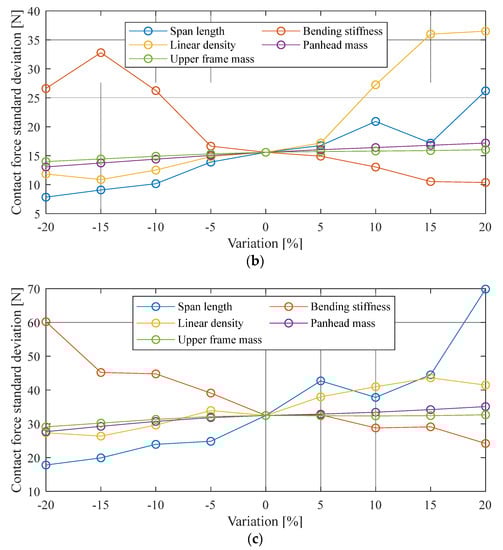
Figure 7.
Contact force standard deviation with the change in each variable at (a) 90 km/h; (b) 120 km/h; (c) 150 km/h.
5. Optimisation
A neural network optimisation algorithm is used to optimise the five crucial parameters of the pantograph and rigid overhead system at three speed levels. This algorithm minimises the sum of squares of a vector-valued objective function by coupling an artificial neural network with a genetic algorithm. The neural network is trained using the Bayesian regularisation backpropagation function, which updates the weight and bias values of the network using the Levenberg–Marquardt optimisation method [44]. The weights and biases are the variables that are updated to minimise network error during the training procedure. The neural network serves as a virtual internal objective function equivalent to the objective function, which is the contact force standard deviation δ, defined as follows:
where is the symbol of the function to establish the mapping relationship between the input variables Lsp, EI, ρA, m1 and m2, and the output contact force standard deviation. The optimisation objective is to minimise δ and achieve the minimum fluctuation in the contact force. Unlike traditional optimisation procedures, the simulation data are not directly used as the input of the genetic algorithm. Instead, an initial set of training data is simulated to train the neural network, which is then used as an objective function in the genetic algorithm to minimise δ. The optimum solution found by the genetic algorithm is checked with the numerical simulation data, and additional data will be simulated for further training of the neural network if the convergence is not satisfied. The neural network optimisation approach has been demonstrated to be more efficient in obtaining the optimum results than the traditional genetic algorithm [41].
Using MATLAB software, three-layer backpropagation neural network models were developed to establish the relationship between the input variables and the contact force standard deviation as depicted in Equation (10). The Levenberg–Marquardt algorithm-based training function trainlm was utilised, with tansig as the transfer function between the input layer and hidden layers, and purelin between the hidden layer and output layers [39]. Generally, the Levenberg–Marquardt algorithm is a modification of the Gauss–Newton method that introduces a regularisation parameter to prevent overfitting. The Levenberg–Marquardt algorithm solves the following optimisation problem:
where w is the vector of weights, SSE(w) is the sum of squared errors, λ is the regularisation parameter, and is the squared norm of the Jacobian matrix J(w) of the network. The Jacobian matrix J(w) is the matrix of partial derivatives of the network output with respect to the weights w. The Levenberg–Marquardt algorithm updates the weights in the following way:
where t is the current iteration, is the transpose of the Jacobian matrix, e is the error vector, and I is the identity matrix. The Levenberg–Marquardt algorithm starts with an initial guess of the weights and iteratively adjusts the weights until convergence is achieved. The algorithm terminates when the change in the SSE between iterations falls below a predefined threshold or a maximum number of iterations is reached. The input layer and output layer node numbers were determined based on the actual optimisation problems, while the hidden layer nodes were selected according to the actual application. It is important to note that inadequate hidden layer nodes can lead to poor fitting ability for complex problems, while an excessive number of nodes may cause over-fitting. In this case, only one hidden layer is used to describe the relationship between the input parameters and the contact force standard deviation. A reasonable number of neurons in the hidden layer is chosen as 100, which has been proven to be sufficient to handle similar problems [41].
The optimisation algorithm is implemented at 90 km/h, 120 km/h, and 150 km/h. The optimised variables are presented in Table 2. It is seen that the best parameters’ settings at 90 km/h and 120 km/h are exactly the same, which demonstrates that the dynamic characteristics do not change largely at a lower speed. However, some differences can be seen when the speed increases up to 150 km/h, indicating complicated dynamics at this high-speed level. The optimised contact force standard deviation is shown in Figure 8. Generally, the optimised results are better than the results obtained by adjusting a single variable in Figure 7, which points out the necessity and advantage of implementing an optimisation algorithm. Compared with the original value, the optimised contact force standard deviation decreases by 39.18%, 66.77%, and 61.02% at 90 km/h, 120 km/h, and 150 km/h, respectively.
Table 2.
Optimised variables at speeds of 90 km/h, 120 km/h, and 150 km/h.
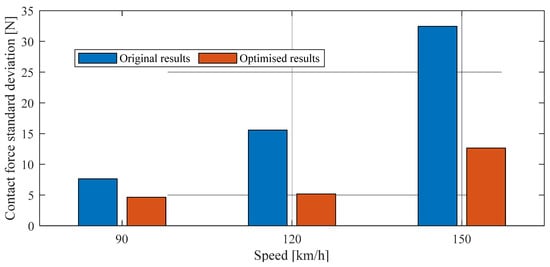
Figure 8.
Optimised results of contact force standard deviation at three speed levels.
A genetic algorithm, which simulates Darwin’s biological evolution theory, was used to search for the optimal solution in the coding tandem population formed by optimized parameters using the selected fitness function. The genetic algorithm screens individuals based on their fitness values and eliminates those with poor fitness through selection, crossover, and genetic mutation. The process is repeated until the expected conditions are met. In solving complex combinatorial optimization problems, the genetic algorithm provides faster and better optimization results than some traditional optimization algorithms, such as RSM.
The comparisons of contact force time history between the original and optimised results at 120 km/h and 150 km/h are presented in Figure 9 and Figure 10, respectively. It is seen that the fluctuation in the contact force is significantly reduced after optimisation at these two speed levels. In particular, the minimum contact force increases by 6.82 N and 46.25 N at 120 km/h and 150 km/h, respectively, which can reduce the possibility of contact loss occurrence and eliminate the electric arcing, avoiding ablation and erosion of the contact surface. The maximum contact force decreases by 20.3 N and 53 N at these two speeds, which can reduce the excessive mechanical wear in the pantograph strip and the contact wire, extending the service life. Generally, with the help of the parametric optimisation, the contact force becomes more stable, indicating an increase in reliability in the pantograph–contact wire interaction.
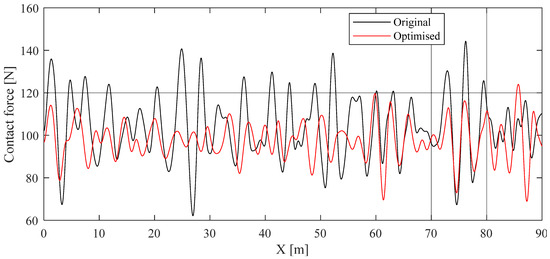
Figure 9.
Comparison of contact force time history between original and optimised results at 120 km/h.
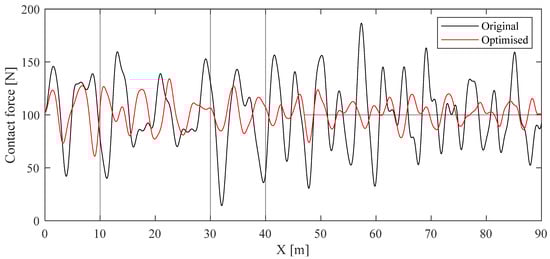
Figure 10.
Comparison of contact force time history between original and optimised results at 150 km/h.
The optimisation analysis shows that the optimal parameters’ settings are exactly the same at speeds of 90 km/h and 120 km/h, but not at 150 km/h. A practical issue has arisen. The key parameters can be calibrated to the maximum speed (150 km/h). The behaviours for lower speeds using the key parameters of the maximum speed should be analysed. Using the optimal parameters settings at 150 km/h, the comparisons of contact force time history at 90 km/h and 120 km/h are presented in Figure 11. It is seen that the contact force fluctuations at two speeds are distinctly reduced by using the optimal parameters’ setting of 150 km/h. Even though the optimal parameters’ setting of 150 km/h is not the best one at 120 km/h and 90 km/h, the performance can still be improved to some extent, which demonstrates the good robustness of the design for a high-speed system to the application of lower speeds.
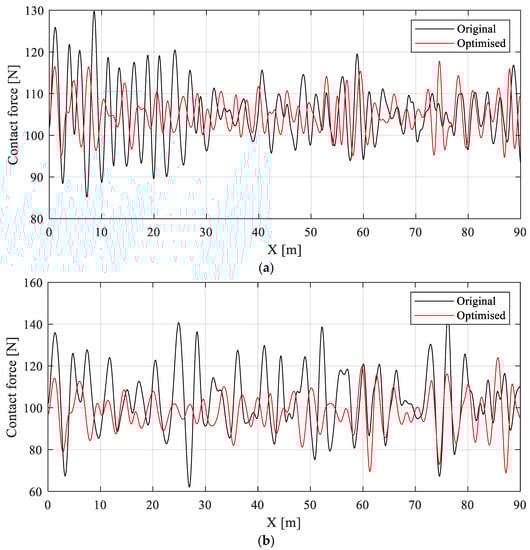
Figure 11.
Comparison of contact force time history between original and optimised results at (a) 90 km/h and (b) 120 km/h using the optimal parameters’ setting of 150 km/h.
6. Conclusions
Motivated by the purpose of developing a higher speed rigid overhead system, this paper investigates the effect of crucial parameters of the overhead system and pantograph on the interaction performance, namely the contact force between the pantograph and the contact wire. The Sobol sensitivity analysis method is employed to figure out the contribution of different parameters to the contact force standard deviation. Then, five crucial parameters are adopted in an optimisation approach to minimise the contact force standard deviation at different speeds. The main conclusions can be drawn as follows.
Through the sensitivity analysis of 13 variables of the pantograph and rigid overhead system, it is found that the span length, bending stiffness and linear density of the conductor rail, and the masses of the pantograph head and upper frame, have the dominant effect on the contact force standard deviation.
Through the quantification of each parameter’s contribution, it is found that the increase in bending stiffness generally has a positive effect in reducing the contact force fluctuation, while the decreases in other variables are preferred.
The optimisation analysis found that the optimised contact force standard deviation decreases by 39.18%, 66.77%, and 61.02% at 90 km/h, 120 km/h, and 150 km/h, respectively, compared with the original values.
It is worthwhile noting that the disturbances from the conductor rail irregularity and the vehicle vibration are not considered in the analysis. The previous study indicates that the irregularities with different wavelengths may change the dynamic behaviour of the pantograph–rigid overhead system. The optimisation strategy deserves to be further checked in more realistic working conditions.
Author Contributions
Conceptualisation, Y.S. and K.C.; methodology, F.D., Y.S.; software, Y.S.; validation, K.C. and X.L.; formal analysis, X.L.; investigation, F.D., Y.S. and K.C.; resources, X.L. and K.C.; writing—original draft preparation, Y.S.; writing—review and editing, F.D., K.C. and X.L.; funding acquisition, K.C. and X.L. All authors have read and agreed to the published version of the manuscript.
Funding
This research was funded by National Natural Science Foundation of China (52102478), China Postdoctoral Science Foundation (2022M720108), and the open project of State Key Laboratory of Traction Power (TPL2211).
Institutional Review Board Statement
Not applicable.
Informed Consent Statement
Not applicable.
Data Availability Statement
Not applicable.
Conflicts of Interest
The authors declare no conflict of interest.
References
- Nedeliakova, E.; Hudakova, M.; Masar, M.; Lizbetinova, L.; Stasiak-Betlejewska, R.; Šulko, P. Sustainability of Railway Undertaking Services with Lean Philosophy in Risk Management—Case Study. Sustainability 2020, 12, 5298. [Google Scholar] [CrossRef]
- Sun, W.; Wang, C.; Liu, C.; Wang, L. High-Speed Rail Network Expansion and Its Impact on Regional Economic Sustainability in the Yangtze River Delta, China, 2009–2018. Sustainability 2022, 14, 155. [Google Scholar] [CrossRef]
- El-Khateeb, L.; Abdelkader, E.M.; Al-Sakkaf, A.; Zayed, T. A Hybrid Multi-Criteria Decision Making Model for Defect-Based Condition Assessment of Railway Infrastructure. Sustainability 2021, 13, 7186. [Google Scholar] [CrossRef]
- Luo, L.; Ye, W.; Wang, J. Defect detection of the puller bolt in high-speed railway catenary based on deep learning. J. Railw. Sci. Eng. 2021, 18, 605–614. [Google Scholar] [CrossRef]
- Tang, W.; Ma, H.; Yuan, Y.; Liu, Z.; Yu, Z. Investigation on the influence of Cu-Al2O3 dispersion copper high-speed railway contact wire on current-collecting quality of pantograph-catenary. J. Railw. Sci. Eng. 2021, 18, 1098–1104. [Google Scholar] [CrossRef]
- Cheng, H.; Wang, J.; Liu, J.; Cao, Y.; Li, H.; Xu, X. Comprehensive evaluation method of catenary status based on improved multivariate statistical control chart. J. Railw. Sci. Eng. 2021, 18, 3048–3056. [Google Scholar] [CrossRef]
- Wang, R.; Allen, P.; Song, Y.; Wang, Z. Modelling and Analysis of Power-Regenerating Potential for High-Speed Train Suspensions. Sustainability 2022, 14, 2542. [Google Scholar] [CrossRef]
- Rungskunroch, P.; Yang, Y.; Kaewunruen, S. Does High-Speed Rail Influence Urban Dynamics and Land Pricing? Sustainability 2020, 12, 3012. [Google Scholar] [CrossRef]
- Zhang, W.; Zou, D.; Tan, M.; Zhou, N.; Li, R.; Mei, G. Review of pantograph and catenary interaction. Front. Mech. Eng. 2018, 13, 311–322. [Google Scholar] [CrossRef]
- Song, Y.; Antunes, P.; Pombo, J.; Liu, Z. A methodology to study high-speed pantograph-catenary interaction with realistic contact wire irregularities. Mech. Mach. Theory 2020, 4, 103940. [Google Scholar] [CrossRef]
- Bruni, S.; Ambrosio, J.; Carnicero, A.; Cho, Y.H.; Finner, L.; Ikeda, M.; Kwon, S.Y.; Massat, J.P.; Stichel, S.; Tur, M.; et al. The results of the pantograph-catenary interaction benchmark. Veh. Syst. Dyn. 2015, 53, 412–435. [Google Scholar] [CrossRef]
- EN 50318; Railway Applications—Current Collection Systems—Validation of Simulation of the Dynamic Interaction between Pantograph and Overhead Contact Line. European Committee for Electrotechnical Standardization: Brussels, Belgium, 2018.
- Antunes, P.; Ambrósio, J.; Pombo, J.; Facchinetti, A. A new methodology to study the pantograph–catenary dynamics in curved railway tracks. Veh. Syst. Dyn. 2020, 58, 425–452. [Google Scholar] [CrossRef]
- Mei, G.; Zhang, W.; Zhao, H.; Zhang, L. A hybrid method to simulate the interaction of pantograph and catenary on overlap span. Veh. Syst. Dyn. 2006, 44, 571–580. [Google Scholar] [CrossRef]
- Antunes, P.; Ambrósio, J.; Pombo, J.; Pereira, M. Dynamic Analysis of the Pantograph-Cantenary, Interaction on Overlap Sections for High-Speed Railway Operations. Civ. Comp Proc. 2014, 104, 142. [Google Scholar] [CrossRef]
- Song, Y.; Duan, F.; Wu, F.; Liu, Z.; Gao, S. Assessment of the Current Collection Quality of Pantograph-Catenary with Contact Line Height Variability in Electric Railways. IEEE Trans. Transp. Electrif. 2021, 8, 788–798. [Google Scholar] [CrossRef]
- Song, Y.; Duan, F.; Gao, S.; Wu, F.; Liu, Z. Crosswind Effects on Current Collection Quality of Railway Pantograph-catenary: A Case Study in Chengdu-Chongqing Passenger Special Line. IEEE Trans. Instrum. Meas. 2021, 71, 9000713. [Google Scholar] [CrossRef]
- Song, Y.; Ouyang, H.; Liu, Z.; Mei, G.; Wang, H.; Lu, X. Active control of contact force for high-speed railway pantograph-catenary based on multi-body pantograph model. Mech. Mach. Theory 2017, 115, 35–59. [Google Scholar] [CrossRef]
- Song, Y.; Duan, F.; Liu, Z. Analysis of Critical Speed for High-Speed Railway Pantograph-Catenary System. IEEE Trans. Veh. Technol. 2022, 71, 3547–3555. [Google Scholar] [CrossRef]
- Chu, W.; Song, Y. Study on Dynamic Interaction of Railway Pantograph–Catenary Including Reattachment Momentum Impact. Vibration 2020, 3, 18–33. [Google Scholar] [CrossRef]
- Kobayashi, S.; Stoten, D.P.; Yamashita, Y.; Usuda, T. Dynamically substructured testing of railway pantograph/catenary systems. Proc. Inst. Mech. Eng. F J. Rail. Rapid Transit. 2019, 233, 516–525. [Google Scholar] [CrossRef]
- Nåvik, P.; Rønnquist, A.; Stichel, S. Variation in predicting pantograph–catenary interaction contact forces, numerical simulations and field measurements. Veh. Syst. Dyn. 2017, 55, 1265–1282. [Google Scholar] [CrossRef]
- Song, Y.; Jiang, T.; Nåvik, P.; Rønnquist, A. Geometry deviation effects of railway catenaries on pantograph–catenary interaction: A case study in Norwegian Railway System. Railw. Eng. Sci. 2021, 29, 350–361. [Google Scholar] [CrossRef]
- Song, Y.; Rønnquist, A.; Jiang, T.; Nåvik, P. Railway pantograph-catenary interaction performance in an overlap section: Modelling, validation and analysis. J. Sound. Vib. 2023, 548, 117506. [Google Scholar] [CrossRef]
- Song, Y.; Liu, Z.; Rxnnquist, A.; Navik, P.; Liu, Z. Contact Wire Irregularity Stochastics and Effect on High-speed Railway Pantograph-Catenary Interactions. IEEE Trans. Instrum. Meas. 2020, 69, 8196–8206. [Google Scholar] [CrossRef]
- Song, Y.; Liu, Z.; Duan, F.; Xu, Z.; Lu, X. Wave propagation analysis in high-speed railway catenary system subjected to a moving pantograph. Appl. Math. Model 2018, 59, 20–38. [Google Scholar] [CrossRef]
- Song, Y.; Wang, Z.; Liu, Z.; Wang, R. A spatial coupling model to study dynamic performance of pantograph-catenary with vehicle-track excitation. Mech. Syst. Signal Process. 2021, 151, 107336. [Google Scholar] [CrossRef]
- Song, Y.; Zhang, M.; Øiseth, O.; Rønnquist, A. Wind deflection analysis of railway catenary under crosswind based on nonlinear finite element model and wind tunnel test. Mech. Mach. Theory 2022, 168, 104608. [Google Scholar] [CrossRef]
- Duan, F.; Song, Y.; Gao, S.; Liu, Y.; Chu, W.; Lu, X.; Liu, Z. Study on Aerodynamic Instability and Galloping Response of Rail Overhead Contact Line Based on Wind Tunnel Tests. IEEE Trans. Veh. Technol, 2023; early access. [Google Scholar] [CrossRef]
- Feng, X.; Gao, S.; Song, Y.; Hu, Z.; Chen, L.; Liang, T. Static and Dynamic Analysis of Conductor Rail with Large Cross-Sectional Moment of Inertia in Rigid Catenary Systems. Energies 2023, 16, 1810. [Google Scholar] [CrossRef]
- Vera, C.; Suarez, B.; Paulin, J.; Rodríguez, P. Simulation model for the study of overhead rail current collector systems dynamics, focused on the design of a new conductor rail. Veh. Syst. Dyn. 2006, 44, 595–614. [Google Scholar] [CrossRef]
- Bautista, A.; Montesinos, J.; Pintado, P. Dynamic interaction between pantograph and rigid overhead lines using a coupled FEM—Multibody procedure. Mech. Mach. Theory 2016, 97, 100–111. [Google Scholar] [CrossRef]
- Shimizu, M.; Harada, S.; Oya, A.; Tokuda, K. Improving performance of type T overhead rigid conductor lines. Q. Rep. RTRI 2006, 47, 52–58. [Google Scholar] [CrossRef]
- Chen, L.; Duan, F.; Song, Y.; Hu, Z.; Liu, Z.; Feng, X. Assessment of Dynamic Interaction Performance of High-Speed Pantograph and Overhead Conductor Rail System. IEEE Trans. Instrum. Meas. 2022, 71, 9001914. [Google Scholar] [CrossRef]
- Qin, R.; Zhu, B.; Qiao, K.; Wang, D.; Sun, N.; Yuan, X. Simulation study of the protective performance of composite structure carbon fiber bulletproof board. Chin. J. Eng. 2021, 43, 1346–1354. [Google Scholar] [CrossRef]
- Su, Z.N.; Shao, L.T. Three-dimensional slope stability based on the finite element limit equilibrium method. Chin. J. Eng. 2022, 44, 2048–2056. [Google Scholar] [CrossRef]
- Kong, D.S.; Liu, Y.; Deng, M.X.; Li, Y.Z. Dynamic response characteristics of an offshore, wind-power monopile foundation in heterogeneous soil. Chin. J. Eng. 2021, 43, 710–719. [Google Scholar] [CrossRef]
- Jung, S.P.; Kim, Y.G.; Paik, J.S.; Park, T.W. Estimation of dynamic contact force between a pantograph and catenary using the finite element method. J. Comput. Nonlinear Dyn. 2012, 7, 041006. [Google Scholar] [CrossRef]
- EN 50367; Railway Applications—Current Collection Systems—Technical Criteria for the Interaction between Pantograph and Overhead Line. European Committee for Electrotechnical Standardization: Brussels, Belgium, 2016.
- Sobol, I.M. Global sensitivity indices for nonlinear mathematical models and their Monte Carlo estimates. Math. Comput. Simul. 2001, 55, 271–280. [Google Scholar] [CrossRef]
- Su, K.; Zhang, J.; Zhang, J.; Yan, T.; Mei, G. Optimisation of current collection quality of high-speed pantograph-catenary system using the combination of artificial neural network and genetic algorithm. Veh. Syst. Dyn. 2022, 61, 260–285. [Google Scholar] [CrossRef]
- Lin, Y.C.; Lin, C.L.; Yang, C.C. Robust active vibration control for rail vehicle pantograph. IEEE Trans. Veh. Technol. 2007, 56, 1994–2004. [Google Scholar] [CrossRef]
- Sanchez-Rebollo, C.; Jimenez-Octavio, J.R.; Carnicero, A. Active control strategy on a catenary-pantograph validated model. Veh. Syst. Dyn. 2013, 51, 554–569. [Google Scholar] [CrossRef]
- Ampazis, N.; Perantonis, S.J. Levenberg-Marquardt algorithm with adaptive momentum for the efficient training of feedforward networks. In Proceedings of the International Joint Conference on Neural Networks, Como, Italy, 27 July 2000; Volume 1, pp. 126–131. [Google Scholar] [CrossRef]


Disclaimer/Publisher’s Note: The statements, opinions and data contained in all publications are solely those of the individual author(s) and contributor(s) and not of MDPI and/or the editor(s). MDPI and/or the editor(s) disclaim responsibility for any injury to people or property resulting from any ideas, methods, instructions or products referred to in the content. |
© 2023 by the authors. Licensee MDPI, Basel, Switzerland. This article is an open access article distributed under the terms and conditions of the Creative Commons Attribution (CC BY) license (https://creativecommons.org/licenses/by/4.0/).