Article

Influence of Arbor on the Cooling Load Characteristics of Rural Houses—A Case Study in the Region of Hangzhou

College of Landscape and Architecture, Zhejiang A&F University, Hangzhou 311300, China
*
Author to whom correspondence should be addressed.
Sustainability 2023, 15(8), 6853; https://doi.org/10.3390/su15086853
Submission received: 8 March 2023 / Revised: 13 April 2023 / Accepted: 14 April 2023 / Published: 19 April 2023
(This article belongs to the Topic Building Energy Efficiency)

Abstract

:
Numerous experiments have shown that trees can reduce the energy consumption of adjacent buildings, but little research has been carried out on how leaf area density (LAD) and the distance between walls and trees (DW-T) in different orientations affect the energy consumption of rural houses. Using an investigation method, a simulation method, and a remote sensing information extraction method, the impact of different tree-planting scenarios on the energy consumption of typical rural houses was analyzed. The results show that the energy-saving effect becomes more prominent with a higher leaf area density of trees in summer. Under the same conditions, Osmanthus fragrans is the most effective tree, followed by Koelreuteria paniculata, and then pomegranate. Moreover, the energy-saving rate of the rural house increases with a decrease in the wall–crown distance of the tree. For instance, when a Koelreuteria paniculata is planted on the west side of the rural house with a wall–crown distance of 1–3 m, the energy-saving rate ranges from 4.38% to 9.81%. Additionally, the planting orientation of the tree affects the energy-saving rate, with the west-facing orientation being the best and the north-facing orientation being the worst under the same conditions, and the energy-saving rate of the best orientation (west-facing) ranging from 2.11% to 14.98%. By establishing a comprehensive model, it was found that planting Osmanthus fragrans on the west side of a rural house with a 1 m wall–crown distance yields the best energy-saving effect. The results of this study can provide theoretical support for planting trees around rural houses from the perspective of energy saving.

1. Introduction

In the past few decades, the rapid development of industry, accompanied by the massive use of energy, has led to the deterioration of the human living environment. The International Energy Agency (IEA) reports that global energy use has doubled since the 1970s. In 2018, global building energy consumption accounted for 35 [1]. In China, the total energy consumption of domestic buildings was 1 billion tce in 2018 [2], and the carbon emissions related to fossil energy consumption were 2.1 billion tCO2, accounting for 46% of energy use [3]. However, in the case of residential buildings, rural residential buildings account for 22% of the total energy consumption in the national construction operation stage, which is equivalent to the proportion of commodity energy consumption in urban residential buildings. Compared with urban residential buildings, rural residential buildings have the characteristic of poor thermal insulation performance, which cannot be ignored. Reducing building energy consumption on the basis of meeting the requirements of human settlements, especially research on reducing residential energy consumption, has become one of the most important topics in building energy conservation.
Currently, there are several existing industry studies on reducing the energy consumption of rural houses. Most of these studies have achieved the goal of reducing energy consumption by analyzing the thermal environment characteristics of rural houses and implementing passive transformations. For example, Miao Zhantang and colleagues improved the comfort of the indoor thermal environment of existing rural residences by optimizing the design of the outer enclosure structure, which saved energy costs for residents [4]. In hot-summer and cold-winter areas, Liu Yingfang et al. studied the energy-saving potential of different space combinations for rural houses in Shanghai [5]. However, few studies have utilized the cooling effect of arbors adjacent to rural houses to reduce the cooling energy consumption of these houses.
Numerous studies have demonstrated that the incorporation of trees and vegetation around buildings can effectively reduce a building’s energy consumption for both cooling and heating purposes. In general, the reduction of building energy consumption by trees is widely recognized. The effect of vegetation on the surrounding microclimate and the reduction in building cooling energy consumption can be attributed to the following factors: (1) shading, which prevents direct sunlight from reaching the building’s exterior walls, and (2) transpiration, which releases water vapor from leaves into the atmosphere and cools the air [6]. Among these factors, tree height, the distance between trees and buildings, and leaf area density greatly affect the shading effect, while tree species affect transpiration [7].
Numerous scholars, both domestic and international, have conducted extensive quantitative research on the relationship between trees and the thermal environment and the energy consumption of residential buildings. For instance, Donovan et al. conducted a regression analysis to examine the effect of trees on the electricity consumption of residential buildings in California, and found that trees on the west and south sides of the building can reduce summer electricity consumption, while trees on the north side can increase it. This phenomenon requires further investigation and analysis [8]. Hwang used EnergyPlus energy consumption simulation software to simulate energy consumption in various climate zones in the United States and concluded that the interaction between tree shape, position, and geographic environment affects the quantity and quality of shade provided by trees, which is crucial for improving the energy-saving benefits of trees in urban areas [9]. Similarly, Chagolla et al. conducted a comparative simulation study on residential buildings in Mexico using EnergyPlus and found that, compared with unsheltered houses, the total annual energy consumption for cooling and heating for thermal comfort can be reduced by 76.6% [10]. Huang used DOE-2.1 D to simulate houses in seven typical climate zones in the United States and found that planting three trees around a house built before 1973 or 1980 can reduce energy consumption by 10–16% [11]. It is worth mentioning that, in their latest study from 2022, Rouhollahi et al. proposed five optimal tree layouts based on the deep soil availability of residential plots through simulation for residential buildings in warm climates in South Australia. Their research methods are of great significance to this study [12].
However, there is still a gap in domestic research on the strategy of tree planting for the energy-saving optimization of rural houses. Chinese rural houses are widely distributed and have a large volume. Active energy-saving renovations are costly and difficult for local residents. Thus, it is more economical and practical to change the surrounding tree-planting scheme to reduce the energy consumption of rural houses in the summer, utilizing the characteristic that most rural houses are built alone and the surrounding space can be used freely. Therefore, this paper aims to establish a tree-planting strategy around rural houses to verify the influence of trees on annual and biseasonal energy use, reduce the dependence on heating, ventilation, and air conditioning (HVAC) systems, improve indoor thermal comfort, and propose a suitable local tree-planting scheme. Using the rural area of Hangzhou, China as an example, this study involves conducting field investigations and numerical simulations to establish a building energy consumption model. The factors that affect tree planting to reduce the energy consumption of summer rural houses are identified, and a local tree-planting plan is proposed based on the research results. These findings contribute to the influence of tree-planting practice and future rural greening research.

2. Methods

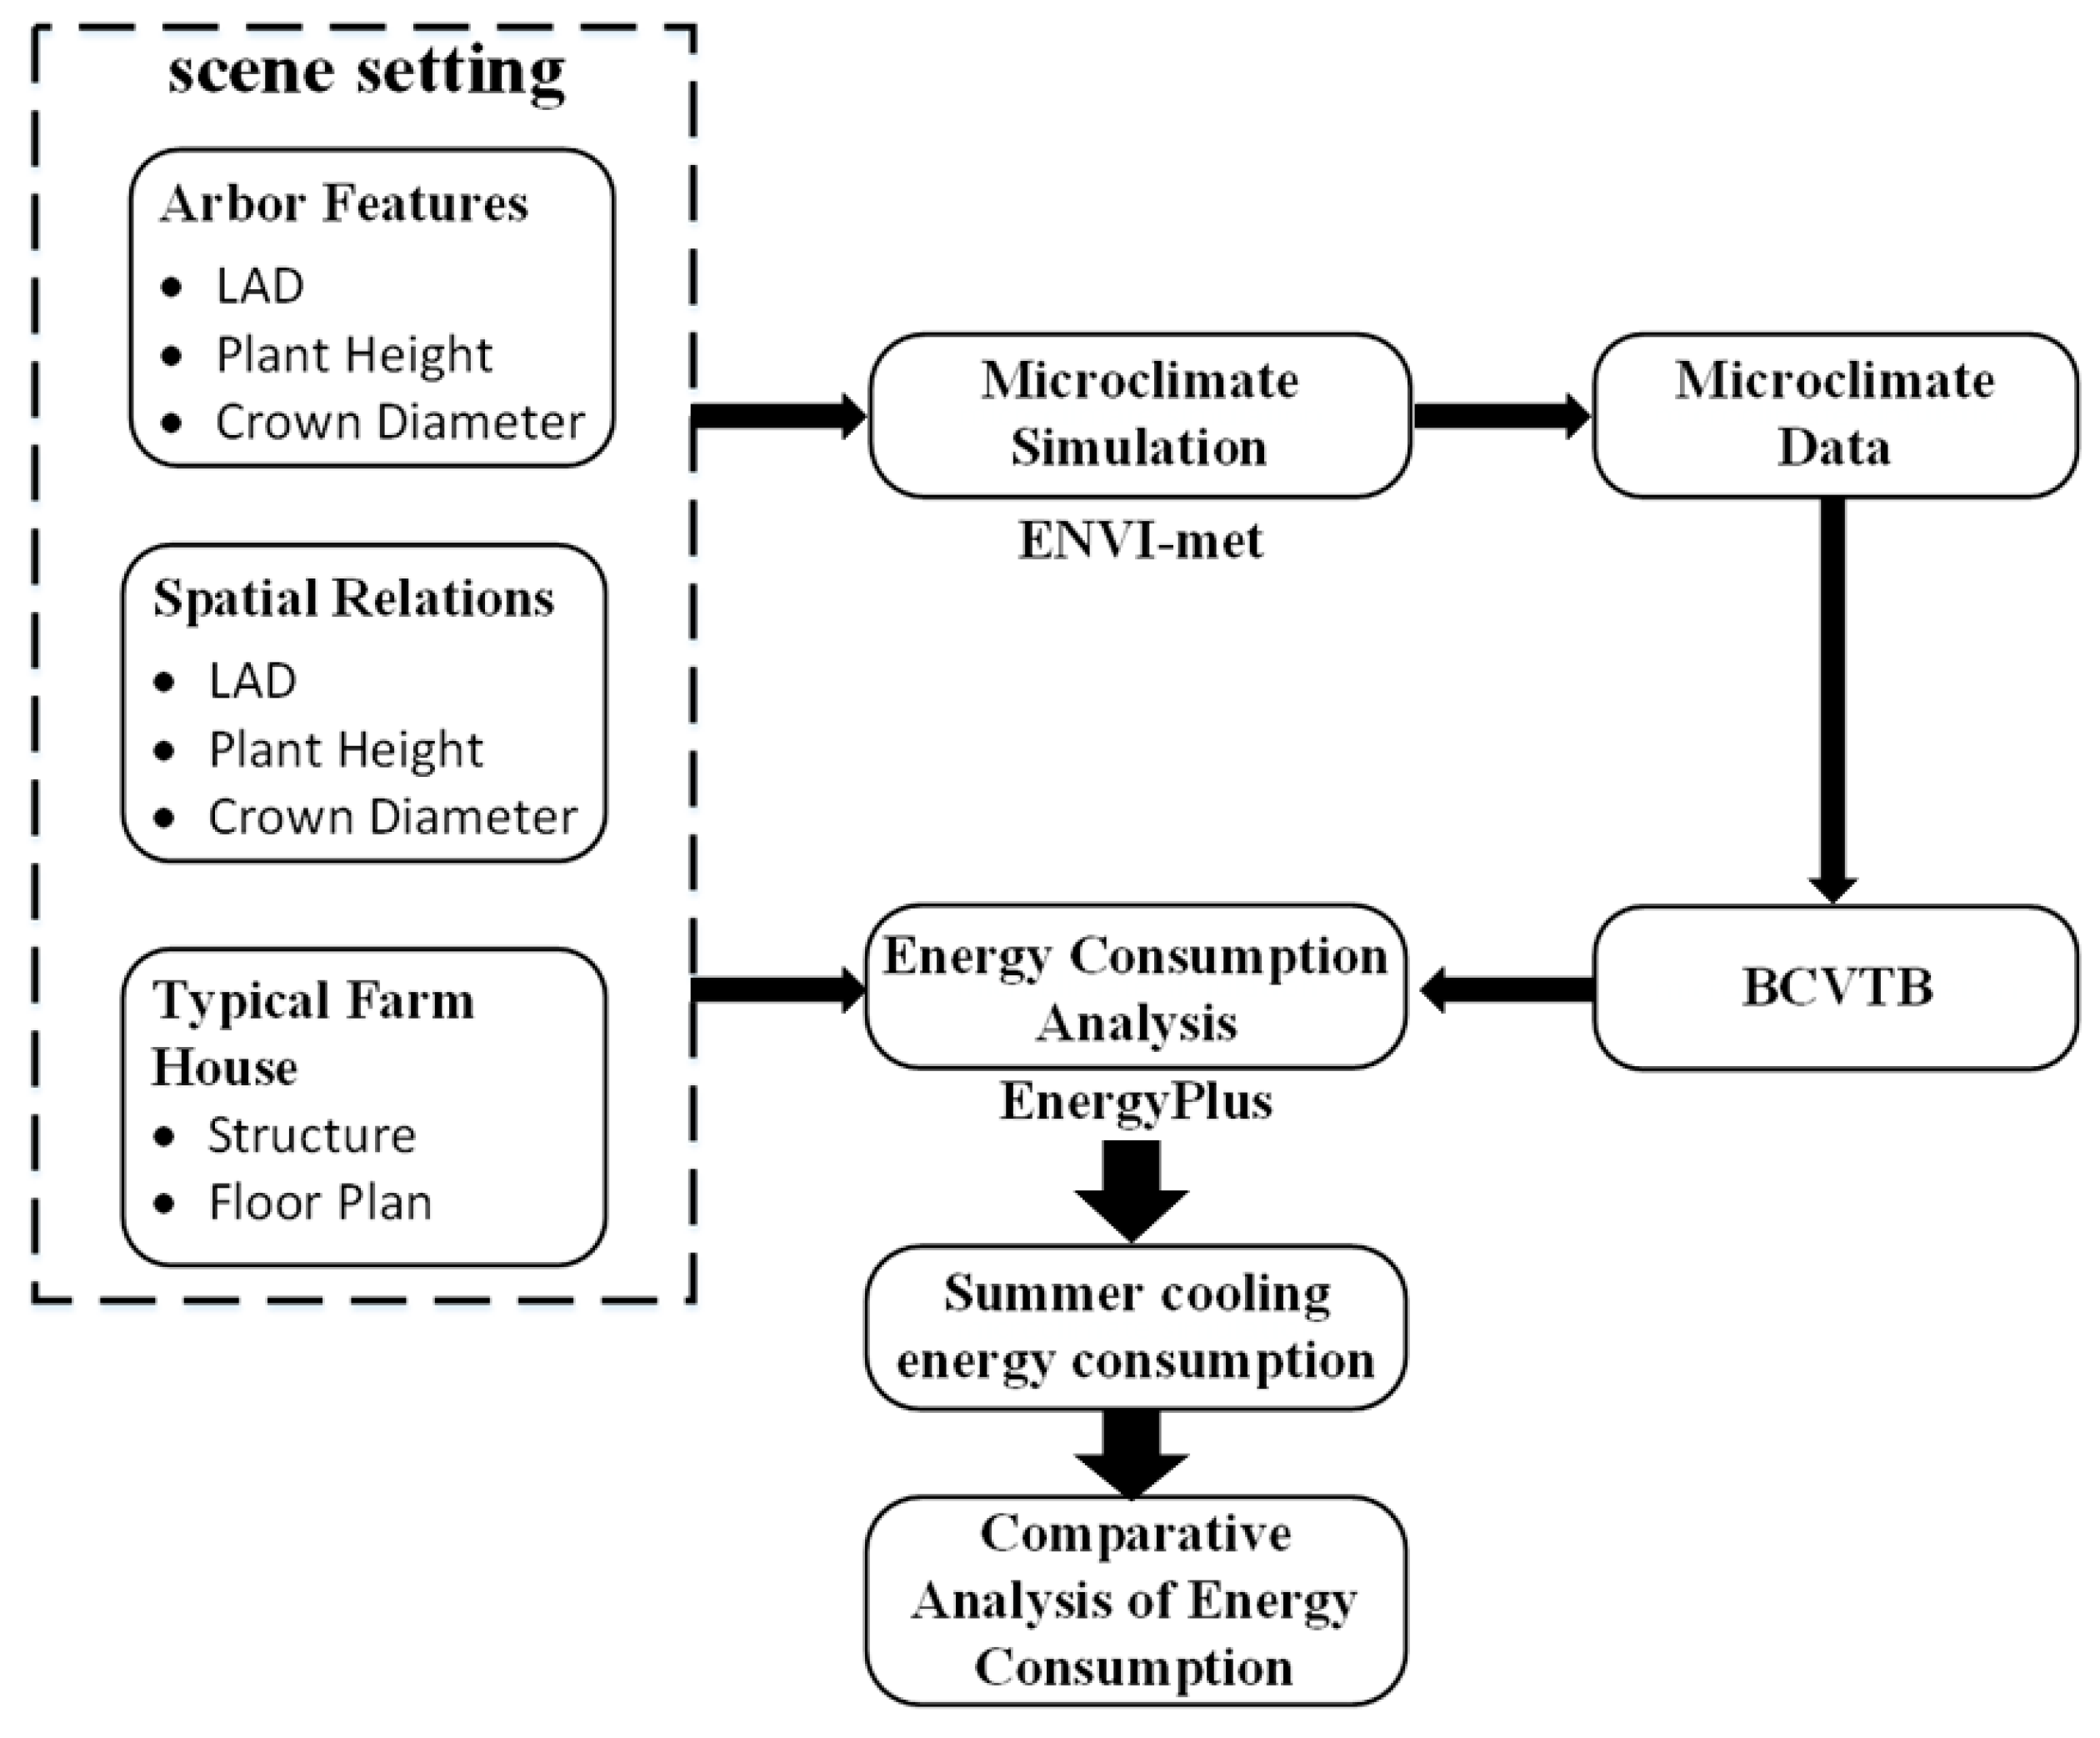
2.1. Method and Process

This section presents the methodological framework for the study’s implementation, which includes the climatic characteristics of the case study area, regional survey research, and typical analysis. Additionally, the applied simulation tools, proposed one-way coupling method, and modeling process are introduced. This study utilizes field investigation and simulation analysis methods to propose a set of surrounding arbor-planting schemes to reduce energy consumption of rural houses (Figure 1).
First, an on-site investigation and remote sensing data analysis were conducted to obtain data such as the building sizes and structural material parameters of rural houses, the types and characteristics of common trees adjacent to rural houses, and the spatial relationship between rural houses and trees. Additionally, power consumption data were recorded to lay the foundation for subsequent simulation analysis.
The second step was the simulation stage. According to the survey statistics, an ENVI-met model of the microclimate simulation platform and an EnergyPlus model of the building energy consumption simulation platform were established. After the joint simulation of the two, the summer cooling energy consumption of rural houses under different simulation scenarios was obtained.
In the third step, single-factor variable energy consumption analysis was conducted on the energy consumption data of rural houses under different operating conditions. A set of tree-planting strategies suitable for the region was developed based on the analysis results.

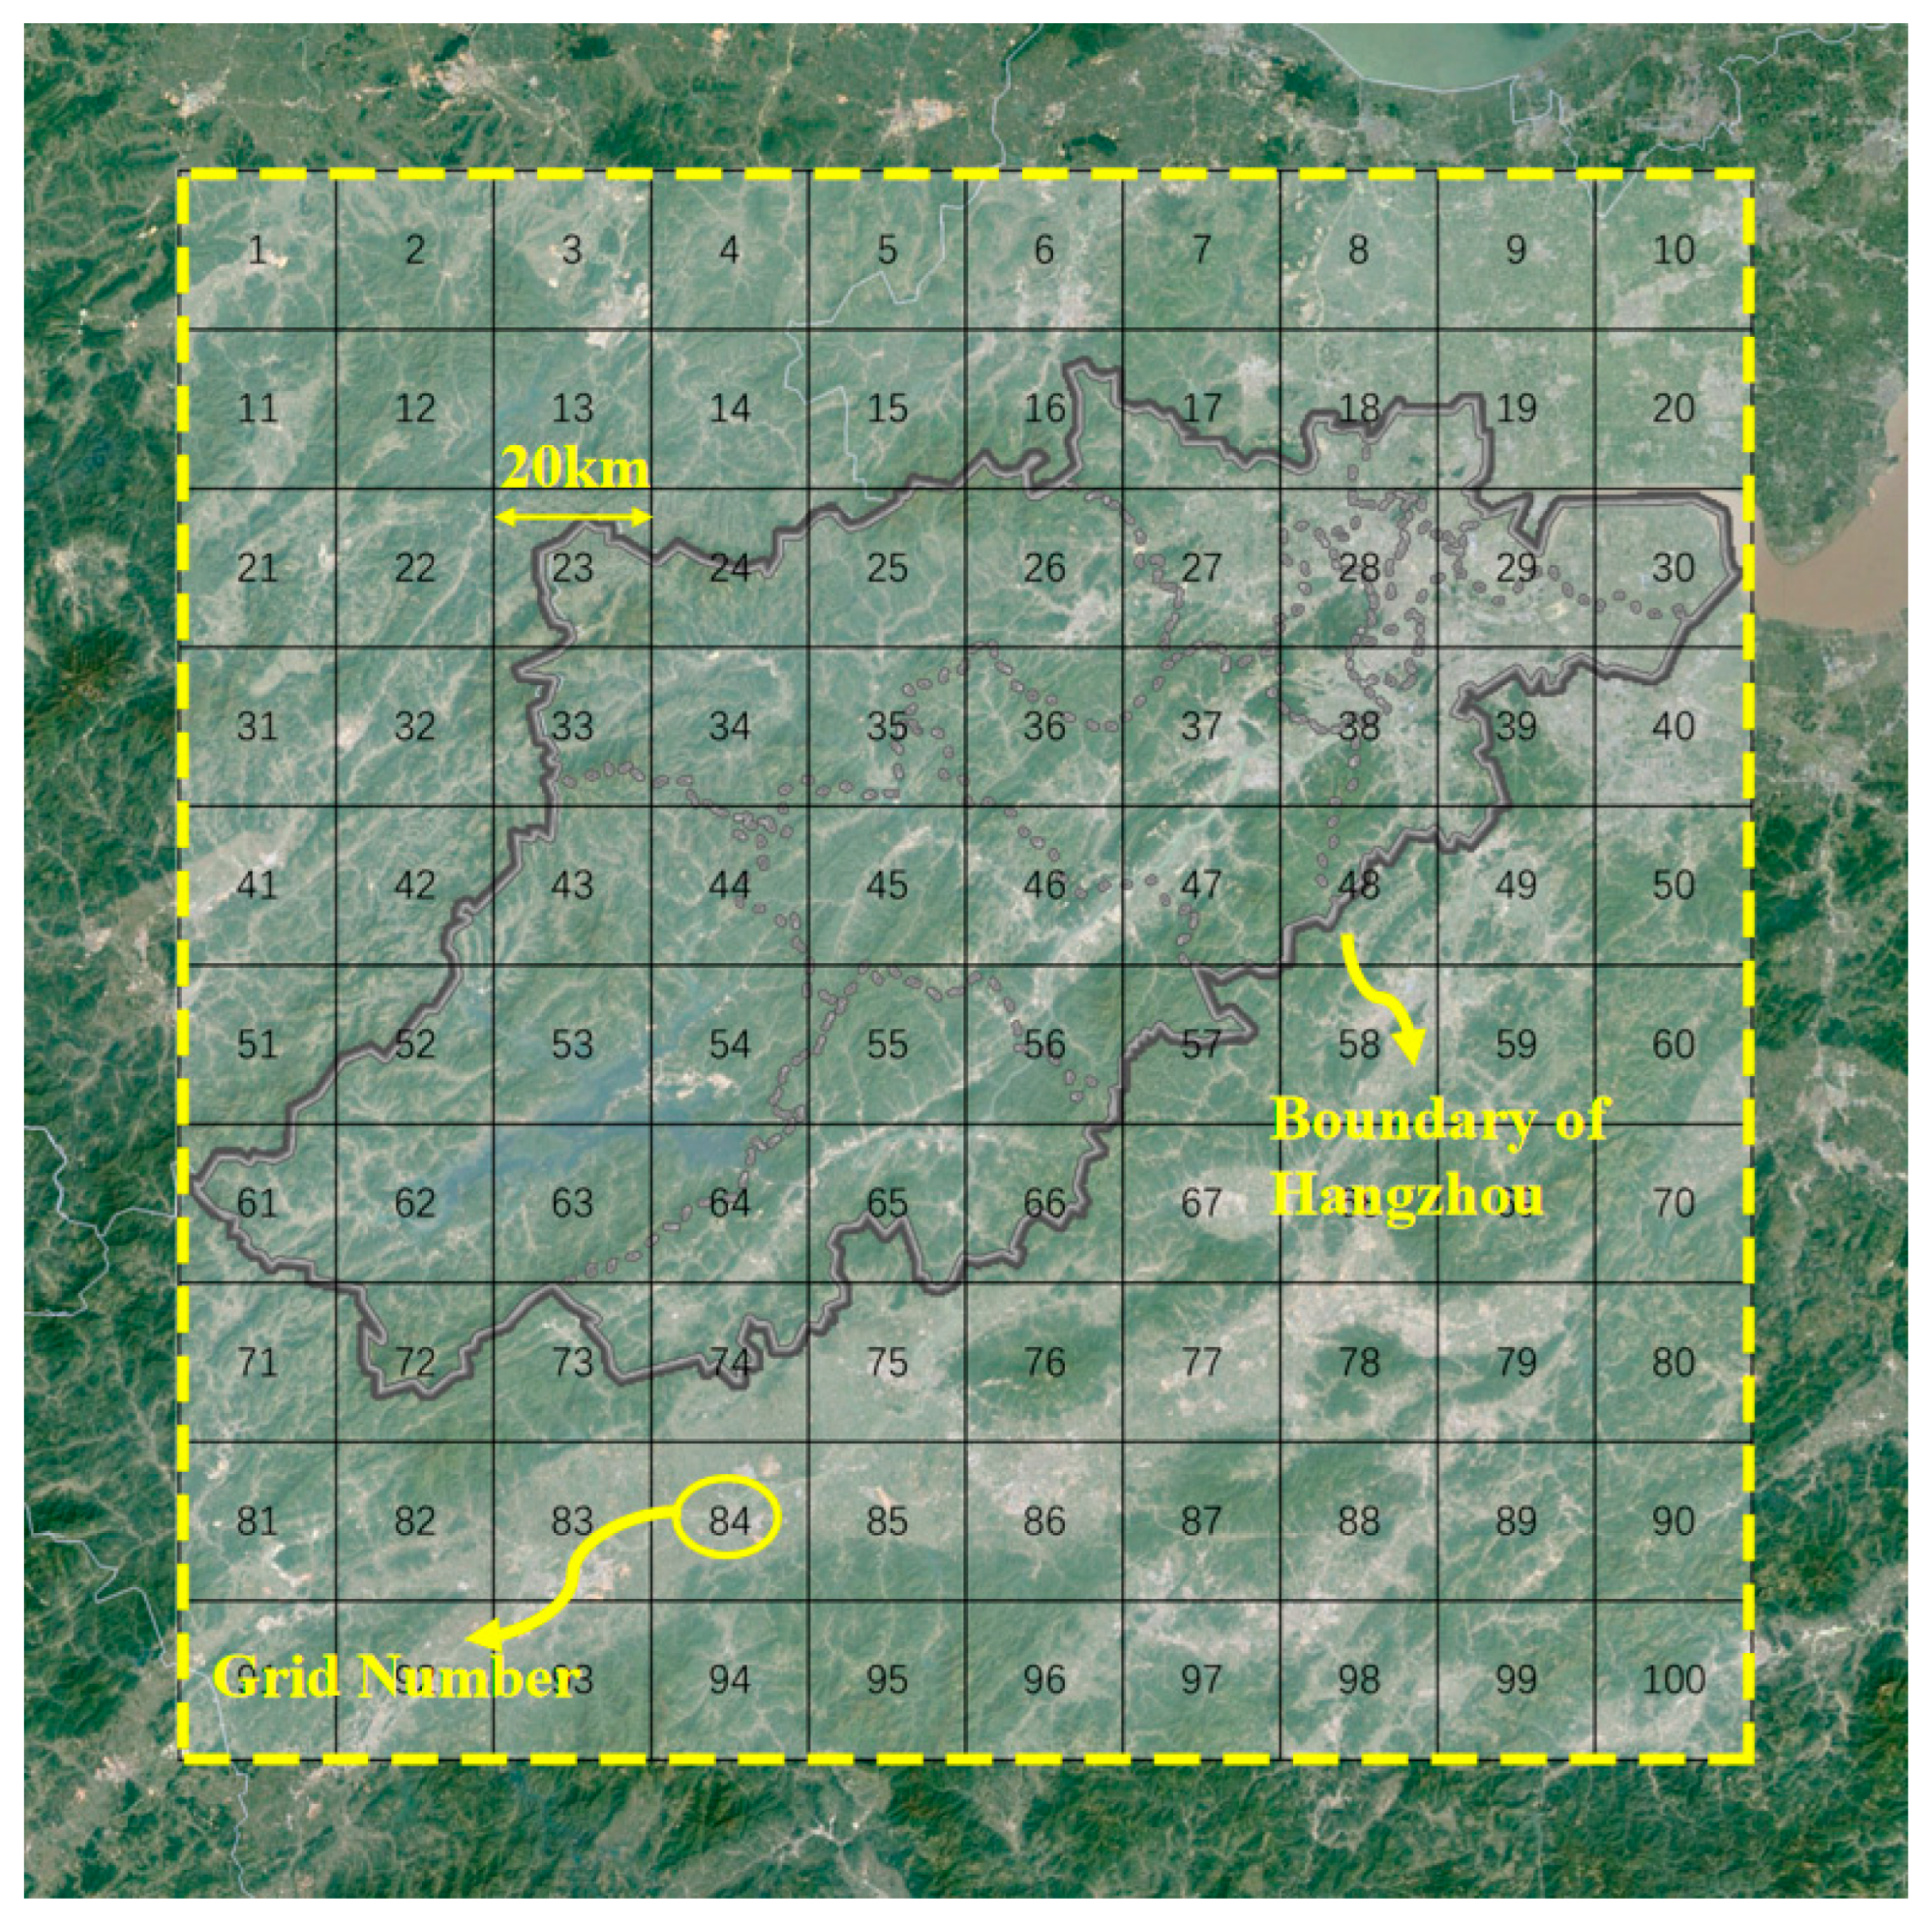
2.2. Selection of Study Area

Hangzhou City, located at 120.2° E, 30.3° N, and 19 m above sea level in Zhejiang Province, China, was chosen as the research area for this study. This region is classified as a hot-summer and cold-winter area according to the “Code for Thermal Design of Civil Buildings” (GB 50176-2016) [13]. It has a subtropical monsoon climate with hot and rainy summers and mild and dry winters. The average annual temperature is 17.8 °C, the average relative humidity is 70.3%, the annual precipitation is 1454 mm, and the annual sunshine hours are 1765 h. In this study, EnergyPlus weather data (EnergyPlus WeatherFile, EPW) based on the “China Building Standard Meteorological Database” [14] were used. The EPW files were modified using microclimate simulations to improve the accuracy of the building energy consumption results. The modified EPW files were used to set the thermal boundary conditions on the outer surface of the building and to simulate the microclimate around the rural houses. The simulation was performed for the typical climate year of Hangzhou, which has an annual maximum temperature of 38 °C and a minimum temperature of −4.8 °C. In a previous study that analyzed the impact of outdoor microclimates on building thermal performance simulations, a comparison was made between typical meteorological year (TMY) weather data and microclimate simulation output data. The results showed that there was a 19% difference in building cooling energy requirements [15]. Therefore, using typical climate year data for Hangzhou to modify the weather files is essential to accurately estimate the energy consumption and the impact of trees on the thermal environment of rural houses in this region.

2.3. Representative Model

Taking into account factors such as the orientation and topography of rural villages in Hangzhou, this study employed remote sensing information extraction and on-site investigation methods to extract the arbor types and related parameters of 20 villages, as well as their spatial relationship with neighboring houses. An analysis of common arbors and their spatial location relationship based on the extracted data was used in the simulation scenario setting. Compared with enumeration and idealized research, this approach is more authentic and the arbor-planting strategy derived from the study is more informative.

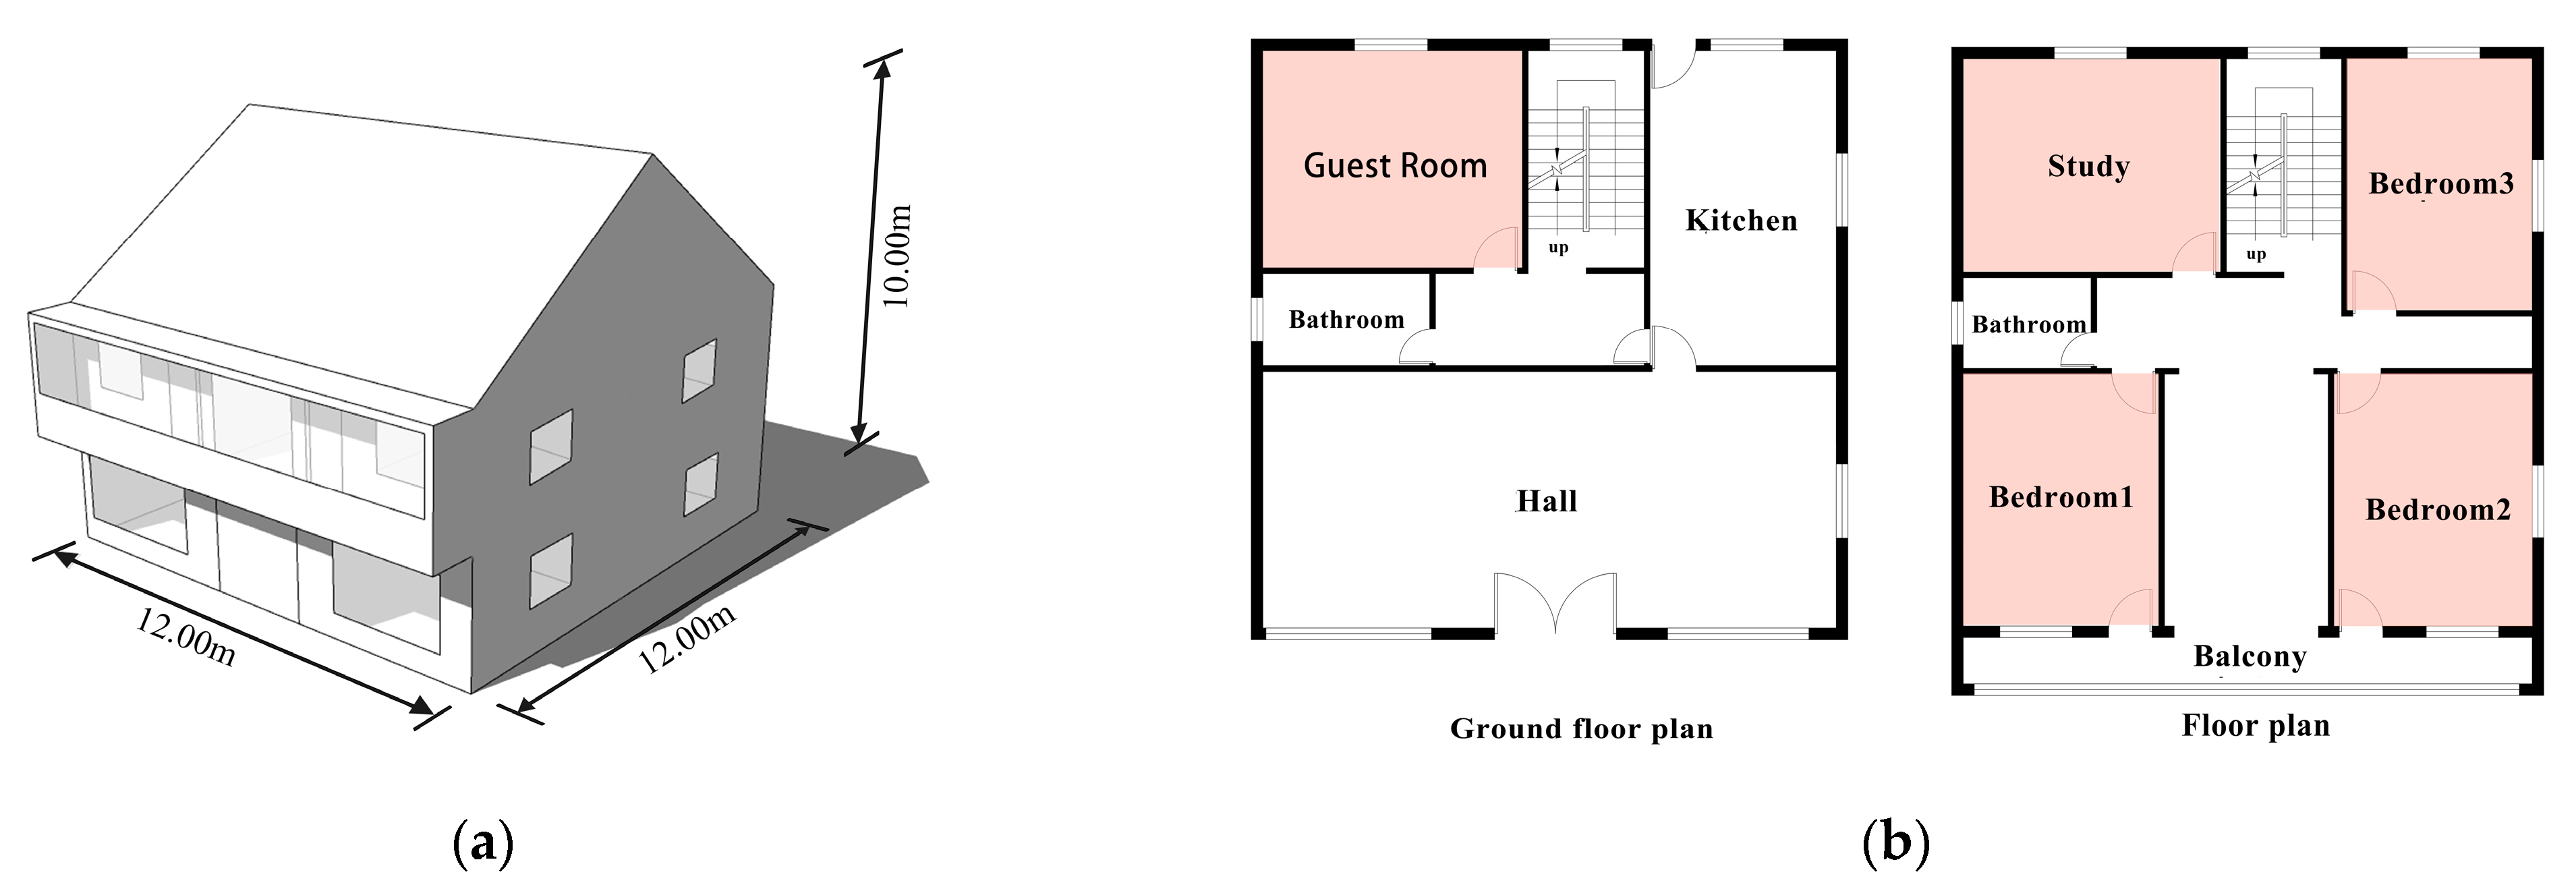
2.3.1. Establishment of Representative Rural House

In this study, information on rural houses in 20 administrative villages in the rural area of Hangzhou was collected. Obtaining the spatial data of adjacent rural houses and arbors in all villages in Hangzhou was a challenging process. The stratified sampling method proposed by Qi et al. [16] was used to obtain geometric information on selected rural houses. The authors divided the entire plain region into multiple subregions and selected several villages and towns in each subregion. Initially, the remote sensing image of Hangzhou village was divided into grid subregions using this method, followed by defining the subregions of the Hangzhou rural area. Figure 2 shows the number of each subregion in Hangzhou in this study, and the side length of each subregion in the grid is 20 km. Stratified random sampling was employed to ensure statistical accuracy while saving time and energy. Based on the grid division of the study area, 20 village samples were extracted from each area using a sampling method. Finally, statistical analysis of the rural houses in the sample villages resulted in their classification into five construction periods (Table 1). This study focused on rural houses constructed between 1949 and 2000 with a large building stock and poor thermal insulation of structure and materials. The floor plans of rural houses were drawn and a typical rural house model was established. Figure 3 shows the floor plan and model diagram of a typical rural house, which is a two-story sloping-roof building with two depths and three bays, with a length of 12 m, a width of 12 m, and a height of 10 m. The main building structure of rural houses in Hangzhou constructed during this period is brick-concrete structure, with outer walls mainly composed of brick and exterior decoration using lime and tiles. The roof is mainly tiled, and the enclosure insulation structure is poor. The structural characteristics of the rural house are presented in Table 2. The heat transfer coefficient (HTC) of each structure was determined by measuring and referencing the structural parameters of similar energy-saving building renovation research. Specifically, the roof structure parameters of the rural house were obtained from the research conducted by Zhao et al. [17]. The parameters of the floor and door were referenced from the setting of the rural house located in the hot-summer and cold-winter area of Huang et al. [18]. The parameters of the external walls and windows were determined using the principle of the ‘heat flow meter method’, and a JTRG-I wall and glass insulation performance testing device was used to measure the heat transfer coefficient of each specimen, i.e., external walls and windows. Figure 4 shows the internal structure and photos of the instrument. The JTRG-I wall and glass insulation performance testing device consists of three parts: a specimen rack, a cold box, and a hot box. The cold box and hot box simulate the indoor and outdoor environment of the wall, respectively. The specimen is mounted on the specimen frame, and several thermocouples and heat flow meters are attached to the cold and hot sides of the specimen, respectively. The wall temperature on both sides of the specimen and the heat flow through the specimen are measured [19]. The heat transfer coefficient of the envelope structure can be calculated using Equations (1) and (2). The heat transfer coefficient is defined as the heat transfer through a 1 m2 area within 1 h when the air temperature difference between the two sides of the envelope is 1 °C under stable heat transfer conditions [20]. The windows are single-layer glass, and the window-to-wall ratio is on average 0.13, with 0.03 on the east side, 0.27 on the south side, 0.04 on the west side, and 0.19 on the north side. Additionally, this simulation sets up five rooms in the rural house as thermal zones with air conditioning equipment operation, as shown in the red room in Figure 2.
H T C = Δ q / Δ t
In the above formula, Δq is heat transfer per unit area of enclosure structure per unit time, W·m−2; and Δt is air temperature difference on both sides of the enclosure member, °C.
The HTC and heat transfer resistance R0 are reciprocally related. The heat transfer resistance R0 is the sum of the thermal resistance of the specimen and the heat transfer resistance of the inner and outer surfaces, namely
R 0 = R i + R + R e
In the above formula, Ri is inner surface heat resistance, with a value of 0.11 m2·W−1; and Re is external surface heat transfer resistance, with a value of 0.04 m2·W−1.

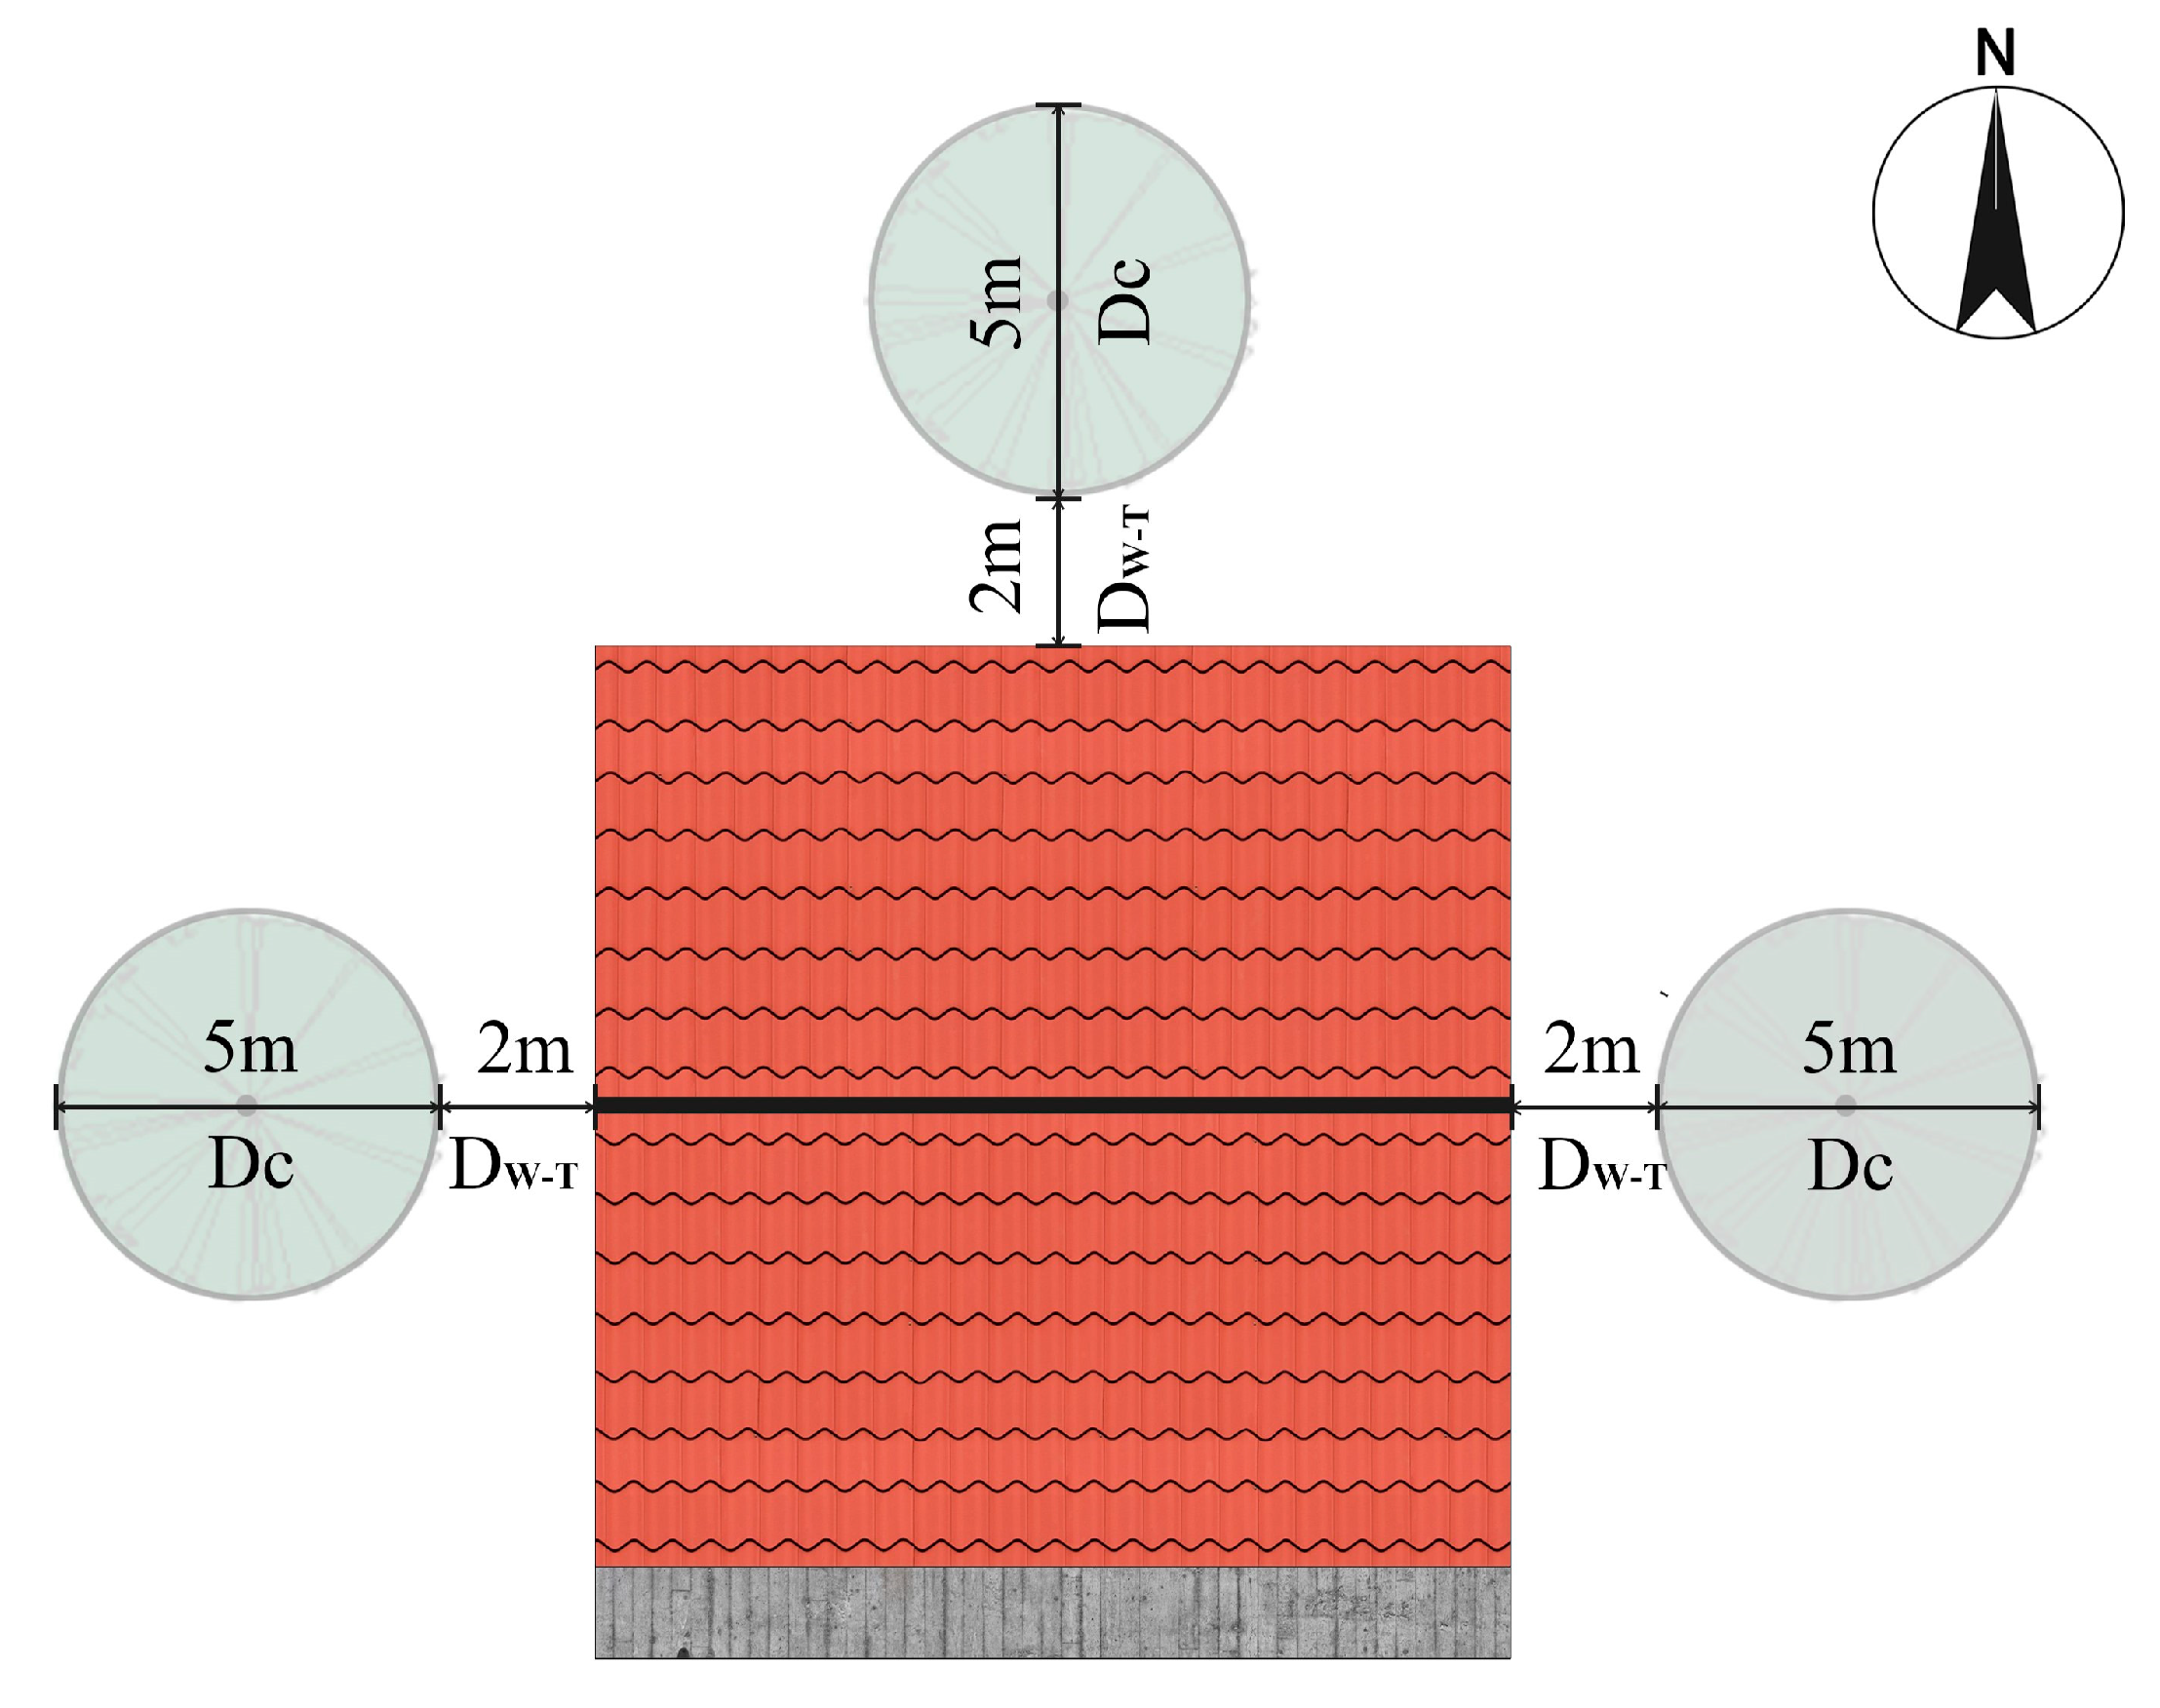
2.3.2. Arbor Type and Its Spatial Configuration Scheme

When studying the impact of the relationship between trees and residential space on energy consumption, most studies often make idealized assumptions about the layout scheme, without investigating the actual situation of tree planting. While there are government or local landscape planting policies and guidelines, such as those provided in relevant Australian policy documents [21] for the planting arrangement of native trees, and in Chinese guidelines for residential areas [22], there are no authoritative suggestions for rural areas. However, some researchers have overlooked this situation, resulting in research findings with limited practical reference for actual planting schemes. For example, Hsieh assumed the shortest distance between a building and a tree to be 3 m, without considering the potential for tree roots to damage pipelines in the building [23]. It should be noted that the spatial relationship between trees and residential buildings in urban street settings, and in areas around residential buildings, is often different from that in rural areas. The preliminary investigation in this study examined the spatial relationship between trees and adjacent rural houses. However, the findings may not be applicable to urban residential areas, where street trees and trees around communities are often located at a greater distance from buildings and are primarily planted to improve landscape greening and pedestrian comfort.
In order to obtain the common tree species of adjacent rural houses in Hangzhou rural area, according to the field measurement and remote sensing map information extraction method (Figure 5), six common arbors and their heights, crown diameters, leaf area densities (LADs) and other parameters in this area were counted, and three representative trees were selected for research; see Table 3. The LAD parameters were converted using the measured leaf area index (LAI) (Equation (3)), and the measured instruments are shown in Table 4. The statistics of neighboring trees in rural areas of Hangzhou revealed that local residents tended to choose flower-scented trees for planting. Apart from the shading effect and their ability to improve the surrounding thermal environment, residents also considered the ornamental and edible values of the trees while selecting them.
LAD = LAI/H
In the above formula, LAD is leaf area density, m2/m3; LAI is leaf area index; and H is height of trees, m.
Table 3 shows the LAD measurements of the trees in different seasons, which is a more realistic parameter setting for the simulated trees in the later stage. Additionally, the spatial relationship between the arbor species and rural houses was also measured and counted (Table 5). The main statistical items include the orientation of the trees relative to the rural house, as well as the distance between the tree canopy and the wall (DW-T). The data in Table 3 are divided into deciduous and evergreen types, facilitating the subsequent arbor parameter setting.

2.4. Scenarios

Based on the survey data described above, three arbors with similar crown diameters and plant heights, but varying summer leaf area densities (LADs), were selected as tree variables in the simulation scene. The primary difference between these trees in summer is the variation in LAD, while other parameters such as crown diameter and plant height are consistent. The objective was to analyze the change in energy consumption of the corresponding rural house by modifying the spatial relationship of the trees with respect to the building. Utilizing the arbor spatial relationship data in Table 3, the wall–crown distance (DW-T) variable was set to 1 m, 2 m, and 3 m. After conducting on-site research and considering actual conditions, it was discovered that trees were generally not planted on the south side of adjacent rural houses. As a result, three scenarios were established on the north, east, and west sides of the rural house, with a control group without adjacent trees being set up. In total, there were 28 working conditions, as shown in Table 6. Figure 6 illustrates three scenarios for the osmanthus tree, where the wall–crown distance is 2 m, the crown diameter (Dc) is the weight, and DW-T is the wall–crown distance.

2.5. Simulation Tool

The present research employs widely used free software and platforms in the field of microclimate and building energy consumption simulation, including ENVI-met, EnergyPlus, and Building Control Virtual Testbed (BCVTB). The goal was to use a joint simulation scheme for these three software tools, following Yang’s [24] approach, to analyze the dynamic relationship between the energy consumption of neighboring trees and rural houses. ENVI-met 4.0 was utilized to simulate the microclimate of the arbor environment around the rural houses. This software has been extensively utilized in previous studies to simulate the microclimate around buildings, given its foundation in computational fluid dynamics and thermodynamics. It primarily aims to model the interaction processes among the ground, vegetation, buildings, and atmosphere in small-scale urban spaces. EnergyPlus V22.1, a commonly used tool in the industry, was employed for building energy consumption simulation, as it is among the most frequently used software for building energy consumption analysis. Its convenient text-based input and output format allowed for cosimulation in this study. To modify the meteorological boundary conditions of the EnergyPlus model using the meteorological data obtained from ENVI-met simulations, BCVTB1.3 served as a platform to connect the two types of software. This platform, developed by the Lawrence Berkeley Laboratory (LBNL) development team and based on EnergyPlus, couples simulation software platforms, enabling EnergyPlus to connect with other simulation software or hardware for joint simulation. BCVTB was utilized in this study to combine ENVI-met and EnergyPlus, extracting the microclimate data of the surrounding arbors on the rural houses and simulating their energy consumption.

2.6. Simulation Process

Based on the statistical data obtained from the survey, simulation models using ENVI-met and EnergyPlus were established in accordance with the simulation flowchart (refer to Figure 7). As both software programs have been adapted to the SketchUp Pro 2021 platform for architectural design, and with the development of plug-ins, the scene model required for simulation was established using SketchUp Pro 2021, significantly reducing the time required for modeling and ensuring accuracy and consistency of building models across both platforms.
Data from ENVI-met simulations were extracted for all 28 scenarios; these data included air temperature, average humidity, wind speed, and exterior wall temperature in front of the rural house facade. Specifically, the air temperature and relative humidity in front of the rural house facade were used to generate weather files required for EnergyPlus simulations. The joint simulation module built on the BCVTB platform was utilized to replace the hourly external wall heat transfer coefficient of the rural house in EnergyPlus. This allowed for calculation of the energy consumption data required for the specified period. Finally, the results of energy consumption data were compared and analyzed.

2.6.1. Simulation and Data Extraction Using ENVI-Met

The ENVI-met model was calibrated using existing data, and the Albero module was utilized to establish the arbor model. The Forcing Manager weather management module was then employed to convert Hangzhou’s meteorological data into the weather files required for ENVI-met simulation. Following this, simulation files were created for simulation, and the simulation settings are presented in Table 7. As the accuracy of ENVI-met simulation decreases with an increase in speed, this study limited the number of scenarios to 25, focusing on the three main orientations of neighboring rural houses. The ENVI-met simulation outcomes were extracted using the Leonardo component. The data of the outer surface of the rural house were extracted on a unit-by-unit basis, including the air temperature in front of the facade, the temperature of the outer wall surface, the average humidity, and the wind speed. To reduce the workload of data extraction, this study utilized Datastudio in Leonardo to extract the required simulation data in batches. The access of Leonardo components to Python from ENVI-met 5.0 facilitated the data extraction work.

2.6.2. EnergyPlus Model

The cross-platform tool that supports EnergyPlus through OpenStudio (OS) is a visual operation platform developed based on the EnergyPlus framework. Compared with plain-text editing, OS makes it easier to expand the basic functions of EnergyPlus for various purposes, and facilitates the understanding and construction of EP models. In this study, the rural house model was built using the OS plug-in on the SketchUp Pro 3D modeling platform, and the relevant settings required for energy consumption simulation were configured in OS, including the structural parameters of the rural house and the types of internal spaces. See Table 8 for details of the settings. The simulation period was set from July 20th to 21st, with the indoor air conditioner temperature set at 26 °C.
According to the input parameters of EnergyPlus and the TARP algorithm used in the software as the surface convection algorithm: outside, the energy balance of one of the hot zones of EnergyPlus can be defined by establishing a formula:
Q loads = Q int + Q conv , int + Q inf + E a i r
In the above formula, Qloads is cooling/heating load, J; Qint is internal thermal gain of lighting, personnel, and equipment, J; Qconv,int is convective heat transfer between the inner surface of the region and air, J; and Eair is energy changes stored in regional air, J.

2.6.3. Combined Simulation Approach of EnergyPlus and ENVI-Met

One of the key inputs for the EnergyPlus model is the hourly weather file that includes hourly values of all major climate variables throughout the year. Typically, such weather data are based on statistical analysis of long-term climate records collected at weather stations in periurban areas. However, using such large-scale weather data alone may not effectively capture the impact of local microclimates on rural houses. To overcome this limitation, this study employed a joint simulation method developed by Yang [20], which utilizes ENVI-met microclimate simulation data and EnergyPlus through BCVTB to obtain a more accurate representation of the microclimate around the rural house and its impact on energy consumption.
The joint simulation process consists of two main steps. First, the EPW weather file variables, such as temperature, relative humidity, wind speed, and wind orientation, are replaced with the average microclimate around the rural house calculated by ENVI-met. Second, the original external surface convective heat transfer coefficient (CHTC) inside EnergyPlus is replaced using EnergyPlus’ actuator “Exterior Surface Convection Heat Transfer Coefficient”. This approach is more precise and efficient than traditional single-platform simulation methods. However, due to differences in the grid model establishment methods between ENVI-met and EnergyPlus, the building model of the same scene may differ. This issue has not been resolved satisfactorily as of yet.

3. Results and Discussion

3.1. Energy Consumption Simulation Results

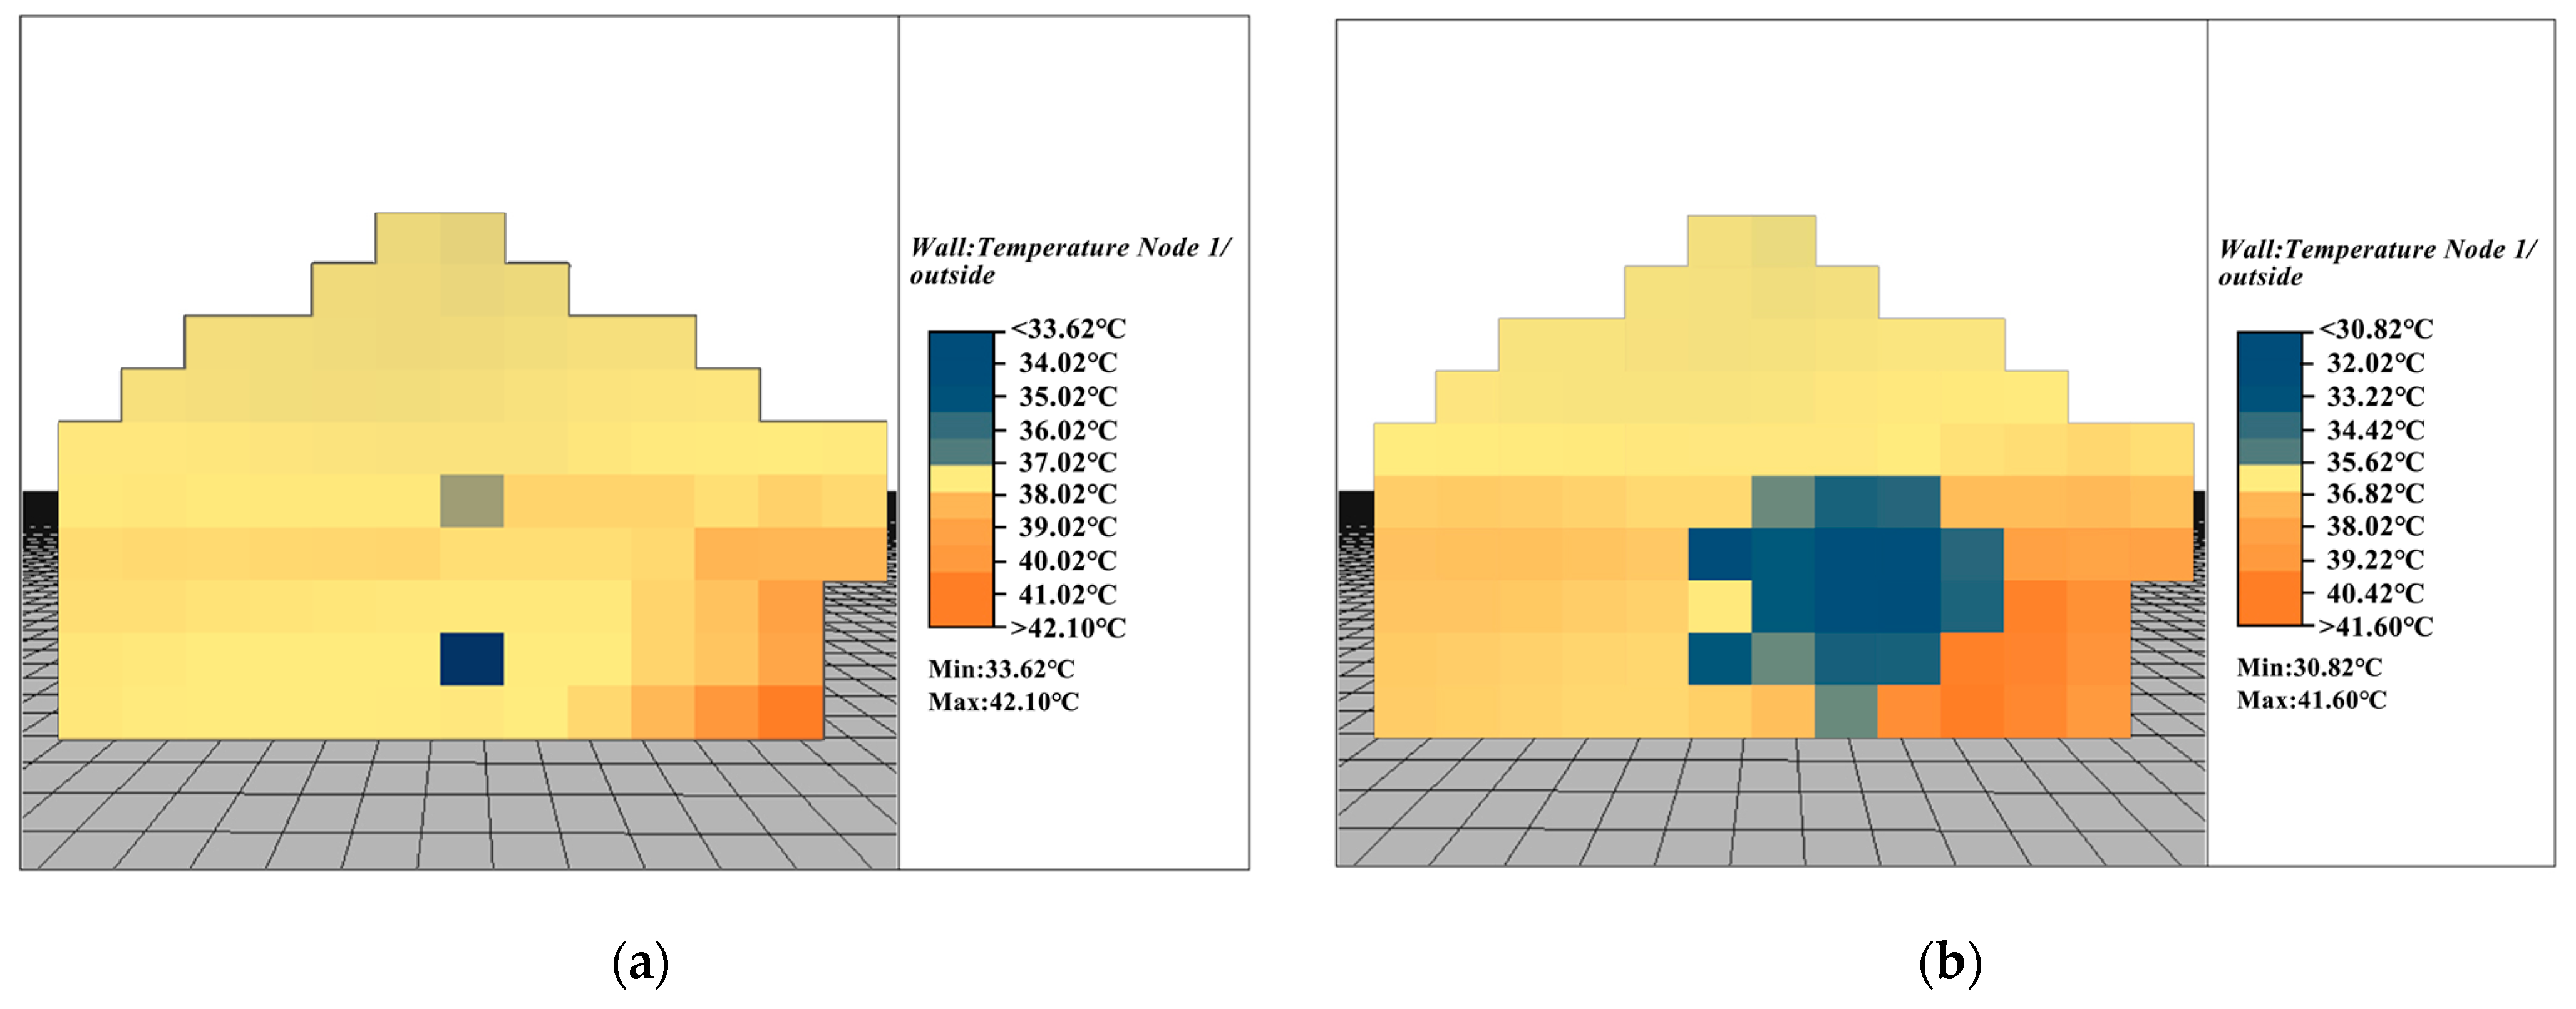
3.1.1. Arbor Cooling Effect

The simulation results of ENVI-met are presented in Figure 8, which shows the temperature distribution diagram of the wall surface of the rural house when the osmanthus tree is located on the west side of the rural house and the distance between the crown and the wall is 1 m. As can be observed, the temperature on the wall surface behind the tree is significantly lower than that of the nearby wall, with the highest temperature difference reaching 5.51 °C. This indicates that the arbor near the rural house has a cooling effect on the outer wall surface, which subsequently reduces the indoor temperature on this side, thereby leading to a reduction in energy consumption.
In order to understand the influence of other thermal environment factors in addition to the influence of trees on the temperature of the wall of the rural house, such as the air temperature around the house, the following makes the regulation of trees on the microclimate around the adjacent farmhouse more intuitive. The results of the thermal environment impact of trees around the rural house in the ENVI-met dynamic simulation results are extracted. Figure 9 is the air temperature map of the east and west sides of the house when the osmanthus tree is on the west side of the rural house and the wall–crown distance is 1 m. The time span of the simulation results is 8:00–20:00 on July 20. From the diagram, it can be seen that the air temperature on the left side (west side) of the farmhouse is constantly changing with time. In the morning, the temperature of the osmanthus tree is higher than the surrounding temperature. It is speculated that this is due to the heat storage of the trees on the west side at night, and its specific heat capacity is higher than the wall on the west side of the rural house. The temperature of the osmanthus tree in the morning is higher than that near the wall on the west side. In the evening time, such as t 18:00, it can be seen that the temperature on the west side of the rural house is significantly lower than that of the surrounding environment due to the influence of osmanthus trees, which indicates that the trees planted on the west side of the rural house can play a role in cooling the temperature on the west side in the evening.

3.1.2. Energy-Saving Effect

The simulation results indicate that the absence of trees around the rural houses results in higher cooling energy consumption during the summer. Figure 10 shows that the five thermal zones, especially the three rooms on the south and west sides, consume more energy. The two rooms on the south side have large windows for lighting, which increase the air conditioning energy consumption in summer. Although the two rooms on the west side do not have windows facing west to avoid the evening sun, the temperature in the rooms is still higher in the evening due to the heat absorbed by the west-facing walls, resulting in greater energy consumption.
Figure 11, Figure 12 and Figure 13 present the energy-saving effects of different tree species planted at various DW-T in different orientations. To better illustrate the impact of tree planting on the cooling energy consumption of rural houses, energy-saving rates are introduced to quantify the energy-saving effects under different planting scenarios. The energy-saving rate formula is provided in Equation (5) and the results in Figure 11, Figure 12 and Figure 13 demonstrate that tree planting has a certain effect on reducing energy consumption when compared with having no arbors. The energy-saving rate ranges from 0.43% to 14.98% and the energy-saving effect of trees has a positive or negative relationship with LAD, the DW-T, and the orientation.
To quantitatively analyze the impact of LAD on the single-day air conditioning and cooling energy consumption of rural houses in summer, the energy-saving rate is calculated with LAD as a variable while the DW-T is fixed at 2 m. The results presented in Figure 14 indicate that when the crown diameters of the three trees are the same, the energy-saving rate of each orientation increases with the increase in LAD. However, since the LAD of the three arbors is not a positive integer in the arithmetic sequence, the study cannot conclude whether the effect of LAD on the energy-saving effect of rural houses in different orientations is a linear relationship when other parameters are held constant.
E r = Δ E E 100 %
In the above formula, Er is the energy-saving rate; ΔE is the difference between the daily energy consumption after planting arbors and the daily energy consumption without arbors; and E is the initial daily energy consumption in the scene without arbors, Kwh.
Figure 15 presents the impact of three types of arbors on the single-day air conditioning and cooling energy consumption of the rural house during summer, under various DW-T, in the scene on the west side of the rural house. The results demonstrate that as the DW-T gradually increases, the energy-saving effects of the three types of arbors on the rural house decline when the orientation is the same as that of the west side of the rural house. It is speculated that the energy-saving effect of arbors is influenced by their shading and transpiration effects, which decrease as the arbor moves farther away from the rural house. Nevertheless, it is necessary to consider other factors in addition to shading effects when selecting a tree-planting strategy, particularly on the east side of the rural house and near the window area. These factors include ensuring a certain level of lighting. Thus, when the DW-T is smaller, the energy-saving effect may not necessarily be better, and other factors such as lighting must be taken into account in the tree-planting strategy selection.
To investigate the energy-saving effect of trees in different orientations of the rural house, this study selected eucalyptus with a medium density of LAD as an example when the DW-T was 2 m, as depicted in Figure 16. The findings indicate that the energy-saving effect on the west side is the most significant among the three orientations, with a rate of 6.88%, while the energy-saving rate on the north side is the lowest, at 2.74%. Considering the energy consumption analysis of thermal zones in various orientations without arbors that is shown in Figure 10, planting trees near the west room where air conditioning and cooling energy consumption is high in summer can achieve a better energy-saving effect.

3.2. Comprehensive Evaluation

To more intuitively demonstrate the influence of different tree ontology characteristics and spatial relationships with rural houses on energy consumption, we established a comprehensive evaluation model of various arbor-planting schemes. Using simulation data, we generated a heat map that depicts the energy-saving potential of each arbor during the summer, as shown in Figure 17. This map represents the comprehensive energy-saving effect of each tree configuration.
The diagram not only presents the energy-saving effect of different influencing factors but also explains the energy-saving effect based on the thermal distribution of the energy-saving effect. The energy-saving effect is mainly concentrated in certain factors, and we ranked the influencing degree of each factor. The thermal distribution map shows that the deeper the blue color, the better the energy-saving effect of the tree configuration.
From the energy-saving rate’s thermal distribution map in the figure, we observed that Area A has the darkest color, indicating that Osmanthus fragrans has better energy-saving potential than other trees in summer. The heat map shows that the highest energy-saving rate of 14.98% occurs when Osmanthus fragrans is planted on the west side of the farmhouse with a DW-T of 1 m.
Moreover, the map illustrates that areas with darker colors mostly appear on the west side, and the green on this side gradually becomes lighter with an increasing DW-T. This suggests that the effect of each tree on the west side is relatively higher than it is for other orientations, and the energy-saving rate is higher. However, with the increasing DW-T, the energy-saving rate gradually reduces.
Without considering lighting, the thermal distribution of the comprehensive model indicates that the highest energy-saving rate occurs when the three tree-planting schemes are on the west side of the rural house and the DW-T is 1 m.

4. Conclusions

By integrating survey methods, remote sensing information extraction methods, and simulation methods, we conducted an analysis of the energy-saving effects of different trees adjacent to rural houses from various orientations. The following conclusions were drawn:
(1)
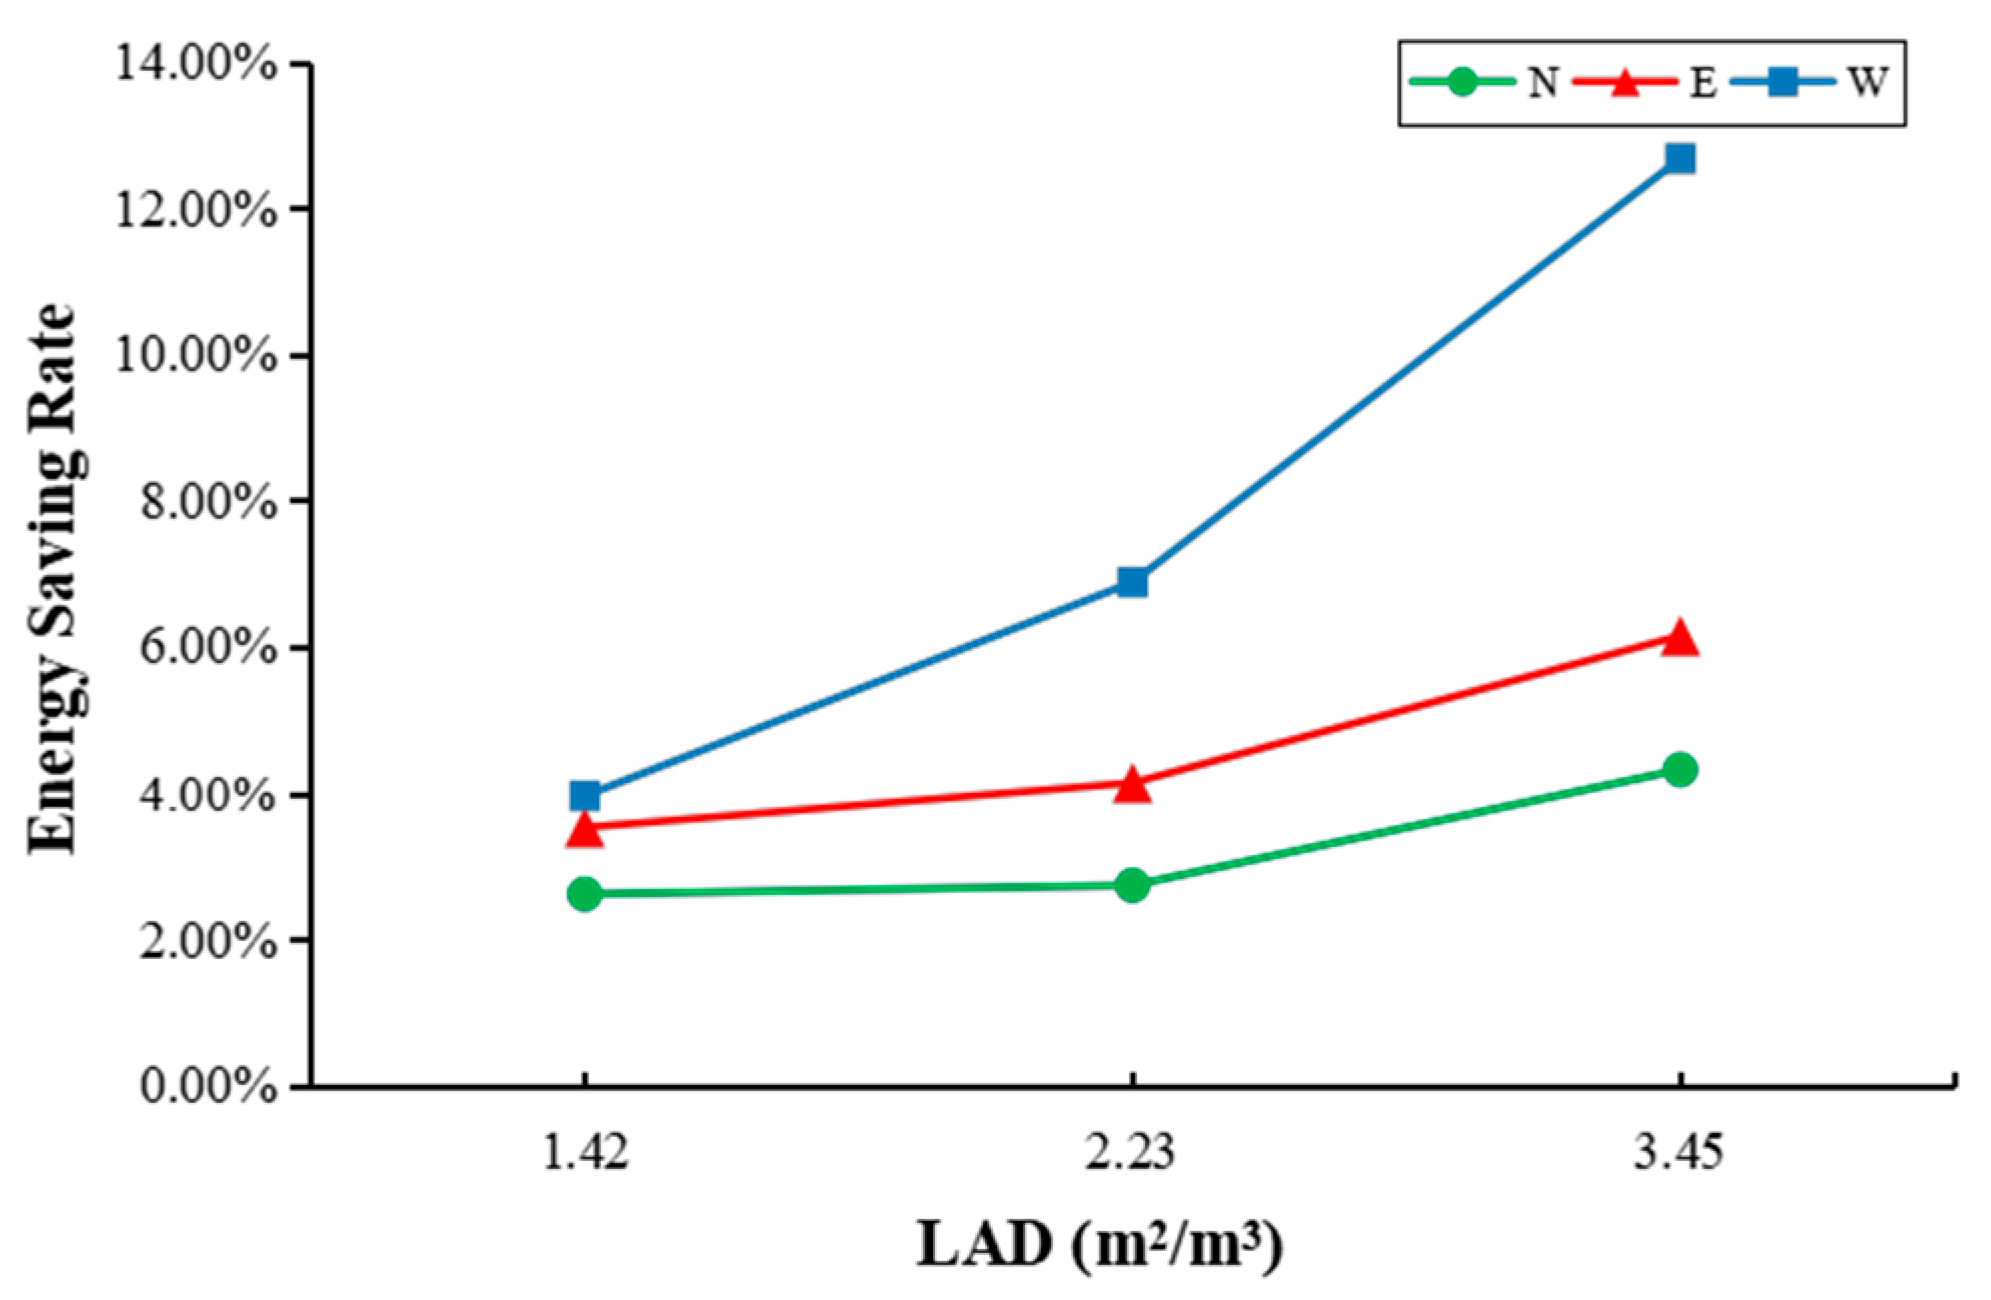
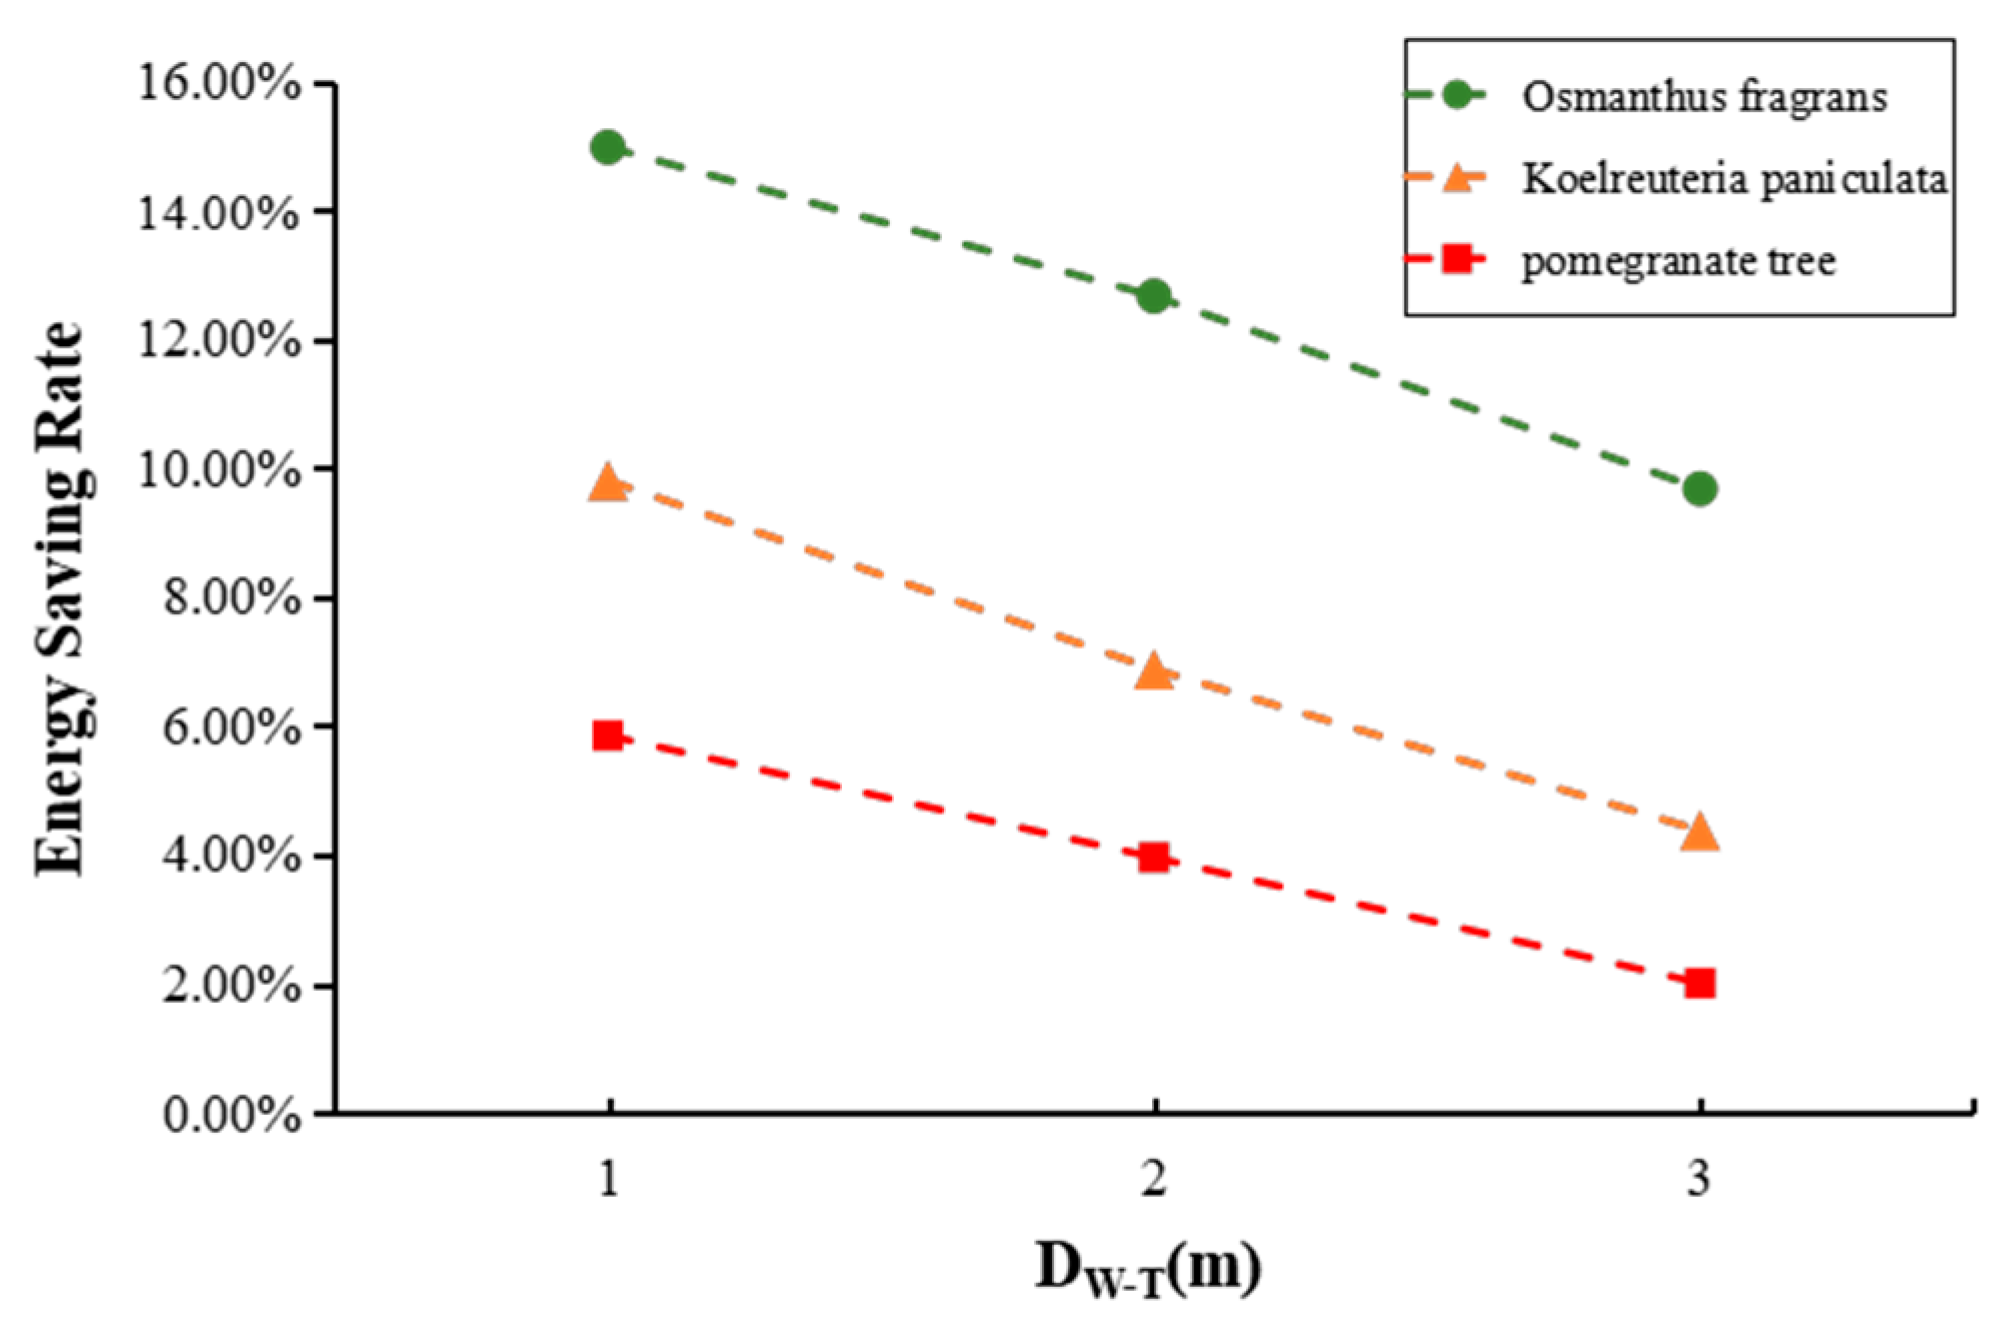
The higher the LAD, the better the energy-saving effect of the arbor on the rural house. When three arbors with different LADs are planted on the east side of a rural house under the same conditions, their energy-saving rates from high to low are as follows: Osmanthus fragrans, Koelreuteria paniculata, and pomegranate trees. When the DW-T = 1 m, Osmanthus fragrans has the highest energy-saving rate of 7.92%.
(2)
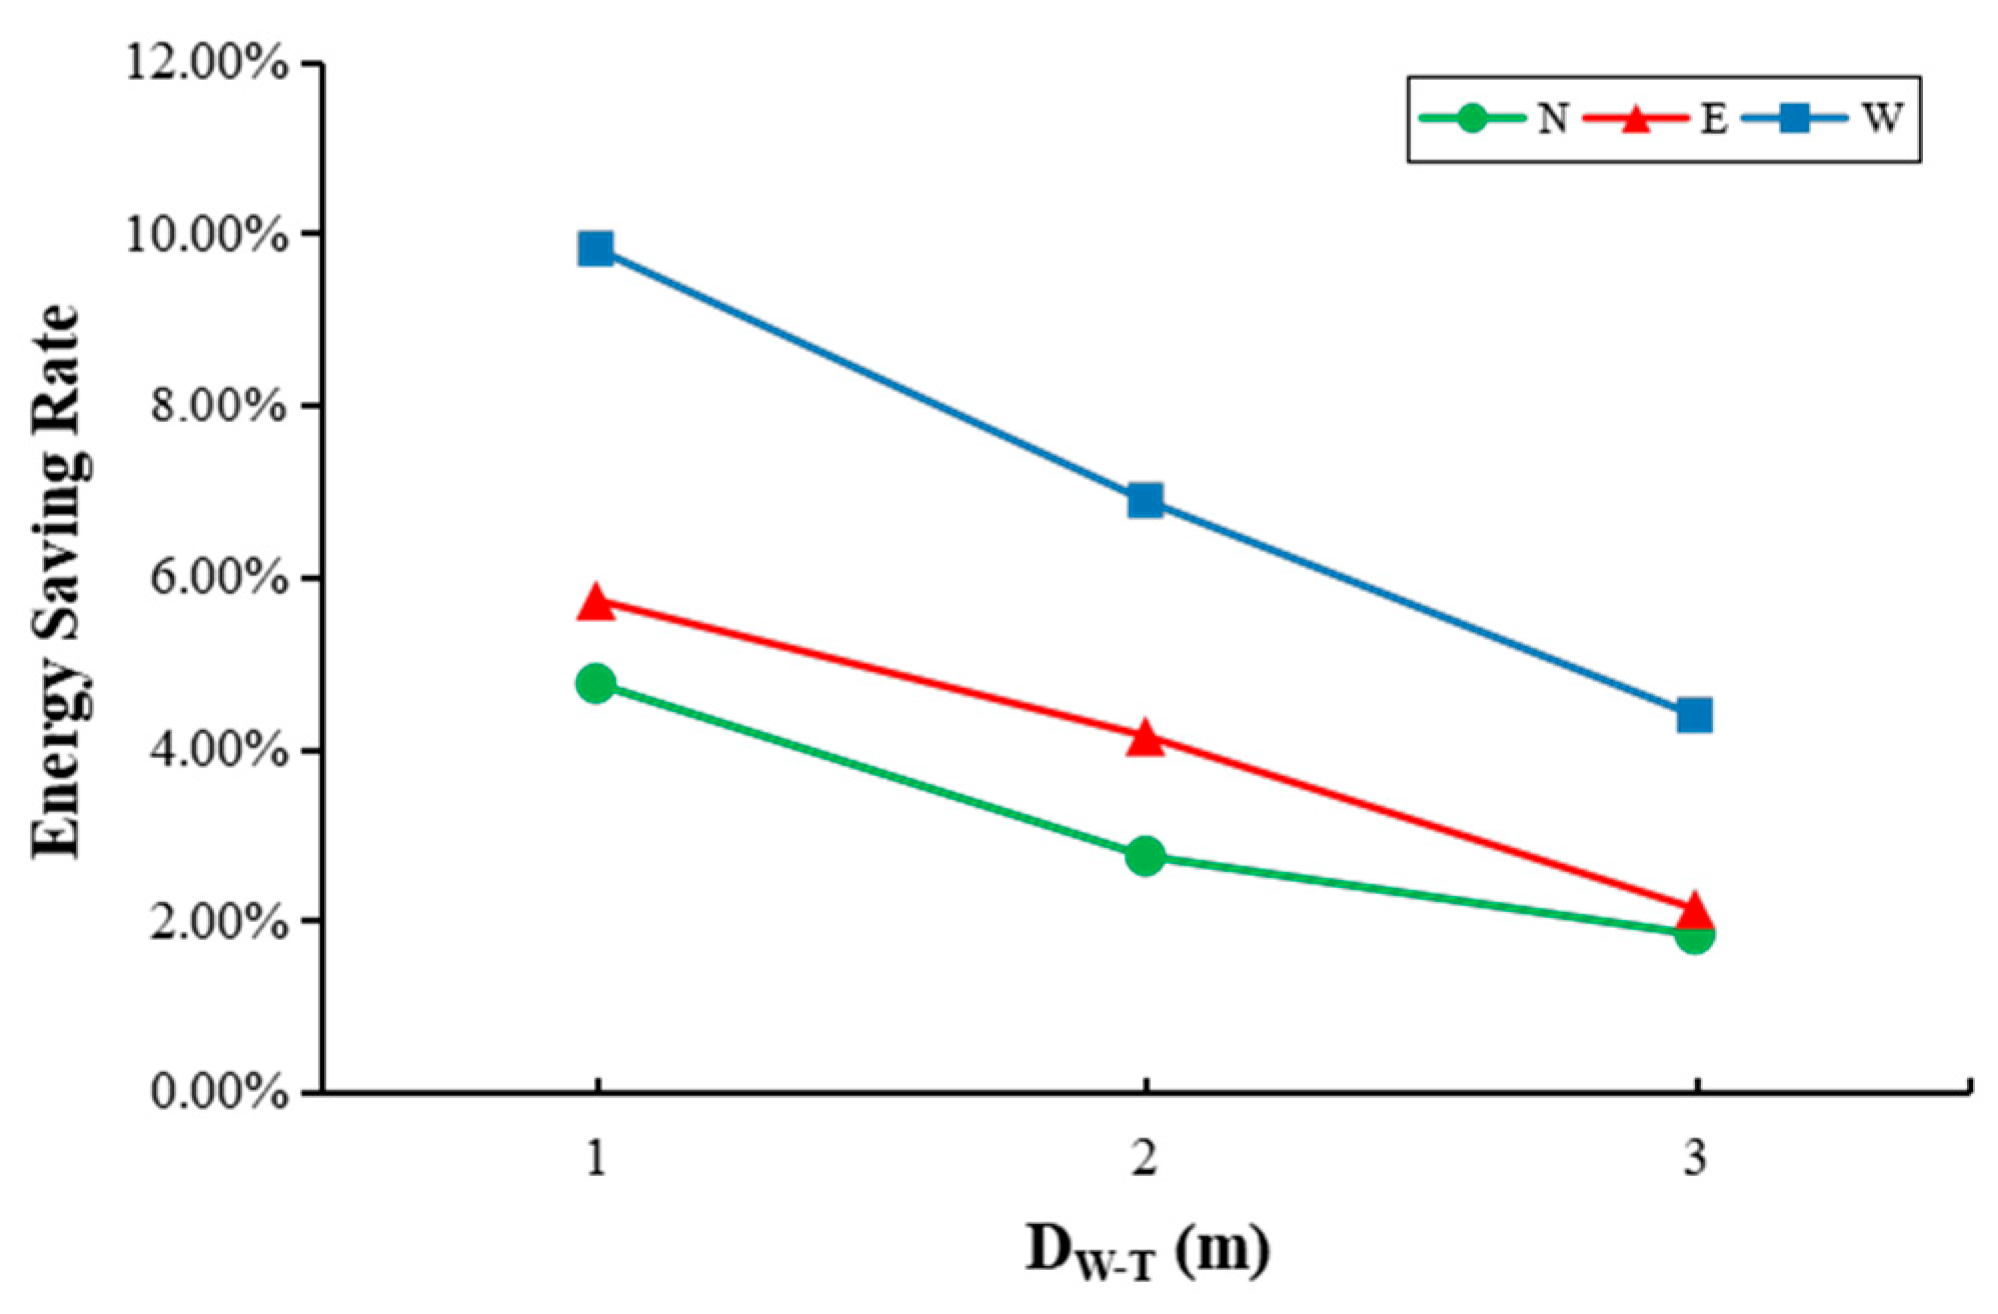
The closer the DC, the higher the energy-saving rate of the arbor on the rural house. For a moderately dense Koelreuteria paniculata planted on the west side of a rural house, when the DW-T increases from 1 m to 3 m, the energy-saving rate of the arbor decreases from 9.81% to 4.38%.
(3)
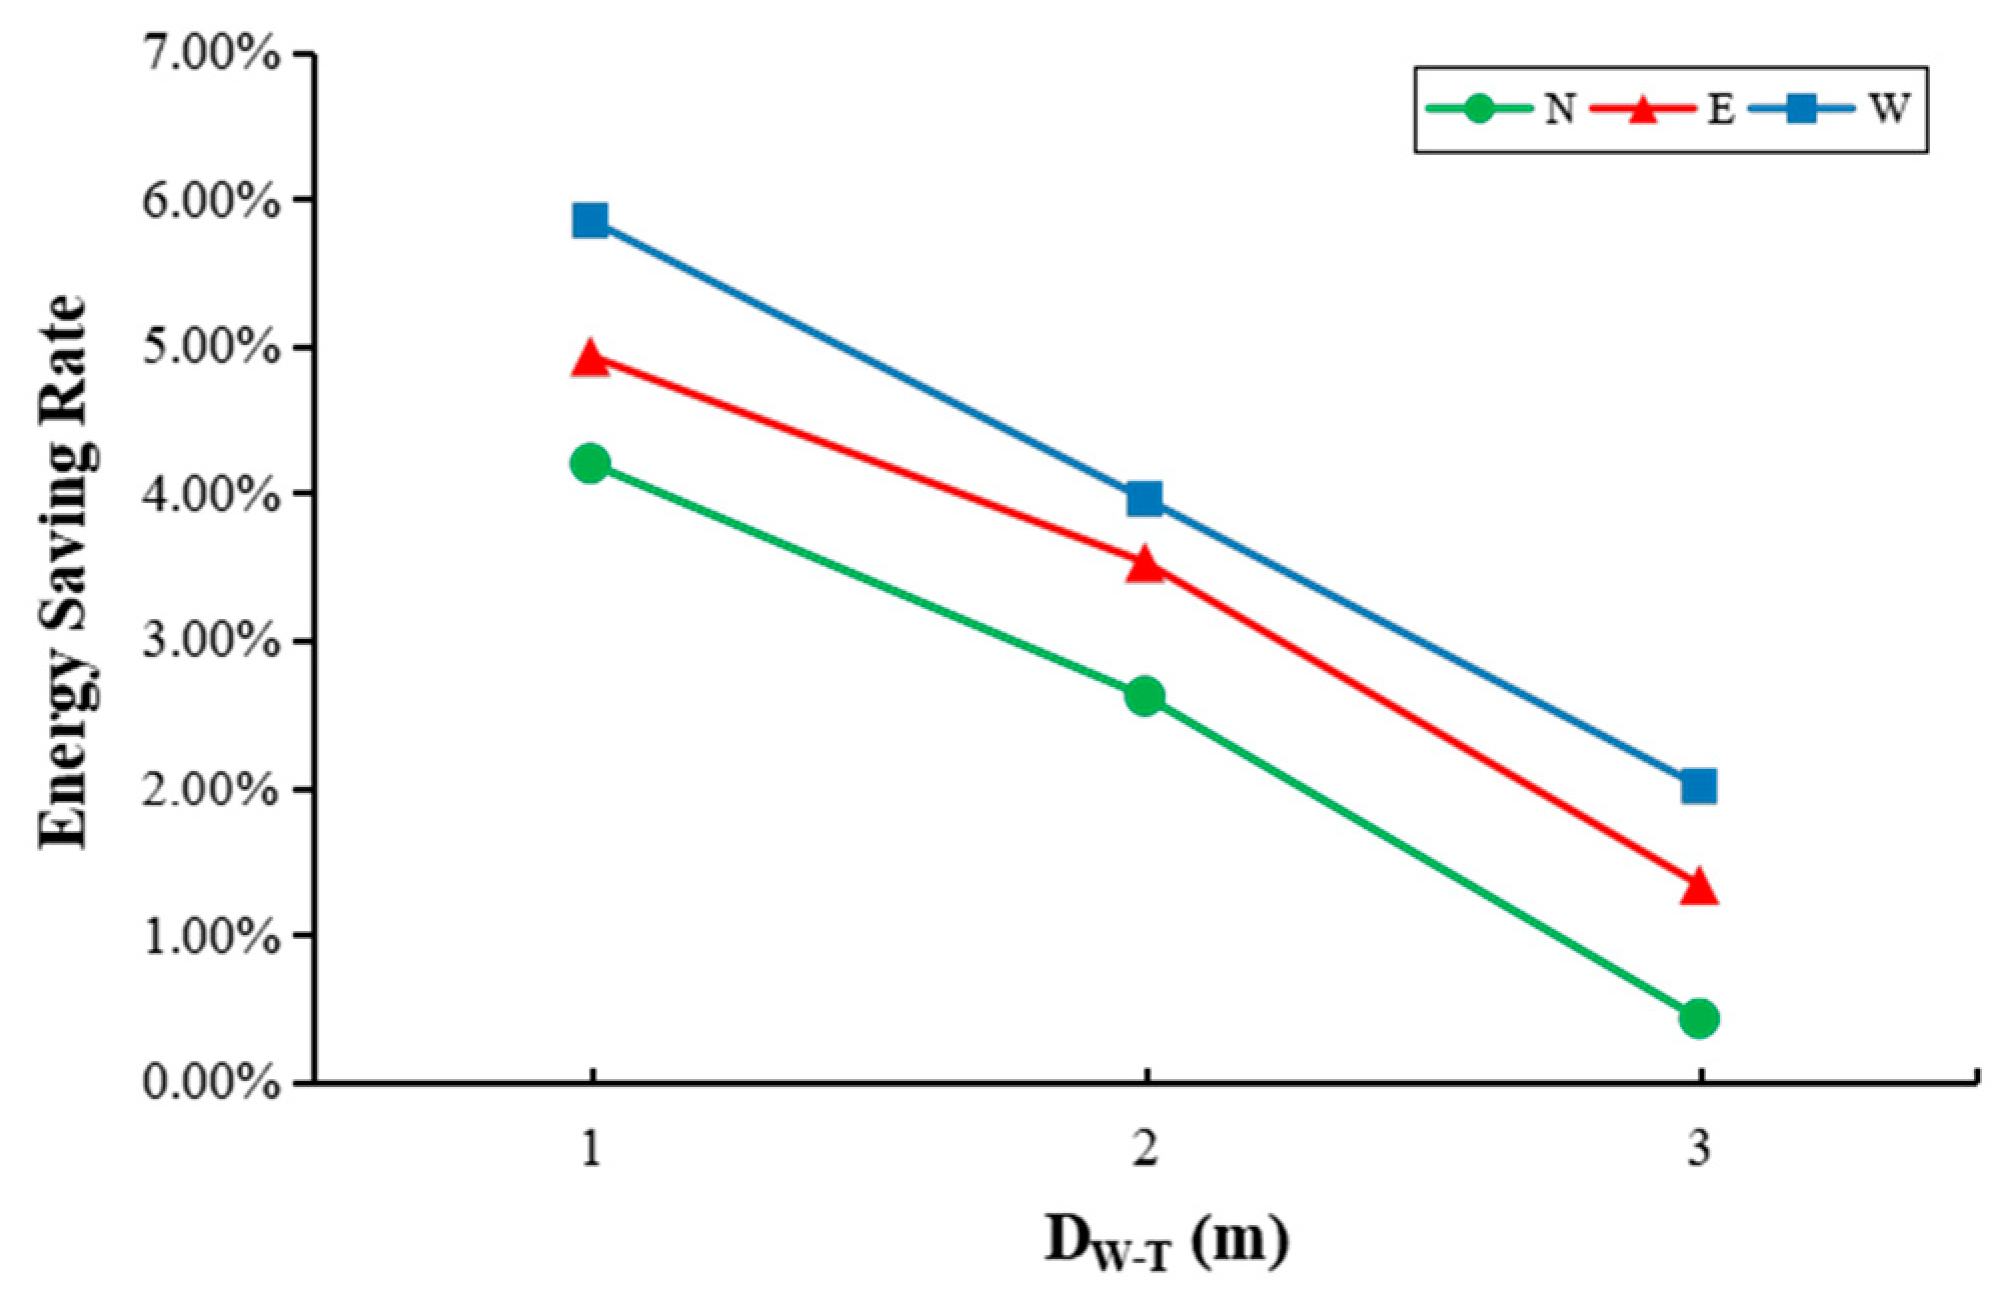
Through a comparison of energy-saving rates, it was found that planting arbors on the west side of rural houses has better energy-saving effects than planting them on the east and north sides. Under the same LAD and DW-T conditions, the energy-saving rate of the arbor on the west side of a rural house can range from 2.1% to 14.98%.

Author Contributions

Conceptualization, X.Z. and F.Q.; methodology, X.Z. and L.N.; software, X.Z.; validation, F.Q. and T.Z.; formal analysis, X.Z. and F.Q.; investigation, X.Z. and L.N.; resources, F.Q.; data curation, X.Z.; writing—original draft preparation, X.Z., F.Q., L.N. and T.Z.; writing—review and editing, X.Z. and F.Q.; visualization, X.Z.; supervision, F.Q.; project administration, X.Z. and F.Q.; funding acquisition, F.Q. All authors have read and agreed to the published version of the manuscript.

Funding

This work was supported by the National Natural Science Foundation of China (Grant No. 5197081040).

Institutional Review Board Statement

Not applicable.

Informed Consent Statement

Not applicable.

Data Availability Statement

Data will be made available on request.

Conflicts of Interest

The authors declare that they have no known competing financial interest or personal relationship that could have appeared to influence the work reported in this paper.

Abbreviations

TMYTypical meteorological year
EPWEnergyPlus WeatherFile
LADLeaf area density
LAILeaf area index
HTCHeat transfer coefficient
CHTCConvective heat transfer coefficient

References

  1. IEA. Key World Energy Statistics; International Energy Agency: Paris, France, 2014; p. 3. [Google Scholar]
  2. 2019 Global Status Report for Buildings and Construction. Available online: https://www.iea.org/reports/global-status-reportfor-buildings-and-construction-2019 (accessed on 15 June 2022).
  3. Building Energy Efficiency Research Center of Tsinghua University. 2020 Annual Report on China Building Energy Efficiency; China Architecture & Building Press: Beijing, China, 2020. [Google Scholar]
  4. Miao, Z.; Jiang, H.; Li, C. Energy Saving Optimization of Envelop of Existing Rural Residential Buildings in Laizhou Bay Area. Build. Energy Effic. 2021, 49, 114–118. [Google Scholar]
  5. Liu, Y.; Huang, Z.; Wang, Y. Energy Saving Design of Farm House Based on Seasonal Difference of Multi-Space Thermal Environment Quality and User Spatial Behavior. Build. Sci. 2022, 38, 216–222. [Google Scholar]
  6. McPherson, E.G.; Simpson, J.R. Potential energy savings in buildings by an urban tree planting programme in California. Urban For. Urban Green. 2003, 2, 73–86. [Google Scholar] [CrossRef]
  7. Wong, I.; Baldwin, A.N. Investigating the potential of applying vertical green walls to high-rise residential buildings for energy-saving in sub-tropical region. Build. Environ. 2016, 97, 34–39. [Google Scholar] [CrossRef]
  8. Donovan, G.H.; Butry, D.T. The value of shade: Estimating the effect of urban trees on summertime electricity use. Energy Build. 2009, 41, 662–668. [Google Scholar] [CrossRef]
  9. Hwang, W.H.; Wiseman, P.E.; Thomas, V.A. Simulation of shade tree effects on residential energy consumption in four US cities. Cities Environ. (CATE) 2016, 9, 2. [Google Scholar]
  10. Chagolla, M.A.; Alvarez, G.; Simá, E.; Tovar, R.; Huelsz, G. Effect of Tree Shading on the Thermal Load of a House in a Warm Climate Zone in Mexico; ASME International Mechanical Engineering Congress and Exposition: Columbus, OH, USA, 2012. [Google Scholar]
  11. Huang, Y.J.; Akbari, H.; Taha, H. The wind-shielding and shading effects of trees on residential heating and cooling requirements. In Proceedings of the 1990 ASHRAE Proceedings, Atlanta, GA, USA, 10–14 February 1990; Volume 96 Pt 1. [Google Scholar]
  12. Rouhollahi, M.; Whaley, D.; Byrne, J.; Boland, J. Potential residential tree arrangement to optimise dwelling energy efficiency. Energy Build. 2022, 261, 111962. [Google Scholar] [CrossRef]
  13. GB 50176-2016; Code for Thermal Design of Civil Building. China Architecture & Building Press: Beijing, China, 2016.
  14. Zhang, Q. Standard Meteorological Database for Buildings in China; Mechanical Industry Press: Beijing, China, 2004. [Google Scholar]
  15. Castaldo, V.L.; Pisello, A.L.; Piselli, C.; Fabiani, C.; Cotana, F.; Santamouris, M. How outdoor microclimate mitigation affects building thermal-energy performance: A new design-stage method for energy saving in residential near-zero energy settlements in Italy. Renew. Energy 2018, 127, 920–935. [Google Scholar] [CrossRef]
  16. Qi, F.; Cui, F.; Lv, W.; Zhang, T.; Musonda, B.M. Regional similarity of shape coefficient of rural residences—Taking Hangzhou rural region as a case. Build. Simul. China 2019, 12, 597–604. [Google Scholar] [CrossRef]
  17. Zhao, L.; Ouyang, J. Summer Indoor Thermal Environment Investigation and Optimized Design of Energy Saving Reform Project for New Farmhouse in Hot Summer and Cold Winter Region. Refrig. Air Cond. 2018, 32, 616–622. [Google Scholar]
  18. Huang, Z.; Liu, Y.; Pan, C.; Wang, Y.; Yu, H.; He, W. Energy-saving effects of yard spaces considering spatiotemporal activity patterns of rural Chinese farm households. J. Clean. Prod. 2022, 355, 131843. [Google Scholar] [CrossRef]
  19. GB/T 10295-2008; Thermal Insulation—Determination of Steady-State Thermal Resistance and Related Properties-Heat Flow Meter Apparatus. Standards Press of China: Beijing, China, 2008.
  20. GB 50176-1993; Thermal Design Code for Civil Building. China Planning Press: Beijing, China, 1993.
  21. Morakinyo, T.E.; Ouyang, W.; Lau, K.K.L.; Ren, C.; Ng, E. Right tree, right place (urban canyon): Tree species selection approach for optimum urban heat mitigation-development and evaluation. Sci. Total Environ. 2020, 719, 137461. [Google Scholar] [CrossRef] [PubMed]
  22. Housing Industrialization Promotion Center of the Ministry of Construction. Directive Code of Residential Areas Environment & Landscape Design; China Architecture & Building Press: Beijing, China, 2009. [Google Scholar]
  23. Hsieh, C.M.; Li, J.J.; Zhang, L.; Schwegler, B. Effects of tree shading and transpiration on building cooling energy use. Energy Build. 2018, 159, 382–397. [Google Scholar] [CrossRef]
  24. Yang, X.; Zhao, L.; Bruse, M.; Meng, Q. An integrated simulation method for building energy performance assessment in urban environments. Energy Build. 2012, 54, 243–251. [Google Scholar] [CrossRef]
Figure 1. Flowchart of methodology.
Sustainability 15 06853 g001
Figure 2. Grid partition of the study area in Hangzhou rural region for sample selection.
Sustainability 15 06853 g002
Figure 3. Rural house model and floor plan. (a) Rural house model drawing. (b) Rural house floor plan.
Sustainability 15 06853 g003
Figure 4. JTRG-I wall and glass thermal insulation performance detection device.
Sustainability 15 06853 g004
Figure 5. Remote sensing map of the spatial relationship between the rural house and the arbor.
Sustainability 15 06853 g005
Figure 6. The layout of rural house and arbor.
Sustainability 15 06853 g006
Figure 7. Framework of simulation process.
Sustainability 15 06853 g007
Figure 8. Temperature map of the west wall of the rural house in summer. (a) No arbor. (b) Planting osmanthus trees on the west side, DW-T = 1 m.
Sustainability 15 06853 g008
Figure 9. Effect of osmanthus trees on air temperature around rural houses (DW-T = 1).
Sustainability 15 06853 g009
Figure 10. Monthly energy consumption of each thermal zone in the rural houses in summer.
Sustainability 15 06853 g010
Figure 11. Effects of Osmanthus fragrans DW-T on energy-saving rate of rural houses under different orientations (LAD = 3.45 m2/m3, Dc = 4 m).
Sustainability 15 06853 g011
Figure 12. Effects of DW-T of eucalyptus in different orientations on energy-saving rate of rural houses (LAD = 2.23 m2/m3, Dc = 4 m).
Sustainability 15 06853 g012
Figure 13. Effects of pomegranate DW-T on energy-saving rate of rural houses under different orientations (LAD = 1.42 m2/m3, Dc = 4 m).
Sustainability 15 06853 g013
Figure 14. Influence of trees in different orientations on the energy-saving rate of rural houses (DW-T = 2 m, Dc = 4 m).
Sustainability 15 06853 g014
Figure 15. Effects of various arbors with different DW-T on the west side on the energy-saving rate of rural houses (Dc = 4 m).
Sustainability 15 06853 g015
Figure 16. Effects of arbors in various orientations on the energy-saving rate of rural houses (LAD = 2.23, DW-T = 2, Dc = 4 m).
Sustainability 15 06853 g016
Figure 17. Comprehensive assessment model.
Sustainability 15 06853 g017
Table 1. Proportions of rural houses in different periods.
PeriodPer Capita Building Area (m2)LayersBuilding Shape Coefficient 1Proportion of Construction Stock
–194910~2010.2–0.33.25%
1949–198015.920.3–0.529.89%
1980–200030.720.4–0.628.31%
2000–201036.530.5–0.720.24%
2010–47.130.6–0.818.31%
1 Building shape coefficient: The ratio of the compactness of the building shape to the perimeter is one of the important factors affecting the heat consumption index of the building, and it is also an important index in the building energy-saving design.
Table 2. Building structure and material properties.
Structure TypeThickness d/mmHTC/(W/(m2·K))
Exterior wall3201.54
Roof1803.67
Floor1001.53
Windows (single layer)63.50
Exterior door451.50
Table 3. Common arbor characteristics and parameters.
Arbor SpeciesPlant Height
(m)
Crown Diameter
(m)
LAD (m2/m3)
SummerWinter
EvergreenOsmanthus fragrans4.004.003.453.40
Medicinal citron6.003.502.101.86
Magnolia grandiflora12.005.002.001.65
DeciduousPomegranate tree4.004.001.420.56
Koelreuteria paniculata4.004.002.230.42
Metasequoia156.001.500.18
Table 4. Statistics on the spatial relationship between arbor and rural houses.
Arbor SpeciesAzimuthDW-T (m)Average Height (m)
EvergreenN
E
W
19%
43%
38%
133.00%5
242.16%
323.64%
41.20%
DeciduousN
E
W
17%
32%
51%
119.32%4
239.68%
321.63%
47.95%
511.42%
Table 5. Measuring instruments used in field survey.
Measuring ItemsApparatusAccuracy
LAILAI-2200 Plan Canopy Analyzer
(LI-COR Biosciences, Lincoln, NE, USA)
______Sustainability 15 06853 i001
Arbor characteristicsBOSCH DLE70
(Robert Bosch GmbH, Stuttgart, Germany)
±1.5 mmSustainability 15 06853 i002
Table 6. Scenarios.
Table 6. Scenarios.
Serial NumberArbor SpeciesPositionDW-T (m)
1
2Osmanthus fragransE1
3E2
4E3
5W1
6W2
7W3
8N1
9N2
10N3
11Koelreuteria paniculataE1
12E2
13E3
14W1
15W2
16W3
17N1
18N2
19N3
20Pomegranate treeE1
21E2
22E3
23W1
24W2
25W3
26N1
27N2
28N3
Table 7. ENVI-met simulation settings.
ENVI-Met ConditionValue
Scope121 × 121 × 25 m
Precision1 m × 1 m
Simulation date20 July–21 July
Ground parametersConcrete: Thickness 20 cm, Albedo 0.23
Weather dataCHN_Zhejiang.Hangzhou.584570_CSWD
Table 8. EnergyPlus simulation conditions.
EnergyPlus
Condition
Value
Rural house informationThe structural information is shown in Table 1
Window to wall ratioEast: 3%; South: 27%; West: 4%; North: 19%
Weather dataModified EPW files based on ENVI-met simulation
Indoor temperature setting26 °C (Summer)
Simulation date20 July–21 July
Internal heat gainsPeople—15.3 m2/person with activity level of 117 W/person
Electrical equipment—10.8 W/m2
Airtightness2.3 h−1
Disclaimer/Publisher’s Note: The statements, opinions and data contained in all publications are solely those of the individual author(s) and contributor(s) and not of MDPI and/or the editor(s). MDPI and/or the editor(s) disclaim responsibility for any injury to people or property resulting from any ideas, methods, instructions or products referred to in the content.

