Abstract
The over-exploitation of groundwater resources is a significant concern due to the potential risks associated with the depletion of this valuable freshwater source. Future planning must consider changes in groundwater availability and urban expansion which are critical for understanding urban growth patterns. This study aims to investigate the impact of land cover change on groundwater depletion. Further, the Land surface temperature (LST) analysis has been performed to find the spatial spread of urbanization and its impact on surface temperature. The Gravity Recovery and Climate Experiment (GRACE) data for groundwater storage monitoring and Landsat data for land cover and LST mapping have been used. The GRACE-based Groundwater Storage (GWS) anomaly has been correlated with Tropical Rainfall Measuring Mission (TRMM)-based precipitation data. The GWS is further cross validated with the groundwater monitoring stations in the study area and the correlation of 0.7 is found. The time series analysis of GWS and the land cover maps with a decadal interval from 1990 to 2020 has been developed to find the impact of groundwater change due to urbanization. The results demonstrate a rapid increase in groundwater depletion and urbanization rates over the past decade. The LST spatial pattern is increasing similarly with the study area’s urban expansion, indicating the temperature rise due to urbanization. The study highlights the limitation of effective policies to regulate groundwater extraction in urban areas and the importance of proper planning to ensure the long-term sustainability of freshwater resources.
1. Introduction
With rising demand for freshwater due to population growth and urbanization, the pressure on global groundwater resources has increased tremendously [1]. The primary source of water supply in the urbanized area is mostly groundwater using home pumping or tube wells. The excessive dependency on and extraction of groundwater (more than recharge) frequently result in the depletion of groundwater storage within the area [2,3,4]. Nearly 50% of all the global drinking water, 40% of water utilized in irrigation and almost one-third of the water required by the industry is utilized from groundwater resources globally [5]. Groundwater is an essential part of the ecosystem that prevents seawater intrusion and maintains base flow in most rivers, which is an integral part of the global hydrological cycle [6]. While being a critical component of the hydrologic system, it is still the most neglected area where the lack of a rigorous global modeling framework as well as regional monitoring and management systems is concerning [7,8].
The Gravity Recovery and Climate Experiment (GRACE) satellites have provided a fresh perspective on the methods to accurately monitor the groundwater sources of the world [9,10]. GRACE observes the changes in gravity fields resulting from variations in the mass over the surface of the earth, which can be used to formulate the Total Water Storage (TWS). TWS is a combination of soil moisture (SM), groundwater storage change (GWSC) and gravity-altering mass components including surface water storage, ice and snow [11,12,13]. GWSC can further be isolated from the TWS by estimating the individual components, such as SM and surface water storage, with the help of Global Land Data Assimilation System (GLDAS) Land Surface Models [11,14]. With the help of the GRACE satellites, it is easy to monitor the groundwater resources of large areas with much fewer efforts, which would be difficult and expensive to monitor on-site. However, it is difficult to utilize the limited data directly for management decisions in most cases, as the central issue of GRACE lies with its coarse resolution [15]. The resolution can be improved by incorporating various energy and mass balance approaches along with localized measurements with the GRACE data to estimate the change in total water storage, which can be used as a representation of the change in groundwater mass [15,16].
The changes in the groundwater mass can further be linked to the considerable changes in land use and land cover (LULC) globally, especially in the vicinity of metropolitan cities. These changes in LULC can be directly linked to the combined effect of natural and anthropogenic activities, which considerably affect the ecosystem of those catchments [17,18]. These activities involve a high rise of urbanization, which increases the concentration of the paved areas, thus reducing the infiltration capacity of the catchment. This has a detrimental effect on the groundwater resources as it seriously diminishes the recharge capacity of the catchment [19]. Thus, it is crucial to include the impacts of LULC on the groundwater sources while analyzing the changes in groundwater storage of any watershed. LST can be used to gauge the urban climate effectively, i.e., the percentage of impervious area is higher in an urban region and, therefore, the surface temperature is higher than in a vegetated area [20,21]. This is because different surfaces have different heat capacities; thus, when they receive similar solar radiation, they exhibit different surface temperatures [21,22]. These changes need to be investigated via the latest techniques available, including Geographic Information Systems (GIS) and remote sensing [18].
With the increasing load on the global groundwater sources as a result of the high freshwater demand due to growing urbanization, there is tremendous pressure on groundwater resources in countries such as Pakistan [23]. With the limitations of surface water storage and being affected by climate conditions, groundwater provides a buffer to fulfill the rising freshwater demand of Pakistan. More than 60% of the water consumed for irrigation and nearly 90% of drinking water is extracted from the groundwater [24,25]. Over 1 million tube wells have been installed and are extracting groundwater from the Punjab province, i.e., the Upper Indus Plain, which has resulted in severe depletion of the groundwater resource [26].
Traditionally, ground-based measurements such as observations recorded from the monitoring wells are the primary source of information used to monitor groundwater systems. However, this data does not apply to large-scale areas due to the limited availability of networks in many areas globally. Moreover, the lack of adequate monitoring of wells in such areas only adds to the problem [9,27,28]. This, in turn puts a question mark on the credibility and availability of the data required by the groundwater managers, thus pushing the research community to pursue new methods to fulfill their requirements [24]. GIS and remote sensing techniques have started to prove themselves to fill this gap.
This study mainly focused on the impact of land cover change on groundwater changes and the temporal change of land cover and further evaluated the impact of groundwater depletion in time series analysis. GRACE-based time series analyses were performed to evaluate its variation with urban expansion. The GRACE-based GWS results are validated with the groundwater monitoring station data. Furthermore, Land surface temperature (LST) maps have been developed to find the urbanization impact on the surface temperature; additionally, it helps to correlate the groundwater impact. Studying the change in LST can indicate the changes in the LULC as a result of urbanization which plays a crucial role in the deterioration of the groundwater storage of a catchment.
2. Materials and Methods
2.1. Study Area
Lahore is an industrial hub and the capital of Punjab Province, Pakistan. According to [29], the total pollution in Lahore was 6.3 million in 1998 which increased to 11.2 million with an annual growth of 3% according to the most recent census of 2017. The study area is located on the left bank of the Ravi River, with a total area of 1842 km2. The geographic extent of Lahore is 31°13′–31°43′ N latitude and 74°0′–74°39.5′ E longitude. In terms of population, Lahore is the megacity of Punjab Province with more than 98% of people living urban areas. Lahore is known for its historical culture, high academia, and the place of interaction with the neighboring country of India. Lahore has an old cultural heritage before the separation of Indo-Pak which attracts most of the area’s international tourism. The location map of the study area is shown in Figure 1.
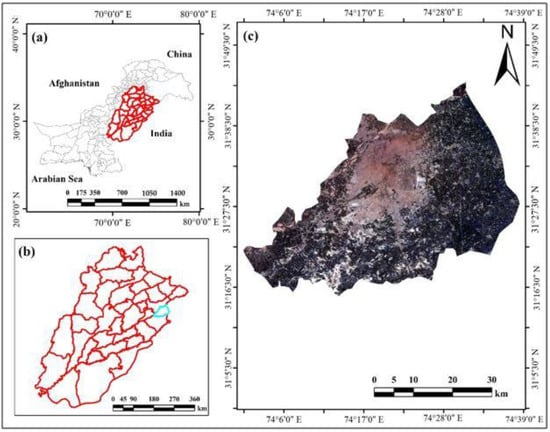
Figure 1.
Location map of the study area: (a) Map of Pakistan; (b) Districts based map of Punjab province; (c) Specific study area map of Lahore.
After the Indus water treaty, the surface water supply to Punjab was severely affected. Lahore, lying on the river bank of Ravi, was among the key cities to be affected. The surface water inflow to Lahore was reduced because of decreasing inflows from the Ravi river. Thus, to satisfy the high demand for water in the second largest city of the country, the majority of the load was transferred to the groundwater resources of the city [30,31]. In 2014, it was estimated that the groundwater usage in the city was around 2.61 km3 while the recharge was only 2.53 km3. Nearly 53% of the groundwater extracted was being used for domestic purposes, while the remaining 47% was being used for agricultural, industrial and commercial purposes [31]. The issue lies with the high rate of pumping and constant rate of urbanization, reducing the permeable areas required for groundwater recharge, thus reducing the overall recharge rate of the aquifer.
Lahore city is distributed into nine administration townships managed by the local scale administration, i.e., Town Municipal Administration (TMA) and also the army cantonment area [32]. The winter season is from November to March, and the coldest months are December and January with the temperature from 0 °C to 3 °C. Mostly in May and June, with the highest temperature of 48 °C, the mean daytime temperature is in the range from 40 °C to 45 °C. During the monsoon season, Lahore receives high rainfall of approximately 600 mm in July and August [31].
2.2. Datasets
2.2.1. GRACE Data
The GRACE and the GRACE-Follow On (GRACE-FO) missions were aimed at studying the global climate and gravity of the earth. Previous studies used both observations, compared them with the ground in-situ data and found that the Mascon (MSC) approaches correlate more with groundwater monitoring [33]. In this study, we have used monthly global MSC data from the Centre for Space Research (CSR) data processing center. The Mascon solution has a spatial resolution of 3 arc-degree across the earth’s surface. This study has used the data of 0.5 degrees with the coastline resolution improvement (CRI) filter. The data has been extracted for the study area from global products to find the terrestrial water storage (TWS) from 2003 to 2021.
2.2.2. GLDAS Data
The Global Land Data Assimilation System (GLDAS) refers to terrestrial modeling that integrates satellite data products and ground-based observations. These estimate fluxes and land surface states using advanced Land Surface Models (LSMs) and different data assimilation procedures [34]. GLDAS uses four kinds of LSMs, namely Mosaic [35], Noah [36], Variable Infiltration Capacity (VIC) [37] and Community Land Model (CLM) [38]. This study uses the Noah LSM-derived data with a spatial resolution of 0.25° × 0.25°. Canopy water storage (CWS), soil moisture (SM) and snow water equivalent (SWE) were extracted from Noah LSM with a temporal span from January 2003 to December 2021.
2.2.3. TRMM Data
The tropical rainfall measuring mission (TRMM) is a joint satellite mission of Japan Aerospace Exploration (JAXA) and the National Aeronautics and Space Administration (NASA) to find the precipitation for climatic research. It can be used in the metrological analysis. The product is available at the global scale ranges from 50° N to 50° S. The monthly data of the level 3 product with a spatial resolution of 0.25° × 0.25° were used for this study.
2.2.4. Landsat Data
For landcover mapping, the interval of a decade has been taken. The analysis includes images from 1990, 2000, 2010 and 2020 for landcover mapping and later used for LST mapping from thermal infrared bands. The data are downloaded from [39] from Landsat 5 and Landsat 8 data with TM, EMT+ and OLI/TIRS having a spatial resolution of 30 m. The images used for processing the study area have a path/row of 149/038. The study area is covered in a single image of the given path and row.
2.3. Methodology
2.3.1. GRACE Processing
The monthly GRACE Mascon solutions give us total water storage (TWS) with an average value of 300 × 300 km. JPL, GFZ and CSR regularly update GRACE product. Those organizations are applying multiple filters to reduce signal noise and resample it to different sizes. The data are resized into different pixel resolutions, i.e., 1° and 0.5° degrees. Up until now, the highest resolution that the organizations share is 0.5 degrees. In this study, the TWS data have been used from CSR from 2003 to 2021. The GRACE-based data are a global product, so the study area data were extracted from a global product. The GLDAS data are available at 0.25 degrees, so to make the dimension consistent, the GRACE data were further resized to 0.25 from 0.5 degrees using Inverse distance weight (IDW). Equation (1) shows the combination of groundwater and other variables in total terrestrial water storage (TWS) [3,40]. Figure 2 showing the methodology flowchart of the study.
△TWS = (△GW) + (△SWE) + (△SM) + (△CWS)
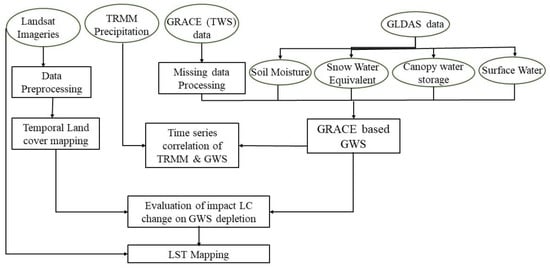
Figure 2.
Methodology Flow chart for the research study.
2.3.2. Times Series Analysis of GRACE-Based GWS
The output from the GRACE does not have the differentiations of vertical storage of water quantity at different depths from different input variables such as SM, snow, surface water and vegetation-covered water (canopy storage). Land surface models can detect those differences from the accumulative TWS anomalies. These models are based on generated maps by quantifications of water storage in different variables. The expected TWS variations in the time series trend will have major input from the GW, SWE, SM and SW. The GLDAS model input will help to separate those vertical layers of water storage to find the groundwater storage in the area. GLDAS uses land surface models to find the different variable stored water quantity. The GLDAS data are converted to centimeters to make them consistent with GRACE data. Furthermore, the spatial resolution has also been considered consistent, i.e., 0.25 × 0.25 degrees. Equation (2) is used to extract groundwater anomalies from the total TWS and the other input variables [3,40].
△GW = (△TWS) − ((△SWE) + (△SM) + (△CWS))
2.3.3. Land Cover Mapping
Different researchers use multiple classifiers for land cover classifications [41,42]. The images were preprocessed before further analysis. The radiometric and atmospheric corrections were performed for all images based on their metadata. The statistically supervised classification approach of maximum likelihood classification works based on the normal distribution of class signatures based on the probability threshold. The maximum likelihood classifier works on multivariate probability density functions of classes for every pixel [43]. Pixel is assigned to the specific class with maximum likelihood spectral reflectance to the defined training class. The training sample selection is essential because every training class will follow the Gaussian distribution [44]. The study area is divided into four main classes: settlement, vegetation, barren land and water. Training samples were collected for these defined classes from the Landsat-8 optical imagery with the support of information available on Google Earth. Sixteen training sample sets were collected for every land cover class with region grow tools, such as the total number of training samples for Landsat-8 data. Based on the overall training samples, 70% data was used to train the model, and 30% was used to test the model results. The overall accuracy has been evaluated based on the testing data.
2.3.4. Land Surface Temperature
The collective temperature of intact objects on the earth’s surface is known as Land surface temperature. Worldwide, researchers have used multiple measurements on the thermal infrared band to calculate LST. The LST values were taken from TM, TM+ and OLI according to the thermal infrared band (bands 6 and 10) with a cumulative spatial resolution of 30 m, respectively. Initially, every pixel’s digital number (DN) value was converted to spectral radiance using Equation (3) [45,46,47].
R = ((LMAX − LMIN)/255) × DN + LMIN
Here, R is the spectral radiance (w·sr−1·m−3), LMAX is 15.600 (spectral radiance of highest DN 225), and the LMIN is 1.238 (Spectral radiance of DN having a corresponding value of 1). The DN is the digital value of that specific pixel.
After the conversion to radiance, the next step is conversion to temperature using Equation (4) [46,47,48].
LST = K2/(ln((K1/R) + 1))
K1 and K2 in Equation (4) have the values of 607.76 and 1260.56 for TM and ETM+, and the corresponding OLI values are 772.88 and 1321.07, respectively. Finally, LST was converted to Celsius (°C) from Kelvin.
LST (°C) = T (K) − 273.15
3. Results and Discussion
3.1. Groundwater Anomaly Monitoring
The groundwater storage anomalies have been extracted from GRACE based on TWS and other parameters from GLDAS land surface models. Results from Figure 3 indicate that the study area of Lahore has continuously depleted groundwater resources. Due to high groundwater usage for agriculture and expanded urbanization, groundwater depletion is very high in the city. The GRACE-based study has taken the time duration from 2003 to 2021 for 18 years of time series analysis. Figure 3a shows the TWS variations in the study area, and it can be seen that most of the study area faces continuous decreasing trends. The results show that the lowest GWS values are observed in the pre-monsoon season in most of the years while the groundwater storage has significantly increased in post-monsoon months. The seasonal effect in GWS is mainly due to the input from climatic variables, i.e., evapotranspiration and precipitation, specifically in areas with shallow groundwater tables [49]. Agricultural return flow and seepage from surface water and canals are the two factors affecting the groundwater inflow [50]. The average decreasing trend in the area for those 18 years of time series is −1.2 cm annually. Figure 3b shows the GWS anomalies, which are almost following the trend of the TWS. According to the results, the input from (Surface Water, Canopy Water storage and Soil Moisture) is very low toward total TWS concerning Equation (2). The GWS shows different ups and downs as the data are averaged monthly, so the overall discharge and recharge in the groundwater is highlighted in the trend.
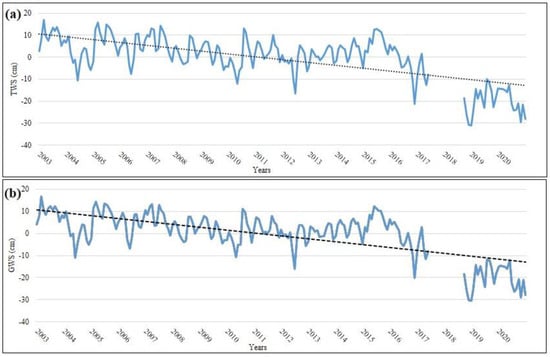
Figure 3.
(a) Depicts time series variations of total water storage (TWS), and; (b) groundwater storage (GWS).
For GWS, the variables containing surface water bodies have been extracted from overall TWS, i.e., the values of three variables including CWS, SM and CWS are extracted from GLDAS global grid dataset, and the global grid study area data extracted. The mean monthly values were calculated by taking the average of the overall covered area within the pixel and further converted to centimeters to make the unit consistent with GRACE-based TWS.
Figure 4 shows the mean monthly times series of the input variables, i.e., SM, CWS and SW, in Lahore city for the past 18 years. The variables results show that the area has a high number of SM within those three variables, ranging from −1.5 to +2. Okay Ahi and Jin [51] concluded that SM is the most effective variable in producing GRACE signals. The magnitude of SM has decreased in recent years due to urban expansion in the area, which resulted in a decrease in the infiltration rate, which further led to a decrease in soil moisture as well [52]. Multiple studies have been conducted on the urban expansion of Lahore city, which converted from either barren land or vegetation [52]. Therefore, the CWS shown in Figure 4b ranges from −0.004 to +0.08 in the entire time duration of 18 years. The CWS show high peaks in the starting period, which decreased in the last years depicting a decrease in vegetation cover in the study area. Furthermore, the surface water in the study area is scarce. The river Ravi flows in the Lahore area, which shows the surface water in the signals and has some peaks in 2013 and 2014, highlighting the high rainfall within the area.
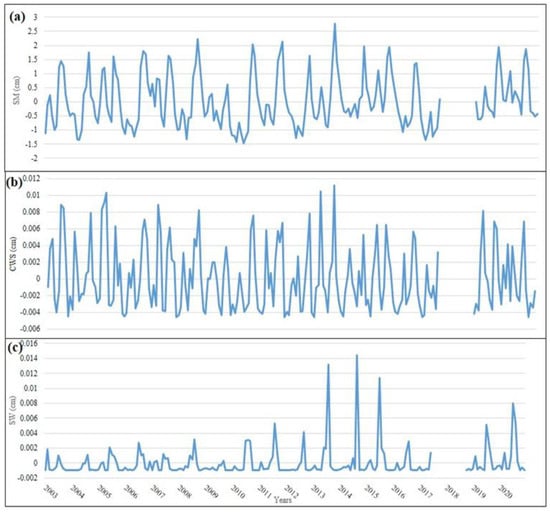
Figure 4.
The temporal variations of: (a) Soil Moisture (SM); (b) Canopy water Storage (CWS); (c) Surface Water (SW).
The groundwater storage and discharge show their relationship with monthly precipitation (Figure 5). The monthly input from precipitation towards GWS in the form of recharge makes the GWS rise with a slight shift due to the infiltration process. The area received some input GWS from the high precipitation in some years, highlighted in the GRACE signal, which further converted to GWS anomalies. The precipitation has high peaks in the 2013 and 2014 monsoon seasons, giving input to GWS and raising the groundwater within the area. For the accuracy of the GRACE-based GWS, the results are correlated with the groundwater water monitoring wells data. The monitoring data are very limited as the monitoring stations are taking data seasonally. The correlation shown in in Figure 6 is in average of 0.7 which is correlating with other studies.
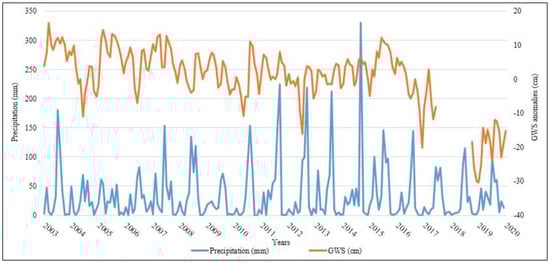
Figure 5.
GWS and Precipitation time series variations.
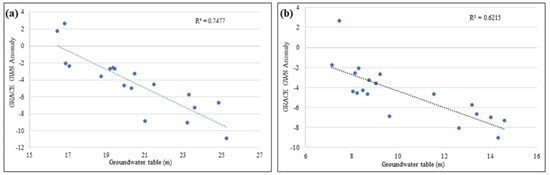
Figure 6.
(a,b) shows correlation of groundwater monitoring stations data with GRACE based GWS at two different locations.
3.2. Urban Expansion Dynamics and Land Cover Mapping
The developmental history and land use planning have been reported in several studies for Lahore city in previous decades [53]. However, this study highlighted the effect of urbanization on the natural recourse of groundwater and the current temperature rises in the last decades. The urban extension is difficult to determine by a range of spatial and temporal constituents [54]. The significant input towards urban expansion in Lahore city is migration, natural increase and merging neighboring villages in the urban area. Unplanned urbanization is causing unpredictable long-term changes in the city landscape. Exploring the existing ecological status of an area’s land cover spatial and temporal change detection is the most effective method for monitoring land variations [55]. The present study examined the urban expansion from 1990 to 2020 to find the spatial and temporal growth pattern and further evaluate the impact of urbanization on LST.
The spatial and temporal land-use dynamics from 1990 to 2020 were derived from multi-spectral Landsat satellite imageries. A rapid increase in the population of cities and urban expansion is the leading factor of high groundwater extraction due to population growth. The urban expansion from 1990 to 2020 is shown in Figure 7 which shows the overall urbanized area within the city over time. The results revealed that the expansion of the urban area has highly affected the agricultural area of Lahore, as the agriculture area is shifted to a built-up area, which directly affects the temperature rise as well. With the rapid population growth, the housing scheme and other commercial areas have increased the pressure to transform the agricultural area into a built-up area. The spatial distribution of land use for the three most significant classes includes Barren land, Agricultural area and Built-up area.
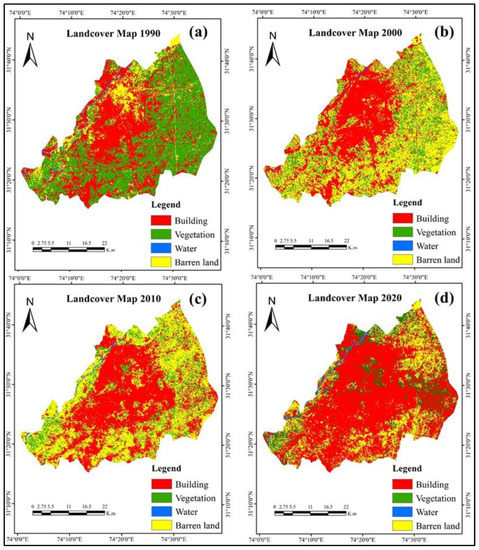
Figure 7.
Land cover maps for decadal interval: (a) Land cover Map of 1990; (b) Land cover Map of 2000; (c) Land cover Map of 2010; (d) Land cover Map of 2020.
The study revealed that the urban area is expended very rapidly in the last decade, which directly affects the groundwater, as shown in the groundwater storage anomalies in Figure 3. Urban expansion and other infrastructure such as industry put high pressure on groundwater. Urbanization decreases the infiltration rate but increases high extraction, which ultimately affects the groundwater resource in the long term.
The area-wise distribution of covered areas shows that urban expansion significantly impacts vegetation and also converts many areas into barren land in the form of housing societies. Figure 8 shows the decadal conversion from land type in form of square kilometers. The rapid increase in the building area can be seen in the Figure 8. The urban growth of Lahore does not follow the classical models of the spatial structure of urbanization—for example, the concentric zone model by Parks et al. [56] and multiple-nuclei by Harris et al. [57]. The statistics show that Lahore City is not populated at the same rate as its urban expansion in the area due to rural-to-urban migration being the leading cause of urban population growth [53,58,59]. The overall impact of this land cover change has made spatial and temporal rises in temperature. For considering the impact of temperature rise, the Land surface temperature analysis has been performed for those time intervals.
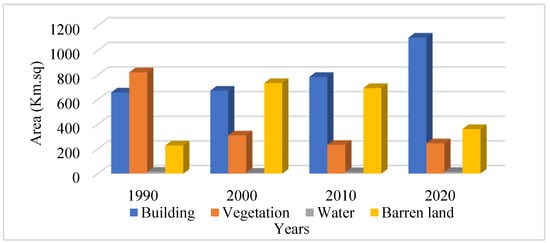
Figure 8.
Temporal change of urban/built-up area, vegetation and Barren land.
3.3. Evaluation of LST Mapping
The Spatio-temporal LST maps are shown in Figure 9 with the decade interval for the overall period from 1990 to 2020. The spatial pattern of the LST has a high correlation with urbanization shown in Figure 7. The temperature rise is clearly shown in different maps within the time interval, mainly due to urbanization. In the years 1990, 2000, 2010 and 2020, values of temperature range were 15–41 °C, 17–44 °C, 21–45 °C and 23–47 °C, respectively. In this study, the city of Lahore had a minimum temperature of 15 °C in 1990 and a maximum temperature was 47 °C in 2020. In Figure 9a, the area has low surface temperature due to the high vegetation covered in the study area. However, with the urban expansion in the area, the LST is also increased within the city. In Figure 9d, most of the area is urbanized, and the area has a very high surface temperature in the city with a minimum vegetation-covered area. The densely populated commercial, industrial and buildup areas have higher surface temperatures due to impermeable surfaces. These concreted surfaces absorb and store heat during the daytime while releasing it at night, contributing to LST increase in urban areas [59].
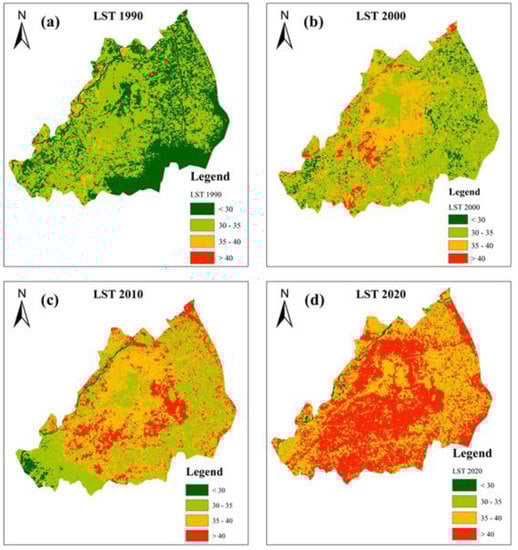
Figure 9.
Land surface temperature maps for the study area: (a) LST map of 1990; (b) LST map of 2000; (c) LST map of 2010; (d) LST map of 2020.
The analysis shows that the spread in the city’s center increased the temperature in 2010, and most of the urban expansion is in the last decade, as shown by different studies [52]. The low temperature has been noted in water bodies and the area having high vegetation [33].
4. Conclusions
The study used multiple remote sensing data to find the groundwater storage reduction and its link with the urban expansion in Lahore. Lahore city is expanding with random distribution, and its urbanization is consuming a lot of natural resources in which the primary consumption is groundwater. In Lahore, the GRACE data has been used for the temporal groundwater depletion analysis. The result shows high depletion in the area, directly related to urbanization. Land cover mapping has been performed for the last four decades to find the change in land cover and the urbanization area. The urban area increased from 659 km2 to 1104 km2 at this time. The overall increase in urbanization raised the temperature of the area as well. LST spatial-temporal mapping has been performed for the study area concerning the land cover mapping period. The GRACE-based GWS results are further correlated with the groundwater monitoring stations in the study area with a correlation of 0.7. The increase in temperature shows the impact of urbanization as well as groundwater consumption. The input for rising temperature may be because of decreasing vegetation.
Author Contributions
Conceptualization, M.Z.A. and H.U.K.Y.; Methodology M.Z.A., K.Z.J. and H.Z.; Software, Writing—original draft preparation, and formal analysis; M.Z.A. and H.Z.; writing—review and editing, K.U.R., M.Z.A. and H.Z.; funding acquisition and project administration, K.Z.J., K.U.R. and N.A.S. All authors have read and agreed to the published version of the manuscript.
Funding
This research was funded by the National Center of GIS and Space Applications (Grant Number: RF-82-RS&GIS-46) and National Natural Science Foundation of China (Grant Number: 52250410336).
Institutional Review Board Statement
Not applicable.
Informed Consent Statement
Not applicable.
Data Availability Statement
Data can be made available upon request.
Acknowledgments
This work was supported by the Department of Civil Engineering, International Islamic University, Islamabad and SCARP Monitoring Organization of Water and Power Development Authority (WAPDA), Pakistan.
Conflicts of Interest
The authors declare no conflict of interest.
References
- Kalhor, K.; Emaminejad, N. Sustainable development in cities: Studying the relationship between groundwater level and urbanization using remote sensing data. Groundw. Sustain. Dev. 2019, 9, 100243. [Google Scholar] [CrossRef]
- Mohammed, T.A.; Huat, B.B. Groundwater Engineering and Geotechnique; Universiti Putra Malaysia Press: Selangor, Malaysia, 2004. [Google Scholar]
- Rodell, M.; Velicogna, I.; Famiglietti, J.S. Satellite-based estimates of groundwater depletion in India. Nature 2009, 460, 999–1002. [Google Scholar] [CrossRef] [PubMed]
- Guo, Y.; Gan, F.; Yan, B.; Bai, J.; Wang, F.; Jiang, R.; Xing, N.; Liu, Q. Evaluation of Groundwater Storage Depletion Using GRACE/GRACE Follow-On Data with Land Surface Models and Its Driving Factors in Haihe River Basin, China. Sustainability 2022, 14, 1108. [Google Scholar] [CrossRef]
- Hamdy, A.; Ragab, R.; Scarascia-Mugnozza, E. Coping with water scarcity: Water saving and increasing water productivity. Irrig. Drain. J. Int. Comm. Irrig. Drain. 2003, 52, 3–20. [Google Scholar] [CrossRef]
- Jager, H.I.; Smith, B.T. Sustainable reservoir operation: Can we generate hydropower and preserve ecosystem values? River Res. Appl. 2008, 24, 340–352. [Google Scholar] [CrossRef]
- Ali, S.; Liu, D.; Fu, Q.; Cheema, M.J.M.; Pham, Q.B.; Rahaman, M.M.; Dang, T.D.; Anh, D.T. Improving the resolution of grace data for spatio-temporal groundwater storage assessment. Remote Sens. 2021, 13, 3513. [Google Scholar] [CrossRef]
- Condon, L.E.; Kollet, S.; Bierkens, M.F.P.; Fogg, G.E.; Maxwell, R.M.; Hill, M.C.; Fransen, H.J.H.; Verhoef, A.; Van Loon, A.F.; Sulis, M.; et al. Global Groundwater Modeling and Monitoring: Opportunities and Challenges. Water Resour. Res. 2021, 57, e2020WR029500. [Google Scholar] [CrossRef]
- Zhang, G.; Zheng, W.; Yin, W.; Lei, W. Improving the resolution and accuracy of groundwater level anomalies using the machine learning-based fusion model in the North China plain. Sensors 2021, 21, 46. [Google Scholar] [CrossRef]
- Tapley, B.D.; Bettadpur, S.; Watkins, M.; Reigber, C. The gravity recovery and climate experiment: Mission overview and early results. Geophys. Res. Lett. 2004, 31, L09607. [Google Scholar] [CrossRef]
- Tapley, B.D.; Bettadpur, S.; Ries, J.C.; Thompson, P.F.; Watkins, M.M. GRACE measurements of mass variability in the Earth system. Science 2004, 305, 503–505. [Google Scholar] [CrossRef]
- Rodell, M.; Chen, J.; Kato, H.; Famiglietti, J.S.; Nigro, J.; Wilson, C.R. Estimating groundwater storage changes in the Mississippi River basin (USA) using GRACE. Hydrogeol. J. 2007, 15, 159–166. [Google Scholar] [CrossRef]
- Moore, S.; Fisher, J.B. Challenges and opportunities in GRACE-based groundwater storage assessment and management: An example from Yemen. Water Resour. Manag. 2012, 26, 1425–1453. [Google Scholar] [CrossRef]
- Syed, T.H.; Famiglietti, J.S.; Rodell, M.; Chen, J.; Wilson, C.R. Analysis of terrestrial water storage changes from GRACE and GLDAS. Water Resour. Res. 2008, 44, W02433. [Google Scholar] [CrossRef]
- Lall, U.; Josset, L.; Russo, T. A snapshot of the world’s groundwater challenges. Annu. Rev. Environ. Resour. 2020, 45, 171–194. [Google Scholar] [CrossRef]
- Chen, J.; Famigliett, J.S.; Scanlon, B.R.; Rodell, M. Groundwater Storage Changes: Present Status from GRACE Observations. Surv. Geophys. 2015, 55, 207–227. [Google Scholar]
- Chu, H.J.; Liu, C.Y.; Wang, C.K. Identifying the relationships between water quality and land cover changes in the tseng-wen reservoir watershed of Taiwan. Int. J. Environ. Res. Public Health 2013, 10, 478–489. [Google Scholar] [CrossRef]
- Liaqat, M.U.; Mohamed, M.M.; Chowdhury, R.; Elmahdy, S.I.; Khan, Q.; Ansari, R. Impact of land use/land cover changes on groundwater resources in Al Ain region of the United Arab Emirates using remote sensing and GIS techniques. Groundw. Sustain. Dev. 2021, 14, 100587. [Google Scholar] [CrossRef]
- Nath, B.; Ni-Meister, W.; Choudhury, R. Impact of urbanization on land use and land cover change in Guwahati city, India and its implication on declining groundwater level. Groundw. Sustain. Dev. 2021, 12, 100500. [Google Scholar] [CrossRef]
- Rehman, A.; Qin, J.; Pervez, A.; Khan, M.S.; Ullah, S.; Ahmad, K.; Rehman, N.U. Land-Use/Land Cover Changes Contribute to Land Surface Temperature: A Case Study of the Upper Indus Basin of Pakistan. Sustainability 2022, 14, 934. [Google Scholar] [CrossRef]
- Fonseka, H.P.U.; Zhang, H.; Sun, Y.; Su, H.; Lin, H.; Lin, Y. Urbanization and its impacts on land surface temperature in Colombo Metropolitan Area, Sri Lanka, from 1988 to 2016. Remote Sens. 2019, 11, 957. [Google Scholar] [CrossRef]
- Benenson, W.; Harris, J.; Stocker, H.; Lutz, H. Handbook of Physics; Springer: New York, NY, USA, 2002. [Google Scholar]
- Ashraf, S.; Ali, M.; Shrestha, S.; Hafeez, M.A.; Moiz, A.; Sheikh, Z.A. Impacts of climate and land-use change on groundwater recharge in the semi-arid lower Ravi River basin, Pakistan. Groundw. Sustain. Dev. 2022, 17, 100743. [Google Scholar] [CrossRef]
- Akhter, G.; Ge, Y.; Iqbal, N.; Shang, Y.; Hasan, M. Appraisal of remote sensing technology for groundwater resource management perspective in indus basin. Sustainability 2021, 13, 9686. [Google Scholar] [CrossRef]
- Cheema, M.; Immerzeel, W.; Bastiaanssen, W. Spatial Quantification of Groundwater Abstraction in the Irrigated Indus Basin. Groundwater 2013, 52, 25–36. [Google Scholar] [CrossRef]
- Rahman, K.U.; Hussain, A.; Ejaz, N.; Shahid, M.; Duan, Z.; Mohammadi, B.; Hoai, P.N.; Pham, Q.B.; Khedher, K.M.; Anh, D.T. Evaluating the impact of the environment on depleting groundwater resources: A case study from a semi-arid and arid climatic region. Hydrol. Sci. J. 2022, 67, 791–805. [Google Scholar] [CrossRef]
- Feng, W.; Shum, C.K.; Zhong, M.; Pan, Y. Groundwater storage changes in China from satellite gravity: An overview. Remote Sens. 2018, 10, 674. [Google Scholar] [CrossRef]
- Zhang, M.; Teng, Y.; Jiang, Y.; Yin, W.; Wang, X.; Zhang, D.; Liao, J. Evaluation of terrestrial water storage changes over china based on GRACE solutions and water balance method. Sustainability 2022, 14, 11658. [Google Scholar] [CrossRef]
- Pakistan Bureau of Statistics. 6th Population & Housing Census. Available online: https://www.pbs.gov.pk/content/final-results-census-2017 (accessed on 15 December 2022).
- Ashiq, M.M.; Rehman, H.U.; Khan, N.M. Impact of large diameter recharge wells for reducing groundwater depletion rates in an urban area of Lahore, Pakistan. Environ. Earth Sci. 2020, 79, 1–14. [Google Scholar] [CrossRef]
- Qureshi, A.; Sayed, A.H. Situation Analysis of the Water Resources of Lahore Establishing a Case for Water Stewardship; WWF-Pakistan and Cleaner Production Institute (CPI): Lahore, Pakistan, 2014; pp. 1–45. [Google Scholar]
- Pakistan Bureau of Statistics. Available online: https://www.pbs.gov.pk/census-2017-district-wise/results/053 (accessed on 15 December 2022).
- Hussain, D.; Kao, H.; Khan, A.A.; Lan, W.; Imani, M.; Lee, C.; Kuo, C. Spatial and Temporal Variations of Terrestrial Water Storage in Upper Indus Basin Using GRACE and Altimetry Data. IEEE Access 2020, 8, 65327–65339. [Google Scholar] [CrossRef]
- Rodell, M.; Houser, P.R.; Jambor, U.; Gottschalck, J.; Mitchell, K.; Meng, C.J.; Arsenault, K.; Cosgrove, B.; Radakovich, J.; Bosilovich, M.; et al. The global land data assimilation system. Bull. Am. Meteorol. Soc. 2004, 85, 381–394. [Google Scholar] [CrossRef]
- Koster, R.D.; Suarez, M.J. Energy and Water Balance Calculations in the Mosaic LSM; National Aeronautics and Space Administration, Goddard Space Flight Center: Greenbelt, MD, USA, 1996. [Google Scholar]
- Ek, M.B.; Mitchell, K.E.; Lin, Y.; Rogers, E.; Grunmann, P.; Koren, V.; Gayno, G.; Tarpley, J.D. Implementation of Noah land surface model advances in the National Centers for Environmental Prediction operational mesoscale Eta model. J. Geophys. Res. -Atmos. 2003, 108, 8851. [Google Scholar] [CrossRef]
- Liang, X.; Lettenmaier, D.P.; Wood, E.F.; Burges, S.J. A Simple Hydrologically Based Model of Land-Surface Water and Energy Fluxes for General-Circulation Models. J. Geophys. Res.-Atmos. 1994, 99, 14415–14428. [Google Scholar] [CrossRef]
- Dai, Y.; Zeng, X.; Dickinson, R.E.; Baker, I.; Bonan, G.B.; Bosilovich, M.G.; Denning, A.S.; Dirmeyer, P.A.; Houser, P.R.; Niu, G.; et al. The Common Land Model. J. Bull. Am. Meteorol. Soc. 2003, 84, 1013–1024. [Google Scholar] [CrossRef]
- USGS EarthExplorer. Available online: https://earthexplorer.usgs.gov (accessed on 15 July 2022).
- Iqbal, N.; Hossain, F.; Lee, H.; Akhter, G. Satellite gravimetric estimation of groundwater storage variations over Indus Basin in Pakistan. IEEE J. Sel. Top. Appl. Earth Obs. Remote Sens. 2016, 9, 3524–3534. [Google Scholar] [CrossRef]
- Ustuner, M.; Sanli, F.B.; Dixon, B. Application of support vector machines for landuse classification using high-resolution rapideye images: A sensitivity analysis. Eur. J. Remote Sens. 2015, 48, 403–422. [Google Scholar] [CrossRef]
- Carranza-García, M.; García-Gutiérrez, J.; Riquelme, J.C.J. A framework for evaluating land use and land cover classification using convolutional neural networks. Remote Sens. 2019, 11, 274. [Google Scholar] [CrossRef]
- Lillesand, T.; Kiefer, R.W.; Chipman, J. Remote Sensing and Image Interpretation, 5th ed.; John Wiley & Sons: Hobokan, NJ, USA, 2004. [Google Scholar]
- Mishra, V.N.; Prasad, R.; Kumar, P.; Gupta, D.K.; Srivastava, P.K. Dual-polarimetric C-band SAR data for land use/land cover classification by incorporating textural information. Environ. Earth Sci. 2017, 76, 1–16. [Google Scholar] [CrossRef]
- Chen, X.-L.; Zhao, H.-M.; Li, P.-X.; Yin, Z.-Y. Remote sensing image-based analysis of the relationship between urban heat island and land use/cover changes. Remote Sens. Environ. 2006, 104, 133–146. [Google Scholar] [CrossRef]
- Pan, J. Area delineation and spatial-temporal dynamics of urban heat island in Lanzhou City, China using remote sensing imagery. J. Indian Soc. Remote Sens. 2016, 44, 111–127. [Google Scholar] [CrossRef]
- Sultana, S.; Satyanarayana, A. Urban heat island intensity during winter over metropolitan cities of India using remote-sensing techniques: Impact of urbanization. Int. J. Remote Sens. 2018, 39, 6692–6730. [Google Scholar] [CrossRef]
- Weng, Q.; Lu, D.; Schubring, J. Estimation of land surface temperature–vegetation abundance relationship for urban heat island studies. Remote Sens. Environ. 2004, 89, 467–483. [Google Scholar] [CrossRef]
- Eltahir, E.A.B.; Yeh, P.J.-F. On the asymmetric response of aquifer water level to floods and droughts in Illinois. Water Resour. Res. 1999, 35, 1199–1217. [Google Scholar] [CrossRef]
- Mukherjee, A.; Fryar, A.E.; Howell, P.D. Regional hydrostratigraphy and groundwater flow modeling in the arsenic-affected areas of the western Bengal basin, West Bengal, India. Hydrogeol. J. 2007, 15, 1397–1418. [Google Scholar] [CrossRef]
- Okay Ahi, G.; Jin, S. Hydrologic Mass Changes and Their Implications in Mediterranean-Climate Turkey from GRACE Measurements. Remote Sens. 2019, 11, 120. [Google Scholar] [CrossRef]
- Nasar-u-Minallah, M.; Zia, S.; Rahman, A.-U.; Riaz, O.J.G. Environment, Sustainability, Spatio-Temporal Analysis of Urban Expansion and Future Growth Patterns of Lahore, Pakistan. Geogr. Environ. Sustain. 2021, 14, 41–53. [Google Scholar] [CrossRef]
- Rana, I.A.; Bhatti, S.S. Lahore, Pakistan—Urbanization challenges and opportunities. Cities 2018, 72, 348–355. [Google Scholar] [CrossRef]
- Deng, J.S.; Wang, K.; Hong, Y.; Qi, J.G. Spatio-temporal dynamics and evolution of land use change and landscape pattern in response to rapid urbanization. Landsc. Urban Plan. 2009, 92, 187–198. [Google Scholar] [CrossRef]
- Yuan, F.; Sawaya, K.E.; Loeffelholz, B.C.; Bauer, M.E. Land cover classification and change analysis of the Twin Cities (Minnesota) Metropolitan Area by multitemporal Landsat remote sensing. Remote Sens. Environ. 2005, 98, 317–328. [Google Scholar] [CrossRef]
- Parks, R.; Burgess, E.W.; McKenzie, R.D.J.C. The City; University of Chicago Press: Chicago, IL, USA, 1925. [Google Scholar]
- Harris, C.D.; Ullman, E.L. The nature of cities. Ann. Am. Acad. Political Soc. Sci. 1945, 242, 7–17. [Google Scholar] [CrossRef]
- Shirazi, S.A.; Kazmi, S.J.H.J.S.A.S. Analysis of population growth and urban development in Lahore-Pakistan using geospatial techniques: Suggesting some future options. South Asian Stud. 2020, 29, 269–280. [Google Scholar]
- Nasar-u-Minallah, M. Exploring the Relationship between Land Surface Temperature and Land Use Change in Lahore Using Landsat Data: Relationship between Land Surface and Land Use Data. Pak. J. Sci. Ind. Res. Ser. A Phys. Sci. 2020, 63, 188–200. [Google Scholar] [CrossRef]
Disclaimer/Publisher’s Note: The statements, opinions and data contained in all publications are solely those of the individual author(s) and contributor(s) and not of MDPI and/or the editor(s). MDPI and/or the editor(s) disclaim responsibility for any injury to people or property resulting from any ideas, methods, instructions or products referred to in the content. |
© 2023 by the authors. Licensee MDPI, Basel, Switzerland. This article is an open access article distributed under the terms and conditions of the Creative Commons Attribution (CC BY) license (https://creativecommons.org/licenses/by/4.0/).