Article

Investigating the Relationship between the Manning Coefficients (n) of a Perforated Subsurface Stormwater Drainage Pipe and the Hydraulic Parameters

by
Junaidah Abdullah
1,
Mohd Remy Rozainy Mohd Arif Zainol
1,2,*,
Ali Riahi
1,*,
Nor Azazi Zakaria
1,
Mohd Fazly Yusof
1,
Syafiq Shaharuddin
1,
Muhammad Nurfasya Alias
1,
Muhammad Zaki Mohd Kasim
1,
Mohd Sharizal Abdul Aziz
3,
Norazian Mohamed Noor
4,
Mohd Hafiz Zawawi
5 and
Jazaul Ikhsan
6
1
River Engineering and Urban Drainage Research Centre (REDAC), Universiti Sains Malaysia, Nibong Tebal 14300, Malaysia
2
School of Civil Engineering, Universiti Sains Malaysia, Nibong Tebal 14300, Malaysia
3
School of Mechanical Engineering, Universiti Sains Malaysia, Nibong Tebal 14300, Malaysia
4
Faculty of Civil Engineering Technology, Universiti Malaysia Perlis, Arau 01000, Malaysia
5
Department of Civil Engineering, Universiti Tenaga Nasional, Kajang 43000, Malaysia
6
Department of Civil Engineering, Universitas Muhammadiyah Yogyakarta, Yogyakarta 55183, Indonesia
*
Authors to whom correspondence should be addressed.
Sustainability 2023, 15(8), 6929; https://doi.org/10.3390/su15086929
Submission received: 16 March 2023 / Revised: 18 April 2023 / Accepted: 19 April 2023 / Published: 20 April 2023

Abstract

:
Subsurface perforated pipes drain infiltrated stormwater runoff while attenuating the peak flow. The Manning roughness coefficient (n) was identified as a fundamental parameter for estimating roughness in various subsurface channels. Hence, in this work, the performance of a six-row non-staggered sand-slot perforated pipe as a sample of the subsurface drainage is investigated experimentally in a laboratory flume at Universiti Sains Malaysia (USM) aimed at determining the Manning roughness coefficients (n) of the pipe and assessing the relationship between the Manning’s n and the hydraulic parameters of the simulated runoff flow under the conditions of the tailgate channel being opened fully (GFO) and partially (GPO), as well as the pipe having longitudinal slopes of 1:750 and 1:1000. Water is pumped into the flume at a maximum discharge rate of 35 L/s, and the velocity and depth of the flow are measured at nine points along the inner parts of the pipe. Based on the calculated Reynolds numbers ranging from 38,252 to 64,801 for both GFO and GPO conditions, it is determined that most of the flow in the perforated pipe is turbulent, and the calculated flow discharges and velocities from the outlets under GFO are higher than the flow and velocity rates under GPO with similar pipe slopes of 1:750 and 1:1000. The Manning coefficients are calculated at nine points along the pipe and range from 0.004 to 0.009. Based on the ranges of the calculated Manning’s n, an inverse linear relationships between the Manning coefficients and the flow velocity under GFO and GPO conditions are observed with the R2 of 0.975 and 0.966, as well as 0.819 and 0.992 resulting from predicting the values of flow velocities with the equations v = ((0.01440 − n)/0.009175), v = ((0.01330 − n)/0.00890), v = ((0.02007 − n)/0.01814), and v = ((0.01702 − n)/0.01456) with pipe slopes of 1:750 and 1:1000, respectively. It is concluded that since the roughness coefficient (Manning’s n) of the pipe increases, it is able to reduce the flow velocity in the pipe, resulting in a lower peak of flow and the ability to control the quantity of storm water in the subsurface urban drainages.

1. Introduction

Climate change intensifies as global temperatures increase because of social development, altering regional hydrological cycles and water resource distribution [1,2], resulting in an increase in the number of extreme precipitation events [3,4] and frequent flash-flooding events [5]. Flood events have become the most frequent and severe natural disaster over the past 25 years [6]. Moreover, urbanization increases impervious areas, which reduces infiltration rates, increasing the volume of urban stormwater runoff, peak flow rate, occurrences of flash flooding, and polluting the surrounding environment [7]. The first flush of urban runoff accounts for 80–95% of the total annual loading of most stormwater pollutants caused by rain events [8]. Hence, it is essential to remove the first flush of runoff to avoid the majority of total annual pollutant loadings approaching the water bodies. Therefore, the majority percentage of urban runoff was removed using infiltration trenches with the use of subsurface perforated and porous drainpipes [7,8,9,10,11,12,13,14,15,16,17,18,19] and using the subsurface modular tanks and channels in biological drainage systems [20,21,22,23,24,25] recommended by the River Engineering and Urban Drainage Research Centre (REDAC) in Malaysia for managing both water quantity and quality in urban areas. Groundwater recharge, low stream flow augmentation, water quality enhancement, and a reduction in the total runoff volume are also among the advantages of using the infiltration practices mentioned in the preceding studies [7,8,9,10,11,12,13,14,15,16,17,18,19,20,21,22,23,24,25]. The performances of subsurface perforated and porous drainpipes were often used in infiltration trenches for the removal of the urban stormwater runoff [7,8,9,10,11,12,13,14,15,16,17,18,19] and were also used in agricultural lands as subsurface drainage systems [26,27,28,29,30]. Subsurface perforated pipe drainage systems are used to drain away the subsurface water to minimize surface water ponding and waterlogging of soils by decreasing water tables and increasing soil strength by decreasing the soil moisture content. In addition, the use of subsurface drainage is required to avoid damaging urban structures and infrastructures because of the high level of the water table [31]. The use of perforated pipes reduces subgrade moisture, which is crucial for durable and healthy pavement [14].
In a study conducted by Gaj and Madramootoo [26], it was stated that the corrugated high-density polyethylene (HDPE) perforated pipes were widely used as subsurface drainage systems on agricultural lands. Ghane [27] indicated that the excess water draining from the soil profile of agricultural lands using perforated pipes provides the required aeration for appropriate crop root development. Moreover, the main advantages of subsurface drainage of perforated pipes used in agricultural lands are increased crop yield, improved soil structure and aeration, and decreased volume of surface runoff [28].
In another study stated by Ehsan Ghane [27], knitted-sock pipes and sand-slot perforated pipes (i.e., narrow-slot or knife-cut pipes) are frequently applied in agricultural subsurface drainage in the U.S. and Canada to prevent sediment clogging of the drain pipes. He also stated that the pipe with the longer and narrower slots has a higher drain outflow than the pipe with the shorter and wider slots, even though both pipes have the same perforation rows and patterns and an equal water inlet area per foot. Thus, slot length is the most important pipe property affecting how fast water enters the pipe, and increasing slot width slightly affects the drain outflow [27].
A design of the grass swale perforated pipe (Figure 1) as an urban subsurface drainage system was used as infiltration stormwater runoff drainage by Abida and Sabourin in 2006 [7], which resulted in a reduction in the urban runoff discharge that was 13 times smaller than for a conventional stormwater system, which had the potential to replace open-ditch systems in low-density residential areas. The first flush of urban runoff is captured directly by a perforated pipe system through an open-bottom catch basin or after infiltration in the grass swale, where inflow is delayed by a time lag because of the thickness of the backfill material above the pipe, allowing a portion of the runoff to infiltrate and reduce some pollutants from the first flush of runoff.
The perforated pipe acts as a subdrainage system, draining water that has infiltrated through the soil in the swale and helping in reducing the problem of standing water in swales after rainfall events. As water flows in the perforated pipe system, water is exfiltrated from the pipe to the surrounding trench through the pipe perforations (Figure 1). The proposed system is best suited for urban areas with a relatively low imperviousness (less than 35%), where there is sufficient area to install the roadside swales. It is also necessary to have relatively permeable soils to maximize the infiltration of runoff from the trench into the native soil and reduce the urban runoff volume and probable flash flooding [7].
The hydraulic performances of perforated pipe systems in terms of determining the infiltration and exfiltration rates based on different inflow rates were investigated by [7] conducting laboratory experiments under different design scenarios consisting of two pipes with diameters of 300 and 450 mm and two orifices with diameters of 8 and 13 mm. A 3.66 m long smooth-wall perforated pipe section was placed inside a confining wood box and surrounded by gravel. Eight equally spaced orifices around the perimeter of the pipe with 5 cm spacings between rings of perforations were presented as pipe perforations. Pipe slopes ranging from 0 to 2% were found in storm sewer designs.
The exfiltration rate of the perforated pipe was investigated versus the inflow rate into the pipe, and it evidently showed that under phases of having different pipe slopes of 0 to 2% and several rates of inflows from 2 to 12 L/s, the flow rates out of the pipe perforations increased by reducing the percentages of the pipe slopes and increasing the orifices dimensions [7].
Tu and Traver [12] evaluated the performance of a green infrastructure (GI) infiltration trench. The GI consisted of an underground rock infiltration bed, inlet structures for collecting runoff, and a perforated subsurface drainage pipe. The removal of 94% of the contributing rainfall through infiltration was reported in the study [12].
Murphy et al. [13] performed an experimental study of the stage discharge relationship for three porous pipes buried under loose-laid aggregate. The hydraulic performances of a high-density polythene (HDPE) plastic corrugated staggered perforated pipe with a slot diameter of 10.2 cm and two leached pipes with hole diameters of 10.2 and 15.2 cm, respectively, and with all pipes having a similar length of 3.04 m, were tested during the phase of running full flow at the outlets (GFO). The perforated pipe was cut into small, staggered slots along the whole circumferences of the pipe, with the ratio of slots areas as inlet areas being 2.3% of the entire pipe area, while each leached pipe had three holes punched in the bottom side of the pipe circumference and seized 2.1 and 1.8% of the pipes’ areas with diameters of 10.2 and 15.2 cm, respectively [13].
A series of hydraulic experiments were conducted in which the velocity (√2 gH) of flow in the pipe was measured for the given pipe discharges varying from 1.5 to 18.5 L/s [13]. The values of R2 between discharge rates and flow velocity were reported as 0.93 for the 10.2 cm perforated pipe and 0.83 for both leached pipes under GFO conditions [13].
The Manning’s roughness coefficient (n) was recommended by Ab. Ghani et al. (2007) [32] and Pradhan and Khatua (2018) [33] as a fundamental parameter for estimating roughness in various subsurface modular stormwater drainage channels. As evaluation of the relationship between the calculated Manning’s roughness coefficients (n) of a six-row sand-slot perforated subsurface stormwater drainage pipe and the hydraulic parameters of the simulated runoff flow in the pipe under various scenarios of laboratory flume longitudinal bed slopes and outlets tailgate openings of fully open (GFO) and partially open (GPO) has not been reported in the past; thus, the objectives of this present work are (1) to determine the manning’s roughness coefficients (n) of a six-row sand-slot subsurface perforated pipe under different scenarios of laboratory flume longitudinal bed slopes and outlets tailgate openings and (2) to assess the relationship between the obtained Manning’s n and the depth, velocity, and Froude number of the simulated flow.

2. Materials and Methods

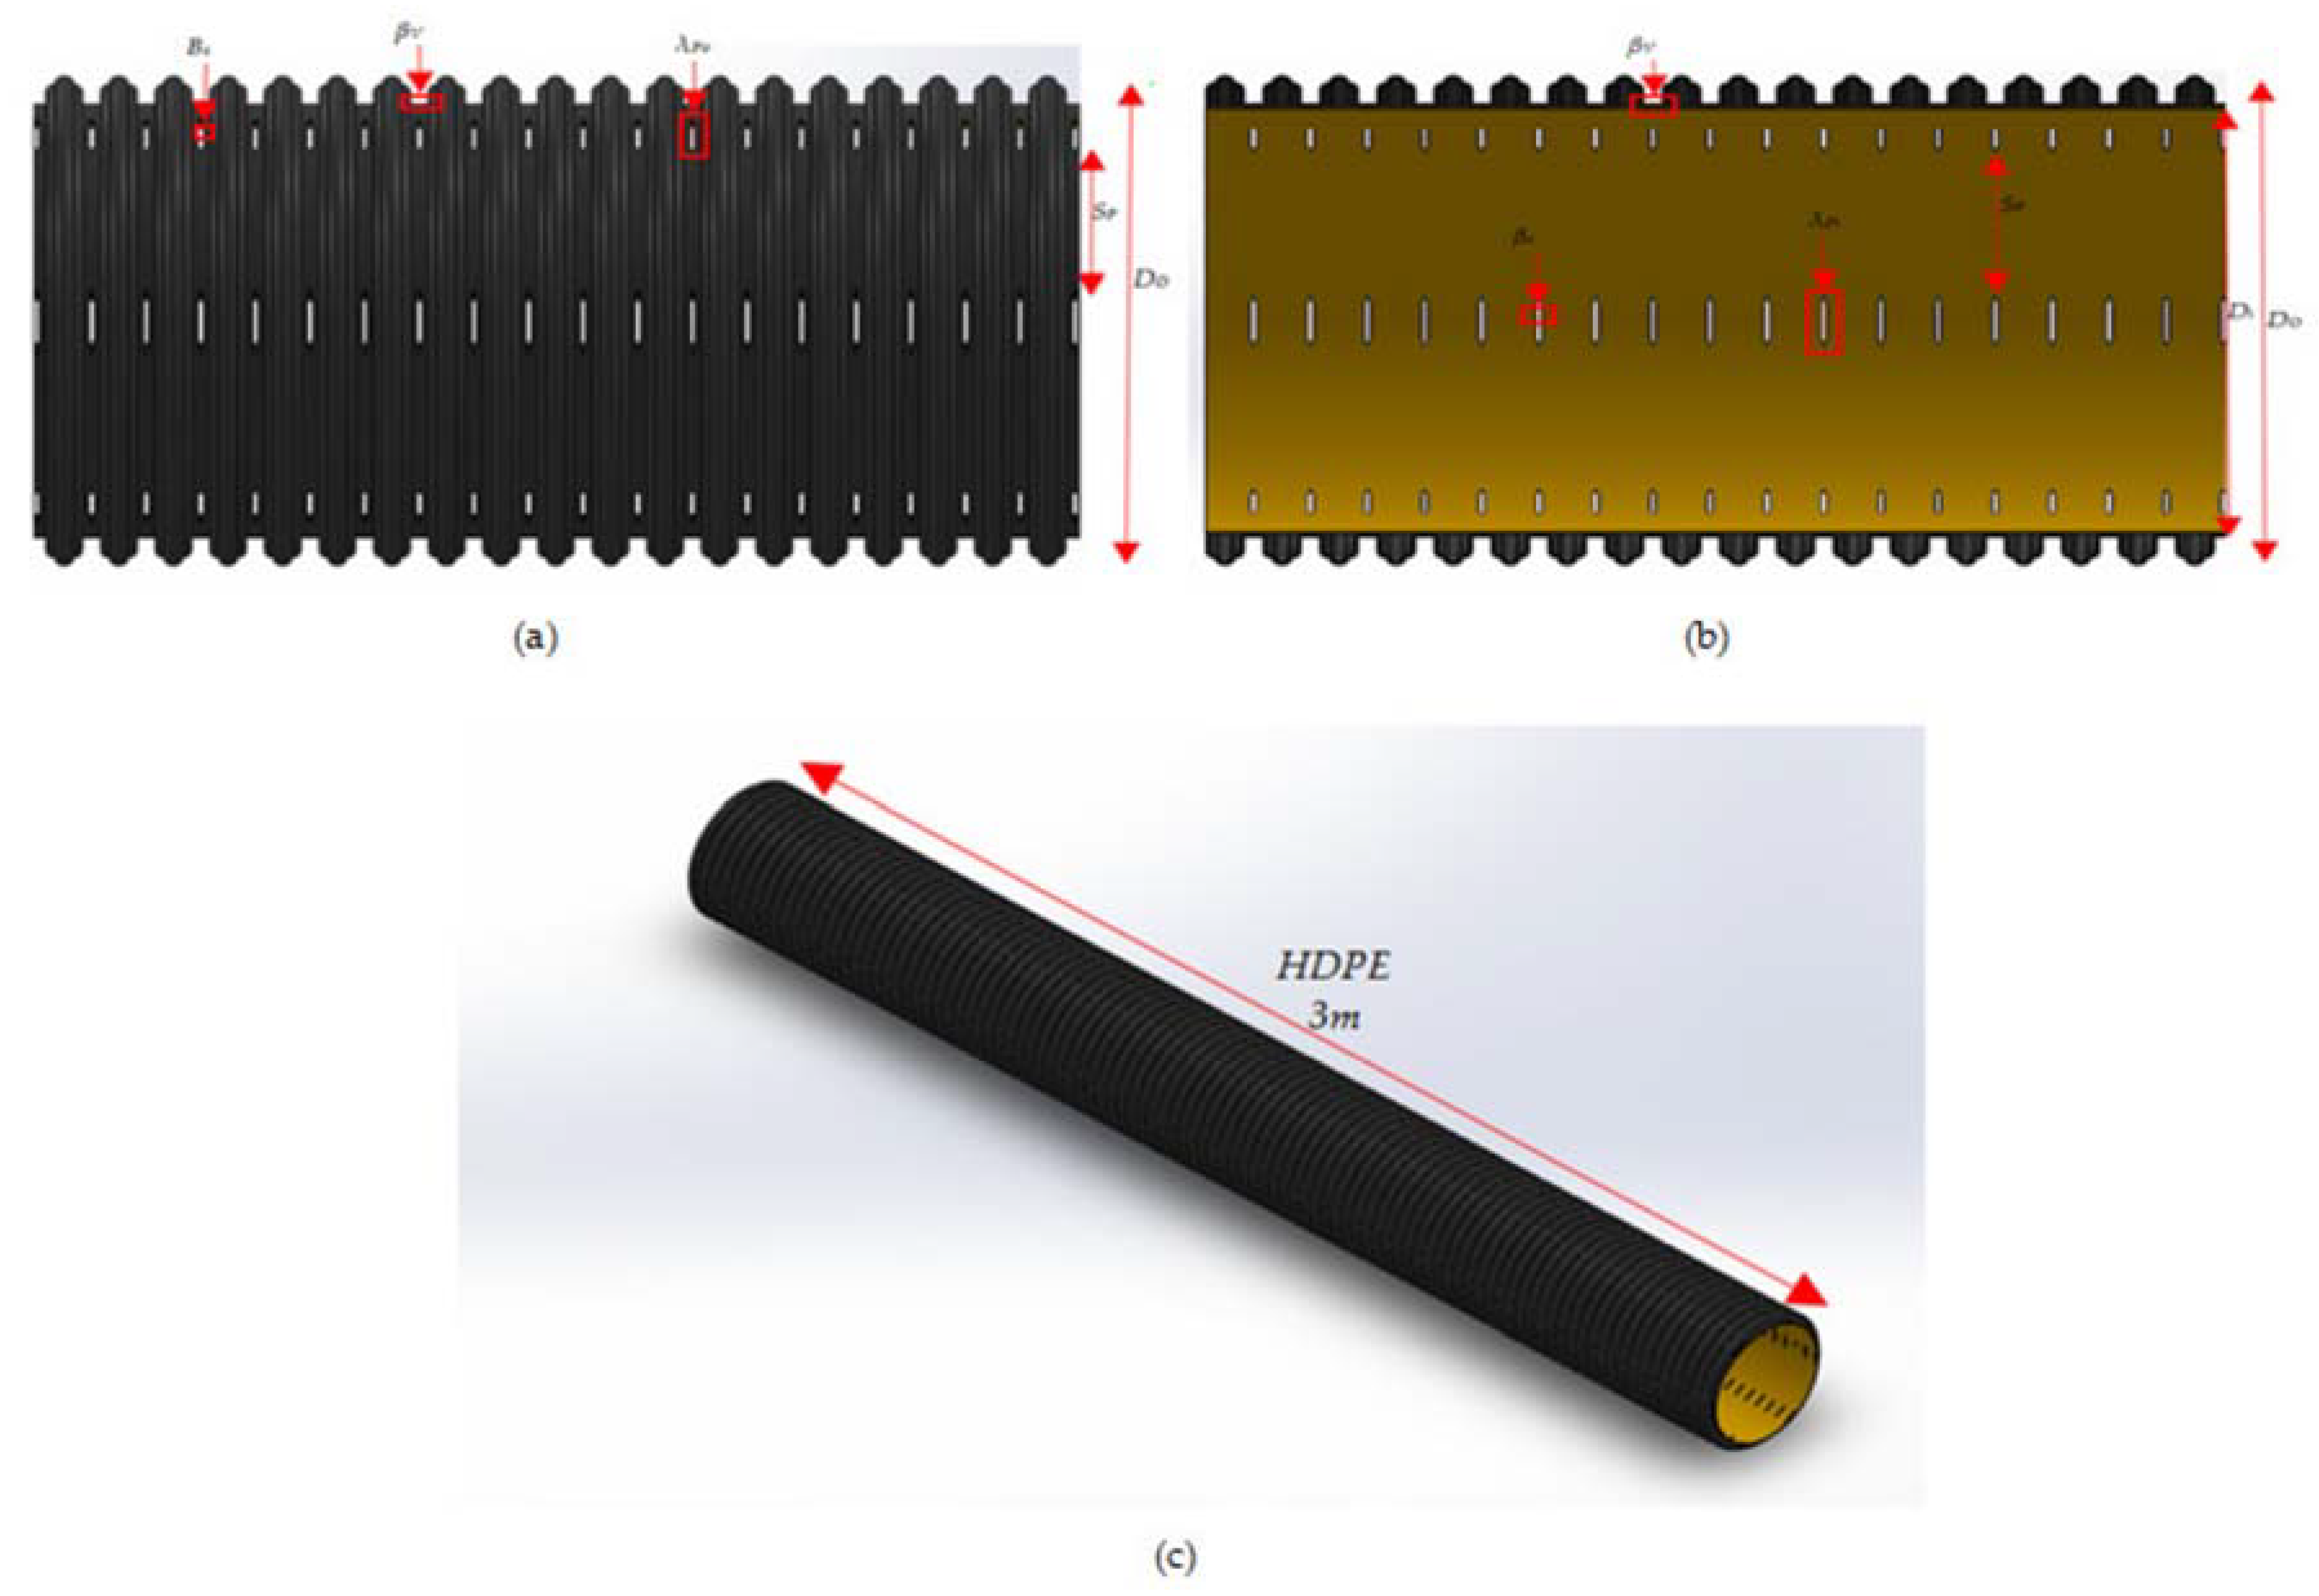
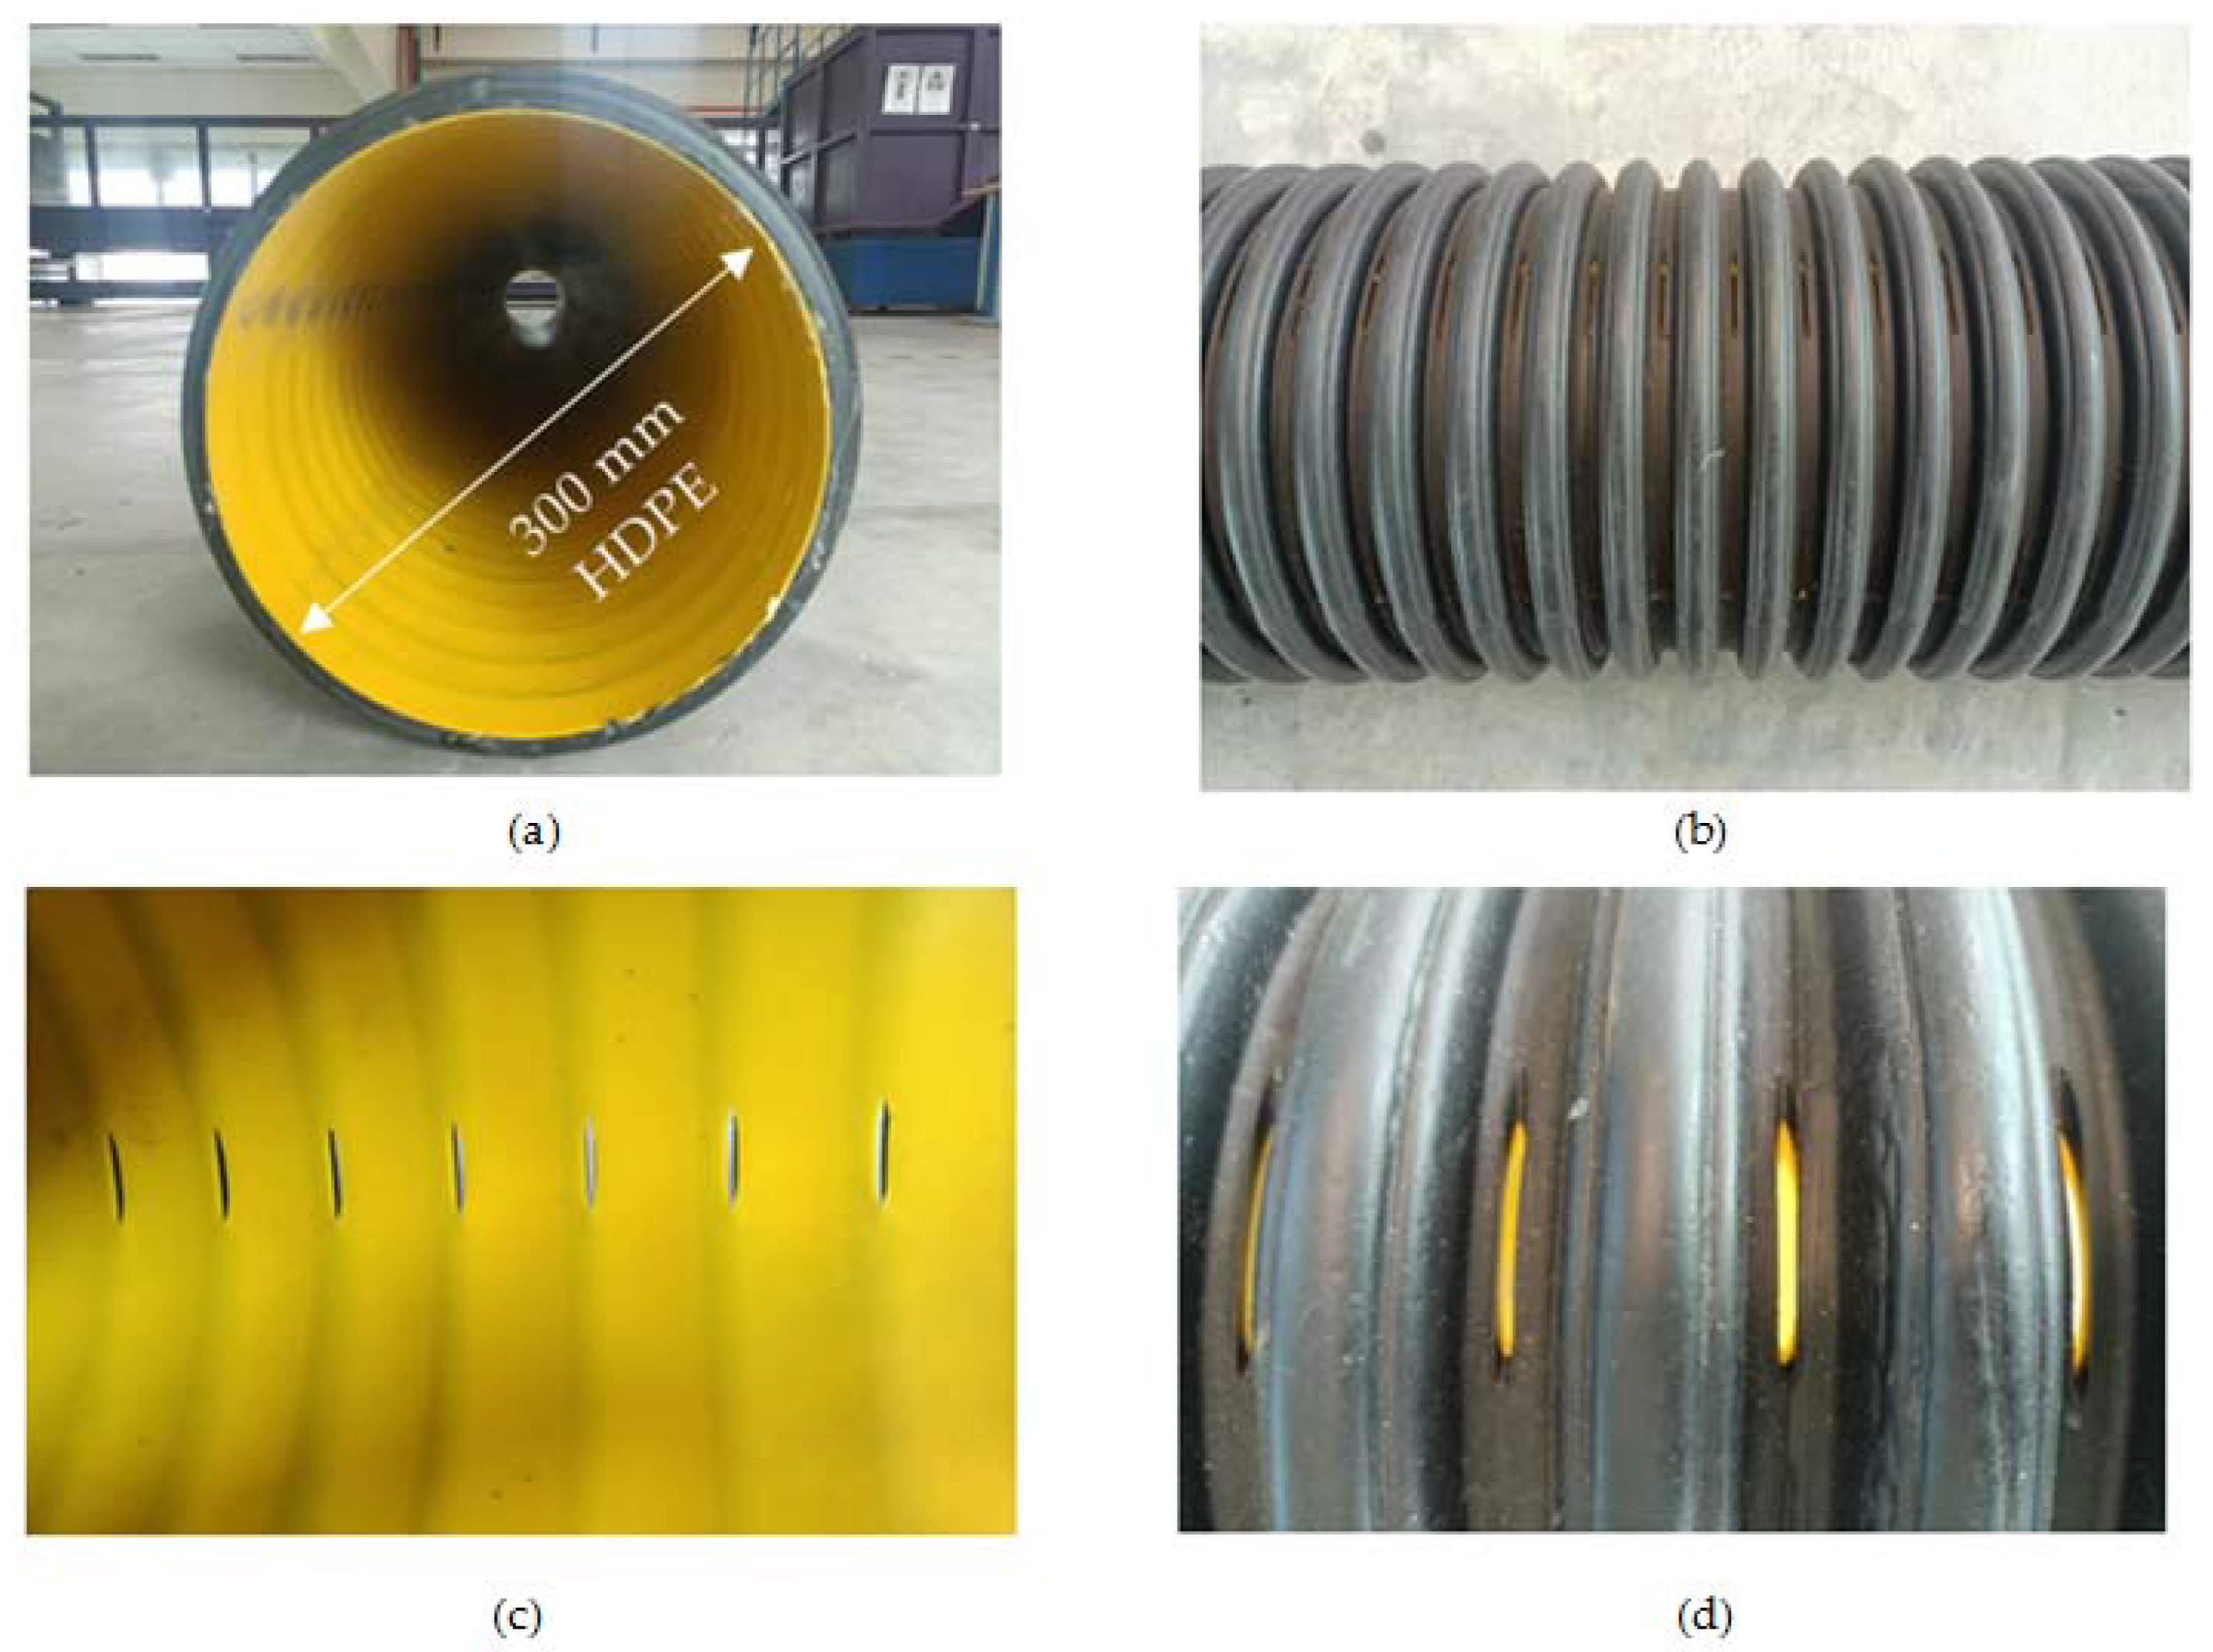
2.1. The Perforation Characteristics of a Six-Row Regular-Perforated Sand-Slot Pipe Sample

For the experimental work, a sample of a six-row regular-perforated sand-slot pipe (Figure 2 and Figure 3) from Timewell Drainage Products (Timewell, IL, USA) was obtained and its hydraulic performance of Manning’s n for subsurface draining of stormwater runoff at the Physical Laboratory, River Engineering and Urban Drainage Research Centre (REDAC), Universiti Sains Malaysia, was evaluated. The values of the pipe’s outer radius (Ro), inner radius (Ri), valley width (βv), perforation width (βs), perforation lengths (λpi), perforation spacing between the slots in a row (Sp), and number of longitudinal rows of perforation (N) are 16.2 cm, 15 cm, 1 cm, 0.3 cm, 3.5 cm, 11 cm, and 6, respectively, as shown in Figure 2. A drainpipe sketch, along with detailed dimensions of the perforation on the pipe, and a photo of the six-row regular-perforated non-staggered sand-slot pipe are presented in Figure 3. As illustrated in Figure 2, a single sample of a six-row regular perforated non-staggered sand-slot pipe wrapped in high-density polyethylene (HDPE) with a length of 3.0 m and an inner diameter of 300 mm was tested experimentally in this work.

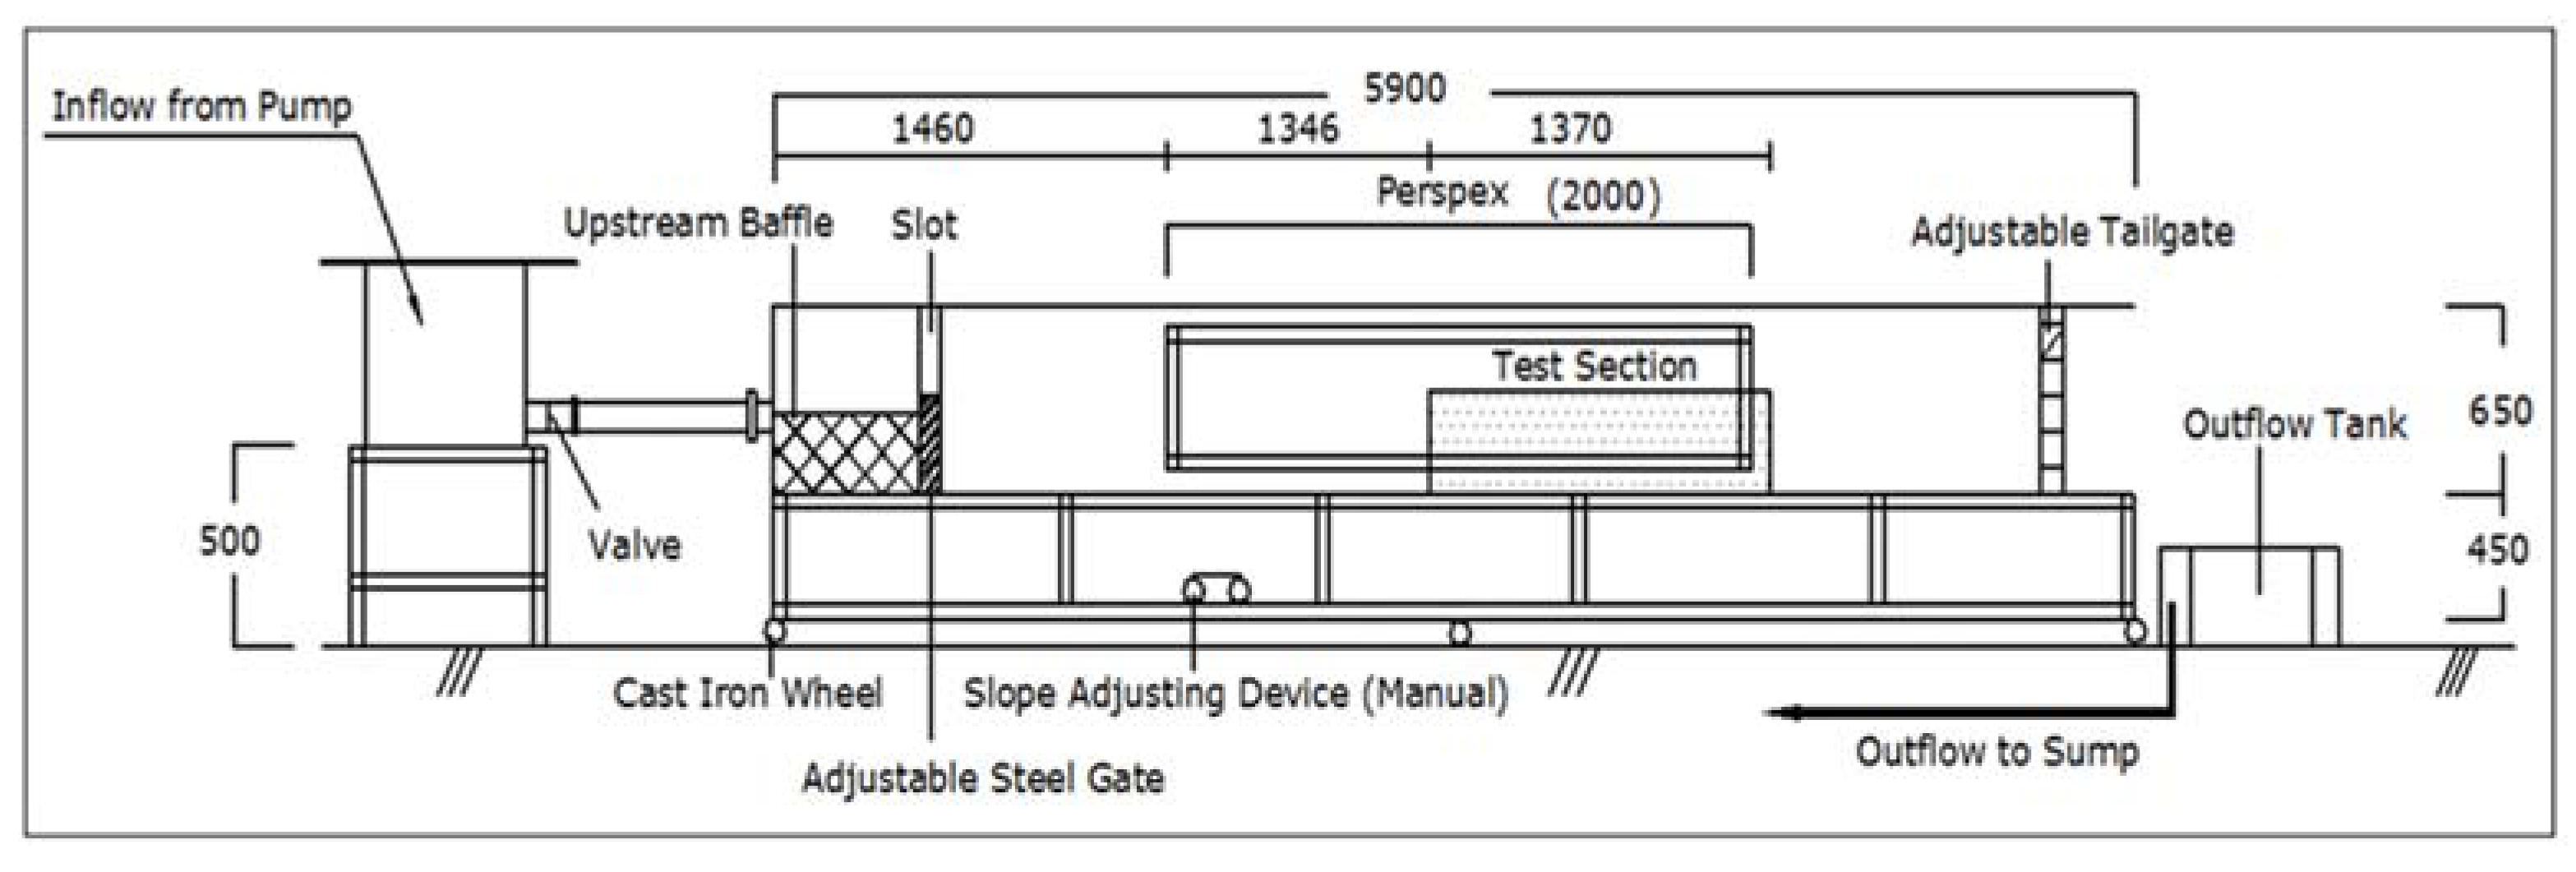
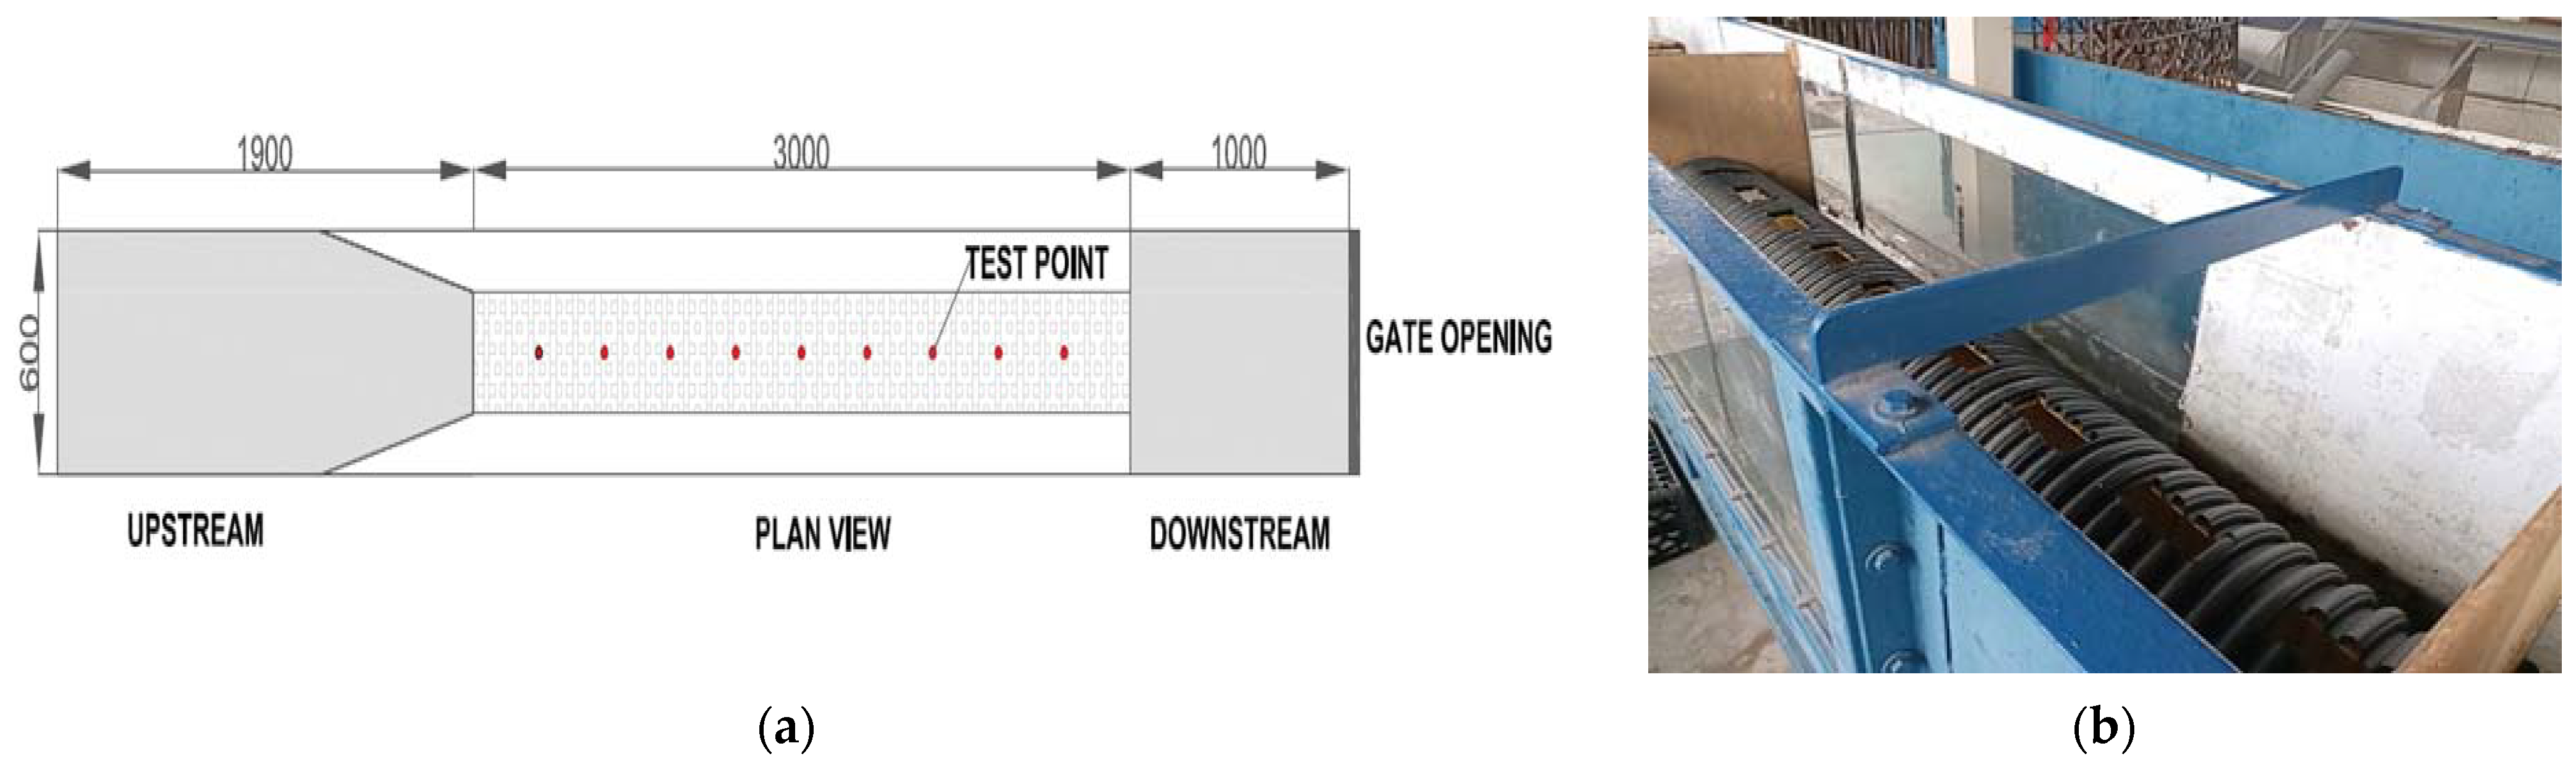
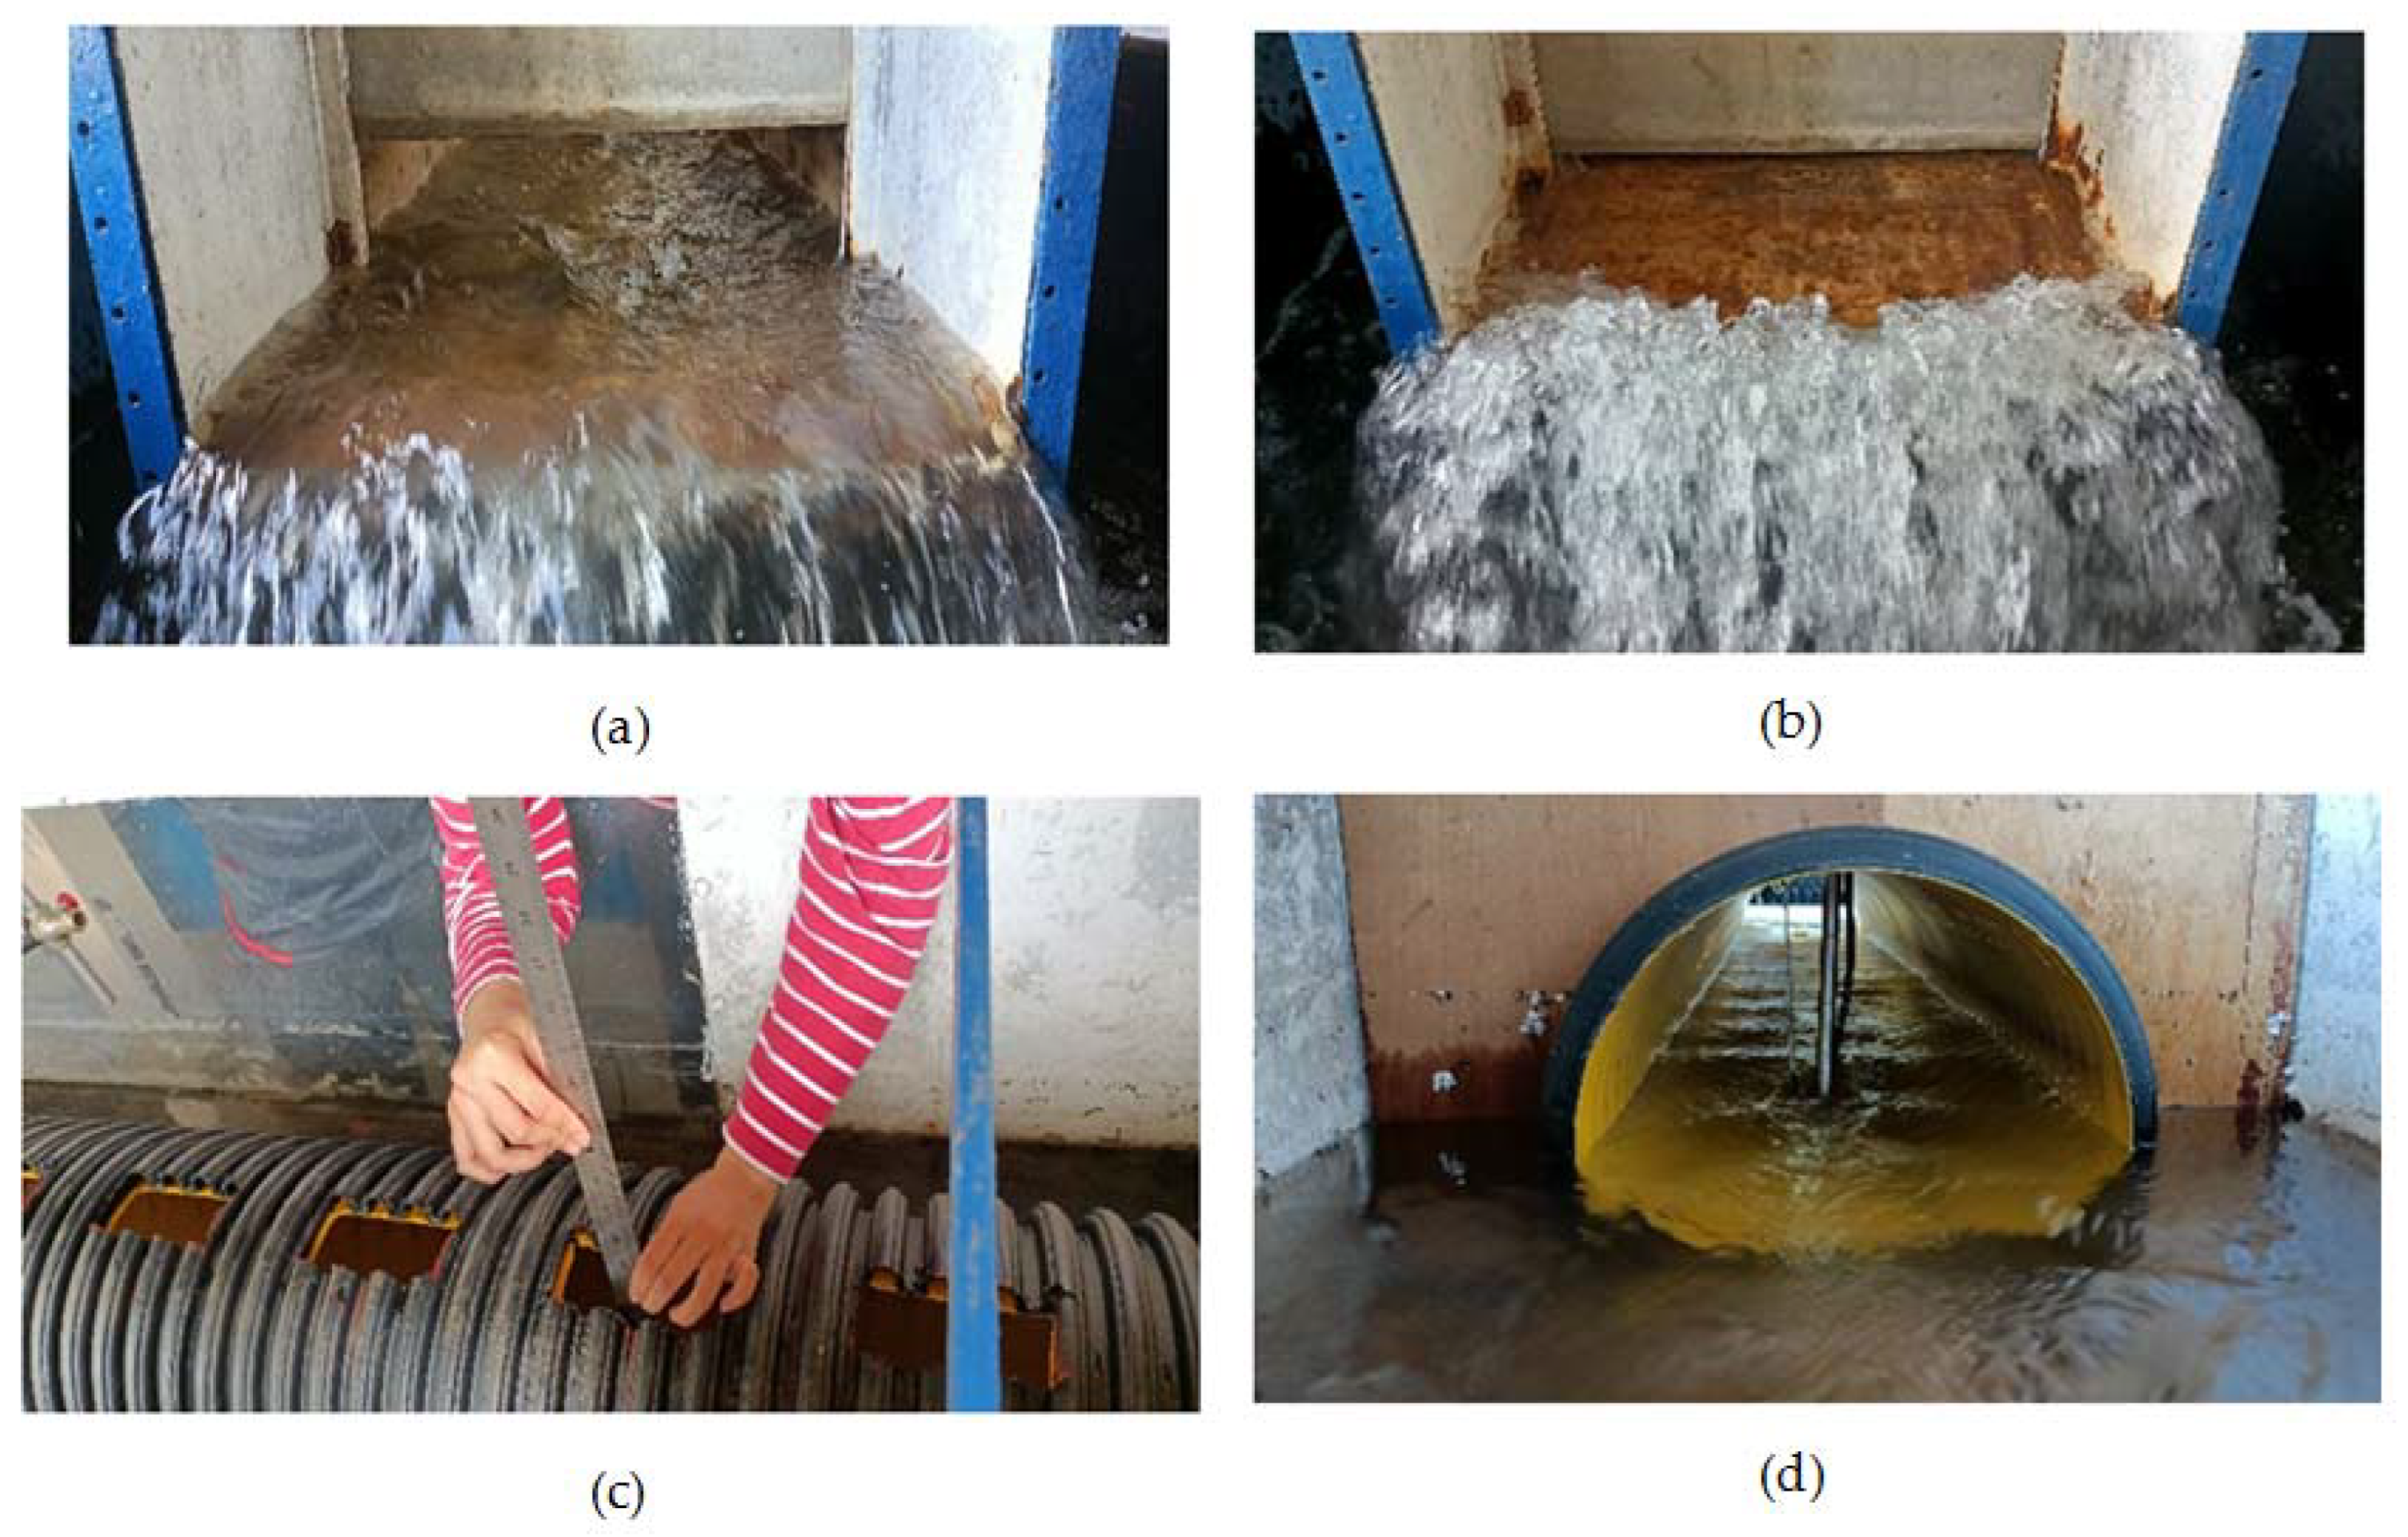
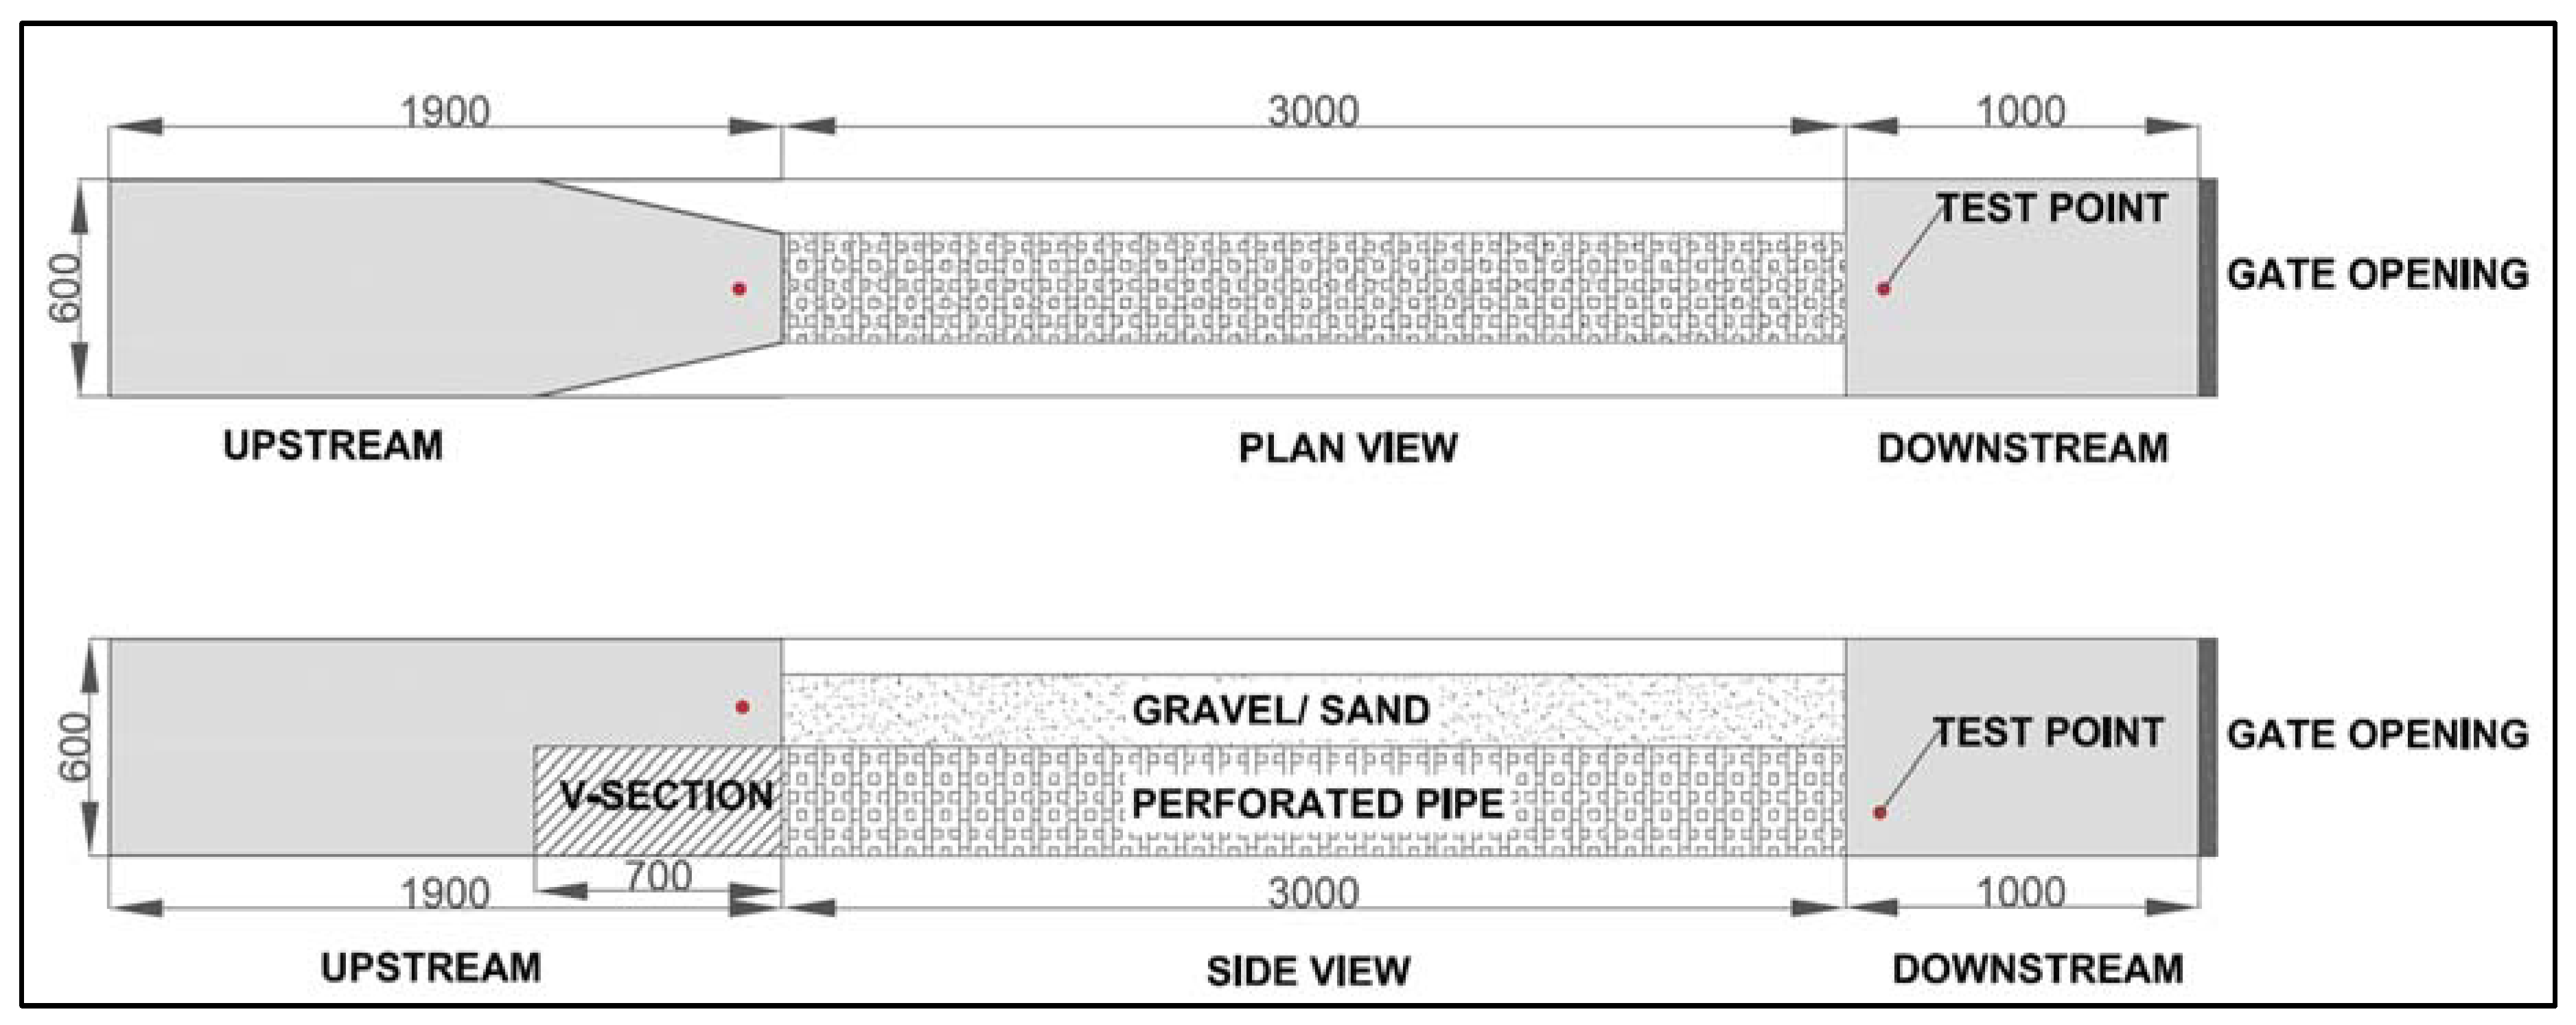
2.2. Experimental Set-Up

The experiment was conducted in a rectangular straight flume with a length of 5.90 m at the Physical Laboratory, River Engineering and Urban Drainage Research Centre (REDAC), Universiti Sains Malaysia. Figure 4 illustrates a sectional sketch of an experimental channel. The slope of the channel can be adjusted using an adjustable jack. Water was supplied at a maximum discharge of 35 L/s into the flume using two electrical water pumps [23]. The water that flowed into the sand-slot perforated pipe placed in the flume was pumped from an underground storage tank that was filled with urban stormwater runoff with its corresponding contaminants collected from a pond behind the Physical Laboratory. Hence, the Manning’s roughness coefficient (n) of the pipe was calculated based on the velocity and flow rate of the above collected stormwater runoff into the perforated pipe. The perforated pipe was cut into nine rectangular segments at the top of the pipe for measuring the depth and velocity of the flow during the experiments, as shown in Figure 5a,b. A total of nine points were measured along the perforated pipe as depicted in Figure 5a.
The experiments were conducted in different phases of fully (GFO) and partially (GPO) open tailgate (Figure 6a,b) with two longitudinal slopes of 1/750 and 1/1000 using a six-row non-staggered sand-slot perforated pipe with a smooth inner liner (Figure 3a). The first phase, namely, the GFO, was selected free-flow without the gate and the second GPO for flow with gate and to consider the effect of backwater. A 10 mm propeller current meter was used to measure the velocity profiles at each segment of the pipe (Figure 6d), and water depth was measured using a ruler (Figure 6c). The measurement of the velocity was taken at 0.6Y (Y = depth of flow) from the water’s surface. The readings of flow velocity from the current meter were taken from a digital counter that calculated the average velocity every 10 s. All measurements were done under uniform flow where the flow depth observed varies in a range of ±2 mm, and three frequent readings were recorded at each measurement point to record an average value of water depth for each test point. The method of using a ruler for measuring the water depth in the subsurface channels was also reported in some studies conducted by Kee L.C. et al. [23] and Mohammadpour R. et al. [25].

2.3. Calculations of Roughness/Manning (n) of the Pipe and Froude Number (Fr) of the Flow

The hydraulic parameters considered and calculated in this study are Manning (n), Froude number (Fr), Reynolds number (Re), flow depth (y), flow velocity, and discharge (Q). The laboratory results were analyzed using the Manning (n) formula in metric, which was calculated using the following Equation (1) [34]:
n = 1 v R 2 3 S 1 2
where
  • n: Manning
  • v: Velocity of flow (m/s)
  • R: Hydraulic Radius
  • S: Longitudinal Slope
Furthermore, the Froude number, which is related to the flow condition, was calculated using Equation (2) and the state of flow is indicated in Table 1 [34].
F r = V g Y
where
  • Fr: Froude number
  • V: Velocity of flow (m/s)
  • G: Acceleration of gravity (m2/s)
  • Y: Depth of the flow section (m)
Table 1. State of flow described by the Froude number [32] ”Reprinted/adapted with permission from Ref. [32]. 2007, Ab Ghani et al.”.
Froude Number, FrState of FlowDescription
Fr = 1CriticalFlow celerity equal to flow velocity
Fr < 1SubcriticalSlow flow—tranquil and streaming
Fr > 1SupercriticalHigh velocity—rapid, shooting, and torrential

3. Results

The summary of the conditions of GFO (tailgate fully open) and GPO (tailgate partially open) investigated in the flume of a perforated pipe is shown in Table 2. The flow discharges from GFO outlets with pipe slopes of 1:750 and 1:1000 ranged higher than the flow rates from GPO with similar slopes. The calculated flow velocities under GFO conditions in the perforated pipe with slopes of 1:750 and 1:1000 were also higher than the velocities under GPO conditions, while the depths of flow were lower under GFO conditions compared to depths of flow under GPO conditions (Table 2). Froude numbers were computed for flow in the perforated pipe under GFO and GPO flow conditions. As shown in Table 2, subcritical and supercritical flows occurred in the perforated pipe under GFO conditions as the computed Froude numbers were lower and higher than 1, respectively, while only subcritical flow occurred in the pipe under GPO conditions where the flow was slow with low velocity. Based on the calculated Reynolds number, which ranged from 38,252 to 64,801 for both GFO and GPO conditions, most of the flow was turbulent in the perforated pipe (Table 2).

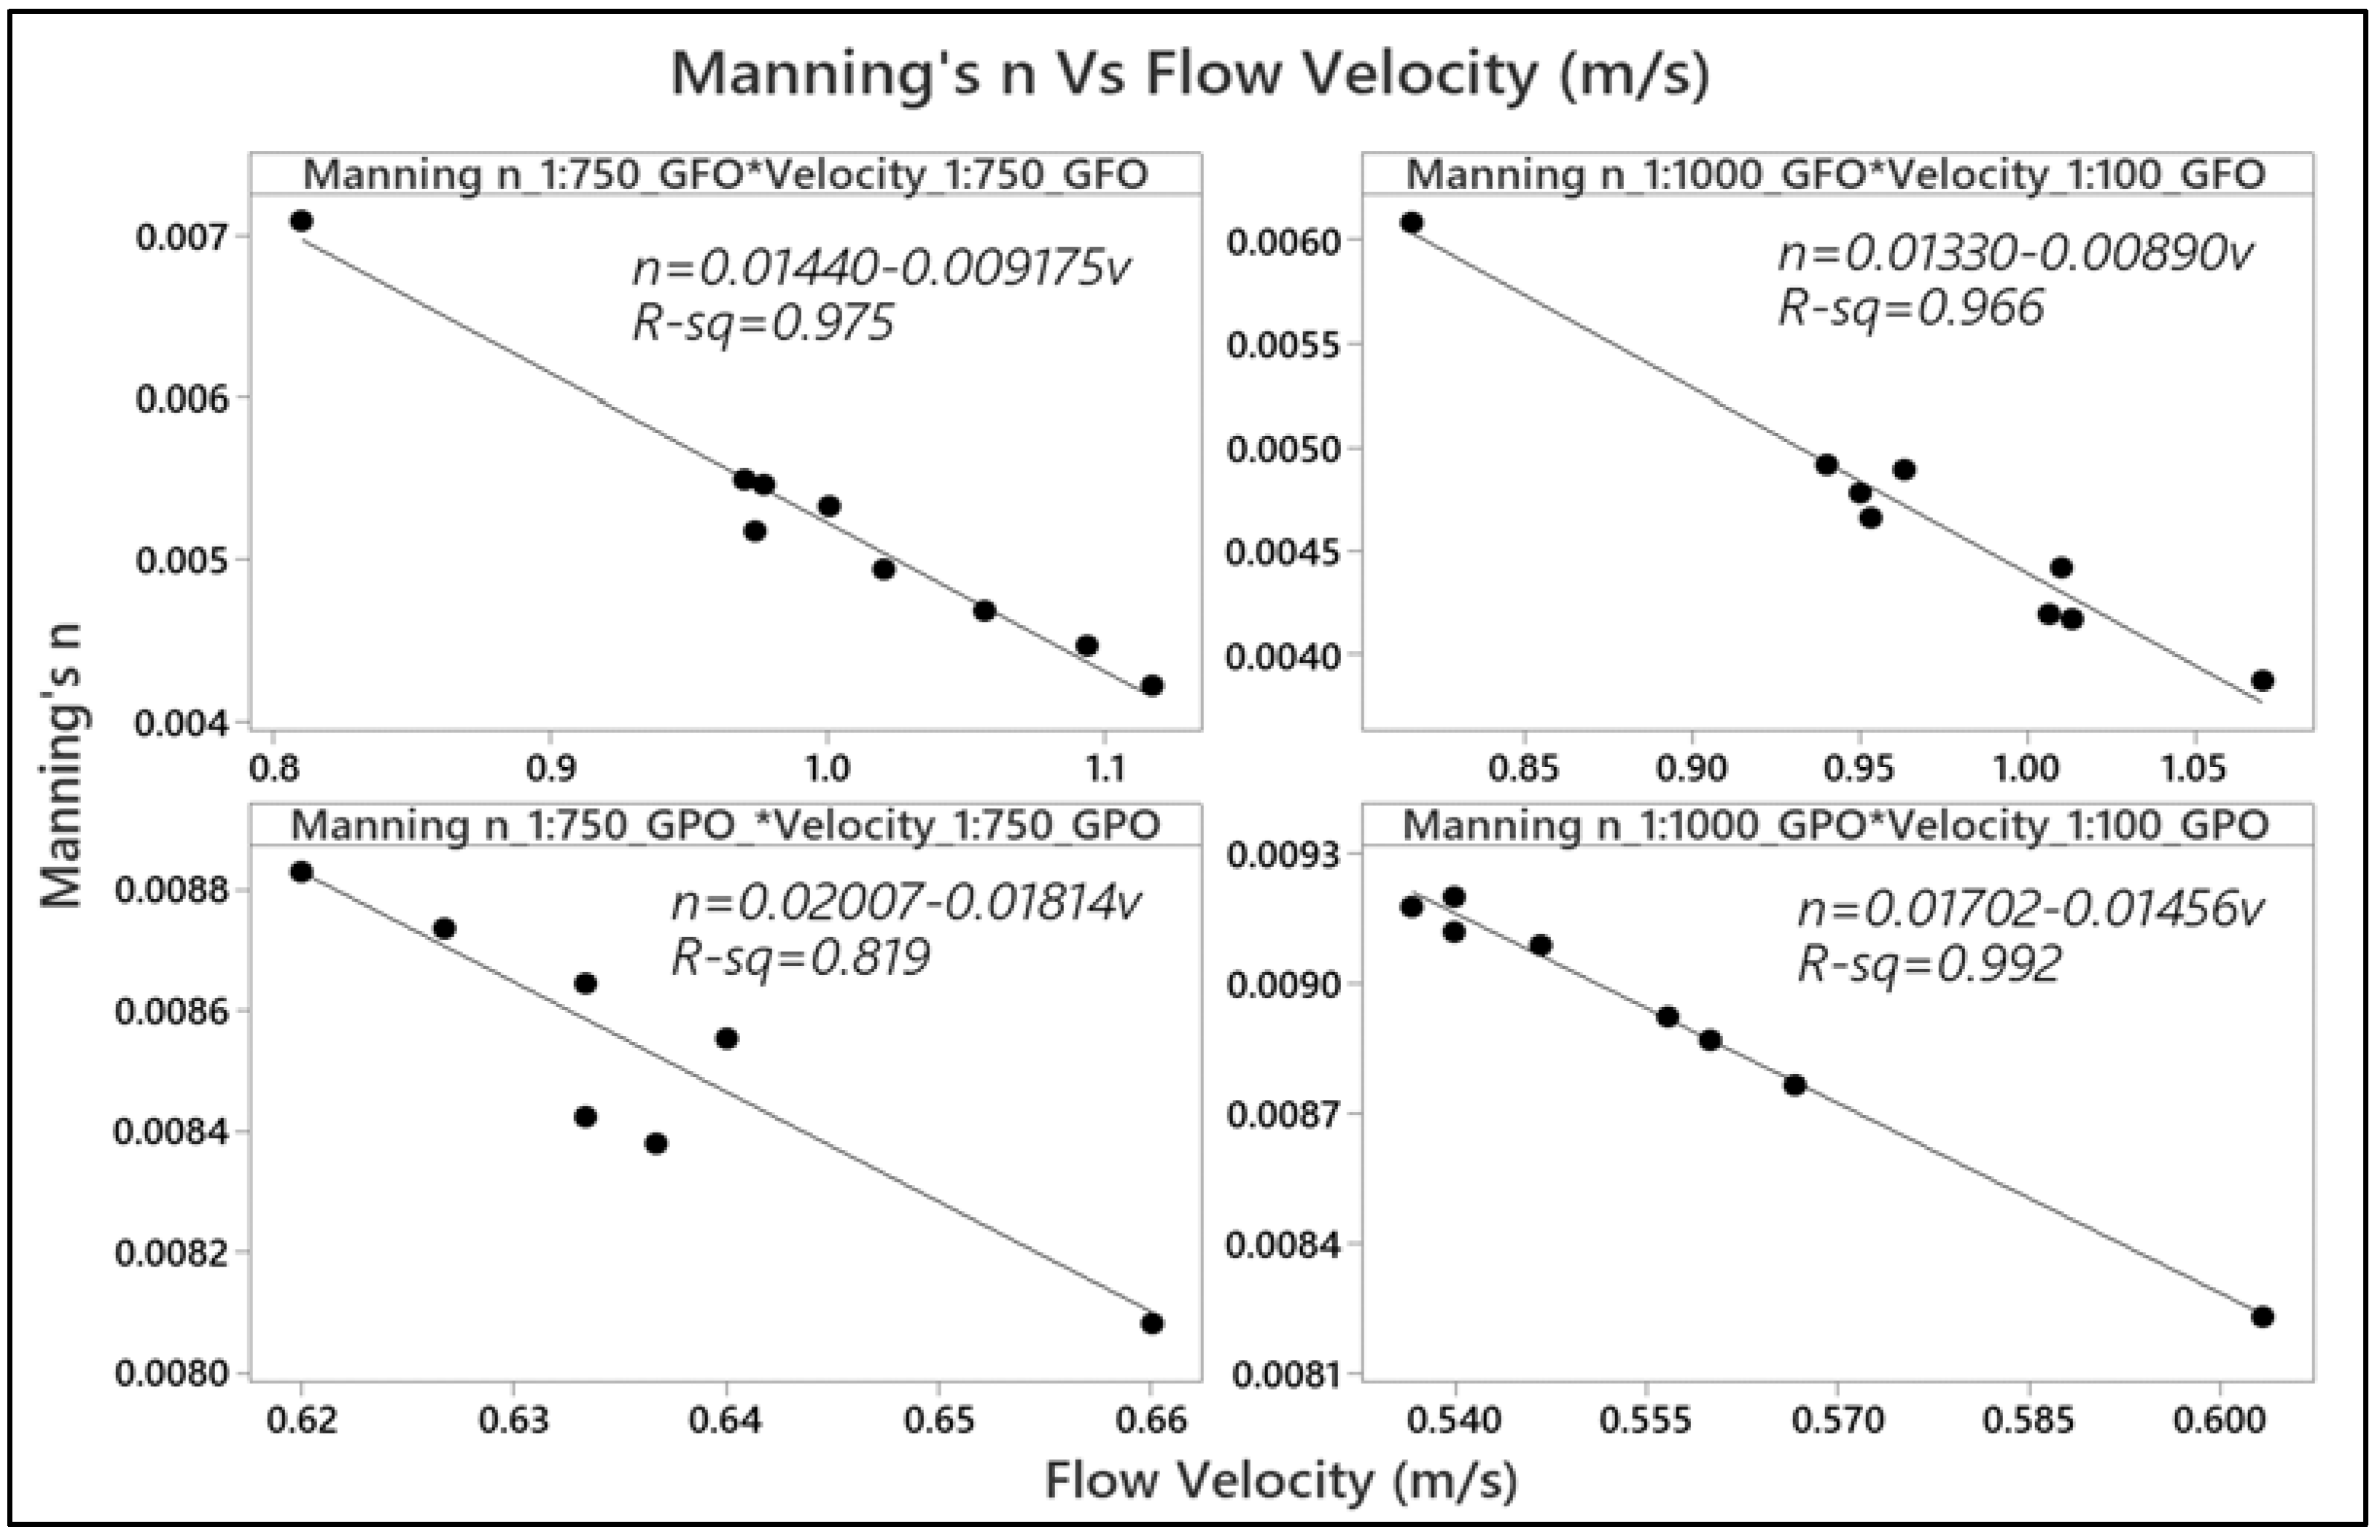
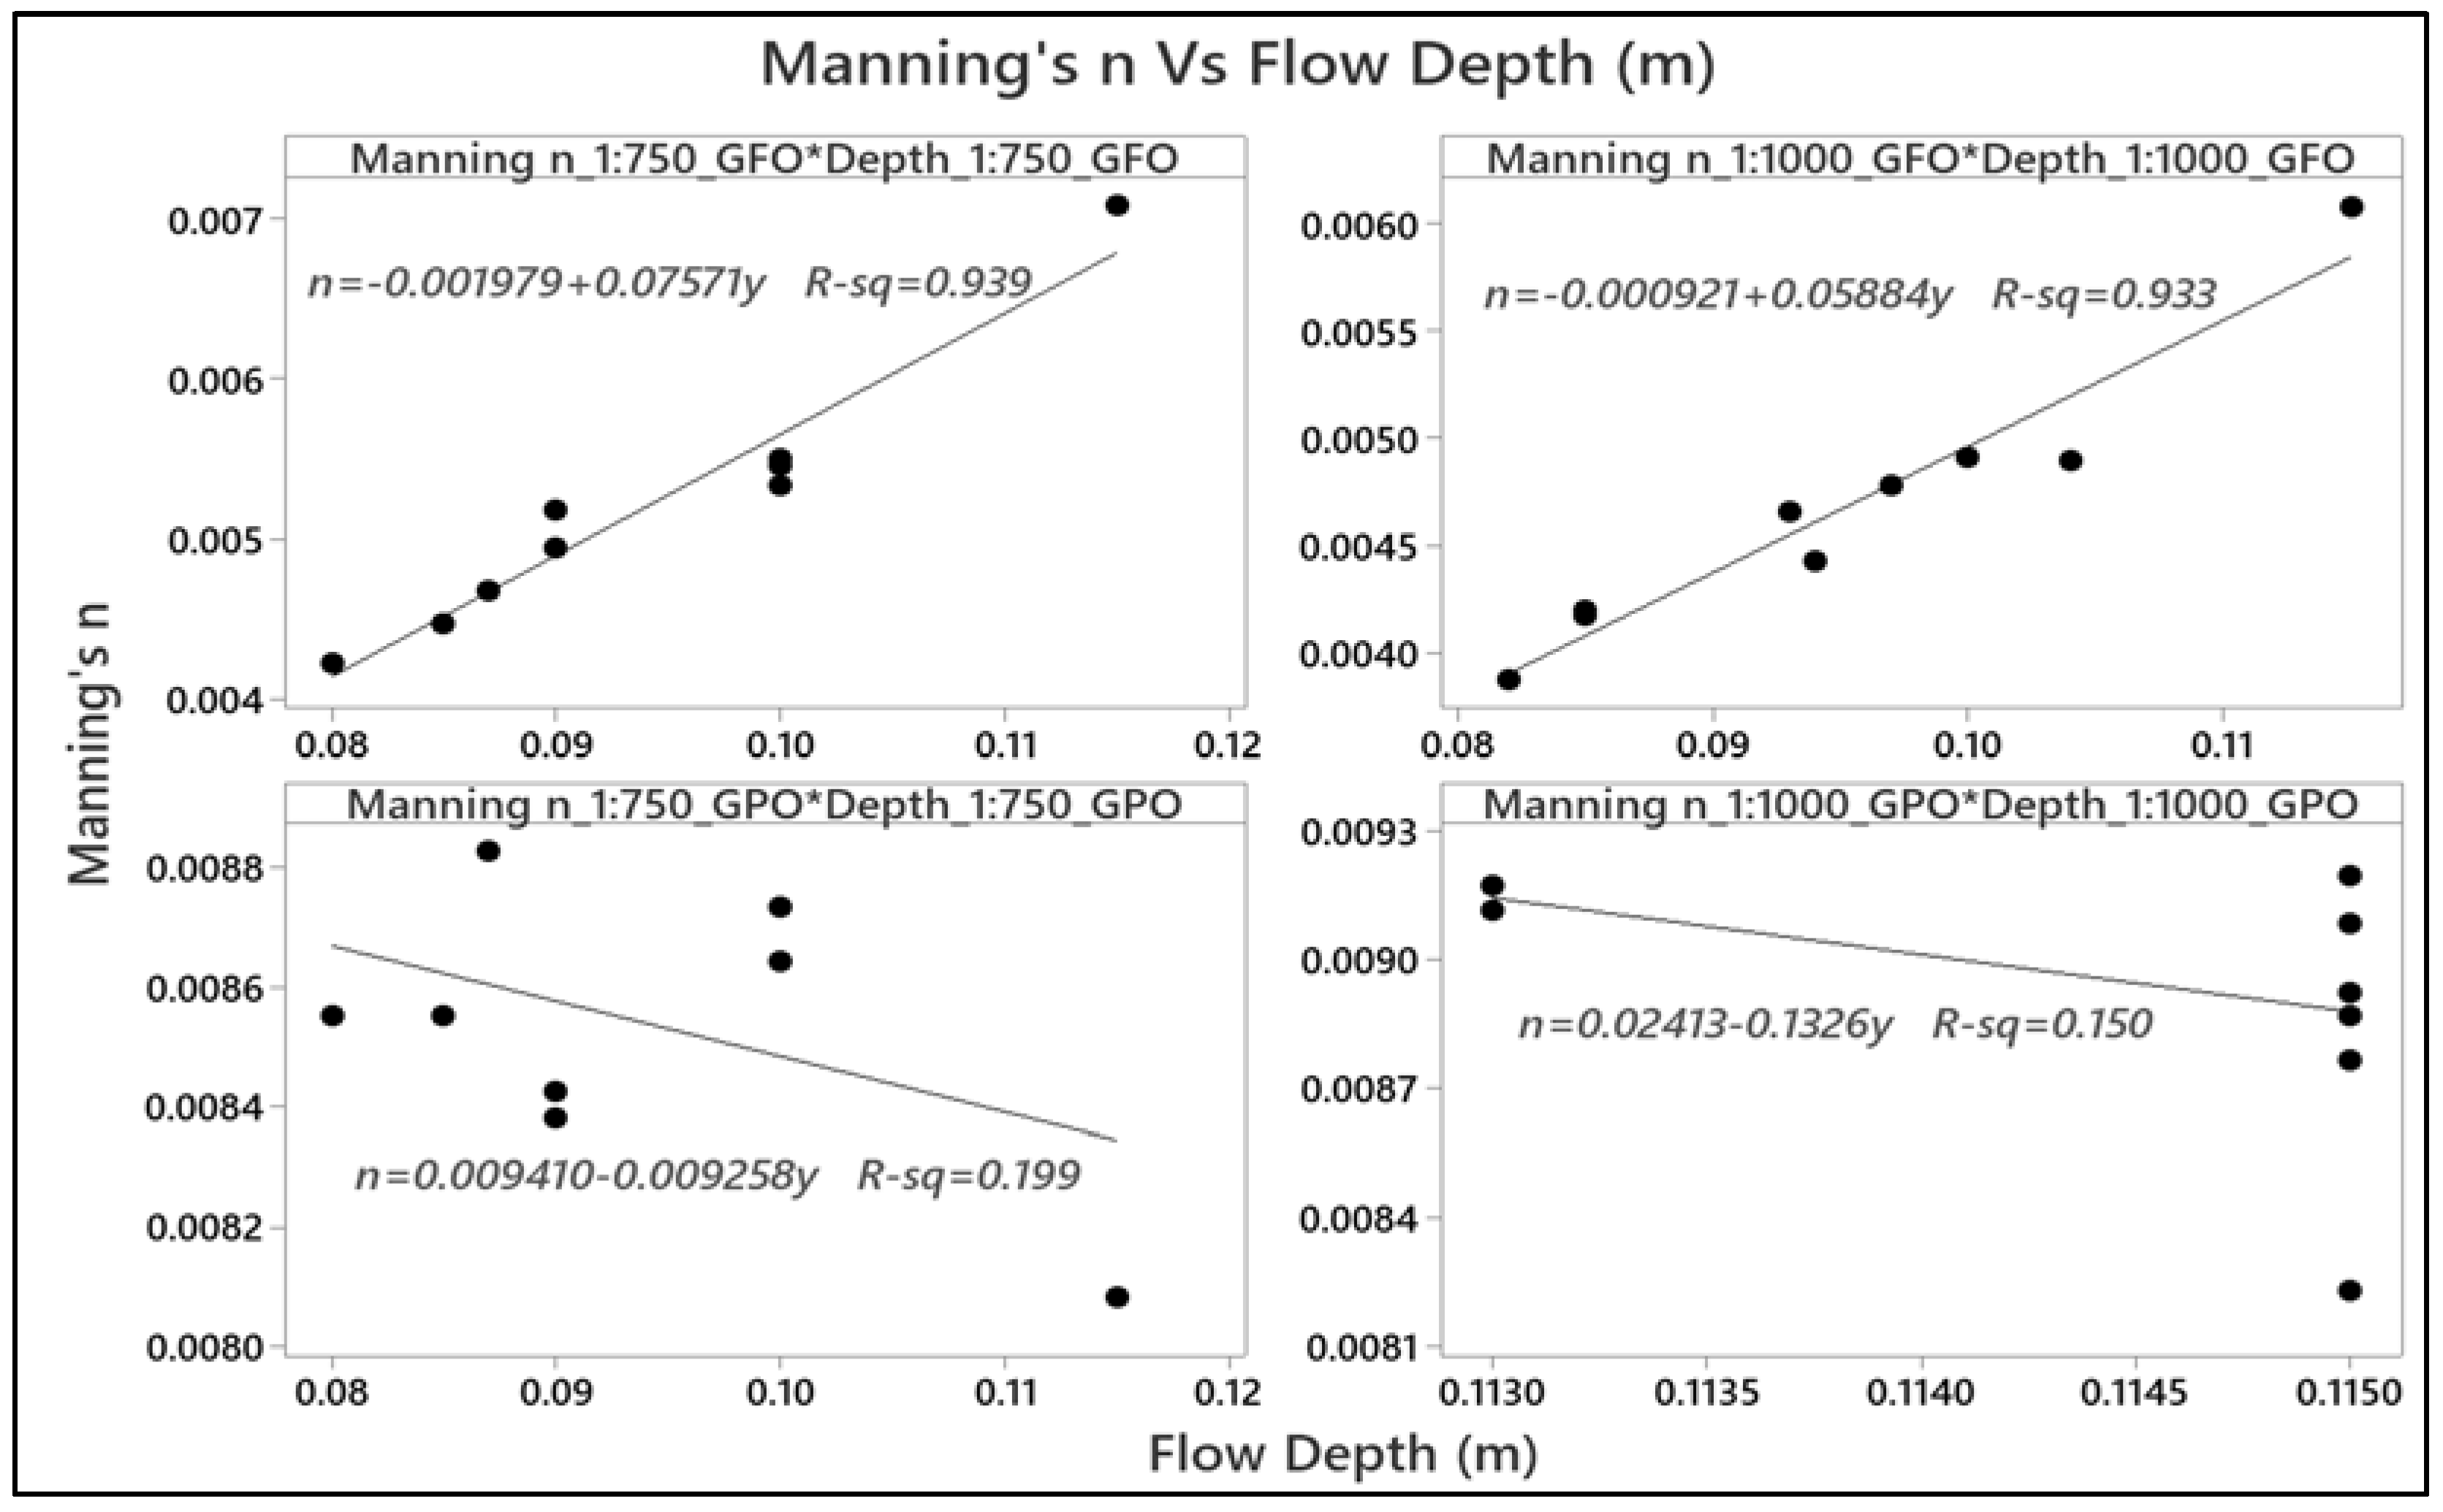
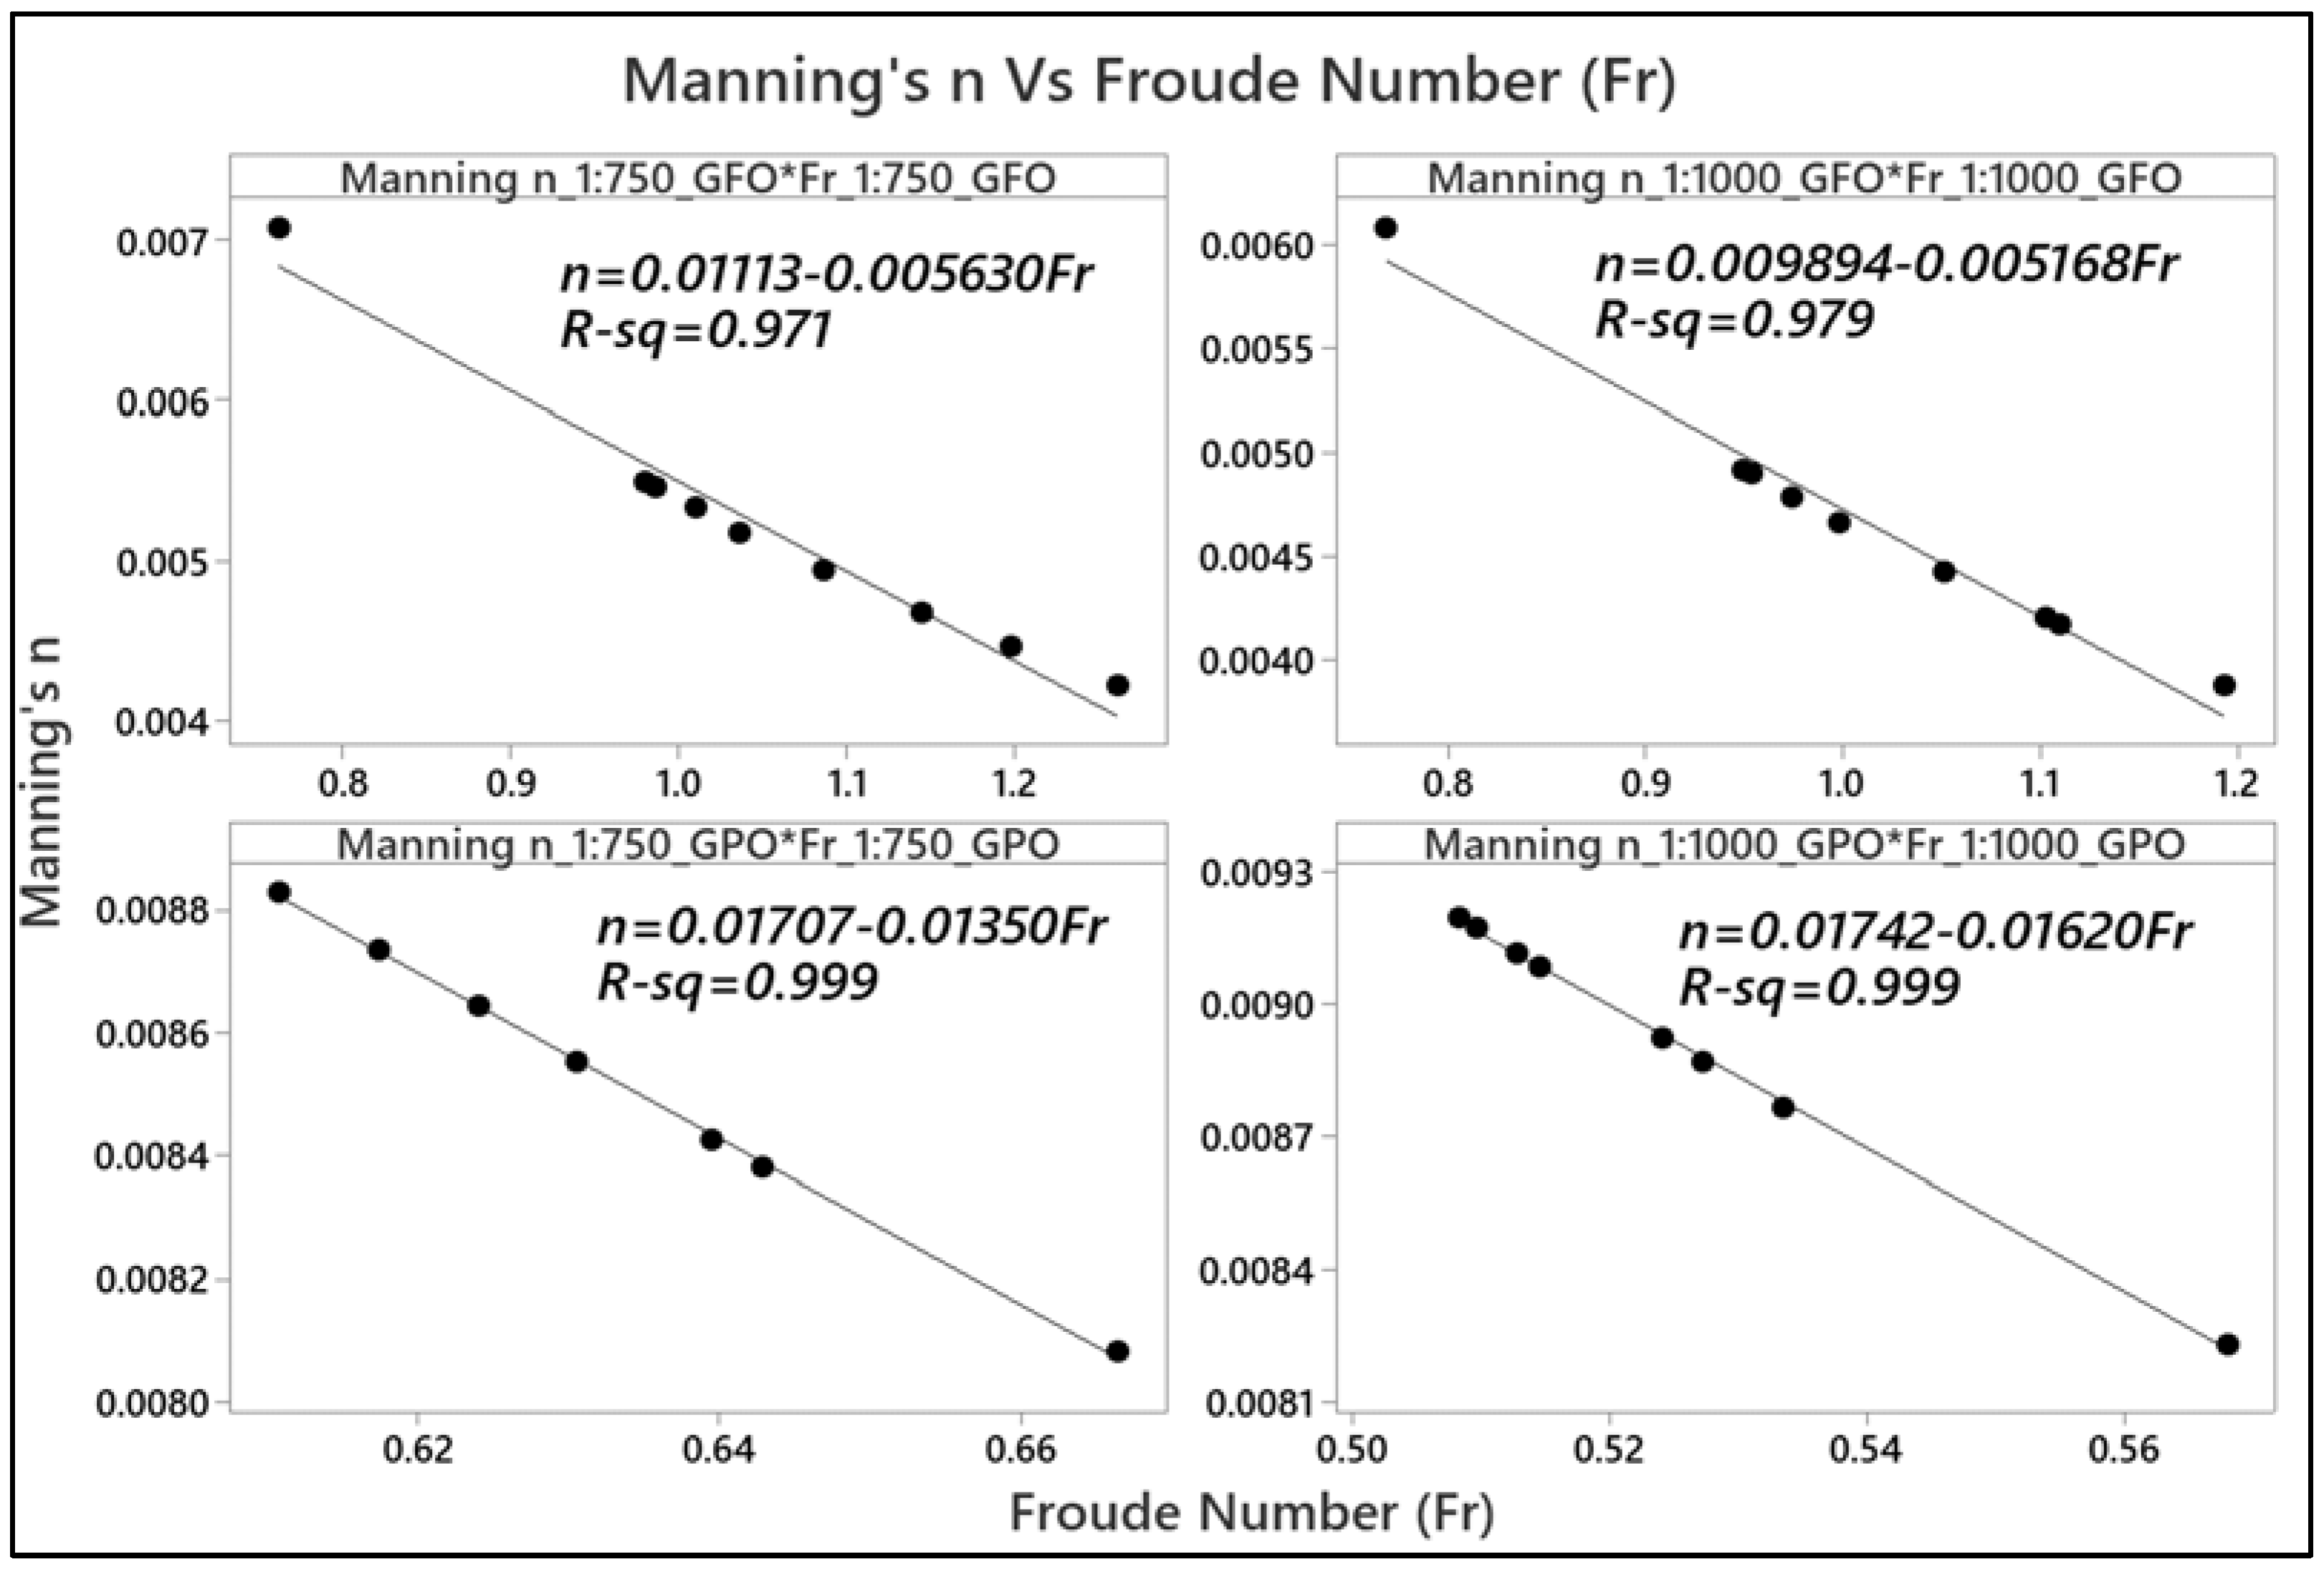
Effects of Hydraulic Performance of Manning Coefficient (n) versus Flow Velocity, Flow Depth, and Froude Number for Gate Fully Open (GFO) and Gate Partially Open (GPO) Scenarios with Longitudinal Slopes of 1:750 and 1:1000

Manning’s n for the perforated pipe was computed using Equation (1) and is shown in Table 3. The Manning’s n calculated for two slopes of 1:750 and 1:1000 under the scenarios of GFO and GPO ranged from 0.004 to 0.009, as shown in Table 3. In general, the n values of the perforated pipe under the GFO condition ranged from 0.004–0.007, while for GPO condition, the range of n values was between 0.008–0.009. In this work, the relationship between the calculated Manning’s n for the nine points in the perforated pipe and the hydraulic parameters of flow velocity, depth, and Froude number was evaluated, as shown in Figure 7, Figure 8 and Figure 9. The relationship between Manning’s n and flow velocity varied inversely, with calculated coefficients of determination (R2) of 0.975, 0.966, 0.819, and 0.992 for the flow under conditions of GFO with slopes of 1:750 and 1:1000 and GPO with slopes of 1:750 and 1:1000, respectively. On the other hand, the Manning’s n decreased linearly with increasing flow velocity (Figure 7) in the pipe under both GFO and GPO flow conditions. Within the ranges of 0.004–0.009 obtained for the Manning’s n of the perforated pipe used in this work, the values of velocity (v) of the flow under GFO conditions with slopes of 1:750 and 1:1000 and GPO conditions with slopes of 1:750 and 1:1000 were estimated as v = ((0.01440 − n)/0.009175), v = ((0.01330 − n)/0.00890), v = ((0.02007 − n)/0.01814), and v = ((0.01702 − n)/0.01456), respectively (Figure 7).
Manning’s n was observed to increase with increasing flow depth for the flow condition under fully open tailgate (GFO) with slopes of 1:750 and 1:1000, indicating that the Manning’s n of the pipe varied proportionally with the depths of flow, and the relationship between Manning’s n and the depths of flow was linear as the coefficients of determination (R2) were obtained at 0.939 and 0.933 for the GFO with slopes of 1:750 and 1:1000, respectively. Within the ranges of 0.004–0.009 obtained for the Manning’s n of the perforated pipe using Equation (1) in this work, the values of depth (d) for the flow under GFO with slopes of 1:750 and 1:1000 were obtained as y = ((n + 0.001979)/0.07571) and y = ((n + 0.000921)/0.05884), respectively. In the GPO flow condition, a low R2 was obtained, indicating that the Manning’s n deviated further from the regression line, as shown in Figure 8. This is due to the effect of backwater under the GPO condition.
The Manning coefficients were also observed to decrease with increasing Froude numbers, which are proportional to the velocities of the flow according to Equation (2). It was shown that the relationship between Manning’s n and the Froude number (Fr) was inversely linear as the calculated coefficients of determination (R2) were obtained at 0.971, 0.979, 0.999, and 0.999 for the flow under conditions of GFO with slopes of 1:750 and 1:1000 and GPO with slopes of 1:750 and 1:1000, respectively (Figure 9). Within the ranges of 0.004–0.009 obtained for the Manning’s n of the perforated pipe used in this work, the values of Froude number (Fr) of the flow under GFO with slopes of 1:750 and 1:1000 and GPO conditions with slopes of 1:750 and 1:1000 were obtained as Fr = ((0.01113 − n)/0.005630), Fr = ((0.009894 − n)/0.005168), Fr = ((0.01707 − n)/0.01350), and Fr = ((0.01742 − n)/0.01620), respectively (Figure 9).

4. Discussion

Flow velocities in the perforated pipe under two slopes of 1:750 and 1:1000 under phases of GFO and GPO were proportional to the flow rates (Table 2), which results agreed with the findings of the research done by Kee et al. [23] and Bakry [35] using modular channels. The ranges of flow velocity and depth in the GPO condition were lower than those ranges in the GFO condition under two slopes of 1:750 and 1:1000 (Table 2), which was due to the impact of backwater that occurred at the GPO condition. The flow depth downstream of the GPO perforated pipe increased because of the effect of the existing gate at the end of the flume. This result followed a similar trend under a study conducted by Mohammadpour et al. [25] using modular channels. Obviously, the GFO condition gave lower Manning’s n values for the perforated pipe compared to the GPO condition (Table 3). A similar trend was also seen in a previous study conducted by Mohammadpour et al. [25] using modular channels.
The relationship between the obtained Manning’s n for the perforated pipe under two slopes of 1:750 and 1:1000 under phases of GFO and GPO and the measured flow velocities in the perforated pipe in this work (Figure 7) agreed with Manning’s equation (Equation (1)), where the Manning coefficient varied inversely with flow velocity [34]. This relationship followed a similar pattern to studies conducted by Kee et al. [23], Mohammadpour et al. [25], Barky [35], Trout [36], and Chang et al. [37] using modular channels and Chen et al. [38], Fathi-Moghadam and Drikvandi [39], and Conesa-García et al. [40] using vegetated channels for the runoff infiltration purposes. The relationship between the obtained Manning’s n for the perforated pipe and the measured Froude numbers (Fr) also followed a trend similar to studies conducted by Kee et al. [23] and Mohammadpour et al. [25] using modular channels and Chen et al. [38] and Fathi-Moghadam and Drikvandi [39] using vegetated channels for the runoff infiltration purposes. The findings of the laboratory simulation in this work indicated that with the implementation of the perforated pipes in swales and infiltration trenches in Malaysia, the speed and discharge of tropical monsoon runoff will be reduced, which aids in reducing the peak runoff volume and preventing the occurrence of flash flooding in the cities. Thus, for the upcoming work at REDAC, the performance of a six-row sand-slot perforated pipe located beneath the layers of soil, sand, aggregates chip stones, and gravel of the laboratory infiltration trenches in terms of determining the infiltration and exfiltration rates of the perforated pipe will be investigated, which is shown in Figure 10.

5. Conclusions

Research was carried out to investigate the flow resistance and the Manning coefficients effects along a six-row regular-perforated sand-slot pipe acting as subsurface drainage on the hydraulic parameters of flow velocity, depth, and the Froude number to control the quantity of stormwater runoff under two flow conditions of GFO and GPO with two slopes of 1:750 and 1:1000 in a laboratory flume in this work, which concluded as follows:
(a)
The results of a flow condition in the above perforated pipe under GFO showed a significant relationship between the Manning’s n and other hydraulic parameters of flow velocity, depth, and Froude number, and the R2 value was close to 1 with both pipe slopes of 1:750 and 1:1000. Since the roughness coefficient (Manning’s n) of the pipe increases, it is able to reduce the flow velocity in the pipe, resulting in a lower peak of flow and the ability to control the quantity of the storm water in the subsurface urban drainages. An inverse linear relationship between the Manning coefficients and the flow velocity was also achieved with the coefficients of determination (R2) of 0.975 and 0.966, which resulted in predicting the values of flow velocities based on the calculated Manning’s n that fell within the range of 0.004 to 0.009 using the equations v = ((0.01440 − n)/0.009175) and v = ((0.01330 − n)/0.00890), with the various pipe slopes of 1:750 and 1:1000, respectively. However, as the Manning’s n increased, the depth of flow in the perforated pipe also increased linearly, and the equations y = ((n + 0.001979)/0.07571) and y = ((n + 0.000921)/0.05884) were attained when the ranges of Manning’s n were within 0.004 to 0.009 for the pipe with slopes of 1:750 and 1:1000, respectively. On top of that, the calculated Froude numbers showed an inverse linear relationship with the calculated Manning’s n of the pipe, and the equations Fr = ((0.01113 − n)/0.005630) and Fr = ((0.009894 − n)/0.005168) can be found with the Manning’s n ranging between 0.004 and 0.009 with pipe slopes of 1:750 and 1:1000, respectively.
(b)
In addition, in a flow condition in the perforated pipe under GPO, the R2 of 0.819 and 0.992 were achieved because of the converse linear relationship between the Manning coefficients and the flow velocity, which resulted in predicting the values of flow velocities based on the calculated Manning’s n that fell within the range of 0.004 to 0.009 using the equations v = ((0.02007 − n)/0.01814) and v = ((0.01702 − n)/0.01456), with the various pipe slopes of 1:750 and 1:1000, respectively. However, it was perceived that increasing and decreasing the Manning coefficients did not significantly affect the depths of flow in the pipe with both pipe slopes. Even so, an inverse linear relationship was obtained between the Froude number and the Manning’s n, yielding the equations Fr = ((0.01707 − n)/0.01350) and Fr = ((0.01742 − n)/0.01620) with R2 approximately close to 1.00 to find the Froude numbers with the Manning’s n ranging between 0.004 and 0.009, respectively. Thus, from the findings of this work, it was concluded that by using a perforated pipe with a high Manning coefficient (n) along the pipe under both GFO and GPO conditions with two slopes of 1:750 and 1:1000, the velocity of runoff inflow will be decreased, thereby reducing the peak runoff volume and flash flooding. Therefore, the subsurface perforated pipe under the GFO and GPO conditions can be recommended to be used for the best management practices (BMP) in sustainable stormwater management.

Author Contributions

J.A., M.R.R.M.A.Z. and A.R. wrote the original draft of the manuscript; N.A.Z., M.F.Y., S.S., M.N.A., M.Z.M.K., M.S.A.A., N.M.N., M.H.Z., M.R.R.M.A.Z. and J.I. edited the manuscript, validated the data, and prepared the technical aspects of the paper. All authors have read and agreed to the published version of the manuscript.

Funding

This research was funded by the Universiti Sains Malaysia, grant number “(STG) (304/PREDAC/6315532)”. APC was funded by the River Engineering and Urban Drainage Research Centre (REDAC).

Institutional Review Board Statement

Not applicable.

Informed Consent Statement

Informed consent was obtained from all subjects in the study.

Data Availability Statement

The data presented in this study are available upon request from the corresponding author.

Acknowledgments

The authors would like to express their gratitude to the Universiti Sains Malaysia for the financial support of the Short-Term Grant (STG) (304/PREDAC/6315532) and for providing the facilities. The authors also appreciate the financial support provided by the Ministry of Higher Education, Malaysia, under the Higher Institution Centre of Excellence (HICoE) for a research grant of 311.PREDAC.4403901. Authors also thank the REDAC technicians, Mohamad Firdaus Talib, Nor Faizullah Nor Azhar, and Zakaria Ansori bin Abdul Rahman, for their kind cooperation.

Conflicts of Interest

The authors declare no conflict of interest.

References

  1. Barnett, T.P.; Pierce, D.W.; Hidalgo, H.G.; Bonfils, C.; Santer, B.D.; Das, T.; Bala, G.; Wood, A.W.; Nozawa, T.; Mirin, A.A.; et al. Human-Induced Changes in the Hydrology of the Western United States; DigitalCommons, University of Nebraska-Lincoln: Lincoln, NE, USA, 2008. [Google Scholar]
  2. Milly, P.C.D.; Betancourt, J.; Falkenmark, M.; Hirsch, R.M.; Kundzewicz, Z.W.; Lettenmaier, D.P.; Stouffer, R.J. Stationarity is dead: Whither water management? Science 2008, 319, 573–574. [Google Scholar] [CrossRef]
  3. Karl, T.R.; Knight, R.W.; Plummer, N. Trends in high-frequency climate variability in the twentieth century. Nature 1995, 377, 217–220. [Google Scholar] [CrossRef]
  4. Karl, T.R.; Knight, R.W. Secular trends of precipitation amount, frequency, and intensity in the United States. Bull. Am. Meteorol. Soc. 1998, 79, 231–241. [Google Scholar] [CrossRef]
  5. Wang, D.; Hagen, S.C.; Alizad, K. Climate change impact and uncertainty analysis of extreme rainfall events in the Apalachicola River basin, Florida. J. Hydrol. 2013, 480, 125–135. [Google Scholar] [CrossRef]
  6. FAO; IFAD; UNICEF; WFP; WHO. The State of Food Security and Nutrition in the World 2018. Building Climate Resilience for Food Security and Nutrition; FAO: Rome, Italy, 2018. [Google Scholar]
  7. Abida, H.; Sabourin, J.F. Grass swale-perforated pipe system for stormwater management. J. Irrig. Drain. Eng. 2006, 132, 55–63. [Google Scholar] [CrossRef]
  8. Livingston, E.H. State perspectives on water quality criteria, design of urban runoff quality controls. In Proceedings of the Engineering Foundation Conference, Palm Coast, FL, USA, 10–15 January 1988; pp. 15–218. [Google Scholar]
  9. Goddard, J.B. Storm Water Detention/Retention: A New Solution. Public Works Magazine. 1 June 1984. [Google Scholar]
  10. Schueler, T.R. Controlling Urban Runoff: A Practical Manual for Planning and Designing Urban BMP’S; Department of Environmental Programs, Metropolitan Washington Council of Governments: Washington, DC, USA, 1987. [Google Scholar]
  11. Stahre, P.; Urbonas, B. Swedish approach to infiltration and percolation design. In Design of Urban Runoff Quality Controls; ASCE: New York, NY, USA, 1989; pp. 307–322. [Google Scholar]
  12. Tu, M.C.; Traver, R.G. Optimal configuration of an underdrain delivery system for a stormwater infiltration trench. J. Irrig. Drain. Eng. 2019, 145, 05019007. [Google Scholar] [CrossRef]
  13. Murphy, P.; Kaye, N.B.; Khan, A.A. Hydraulic Performance of Aggregate Beds with Perforated Pipe Underdrains Flowing Full. J. Irrig. Drain. Eng. 2014, 140, 04014023. [Google Scholar] [CrossRef]
  14. Afrin, T.; Khan, A.A.; Kaye, N.B.; Testik, F.Y. Numerical Model for the Hydraulic Performance of Perforated Pipe Underdrains Surrounded by Loose Aggregate. J. Hydraul. Eng. 2016, 142, 04016018. [Google Scholar] [CrossRef]
  15. Li, Y.; Buchberger, S.G.; Sansalone, J.J. Variably saturated flow in stormwater partial exfiltration trench. J. Environ. Eng. 1999, 125, 556–565. [Google Scholar] [CrossRef]
  16. Guo, J.C.Y.; Kocman, S.M.; Ramaswami, A. Design of two layered porous landscaping detention basin. J. Environ. Eng. 2009, 135, 1268–1274. [Google Scholar] [CrossRef]
  17. Schwartz, S.S. Effective curve number and hydrologic design of pervious concrete storm-water systems. J. Hydrol. Eng. 2010, 15, 465–474. [Google Scholar] [CrossRef]
  18. Guo, J.C.Y. Cap-orifice as a flow regulator for rain garden design. J. Irrig. Drain. Eng. 2012, 138, 198–202. [Google Scholar] [CrossRef]
  19. Akan, A.O. Preliminary design aid for bioretention filters. J. Hydrol. Eng. 2013, 18, 318–323. [Google Scholar] [CrossRef]
  20. Zakaria, N.A.; Ab Ghani, A.; Abdullah, R.; Mohd Sidek, L.; Ainan, A. Bio-ecological drainage system (BIOECODS) for water quantity and quality control. Int. J. River Basin Manag. 2003, 1, 237–251. [Google Scholar] [CrossRef]
  21. Ab Ghani, A.; Zakaria, N.A.; Abdullah, R.; Yusof, M.F.; Sidek, L.M.; Kassim, A.H.; Ainan, A. Bio-Ecological Drainage System (BIOECODS): Concept, Design and Construction. In Proceedings of the International Conference on HydroScience and Engineering, Brisbane, Australia, 31 May–3 June 2004. [Google Scholar]
  22. Lai, S.H.; Kee, L.C.; Zakaria, N.A.; Ab Ghani, A.; Chang, C.K.; Leow, C.S. Flow Pattern and Hydraulic Characteristic for Subsurface Drainage Module. In Proceedings of the International Conference on Water Resources (ICWR 2009), Langkawi, Kedah, Malaysia, 26–27 May 2009. [Google Scholar]
  23. Kee, L.C.; Zakaria, N.A.; Lau, T.L.; Chang, C.K.; Ab Ghani, A. Determination of manning’s for subsurface modular channel. In Proceedings of the 3rd International Conference on Managing Rivers in 21st Century: Sustainable Solutions for Global Crisis of Flooding, Pollution and Water Scarcity (Rivers 2011), Penang, Malaysia, 6–9 December 2011. [Google Scholar]
  24. Muhammad, M.M.; Yusof, K.W.; Mustafa, M.R.U.; Zakaria, N.A.; Ab Ghani, A. Prediction models for flow resistance in flexible vegetated channels. Int. J. River Basin Manag. 2018, 16, 427–437. [Google Scholar] [CrossRef]
  25. Mohammadpour, R.; Kashfy, M.; Zakaria, N.A.; Ab Ghani, A. Manning’s Roughness Coefficient for Ecological Subsurface Channel with Modules. Int. J. River. Basin. Manag. 2020, 18, 349–361. [Google Scholar] [CrossRef]
  26. Gaj, N.; Madramootoo, C.A. Effects of Perforation Geometry on Pipe Drainage in Agricultural Lands. J. Irrig. Drain. Eng. 2020, 146, 04020015. [Google Scholar] [CrossRef]
  27. Ghane, E. Agricultural Drainage; Extension Bulletin E3370; Michigan State University (MSU): East Lansing, MI, USA, 2018. [Google Scholar]
  28. Ghane, E. Choice of pipe material influences drain spacing and system cost in subsurface drainage design. Appl. Eng. Agric. 2022, 38, 685–695. [Google Scholar] [CrossRef]
  29. Oyarce, P.; Gurovich, L.; Duarte, V. Experimental evaluation of agricultural drains. J. Irrig. Drain. Eng. 2016, 143, 04016082. [Google Scholar] [CrossRef]
  30. Gurovich, L.; Oyarce, P. Modeling Agricultural Drainage Hydraulic Nets. Irrig. Drain. Sys. Eng. 2015, 4, 1000149. [Google Scholar] [CrossRef]
  31. DID (JPS) Malaysia. Urban Stormwater Management Manual for Malaysia (MSMA), 1st ed.; DID (JPS) Malaysia: Kuala Lumpur, Malaysia, 2000. [Google Scholar]
  32. Ab Ghani, A.; Zakaria, N.A.; Kiat, C.C.; Ariffin, J.; Hasan, Z.A.; Abdul Ghaffar, A.B. Revised equations for Manning’s coefficient for Sand-Bed Rivers. Int. J. River Basin Manag. 2007, 5, 329–346. [Google Scholar] [CrossRef]
  33. Pradhan, A.; Khatua, K.K. Assessment of roughness coefficient for meandering compound channels. KSCE J. Civ. Eng. 2018, 22, 2010–2022. [Google Scholar] [CrossRef]
  34. Zainalfikry, M.K.; Ab Ghani, A.; Zakaria, N.A.; Chan, N.W. Flow Resistance in Ecological Subdrainage Channel. Lect. Notes Civ. Eng. 2020, 53, 1117–1127. [Google Scholar]
  35. Bakry, M.F. Effect of submerged weeds on the design: Procedure of Earthen Egyptian Canals. Irrig. Drain. Sys. 1992, 6, 179–188. [Google Scholar] [CrossRef]
  36. Trout, T.J. Furrow flow velocity effect on hydraulic roughness. J. Irrig. Drain. Eng. 1992, 118, 981–987. [Google Scholar] [CrossRef]
  37. Chang, T.H.; Huang, S.T.; Chen, S.; Lai, J.C. Estimation of Manning roughness coefficient on precast ecological concrete blocks. J. Mar. Sci. Technol. 2010, 18, 308–316. [Google Scholar] [CrossRef]
  38. Chen, Y.C.; Kao, S.P.; Lin, J.Y.; Yang, H.C. Retardance coefficient of vegetated channels estimated by the Froude Number. Ecol. Eng. 2009, 35, 1027–1035. [Google Scholar] [CrossRef]
  39. Fathi-Moghadam, M.; Drikvandi, K. Manning roughness coefficient for rivers and flood plains with non-submerged vegetation. Int. J. Hydraul. Eng. 2012, 1, 1–4. [Google Scholar]
  40. Conesa-García, C.; Sanchez-Tudela, J.L.; Perez-Cutillas, P.; Martinez Capel, F. Spatial variation of the vegetative roughness in Mediterranean torrential streams affected by check dams. Hydrol. Sci. J. 2018, 63, 114–135. [Google Scholar] [CrossRef]
Figure 1. Grass swale perforated pipe system utilized as stormwater runoff subsurface drainage in the United States (U.S.) and Canada [7] “Reprinted/adapted with permission from Ref. [7]. 2006, Abida and Sabourin”.
Sustainability 15 06929 g001
Figure 2. Sketches of (a) the plan view of the six-row non-staggered sand-slot perforated pipe, (b) the cut section view of the perforated pipe, and (c) the 3D view of the perforated pipe with the total length.
Sustainability 15 06929 g002
Figure 3. Photographs of (a) the sectional view and (b) the plan view of the HDPE perforated pipe, as well as views of (c) the non-staggered inner and (d) the outer slots of the perforated pipe used in this work.
Sustainability 15 06929 g003
Figure 4. Sectional drawing of experimental channel (unit: mm) [23] ”Reprinted/adapted with permission from Ref. [23]. 2011, Kee et al.”.
Sustainability 15 06929 g004
Figure 5. (a) Schematic view of the perforated pipe test point and (b) photo of the flow measurement segments on the top of the perforated pipe.
Sustainability 15 06929 g005
Figure 6. Photographs of (a) fully open tailgate and (b) partially open tailgate, as well as (c) measuring the depth and (d) velocity of the flow in that perforated pipe.
Sustainability 15 06929 g006
Figure 7. Relationship between flow velocity and Manning’s n under the phases of GFO and GPO with longitudinal slopes of 1:750 and 1:1000.
Sustainability 15 06929 g007
Figure 8. Relationship between flow depth and Manning’s n under the phases of GFO and GPO with longitudinal slopes of 1:750 and 1:1000.
Sustainability 15 06929 g008
Figure 9. Relationship between the Froude number (Fr) and the Manning’s n under the phases of GFO and GPO with longitudinal slopes of 1:750 and 1:1000.
Sustainability 15 06929 g009
Figure 10. Sketch of a six-row perforated pipe acting as subsurface drainage beneath an infiltration trench filled with gravel and sand.
Sustainability 15 06929 g010
Table 2. Experimental study on the perforated pipe.
Flow ParameterRange
Perforated Pipe under GFO ConditionsPerforated Pipe under GPO Conditions
Slope 1:750Slope 1:1000Slope 1:750Slope 1:1000
Flow Rate, Q (m3/s)0.017–0.0210.017–0.0210.008–0.0090.013–0.015
Velocity, V (m/s)0.810–1.1170.817–1.0700.620–0.6600.537–0.603
Flow Depth, Y (m)0.080–0.1200.080–0.1200.100–0.1100.110–0.120
Hydraulic Radius, R (m)0.046–0.0620.047–0.0620.056–0.0580.061–0.062
Reynolds Number, Re57,912–64,80157,124–64,39341,041–43,10338,252–43,579
Froude Number, Fr0.763–1.2610.769–1.1930.611–0.6660.508–0.568
Table 3. Ranges of Manning’s n for the perforated pipe under phases of GFO and GPO with slopes of 1:750 and 1:1000.
ParameterRange
Perforated Pipe under GFO ConditionsPerforated Pipe under GPO Conditions
Slope 1:750Slope 1:1000Slope 1:750Slope 1:1000
Manning’n0.004–0.0070.004–0.0060.008–0.0090.008–0.009
Disclaimer/Publisher’s Note: The statements, opinions and data contained in all publications are solely those of the individual author(s) and contributor(s) and not of MDPI and/or the editor(s). MDPI and/or the editor(s) disclaim responsibility for any injury to people or property resulting from any ideas, methods, instructions or products referred to in the content.

