Article

The Role of Personal Characteristics in Shaping Gender-Biased Job Losses during the COVID-19 Pandemic: The Case of South Africa

by
Lumengo Bonga-Bonga
*,
Thabiso Molemohi
and
Frederich Kirsten
School of Economics, University of Johannesburg, Johannesburg 2092, South Africa
*
Author to whom correspondence should be addressed.
Sustainability 2023, 15(8), 6933; https://doi.org/10.3390/su15086933
Submission received: 18 February 2023 / Revised: 2 April 2023 / Accepted: 17 April 2023 / Published: 20 April 2023
(This article belongs to the Special Issue Achieving Sustainable Development Goals in COVID-19 Pandemic Times)

Abstract

:
This paper contributes to the literature on the effects of adverse economic conditions on gender differences in the labour market by assessing how COVID-19, a global trigger for a critical adverse condition, impacted gender differences in the labour market in a country with pronounced discrimination and inequality in the labour market. In fact, the paper investigates how the personal characteristics of women and men affected their likelihood of losing jobs during and before COVID-19 in South Africa. Using the database of the National Income Dynamics Study-Coronavirus Rapid Mobile Survey (NIDS-CRAM) and NIDS wave 5 dataset and based on logit regression, the paper finds that personal characteristics such as tertiary education had a negative effect on job losses among females. Moreover, the results show that, compared to male workers, female workers were the most affected by the pandemic due to the lockdown regulation that affected many households’ behaviour.

1. Introduction

A debate is currently raging about how economic conditions affect gender differences in the labour market [1,2]. Evidence shows that gender differences in unemployment dynamics differ across countries and economic conditions. For example, Garcia [3] shows that during the great recession, the unemployment rate of females rose more than that of males in Spain. However, ref. [4] found that male unemployment rose faster than female unemployment during economic recessions in the US, reducing the gender gap that existed in regular times. In the subsequent recovery, male unemployment declined faster, returning the gender gap to normal. According to the author, female unemployment is more resilient during downturns because men and women work in economic sectors affected differently by recessions, recovery, and booms.
Different reasons are provided for gender differences in labour market outcomes in general. For example, Altonji an Blank [5] show that females and males differ in their preference for particular characteristics of jobs and types of work. As an example, females may prefer office work over manual labour. Very often, these types of jobs react differently to economic fluctuations and business cycles, explaining gender differences in unemployment during recession, boom, and normal times.
Several studies have examined how adverse economic conditions affect the labour market differently based on gender. Based on Pilatowka and Witkowska’s [6] findings, the dominance of men in the construction sector protects them from unemployment during cyclical downturns as the sector is not often affected by cyclical fluctuations. Other studies attribute gender differences during adverse conditions to gender commitment to labour market participation. In that context, Rubery and Rafferty [7] show that women may act as a flexible labour reserve as they are more likely than men to retreat into inactivity during low economic demand.
While the above-discussed studies focus on gender differences in the labour market during adverse conditions informed by business cycles, few studies have assessed the effect of COVID-19, seen as a global trigger for a critical adverse condition, on gender differences in the labour market in the context of emerging economies. It is critical to note that the COVID-19 outbreak caused global economic chaos, adversely affecting the labour market. Between March 2020 and April 2020, 30.3 million jobless claims were filed in the United States alone, and the unemployment rate reached a staggering 16% in May, a rise from 4.4% in March [8]. Globally, the number of jobs lost because of COVID-19 exceeded those lost during the 2007–2008 recession [9,10]. As a result of the pandemic’s massive economic and social effects, studies are beginning to unravel the impact of the pandemic to determine its actual magnitude, especially on the labour market. To this effect, a few studies have assessed the unemployment impact of the pandemic on different social groups, such as race [11], different skill levels [12,13], and gender [14,15].
Concerning the unemployment impact of COVID-19 on gender differences, studies show that women were more affected than their male counterparts during the pandemic, as they constitute the majority of the unskilled labour category [16]. In addition, Adams-Prassl et al. [17] found that women had a higher probability than men of being jobless or working fewer hours during the early onset of the pandemic in the US, Germany, and the United Kingdom. Gezici and Ozay [18] employed data from the Current Population Survey (CPS) to estimate the likelihood of joblessness during COVID-19. The authors found that race and gender played a pivotal role in the prospect of being jobless, even when considering the ability to work from home. Specifically, people of colour and women had a higher likelihood of being unemployed, which indicates that discrimination may be responsible for elevated levels of unemployment in these demographic groups.
While these studies emphasise women’s awkward position during crisis periods, especially during COVID-19, no study has assessed which attributes or personal characteristics of women and men contributed to the likelihood of unemployment during COVID-19 and whether the contribution of these personal characteristics to the probability of being unemployed varied from normal to crisis periods (before and during COVID-19). By identifying the gender characteristics responsible for gender differences and inequalities in the South African labour market, sustainable policy recommendations can be developed. In light of the multifaceted discrimination South Africa has experienced, the government needs to address any source of disparity in the country in general and the labour market in particular.
Extant literature focuses on the drivers of women’s unemployment in general [19,20]. These studies underlined the importance of personal characteristics (such as education and age), family background, socio-economic variables (the number of household earners and household income) and the effect of unemployment benefits in driving women’s unemployment. On the other hand, studies have assessed the determinants of women’s unemployment during crisis periods, such as the COVID-19 crisis. For example, Gezici and Ozay [18] used the April 2020 Current Population Survey (CPS) micro dataset to assess the racialised and gendered effects of the COVID-19 pandemic on the probability of being unemployed in the US. Ref. [21] analysed a representative sample of respondents in the United States, Germany, and Singapore during COVID-19 to assess whether the pandemic had an impact beyond the immediate restructuring of employment and shifts in gender-role attitudes within households. The authors showed that transitions to unemployment, reductions in working hours, and transitions to working from home have been more frequent for women than for men—although not to the same extent across the three countries.
Not only have studies about the effect of COVID-19 on unemployment been undertaken in developed economies, but these studies also failed to uncover to what extent women and men’s personal characteristics contributed to the likelihood of unemployment during the pandemic in countries with high socio-economic inequalities, such as South Africa. Thus, this paper contributes to the literature by firstly assessing how women and men’s personal characteristics affected their likelihood of losing jobs during and before COVID-19 in South Africa, a country with large inequality.
Secondly, the paper assesses whether these personal characteristics of women and men contributed differently to the likelihood of losing jobs during the different levels of restrictions, namely lockdown restrictions. The COVID-19 pandemic led governments to impose different levels of restrictions depending on the magnitude of the pandemic.
The findings of this paper will provide insights to policymakers on how to monitor some socio-economic and personal characteristics of women to mitigate their vulnerability to unemployment during normal and crisis periods. This is relevant in a country with high socio-economic inequality and gender-based injustice that intends to provide sustainable solutions to address these inequalities.
The paper is divided as follows. Section 2 presents the unemployment trend in South Africa. Section 3 discusses the methods used. Section 4 presents data, estimates a model, and discusses the findings of the paper. Section 5 concludes the paper.

2. Unemployment Rates in South Africa

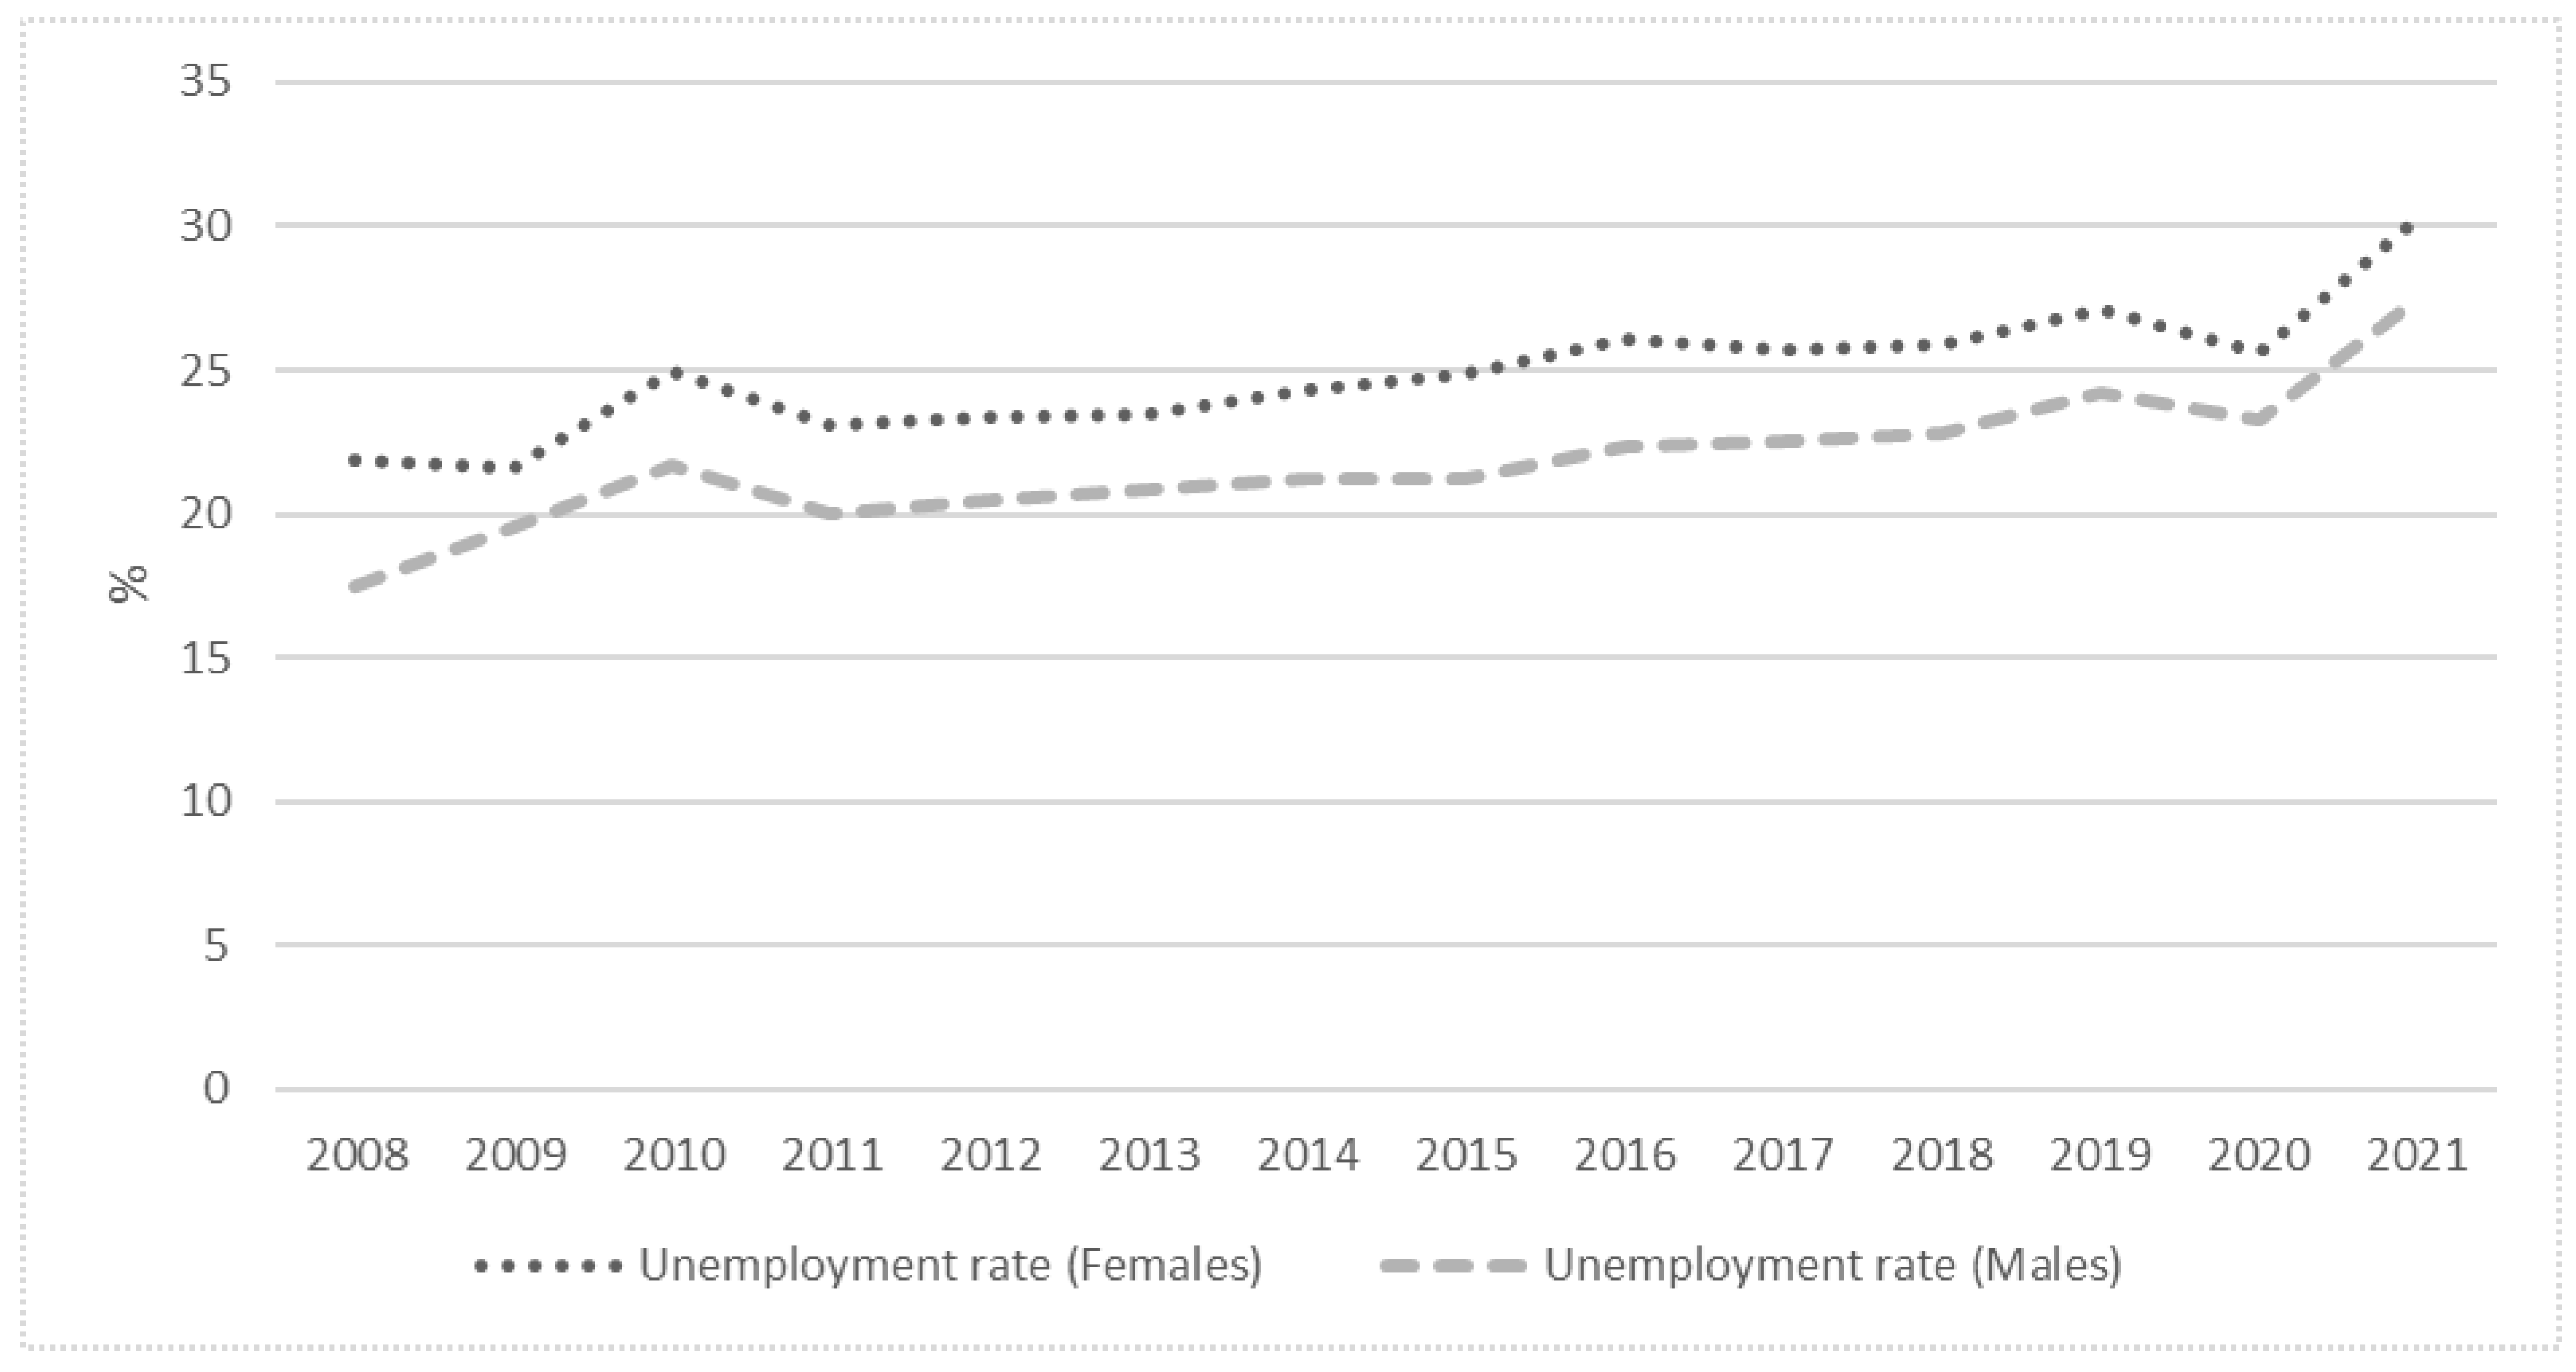
Figure 1 shows the unemployment rate for males and females in South Africa, focusing on how the unemployment rate varied from 2008 to 2021. The female unemployment rate was higher than male unemployment from 2012 to 2022. The labour market still favours males and does not appear to have improved women’s prospects significantly. This is in line with other labour statistics, such as the labour force absorption rate, which was 34% for females compared to 43% for males in 2022 [22]. As a result, women suffer from lower absorption into the labour market. They are prone to entering more vulnerable employment (characterised by inadequate earnings, low productivity, and difficult working conditions) and are at higher risk of job losses during an economic crisis [16].
South Africa has one of the highest unemployment rates in the world, making it a persistent challenge for the economy. Apart from this high unemployment rate, several studies have indicated that women in South Africa face significant challenges entering and remaining in the labour market. Among these barriers are structural factors such as discrimination against women, limited access to education and training, and caregiving responsibilities. For example, Chant et al. [23] found that gender discrimination and patriarchal attitudes contribute to women’s limited labour market opportunities. The study also found that women’s caregiving responsibilities often limit their ability to work. This is particularly true in rural areas with limited access to affordable childcare.
Just as Figure 1 shows an increasing unemployment rate during adverse global conditions such as the global financial crisis in 2008, the same occurred with the COVID-19 pandemic, which has had a significant impact on the labour market in South Africa, exacerbating pre-existing inequalities and leading to an increase in job losses, particularly among women. For example, Gouse et al. [24] found that women were more likely than men to lose their jobs during the pandemic and were also more likely to have reduced working hours or be forced to take unpaid leave. The study attributed this to the fact that women are more likely to work in sectors that have been hit hardest by the pandemic, such as tourism and hospitality. Furthermore, Ranchhod and Daniels [25] demonstrate that rural residents had a greater likelihood of losing their jobs during COVID-19 and that apartheid remains a lingering legacy that leaves Africans among the most unemployed in South Africa, followed by Coloureds, Indians, and Whites.

3. Data and Methods

3.1. Data

This study employed data from the National Income Dynamics Study-Coronavirus Rapid Mobile Survey (NIDS-CRAM) and NIDS wave 5 dataset to assess the role of personal characteristics in shaping gender-biased job losses during COVID-19 and pre-COVID-19 periods in South Africa. It is important to note that NIDS is a survey study that has followed 28,000 South Africans and their families since 2008. In 2020, in light of the global Coronavirus pandemic, a special telephonic follow-up survey was conducted. The survey was conducted with a sub-sample of adults from households interviewed by NIDS in 2017. This survey is called the National Income Dynamics Study-Coronavirus Rapid Mobile Survey (NIDS-CRAM). The database can be accessed at http://www.nids.uct.ac.za/ (accessed on 15 June 2022), and it is divided into different waves, each representing a specific follow-up survey. The NID-CRAM data is ideal for measuring the effect of COVID-19 on unemployment as it covers a question that asks whether respondents were incapable of working due to the pandemic [26] is a nationally representative survey in which researchers interviewed approximately 7000 of the adult NIDS wave 5 sample. Wave 1 of NIDS-CRAM was conducted with 7073 adults 18 years of age and older selected from the NIDS wave 5 sampling frame [27]. The sample was weighted to guarantee the statistical representation of the model to the population [27]. Wave 1 of NIDS-CRAM was carried out between May 2020 and June 2020 during level 5 of lockdown restrictions, the level with the most restrictions. Wave 2 comprised 5676 participants interviewed between 13 July 2020 and 13 August 2020, and this coincided with level 3 lockdown restrictions, which were considered less restrictive. Wave 3 was undertaken between 2 November 2020 and 13 December 2020. During that period, South Africa was in level 1 lockdown restrictions, regarded as the least restrictive of all the lockdown levels. In this wave, 5046 persons were re-interviewed; however, 1084 people were added because of attrition, resulting in an initial sample of 6130. In wave 4, data was recorded between February 2021 and March 2021, with 5629 individuals interviewed. At that time, the country was under a level 3 lockdown. Lastly, wave 5 data was collected between April and May 2021, when South Africa was on an adjusted level 1 lockdown. Information on the timing of the different waves is critical to distinguish the role of personal characteristics in shaping gender-biased job losses during the different levels of lockdown restrictions.

3.2. Selected Variables

The outcome variable is respondents’ employment status in both the NIDS wave 5 and NIDS CRAM datasets. The employment status is derived from various questions in the labour market section of the NIDS survey [28] and includes individuals who were not economically active, discouraged unemployed, strictly unemployed, and employed. We created a dummy variable for the employment status of males and females that either takes the value of 1 if the respondent is unemployed, grouping the strict and discouraged unemployed response, and a value of 0 if the respondent is employed. A similar reconstruction was made of the NIDS wave 5 employment status variable. Both the NIDS and NIDS-CRAM datasets also include individual characteristics such as age, education, race, household size, and number of children, variables that have been observed to be vital in disseminating employment effects related to COVID-19 and pre-COVID-19 [12,14,29,30]. We use age, education, race, and the number of children in the household to measure the impact of personal characteristics on gender-biased unemployment. Education is measured through a dummy variable equalling 1 if the respondent completed some form of tertiary education and 0 if no such education was completed. The number of children was measured based on the number of children in the household. Race was defined as a categorical variable with the options of African, Coloured, Indian/Asian and White.

3.3. Method

Given the binary nature of the dependent variable (losing job or not) we used logistic regression to assess the impact of personal characteristics on gender-biased unemployment in South Africa. Logistic regressions and odds ratios have been a popular technique for unemployment studies where the dependent variable was binary and factors relating to the unemployment status have been assessed [31,32,33,34]. Logistic regression estimates the probability of an event occurring. In the case of our paper, the model will estimate how the personal characteristics of men and women contribute to the probability of losing ones job or not during normal and adverse conditions, before or during COVID-19, respectively. Details on the multivariate logistic models are provided by [35].

3.4. Descriptive Analysis

As a first step in understanding our sample, we provide a set of descriptive statistics. In Table 1, we report the descriptive statistics for each wave of the NIDS CRAM and NIDS wave 5. We report on the percentages of the respondents across gender, race, and educational attainment along with reporting the mean age and number of children.
The descriptive statistics shows that there might be some discrepancy among the number of females, our variable of interest, in each one of the wave samples. However, these differences are mainly small and probably due to the non-response of individuals across waves. Observing the percentage unemployed across waves shows that unemployment increased significantly, from 24.5% in the NIDS wave 5, the pre-COVID-19 period, to 48.05% in the NIDS-CRAM wave 1, the highest lockdown restriction level during the pandemic period.
To fully understand the difference between job loss before and during the pandemic, a detailed assessment is needed of the unemployment ratios among males and females during these varying time periods. Table 2 below shows the percentage of males and females unemployed in the NIDS wave 5 sample and the corresponding NIDS-CRAM waves. The results show interesting patterns. Firstly, across all waves, the number of females unemployed is high relative to male unemployment, a statistical finding consistent with literature that focuses on the pandemic period [25,36]. Secondly, observing female unemployment over time revealed that before the pandemic female unemployment was around 30%, while during the pandemic it averaged around 47%, with wave 1 and 2 reporting the highest level of female unemployment. This assessment points to the possibility that job losses were highest among females at the early stages of the pandemic, while decreasing as the pandemic went on. Thirdly, during the pandemic, female unemployment was higher compared to their male counterparts, and this holds true for both the pre-pandemic and pandemic stages. However, upon close observation, we also estimated a gender unemployment gap, which is simply the difference between female and male rates. We found that the gap between female and male unemployment increased during the COVID-19 pandemic. This confirms females compared to male suffered from greater job losses during the pandemic, a pattern consistently found in other studies [25,36,37].
The results presented in Table 2 prompted a further discussion of the various factors behind the high job loss rate among females before and during a pandemic-level event. As reported in the literature, personal characteristics such as education, age, race, and number of children in the household tend to disproportionately influence female unemployment compared to male unemployment. We applied multivariate logit regression to assess the effects of these personal characteristics on the probability of losing ones job or not. The next section aims to empirically assess the statistical significance of these personal characteristics from this regression and determine the level of influence they had on the job loss of females before and during a pandemic-level event, controlled for by race.

4. Empirical Results

To evaluate the impact of personal characteristics in driving gender-biased job losses during different stages of the COVID-19 crisis, Table 3 reports the results of the multivariate logit panel regressions before the COVID-19 pandemic (NIDS wave 5) and during the COVID-19 pandemic (NIDS-CRAM wave 1 to 5). The results reported in Table 3 show that for both pre-pandemic and pandemic waves, tertiary education characteristic has a negative effect on job losses among females. This result indicates that females who completed some level of tertiary education had a better chance of keeping their jobs compared to those who had not completed any tertiary education. Moreover, the results show that age was a statistically significant negative contributor towards female unemployment. Younger females were more vulnerable to job losses both before and during the pandemic. This finding may be explained by the fact that younger workers often occupy temporary jobs that are often vulnerable to bad economic conditions. Evidence exists that temporary workers are mostly younger and suffer a great deal of retrenchment during economic and financial crises [38]. The unemployment of workers in temporary jobs during a recession is exacerbated in environments where labor legislation and regulation are less stringent in protecting temporary workers [39]. In South Africa, labour market regulation is rigorous in protecting permanent workers from dismissal to the point that many analysts judge it to be rigid and probably to the detriment of employers. The age factor may also reflect the effect of experience in the job market. Most studies show that youth unemployment in South Africa is attributed to a lack of work experience, as many employers require work experience to hire workers [40]. Lastly, the number of children in a household does not significantly influence job losses before the pandemic; however, during the pandemic, the number of children significantly and positively influences job losses for females. This finding may have resulted from an increasing number of discretionary retirements by female employees, mainly due to family responsibilities. Albanesi and Kim showed that the limitation and closure of many childcare and schooling options forced many parents, especially females, to exit the labour market by opting for discretionary retirement. This reality may be more pronounced in a patriarchal society like South Africa, where the parenting nurturing role is often carried by females rather than their male counterparts.
Concerning the effect of personal characteristics on the probability of job loss by female employees during the different levels of lockdown restrictions, the results presented in Table 3 show that personal characteristics were more significant during calm periods compared to the period with the most lockdown restrictions. For example, age characteristics contributed highly to the reduction of job loss by female employees during the calm periods (0.0811) compared to the lockdown period with more restrictions (0.0431). The difference is statistically significant at a 95% confidence level.
The results reported in Table 3 need to be compared to male counterparts to further examine the impact of personal characteristics on job losses for females. Using similar logit regression, we conduct regressions for all the waves of all the personal characteristics separately for males and females. These results are reported in the Appendix A from Table A1, Table A2, Table A3, Table A4, Table A5 and Table A6. These results should provide better insight into the predictive role of personal characteristics furthering the job loss gap between males and females before and during pandemic-level events. The results reported in the Appendix A show that education, age, race and the number of children have similar impacts on the unemployment of both females and males before and during the COVID-19 pandemic. However, it does not report on the degree to which personal characteristics have an impact on job losses for males and females. In order to assess the possible varying impact of personal characteristics on gender unemployment or the likelihood of losing jobs, the odds ratios are used and reported in Table 4 and Table 5.
The results reported in Table 4 and Table 5 indicate how a change in the unit of one explanatory variable is linked to changes in the likelihood of losing employment or jobs during and before the pandemic in relation to the odds of finding employment. The results in Table 4, which report the pre-pandemic results (NIDS wave 5), show that personal characteristics, such as having completed tertiary education and being older, have a stronger influence on reducing the chances of females being unemployed compared to males during pre-pandemic or normal period. The difference is statistically significant.
However, the results related to the pandemic reported in Table 5, NID-CRAM wave 1, show that the contribution of these personal characteristics (tertiary education and age) to reduce unemployment was reduced significantly for females compared to males. The predominant influence of personal characteristics such as education and age on the reduction in the probability of female unemployment, compared to the male counterpart, should reflect the positive contribution of the affirmative action policy introduced by the South African government to correct the labour market discrimination imposed by apartheid. With the redrafting of the South African Constitution following the 1994 general elections, apartheid’s legislated labour market discrimination came to an end. As a result of the government’s efforts, a series of remedial measures were introduced and implemented in the South African economy, particularly in the labour market, in order to correct injustice and discrimination. As a result of these measures, females with tertiary education are less likely to be unemployed than males during normal periods such as the pre-COVID-19 period. However, the paper shows that the negative effect of females with tertiary education on unemployment was reduced during the COVID-19 period, especially during the highest level of lockdown restrictions. As argued above, COVID-19 contributed an additional plight to female workers due to the lockdown restriction that ensued. Many females, especially those with children, were forced to exit the labour market as many childcare facilities closed during the highest level of lockdown restriction. An environment such as South Africa, with a patriarchal culture, amplifies this reality. Compared to other economic and financial crises, the COVID-19 crisis added a burden on female workers due to the lockdown regulation that affected many households’ behaviours.
Overall, we find that the gap between female and male unemployment has increased during the COVID-19 crisis, a pattern consistently found in other studies [25,36,37]. However, personal characteristics such as education and age have declined as contributing factors to gender-biased job losses. Compared to men, adverse economic conditions such as COVID-19 reduce the magnitude of the effect of personal characteristics such as tertiary education in curbing the likelihood of unemployment for women. Policymakers should be aware that raising women’s education alone will not prevent them from becoming unemployed under adverse conditions. Other additional support mechanisms should also be considered. In this paper, we argue that childcare facilities should be restructured to achieve these supports. Exceptionally, during COVID-19, the closure of childcare facilities became an enabler of unemployment for women with small children. From the findings of this paper, we urge the South African government to monitor characteristics that accelerate gender differences and inequalities in the South African labour market. Sustainable policy formulation should be implemented to address any source of gender disparity in the South African labour market in particular.

5. Conclusions

This paper aimed to assess the extent to which personal characteristics of women and men affected their likelihood of losing jobs before and during the COVID-19 period. Concerning the COVID-19 period, the paper distinguished between the different levels of lockdown regulation in assessing the impact of women and men’s personal characteristics on the likelihood of losing jobs. The paper found that, for both pre-pandemic and pandemic waves, tertiary education characteristic had a negative effect on job losses among women and men. Moreover, the number of children in a household did not significantly influence job losses before the pandemic, but did so during the pandemic period, especially for women. This outcome is attributed to the increasing number of females opting for discretionary retirement mainly due to family responsibilities. In fact, the paper showed that the limitation and closure of many childcare and schooling options forced many parents, especially females, to exit the labour market by opting for discretionary retirement.
Furthermore, the paper finds that the negative effect of females with tertiary education on the likelihood of losing jobs was reduced during COVID-19, especially during the highest level of lockdown restrictions. This finding is attributed to the fact that many females were forced to exit the labour market, especially those with children, as many childcare services closed during the highest lockdown restriction. We argue that this finding is particular to the COVID-19 pandemic, which resulted to lockdown regulations, compared to other global crises; the paper alluded that the COVID-19 crisis burdened female workers more compared to male workers due to the lockdown regulations that affected many households’ behaviour. Since unemployment in South Africa bends more towards women, the COVID-19 pandemic has further enlarged gender disparities in the South African labour market.
Understanding the impact of personal characteristics on gender-based job losses during the COVID-19 pandemic is vital for establishing future policies to reduce gender inequalities in the South African labour market. From the findings of this paper, we urge the South African government to monitor characteristics that accelerate gender differences and inequalities in the South African labour market. Sustainable policy formulation should be implemented to address any source of gender disparity in the South African labour market in particular. Addressing structural barriers such as gender discrimination and limited access to education and training, as well as providing affordable childcare and other support services, are crucial steps towards promoting gender equality in the labour market for the South African government. Additionally, the government should ensure that its policies and programs are effectively targeted towards the specific needs of women and address the root causes of their labour market disadvantages. Properly implementing these policies is crucial to avoid persistent labour inequality in the country.
The findings of this paper are important and informative for other countries, especially those with the same labour market structure as South Africa, to monitor personal characteristics in women and men that may be detrimental for gender inequality in the labour market.

Author Contributions

Conceptualization, T.M.; Methodology, F.K.; Investigation, T.M.; Data curation, F.K.; Writing—original draft, L.B.-B. and F.K.; Supervision, L.B.-B. All authors have read and agreed to the published version of the manuscript.

Funding

This research received no external funding.

Institutional Review Board Statement

The NIDS CRAM dataset has received ethical clearance from the University of Cape Town Commerce Ethics Committee (REC 2020/04/017) and reciprocal ethics from Stellenbosch University.

Informed Consent Statement

Informed consent was obtained from all subjects involved in the study.

Data Availability Statement

The datasets generated during and analyzed during the current study are available in the DataFirst repository (https://www.datafirst.uct.ac.za/dataportal/index.php/catalog/817, accessed on 10 January 2023).

Conflicts of Interest

The authors declare no conflict of interest.

Appendix A

Table A1. Logit regression predicting unemployment determinants (NIDS wave 5).
(1)(2)(3)
VariablesFull SampleFemalesMales
Tertiary education−0.487 ***−0.609 ***−0.425 ***
(0.0868)(0.131)(0.146)
Age−0.0635 ***−0.0811 ***−0.0533 ***
(0.00438)(0.00755)(0.00698)
Number of children 0.0646
(0.0602)
Coloured −0.568 ***−0.554 ***−0.585 **
(0.145)(0.207)(0.241)
Indian/Asian−0.515−0.305−0.768
(0.423)(0.669)(0.751)
White −1.573 ***−1.157 *−1.182 **
(0.372)(0.619)(0.525)
Constant1.331 ***2.161 ***0.594 **
(0.154)(0.272)(0.237)
Observations395516031754
Standard errors in parentheses. *** p < 0.01, ** p < 0.05, * p < 0.1.
Table A2. Logit regression predicting unemployment determinants (NIDS CRAM wave 1).
(1)(2)(3)
VariablesFull SampleFemalesMales
Tertiary education−0.534 ***−0.562 ***−0.574 ***
(0.0700)(0.0897)(0.116)
Age−0.0376 ***−0.0431 ***−0.0359 ***
(0.00342)(0.00447)(0.00556)
Number of children0.0727 ***0.0620 ***0.0546 **
(0.0173)(0.0224)(0.0276)
Coloured−0.765 ***−0.863 ***−0.640 ***
(0.120)(0.155)(0.193)
Indian/Asian0.2630.3500.160
(0.316)(0.417)(0.503)
White −0.863 ***−0.755 ***−1.003 ***
(0.194)(0.247)(0.329)
Constant1.403 ***1.850 ***1.070 ***
(0.133)(0.182)(0.204)
Observations404724171630
Standard errors in parentheses. *** p < 0.01, ** p < 0.05.
Table A3. Logit regression predicting unemployment determinants (NIDS CRAM wave 2).
(1)(2)(3)
VariablesFull SampleFemalesMales
Tertiary education−0.581 ***−0.644 ***−0.554 ***
(0.0798)(0.101)(0.134)
Age−0.0443 ***−0.0508 ***−0.0385 ***
(0.00400)(0.00519)(0.00657)
Number of children0.0784 ***0.0833 ***0.0373
(0.0199)(0.0258)(0.0324)
Coloured−0.808 ***−0.825 ***−0.848 ***
(0.143)(0.180)(0.244)
Indian/Asian −0.765 *−0.541−0.963
(0.423)(0.563)(0.658)
White −1.055 ***−0.655 **−2.137 ***
(0.248)(0.293)(0.606)
Constant1.604 ***2.018 ***1.208 ***
(0.155)(0.210)(0.239)
Observations318019481232
Standard errors in parentheses. *** p < 0.01, ** p < 0.05, * p < 0.1.
Table A4. Logit regression predicting unemployment determinants (NIDS CRAM wave 3).
(1)(2)(3)
VariablesFull Sample Females Males
Tertiary education−0.443 ***−0.495 ***−0.476 ***
(0.0719)(0.0912)(0.122)
Age−0.0382 ***−0.0447 ***−0.0382 ***
(0.00346)(0.00451)(0.00583)
Number of children0.111 ***0.0693 *0.0845 *
(0.0276)(0.0365)(0.0440)
Coloured−0.658 ***−0.682 ***−0.725 ***
(0.139)(0.173)(0.247)
Indian/Asian−0.241−0.137−0.632
(0.389)(0.474)(0.783)
White −1.189 ***−0.823 ***−2.243 ***
(0.276)(0.316)(0.727)
Constant1.048 ***1.602 ***0.696 ***
(0.130)(0.179)(0.202)
Observations404023661674
Standard errors in parentheses. *** p < 0.01, * p < 0.1.
Table A5. Logit regression predicting unemployment determinants (NIDS CRAM wave 4).
(1)(2)(3)
VariablesFull SampleFemalesMales
Tertiary education −0.538 ***−0.658 ***−0.477 ***
(0.0779)(0.0985)(0.133)
Age−0.0363 ***−0.0414 ***−0.0381 ***
(0.00381)(0.00496)(0.00640)
Number of children0.111 ***0.0722 *0.0736
(0.0324)(0.0413)(0.0551)
Coloured−0.676 ***−0.746 ***−0.645 **
(0.153)(0.192)(0.263)
Indian/Asian−0.209−0.167−0.266
(0.416)(0.550)(0.676)
White −1.186 ***−1.072 ***−1.394 ***
(0.285)(0.348)(0.532)
Constant1.051 ***1.587 ***0.715 ***
(0.143)(0.196)(0.224)
Observations340920111398
Standard errors in parentheses. *** p < 0.01, ** p < 0.05, * p < 0.1.
Table A6. Logit regression predicting unemployment determinants (NIDS CRAM wave 5).
(1)(2)(3)
VariablesFull SampleFemaleMale
Tertiary education −0.556 ***−0.644 ***−0.564 ***
(0.0771)(0.0975)(0.132)
Age−0.0369 ***−0.0466 ***−0.0328 ***
(0.00388)(0.00505)(0.00650)
Number of children0.145 ***0.0898 **0.139 **
(0.0327)(0.0418)(0.0550)
Coloured−0.729 ***−0.676 ***−0.839 ***
(0.153)(0.195)(0.261)
White −0.0225−0.4550.503
(0.412)(0.613)(0.564)
Indian/Asian−0.802 ***−0.616 *−1.240 **
(0.265)(0.318)(0.532)
Constant0.873 ***1.548 ***0.373 *
(0.144)(0.199)(0.225)
Observations356220771485
Standard errors in parentheses. *** p < 0.01, ** p < 0.05, * p < 0.1.

References

  1. Berniell, I.; Gasparini, L.; Marchionni, M.; Viollaz, M. The role of children and work-from-home in gender labor market asymmetries: Evidence from the COVID-19 pandemic in Latin America. Rev. Econ. Household 2023. [Google Scholar] [CrossRef]
  2. Campos-Vazquez, R.M.; Esquivel, G.; Ghosh, P.; Medina-Cortina, E. Long-lasting effects of a depressed labor market: Evidence from Mexico after the great recession. Labour Econ. 2023, 81, 102332. [Google Scholar] [CrossRef]
  3. García, N.A. Gender Differences in Unemployment Dynamics and Initial Wages over the Business Cycle. J. Labor Res. 2017, 38, 228–260. [Google Scholar] [CrossRef]
  4. Kalleberg, A.L.; VON Wachter, T.M. The U.S. Labor Market during and After the Great Recession: Continuities and Transformations. Russell Sage Found. J. Soc. Sci. RSF 2017, 3, 1–19. [Google Scholar] [CrossRef]
  5. Altonji, J.; Blank, R. Race and gender in the labor market. In Handbook of Labor Economics; Altonji, J., Blank, R., Eds.; Elsevier: Amsterdam, The Netherlands, 1999; Volume 3, Part C. [Google Scholar]
  6. Pilatowka, M.; Witkowka, D. Gender segregation at work over business cycle—Evidence from selected EU countries. Sustainability 2022, 14, 10202. [Google Scholar] [CrossRef]
  7. Rubery, J.; Rafferty, A. Women and recession revisited. Work. Employ. Soc. 2013, 27, 414–432. [Google Scholar] [CrossRef]
  8. Şahin, A.; Tasci, M.; Yan, J. The Unemployment Cost of COVID-19: How High and How Long? Economic Commentary. Fed. Reserve Bank Clevel. 2020, 2020. [Google Scholar] [CrossRef]
  9. Coibion, O.; Gorodnichenko, Y.; Weber, M. Labour Markets during the COVID-19 Crisis: A Preliminary View; NBER Working Papers 27017; National Bureau of Economic Research, Inc.: Cambridge, MA, USA, 2020. [Google Scholar]
  10. Nguyen, T.D.; Gupta, S.; Andersen, M.S.; Bento, A.I.; Simon, K.I.; Wing, C. Impacts of state COVID-19 reopening policy on human mobility and mixing behavior. South. Econ. J. 2021, 88, 458–486. [Google Scholar] [CrossRef]
  11. Witteveen, D. Sociodemographic inequality in exposure to COVID-19-induced economic hardship in the United Kingdom. Res. Soc. Strat. Mobil. 2020, 69, 100551. [Google Scholar] [CrossRef]
  12. Fairlie, R.W.; Couch, K.; Xu, H. The Impacts of COVID-19 on Minority Unemployment: First Evidence from April 2020 CPS Microdata; NBER Working Papers 27246; National Bureau of Economic Research, Inc.: Cambridge, MA, USA, 2020. [Google Scholar]
  13. The Lancet. The plight of essential workers during the COVID-19 pandemic. Lancet 2020, 395, 1587. [Google Scholar] [CrossRef]
  14. Montenovo, L.; Jiang, X.; Lozano-Rojas, F.; Schmutte, I.; Simon, K.; Weinberg, B.A.; Wing, C. Determinants of Disparities in Early COVID-19 Job Losses. Demography 2022, 59, 827–855. [Google Scholar] [CrossRef] [PubMed]
  15. Albanesi, S.; Kim, J. Effects of the COVID-19 Recession on the US Labor Market: Occupation, Family, and Gender. J. Econ. Perspect. 2021, 35, 3–24. Available online: https://www.jstor.org/stable/27041212 (accessed on 9 December 2022). [CrossRef]
  16. Chitiga, M.; Henseler, M.; Mabugu, R.E.; Maisonnave, H. How COVID-19 Pandemic Worsens the Economic Situation of Women in South Africa. Eur. J. Dev. Res. 2022, 34, 1627–1644. [Google Scholar] [CrossRef] [PubMed]
  17. Adams-Prassl, A.; Boneva, T.; Golin, M.; Rauh, C. Inequality in the impact of the coronavirus shock: Evidence from real time surveys. J. Public Econ. 2020, 189, 104245. [Google Scholar] [CrossRef]
  18. Gezici, A.; Ozay, O. An Intersectional Analysis of COVID-19 Unemployment. J. Econ. Race Policy 2020, 3, 270–281. [Google Scholar] [CrossRef]
  19. Gobebo, G.; Mulugeta, W.; Yaekob, T. Determinants of women unemployment: Evidence from Ethiopia (case of Halabatown, SNNPR). Int. J. Dev. Res. 2017, 7, 16630–16639. [Google Scholar]
  20. Lazaro, N.; Molto, M.; Sanchez, R. Unemployment and consumption patterns. Appl. Econ. 2000, 32, 367–379. [Google Scholar] [CrossRef]
  21. Reichelt, M.; Makovi, K.; Sargsyan, A. The impact of COVID-19 on gender inequality in the labor market and gender-role attitudes. Eur. Soc. 2020, 23, S228–S245. [Google Scholar] [CrossRef]
  22. QLFS. Nearly Half of SA Women Are out of the Labour Force in Q2:2022|Statistics South Africa. Available online: https://www.statssa.gov.za/?p=15668 (accessed on 10 January 2023).
  23. Chant, S.; Walker, C.; Sweetman, C. Gender and the Labour Market in South Africa: Recent Trends and Policy Implications; International Labour Office: Geneva, Switzerland, 2013. [Google Scholar]
  24. Gouse, M.; Mhlongo, M.; Smith, J. The impact of COVID-19 on Employment in South Africa: Evidence from the NIDS-CRAM Wave 3 Survey; SALDRU Working Paper No. 281; University of Cape Town: Cape Twon, South Africa, 2021. [Google Scholar]
  25. Ranchhod, V.; Daniels, R.C. Labour Market Dynamics in South Africa at the Onset of the COVID-19 Pandemic. S. Afr. J. Econ. 2021, 89, 44–62. [Google Scholar] [CrossRef]
  26. Nwosu, C.; Kollamparambil, U.; Oyenubi, A. Socio-economic inequalities in ability to work from home during the coronavirus pandemic. Econ. Labour Relat. Rev. 2022, 33, 290–307. [Google Scholar] [CrossRef]
  27. Kerr, A.; Ardington, C.; Burger, R. Sample Design and Weighting in the NIDS-CRAM Survey; Cape Town: SALDRU, UCT. (SALDRU Working Paper No. 267); University of Cape Town: Cape Town, South Africa, 2020. [Google Scholar]
  28. Ingle, K.; Brophy, T.; Daniels, R.C. National Income Dynamics Study—Coronavirus Rapid Mobile Survey (NIDS-CRAM) Panel User Manual; Version 2; Southern Africa Labour and Development Research Unit: Cape Town, South Africa, 2020. [Google Scholar]
  29. Beland, L.P.; Brodeur, A.; Wright, T. COVID-19, Stay-At-Home Orders, and Employment: Evidence from CPS Data; IZA Discussion Paper, No. 13282; University of Bonn: Bonn, Germany, 2020. [Google Scholar]
  30. Borjas, G.J.; Cassidy, H. The Adverse Effect of the COVID-19 Labor Market Shock on Immigrant Employment; NBER Working Papers 27243; National Bureau of Economic Research, Inc.: Cambridge, MA, USA, 2020. [Google Scholar]
  31. van Ham, M.; Mulder, C.H.; Hooimeijer, P. Local Underemployment and the Discouraged Worker Effect. Urban Stud. 2001, 38, 1733–1751. [Google Scholar] [CrossRef]
  32. Van der Welvan der Wel, K.A.; Dahl, E.; Birkelund, G.E. Employment Inequalities Through Busts and Booms: The Changing Roles of Health and Education in Norway 1980–2005. Acta Sociol. 2010, 53, 355–370. [Google Scholar] [CrossRef]
  33. Kiley, M.T. Unemployment Risk. J. Money Credit. Bank. 2021, 54, 1407–1424. [Google Scholar] [CrossRef]
  34. Rycz Ryczkowski, M.; Zinecker, M. Gender Unemployment in the Czech and Polish Labour Market. 2020. Available online: https://www.dbc.wroc.pl/publication/149018 (accessed on 8 April 2023).
  35. Glonek, G.F.V.; McCullagh, P. Multivariate logistic models. J. R. Stat. Soc. Ser. B 1995, 57, 533–546. [Google Scholar] [CrossRef]
  36. Casale, D.; Posel, D. Gender inequality and the COVID-19 crisis: Evidence from a large national survey during South Africa’s lockdown. Res. Soc. Strat. Mobil. 2020, 71, 100569. [Google Scholar] [CrossRef]
  37. Bassier, I.; Budlender, J.; Zizzamia, R.; Leibbrandt, M.; Ranchhod, V. Locked down and locked out: Repurposing social assistance as emergency relief to informal workers. World Dev. 2020, 139, 105271. [Google Scholar] [CrossRef]
  38. Kahn, L.M. The impact of employment protection mandates on demographic temporary employment patterns: International microeconomic evidence. Econ. J. 2007, 117, F333–F356. [Google Scholar] [CrossRef]
  39. Bentolila, S.; Cahuc, P.; Dolado, J.J.; Le Barbanchon, T. Two-tier labour markets in the Great Recession: France versus Spain. Econ. J. 2012, 122, 155–187. [Google Scholar] [CrossRef]
  40. Du Toit, M.; De Witte, H.; Rothmann, S.; Den Broeck, A.V. Unemployment experiences in context: A phenomenological study in two townships in South Africa. J. Od Psychol. Afr. 2018, 28, 122–127. [Google Scholar] [CrossRef]
Figure 1. Unemployment rate (%) by gender (2008–2021). Source: https://data.worldbank.org/indicator (accessed on 10 January 2023).
Sustainability 15 06933 g001
Table 1. Descriptive statistics (mean and percentage).
VariablesNIDS W5NIDS-CRAM W1NIDS-CRAM W2NIDS-CRAM W3NIDS-CRAM W4NIDS-CRAM W5
Gender
Female (%)61.1161.0261.2461.0861.761.65
Male (%)38.8938.9838.7638.9238.338.35
Employment status
Employed (%)75.551.9553.1359.0357.9962.27
Unemployed (%)24.548.0546.8840.9742.0137.73
Education
Tertiary education completed (%)23.5433.833.4633.0934.4535.06
No tertiary education completed (%)76.4666.266.5466.9165.5564.94
Age (mean)37.5540.5840.8540.8141.0941.28
Number of children (mean)1.942.222.270.990.910.9
Race
African (%)85.5185.4986.0687.2686.9886.52
Coloured (%)8.818.848.497.677.828.36
Indian/Asian (%) 1.131.090.880.780.760.78
White (%)4.554.584.564.294.444.33
Notes: Number of children is measured differently in NIDS and NIDS-CRAM surveys; in NIDS, the question used is about the number of biological children living with the adult, while, for the NIDS-CRAM, a question about the number of residents who are under 18 years of age are used for the first two waves of the NIDS-CRAM, and the number of residents who are under 7 years of age was used for waves three to five. Alternatively, we would like to have had the number of children variable consistent throughout the surveys; however, this is not the case, and the assessment has been conducted with these heterogenous measures.
Table 2. Percentage of unemployed females and males (pre-pandemic and pandemic levels).
NIDS W5NIDS CRAM W1NIDS CRAM W2NIDS CRAM W3NIDS CRAM W4NIDS CRAM W5
Male 20.0140.8140.4633.3734.0131.08
female 30.5553.2551.446.247.4842.33
gender unemployment gap10.5412.4410.9412.8313.4711.25
Table 3. Logit regressions predicting the determinants behind job losses among females before and during the pandemic.
(1)(2)(3)(4)(5)(6)
VariablesNIDS W5NIDS-CRAM W1NIDS-CRAM W2NIDS-CRAM W3NIDS-CRAM W4NIDS-CRAM W5
Tertiary education−0.609 ***−0.562 ***−0.644 ***−0.495 ***−0.658 ***−0.644 ***
(0.131)(0.0897)(0.101)(0.0912)(0.0985)(0.0975)
Age−0.0811 ***−0.0431 ***−0.0508 ***−0.0447 ***−0.0414 ***−0.0466 ***
(0.00755)(0.00447)(0.00519)(0.00451)(0.00496)(0.00505)
Number of children0.06460.0620 ***0.0833 ***0.0693 *0.0722 *0.0898 **
(0.0602)(0.0224)(0.0258)(0.0365)(0.0413)(0.0418)
Coloured −0.554 ***−0.863 ***−0.825 ***−0.682 ***−0.746 ***−0.676 ***
(0.207)(0.155)(0.180)(0.173)(0.192)(0.195)
Indian/Asian−0.3050.350−0.541−0.137−0.167−0.455
(0.669)(0.417)(0.563)(0.474)(0.550)(0.613)
White −1.157 *−0.755 ***−0.655 **−0.823 ***−1.072 ***−0.616 *
(0.619)(0.247)(0.293)(0.316)(0.348)(0.318)
Constant2.161 ***1.850 ***2.018 ***1.602 ***1.587 ***1.548 ***
(0.272)(0.182)(0.210)(0.179)(0.196)(0.199)
Observations160324171948236620112077
Standard errors in parentheses. *** p < 0.01, ** p < 0.05, * p < 0.1.
Table 4. Odd ratios (NIDS wave 5).
NIDS Wave 5
VariablesFemales Males
Tertiary education−0.609 ***−0.425 ***
(0.131)(0.146)
Age −0.0811 ***−0.0533 ***
(0.00755)(0.00698)
Number of children0.0646
(0.0602)
Coloured−0.554 ***−0.585 **
(0.207)(0.241)
Indian/Asian−0.305−0.768
(0.669)(0.751)
White −1.157 *−1.182 **
(0.619)(0.525)
Constant2.161 ***0.594 **
(0.272)(0.237)
Observations16031754
Standard errors in parentheses. *** p < 0.01, ** p < 0.05, * p < 0.1.
Table 5. Odd ratios (NIDS-CRAM wave 1).
(1)(2)
VariablesFemales Males
Tertiary education −0.562 ***−0.574 ***
(0.0897)(0.116)
Age−0.0431 ***−0.0359 ***
(0.00447)(0.00556)
Number of children0.0620 ***0.0546 **
(0.0224)(0.0276)
Coloured−0.863 ***−0.640 ***
(0.155)(0.193)
Indian/Asian0.3500.160
(0.417)(0.503)
White −0.755 ***−1.003 ***
(0.247)(0.329)
Constant1.850 ***1.070 ***
(0.182)(0.204)
Observations24171630
Standard errors in parentheses. *** p < 0.01, ** p < 0.05.
Disclaimer/Publisher’s Note: The statements, opinions and data contained in all publications are solely those of the individual author(s) and contributor(s) and not of MDPI and/or the editor(s). MDPI and/or the editor(s) disclaim responsibility for any injury to people or property resulting from any ideas, methods, instructions or products referred to in the content.

